Answer Questions with Right Image Regions: A Visual Attention Regularization Approach
Abstract.
Visual attention in Visual Question Answering (VQA) targets at locating the right image regions regarding the answer prediction, offering a powerful technique to promote multi-modal understanding. However, recent studies have pointed out that the highlighted image regions from the visual attention are often irrelevant to the given question and answer, leading to model confusion for correct visual reasoning. To tackle this problem, existing methods mostly resort to aligning the visual attention weights with human attentions. Nevertheless, gathering such human data is laborious and expensive, making it burdensome to adapt well-developed models across datasets. To address this issue, in this paper, we devise a novel visual attention regularization approach, namely AttReg, for better visual grounding in VQA. Specifically, AttReg firstly identifies the image regions which are essential for question answering yet unexpectedly ignored (i.e., assigned with low attention weights) by the backbone model. And then a mask-guided learning scheme is leveraged to regularize the visual attention to focus more on these ignored key regions. The proposed method is very flexible and model-agnostic, which can be integrated into most visual attention-based VQA models and require no human attention supervision. Extensive experiments over three benchmark datasets, i.e., VQA-CP v2, VQA-CP v1, and VQA v2, have been conducted to evaluate the effectiveness of AttReg. As a by-product, when incorporating AttReg into the strong baseline LMH, our approach can achieve a new state-of-the-art accuracy of 60.00% with an absolute performance gain of 7.01% on the VQA-CP v2 benchmark dataset. In addition to the effectiveness validation, we recognize that the faithfulness of the visual attention in VQA has not been well explored in literature. In the light of this, we propose to empirically validate such property of visual attention and compare it with the prevalent gradient-based approaches.
1. Introduction
With the great progress of natural language processing, computer vision, and multimodal representation learning, Visual Question Answering (VQA) has emerged as a significant interdisciplinary task in recent years. VQA aims to correctly answer natural language questions about an image (Antol et al., 2015; Fang et al., 2019; Yu et al., 2019) or a video (Xu et al., 2017; Yang et al., 2003; Zhao et al., 2017). As an “AI-complete” problem, VQA encounters a variety of research challenges, such as recognition, counting, and multi-modal understanding. Canonical methods often cast VQA as a classification task (Andreas et al., 2016; Guo et al., 2020; Lu et al., 2016; Fukui et al., 2016; Yang et al., 2016; Anderson et al., 2018; Malinowski et al., 2018; Li et al., 2019a; Guo et al., 2019; Guo et al., 2021), where the image and question are processed via Convolutional Neural Networks (CNNs) and Recurrent Neural Networks (RNNs), respectively. Among the existing methods, an intriguing design is to apply the visual attention mechanism to image regions based on the given question, equipping VQA models with the capability of visual grounding and explanation.
Generally speaking, the visual attention in VQA executes an explicit step of identifying “where to look” (Shih et al., 2016; Wu et al., 2017). To be more specific, it allows the model to assign distinctive weights to different image regions, which are computed via the semantic similarity between the given question and image features, as illustrated in Figure 1. Similar to human vision systems, the image regions with high attention weights are commonly deemed as where the model looks at when making predictions. Accordingly, by spotting such relevant image regions, the visual attention is able to not only reduce noisy features but also construct more refined visual representations.
Despite of the fact that existing VQA models have benefited a lot from the visual attention, one imperative issue lies in the lack of guidance for visual grounding. This often leads visual attention mechanisms to focus on image regions which are less relevant to the correct answer (Selvaraju et al., 2019; Das et al., 2016). As shown in Figure 1, the visual attention in the backbone model focuses on the much less important region dog while ignores the most relevant one frisbee, misleading the model to predict the incorrect answer brown. To deal with this issue, a seemingly straightforward solution is to align visual attention weights with explicit human attentions (Qiao et al., 2018; Zhang et al., 2019). Collecting such data is, however, expensive and difficult (Das et al., 2016), thereby limiting the practicality of this kind of approach.
Orthogonal to the visual attention, another prevalent branch for improving visual grounding is resorting to gradient-based techniques (specifically Grad-CAM (Selvaraju et al., 2017)), which allow us to understand model prediction through activation mappings from gradients. For instance, the method in (Selvaraju et al., 2019) calculates the gradient of each image region according to the predicted scores of ground-truth answers, and encourages the rank consistency between the gradients and human attentions for better visual grounding. More recently, Wu and Mooney (Wu and Mooney, 2019) utilized the textual annotations (e.g., QA pairs) as auxiliary information and regularized visual grounding by penalizing the gradients of important regions to wrong answers. However, our experiments reveal that such explanations obtained via Grad-CAM are not trustworthy for visual grounding compared with that of visual attention. One notable problem is that the image regions with large gradients are not positively related to model predictions, which violates the intuition that Grad-CAM is specially designed for visual grounding in VQA (Selvaraju et al., 2019).

To overcome the limitations of previous approaches, in this paper, we present a novel visual attention regularization method, dubbed as AttReg, to guide the learning of visual attention in VQA. As illustrated in Figure 1, AttReg aims to achieve better accuracy via attention weights regularization. Concretely, for each training sample, AttReg first identifies the ignored key regions, i.e., the image regions pivotal to the question answering yet assigned with low attention weights. Then, AttReg constructs a curated image with these ignored key regions being masked, and a new training sample is thereby built by pairing the same question to the curated image. Next and crucially, different from the original training, AttReg forces the model to answer None when given the curated sample since the relevant image regions (i.e., ignored key regions) are masked and invisible under this situation111None can be understood as “I don’t know”. That is, a model’s predicted scores of all candidate answers are zeros.. In this way, the model would be regularized to shift more attention weights to these ignored key regions, hence boosting the answer prediction accuracy. In a nutshell, our end-to-end approach is simple to implement, which requires no human supervision and can be applied to most of the existing visual attention-based VQA models. We conduct extensive experiments on three VQA datasets, i.e., VQA-CP v1 (Agrawal et al., 2018), VQA-CP v2 (Agrawal et al., 2018), and VQA v2 (Goyal et al., 2017), to verify the effectiveness of the proposed method. Experimental results have shown that our proposed method is capable of guiding the visual attention learning, and enhancing the performance of many visual attention-based VQA models.
In addition to the effectiveness validation, we notice that the faithfulness of the visual attention in VQA has not been well explored so far. The faithfulness here refers to the consistency between the attention weight and the contribution of its corresponding image region to model predictions. In particular, weak faithfulness can be obtained if the regions with high attention weights often have little influence on model predictions. To justify such a property, we empirically conduct occlusion studies (Selvaraju et al., 2017) on a well-devised visual attention model – UpDn (Anderson et al., 2018). We found that the learned attention weight is reasonably correlated with the influence of image regions in model prediction, which demonstrates the favorable faithfulness of visual attention.
In summary, the contributions of this work are three-fold:
-
•
We present a novel visual attention regularization approach in VQA, which is able to guide the model towards correctly answering questions based on right image regions. The proposed regularization method is model-agnostic, requiring no human attention supervision, and can be incorporated into most visual attention-based VQA models, such as UpDn and LMH (Clark et al., 2019).
-
•
We empirically study the faithfulness of prevalent visual attention in VQA. The results exhibit that the visual attention is more faithful to model predictions in comparison with Grad-CAM.
-
•
Extensive experiments demonstrate that the proposed method can simultaneously improve the visual grounding accuracy and the backbone model performance. As a side product, by introducing our regularization method to a strong model LMH, we can achieve a new state-of-the-art performance over the VQA-CP v2 dataset. We have released the involved data, codes, and parameter settings to facilitate other researchers in this community222https://github.com/BierOne/VQA-AttReg..
2. Related Work
In this section, we discuss two categories which are closely related to this work: visual attention in VQA and visual grounding enhancement for VQA.
2.1. Visual Attention in VQA
Towards multimodal understanding, visual attention has been widely applied in many applications, such as image captioning (Li et al., 2019b; Zhou et al., 2017), visual dialogue (Fan et al., 2020), and video action recognition (Li et al., 2019c). In VQA, the visual attention is firstly introduced to address the “where to look” problem by directly calculating the semantic similarity between the question and image regions (Shih et al., 2016). To obtain more fine-grained visual representation, (Lu et al., 2016) later applied the hierarchical question structure modeling for image attention. The question representations are learned from multi-levels, e.g., word-level and phrase-level, which are effectively employed to conduct visual attention recursively. In addition, the multi-glimpse visual attention mechanism (Yang et al., 2016) is subsequently proposed to iteratively infer the answer by attending on visual features multiple times. Different from the above top-down visual attention methods, Anderson et al. (Anderson et al., 2018) presented a combined bottom-up and top-down attention mechanism (UpDn), which firstly detects common objects and attributes in an image and then leverages visual attention to attend on these high-level concepts. This technique has been widely adopted and extended in recent studies (Cadene et al., 2019b; Wu and Mooney, 2019; Chen et al., 2020), boosting the performance of a series of VQA models.
However, the above visual attention-based models are all restricted by the lack of guidance for visual grounding (Das et al., 2016; Selvaraju et al., 2019). It is thus normal that these VQA models are inclined to focus on irrelevant visual contents or even resort to superficial biases to answer questions (Ramakrishnan et al., 2018; Selvaraju et al., 2019; Chen et al., 2020). To address this problem, in this work, we present a novel regularization strategy to guide the attention learning and boost the answer prediction accuracy.
2.2. Visual Grounding Enhancement for VQA
One of the most desired properties for VQA systems is to equip correct visual grounding for model predictions, i.e., right for right reasons (Ross et al., 2017; Wu and Mooney, 2019). Existing approaches for this purpose are mainly based on two powerful techniques: 1) visual attention; and 2) Grad-CAM. The methods based on visual attention (Qiao et al., 2018; Zhang et al., 2019) target at aligning the attention weights with explicit human attentions. Nevertheless, since the human attention data are far too expensive and difficult to collect, the practicability and generalization of such methods are largely limited.
In contrast, Grad-CAM ones encourage the consistency between human annotations and region gradients derived from model predictions. For example, Selvaraju et al. (Selvaraju et al., 2019) presented a human importance-aware network tuning (HINT) to enforce the region’s gradient to share the same ranking with human attentions. SCR (Wu and Mooney, 2019) leverages the textual annotations (e.g., QA pairs) to relate with the influential regions in images first, and then criticizes the sensitivity of incorrect answers to these influential regions. More recently, Chen et al. (Chen et al., 2020) designed a Counterfactual Samples Synthesizing (CSS) scheme, which guides visual grounding by forcing important regions to obtain high gradients from correct answers. Different from the above ones, Patro et al. (Patro et al., 2020) devised an adversarial learning strategy, which utilizes the Grad-CAM results as the surrogate supervision for attention maps. However, our experiments demonstrate that the regions highlighted by Grad-CAM are not always where the model focuses on when making predictions, which limits its visual grounding capability to some extent. In addition, Shrestha et al. (2020) pointed out that the improvement brought by these methods does not actually emerge from proper visual grounding, but from regularization effects. Teney et al. (2020) further extended this finding with detailed analysis on in-domain and out-of-distribution (OOD) sets.
3. Approach
Our approach aims at regularizing VQA models to predict the right answers based on the right image regions. In the following, we first state the basic knowledge of VQA and its visual attention variant in Section 3.1. The details of the proposed method are then elaborated in Section 3.2.
3.1. Preliminaries
Problem Formulation. The goal of VQA is to provide a correct answer to a given textual question upon an image . And the common function of VQA is formulated as a classification problem:
| (1) |
where denotes the candidate answer set and denotes all the model parameters. Note that in an open-ended VQA task, there can be multiple correct answers for each instance. Hence, we formulate the VQA task as a multi-label classification problem in this paper.
Visual Attention in VQA (VAtt). Traditional visual attention mechanisms (Zhu et al., 2016; Liang et al., 2019; Yang et al., 2016; Lu et al., 2016) in VQA often perform on the equal-sized image regions. The complementary bottom-up attention mechanism is therefore proposed to detect objects and attributes in images for identifying high-level concepts (Anderson et al., 2018). In this paper, we mainly recap the bottom-up and top-down (UpDn) attention model.
As illustrated in Algorithm 1, for each image , the UpDn model utilizes the object detection techniques (e.g., Faster R-CNN (Ren et al., 2015; Li et al., 2018)) to extract a object feature set . And for each question , an RNN (e.g., GRU (Cho et al., 2014)) is used to capture the sequential features represented by , i.e. . The visual attention mechanism is then utilized to refine visual representations by employing the question feature to attend on each object in the image,
| (2) |
| (3) |
| (4) |
where and respectively denote the attention weights and the computed scores for image objects, is a trainable parameter vector, denotes the fusion function, and is the final visual representation. The weighted visual feature and the question feature are then fed into the answer prediction module to predict the confidence for all candidate answers,
| (5) |
In fact, each question may have several correct answers due to the differentiation in human annotators. Hence, the model prediction is supervised by a set of soft values , where denotes the occurrence probability of the candidate answer based on the human labeled answers. Specifically, UpDn adopts the binary-cross-entropy loss to optimize the model parameters,
| (6) |
where the indices and refer to the training questions and candidate answers, respectively.
3.2. Visual Attention Regularization (AttReg)
Existing VQA models often make mistakes due to the inappropriate visual grounding. To tackle this issue, in this work, we regularize the visual attention for better model performance. As shown in Figure 2, given a training sample , we first identify the ignored key objects and construct a new curated image with these objects being masked. Then we append a complementary sample to regularize the model for better attention learning. Overall, our method could be regarded as a data augmentation technique, which guides the model learning by synthesizing the curated training samples. The following will sequentially introduce two procedures of AttReg.
1. Curated-Image Construction The module of curated-image construction consists of three main steps: (i) identifying key objects related to the QA pair, represented as ; (ii) locating ignored objects through visual attention, represented as ; (iii) masking the ignored key objects (i.e., ) and constructing a new curated image .
Particularly, we firstly take the QA pair as the auxiliary information to determine the importance of each object in the image. Following (Wu and Mooney, 2019), we assign POS tags to each word in the QA using the spaCy POS tagger (Honnibal et al., 2020) and extract nouns in the QA. Thereafter, we calculate the cosine similarity between the GloVe (Pennington et al., 2014) embedding of object categories and the extracted nouns.333Object categories are the outputs from the used faster-RCNN network, which can extract object features and predict its category simultaneously. And then, we select top- objects whose similarity scores are greater than threshold as key objects . We consider these objects as essential since they are highly related to the QA. Note that directly leveraging these extracted key objects as the supervision is sub-optimal as studied in prior work (Selvaraju et al., 2019). The dominant reason is that the presence of superficial linguistic correlations (i.e., language biases (Goyal et al., 2017; Zhang et al., 2016)) can easily mislead the model to ignore visual content even under a strong supervision (Selvaraju et al., 2019). In the light of this, we instead apply these key objects to compose a new training sample, which can help the model build correlation between the right visual information and the ground-truth answer. The superficial bias can also be alleviated to some extent.
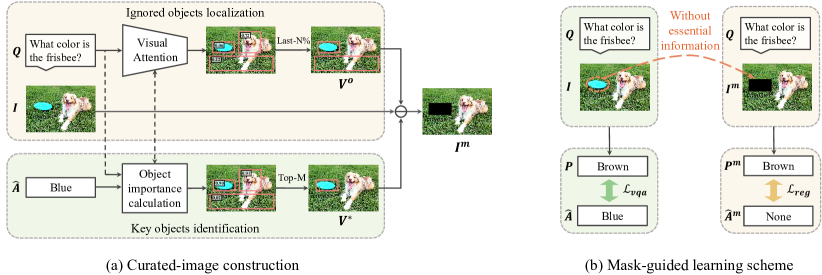
Secondly, we take the attention weights as the evaluation standard for examining the influence of each object in model prediction. Specifically, to avoid trivial procedures, we directly select image objects with attention weight rank in the last-% as the ignored objects . The main idea is that remaining merely a few image objects with the highest attention weights can achieve very competitive performance (e.g., a minor drop of -0.55% if only remaining top-20%), which implies that most objects ranked lower hardly impose an effect on model predictions; as a result, we can deem such objects as ignored by the model.
Lastly, we use the intersection of and as the ignored key objects and mask them in the original image to construct a new curated image . It should be mentioned that the above preprocessing steps are consistent with existing studies (Anderson et al., 2018; Chen et al., 2020; Wu and Mooney, 2019; Liang et al., 2020; Jing et al., 2020; Cadene et al., 2019b; Zhu et al., 2020; Teney et al., 2020; Shrestha et al., 2020; Clark et al., 2019; Liu et al., 2019; Ramakrishnan et al., 2018; Guo et al., 2021), e.g., employing the same faster-RCNN features and POS Tagger. Thus, while inevitable limitations might exist, we choose to neglect them following prior works for a fair comparison.
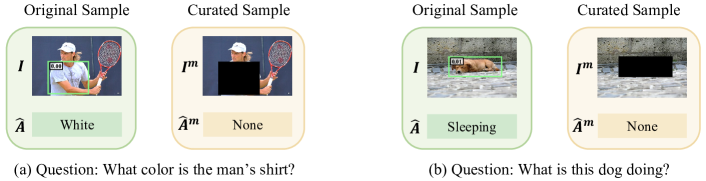
2. Mask-guided Learning Scheme Based on the curated image , we then design a mask-guided learning scheme to regularize the model, which emphasizes more on the ignored key objects towards question answering. We argue that a VQA model cannot correctly answer the question if it is blind to the key objects from the given image. In a sense, the curated image lacks essential visual information in correctly answering the question because the key objects are masked. We hence simply zero-out all ground-truth answers in for and compose a new training sample , i.e., is (more examples can be found in Figure 3). In this way, when the training image loses the ignored key objects, the model would be trained towards a different target; thereby AttReg can constrain such ignored objects to yield stronger influence in model prediction. More importantly, this influence can be seamlessly transferred to the attention weights learning because of their positive correlations (Figure 7 (b)).
On the other hand, by training the model with and simultaneously, the existence of the masked visual information (i.e., ignored key objects) would be strengthened as a necessary condition for predicting the correct answers, as illustrated in Figure 2 (b). Hence, the strong correlation between the ignored key objects and the ground-truth answers can be built under this situation. We summarize this method in Algorithm 2.
Overall, we optimize the parameters in our model by simultaneously training with the original and curated samples,
| (7) |
where and respectively denote the original sample training loss and curated sample training loss, and is a hyper-parameter to control the regularization strength. In the training phase, the generation of a curated sample is determined by the number of ignored key objects. Specifically, if the number of the ignored key objects is 1, one sample will be curated for model learning, otherwise not. In the testing phase, the regularization module is no longer activated and only the backbone model remains.
4. Experiments
4.1. Datasets and Experimental Settings
Datasets. We evaluated the proposed AttReg mainly on the diagnostic VQA-CP datasets (Agrawal et al., 2018), wherein the answer distributions for each question category in the training and testing sets are significantly different. As such, most VQA models that lack visual grounding ability and rely on superficial correlations between questions and answers (i.e., language biases) would perform poorly on this dataset. The experimental results on the VQA v2 (Goyal et al., 2017) are also reported for completeness.
Evaluation Metrics. We adopted the standard VQA accuracy metric (Antol et al., 2015) to evaluate the model performance, which is defined as,
| (8) |
Note that each question is answered by ten annotators, and ACC considers the disagreement among human answers.
Implementation and Training Details. We implemented our method following the preprocessing steps of the widely adopted UpDn (Anderson et al., 2018) as well as the LMH (Clark et al., 2019) for a fair comparison. Specifically, for each image, the UpDn utilizes Faster-RCNN to generate 36 object proposals as the visual features, i.e., a 2,048-d vector for each object. All the questions are converted to lower case and trimmed to a maximum of 14 words. And the questions with less than 14 words are padded with zeros. The pre-trained GloVe vectors are used to initialize the word embedding matrix, i.e., a 300-d vector for each word. And then a single-layer GRU is employed to obtain sentence-level question encoding of 512-d.
We first pretrained the backbone model on the training splits using the plain VQA loss . We then regularized the visual attention for the backbone model by fine-tuning with in Eqn. (7). For UpDn and LMH, the learning rate is set to 2e-3 during pre-training, and reduced to 2e-5 and 2e-4 when fine-tuning, respectively. In addition, the of AttReg is set to 1.0 and 0.5 for the UpDn and LMH, respectively. And for the ignored objects, the proportion of % is tuned between 10% and 40%. The number of the key objects is tuned between 1 and 6.
| Method | Expl. | Att. | Grad. | VQA-CP v2 test | VQA v2 val | Mean | ||||||
|---|---|---|---|---|---|---|---|---|---|---|---|---|
| All | Yes/No | Number | Other | All | Yes/No | Number | Other | All | ||||
| SAN (2016) (Yang et al., 2016) | 24.96 | 38.35 | 11.14 | 21.74 | 52.41 | 70.06 | 39.28 | 47.84 | 38.69 | |||
| NMN (2016) (Andreas et al., 2016) | 27.47 | 38.94 | 11.92 | 25.72 | 51.62 | 73.38 | 33.23 | 39.93 | 39.55 | |||
| HAN (2018) (Malinowski et al., 2018) | 28.65 | 52.25 | 13.79 | 20.33 | - | - | - | - | - | |||
| GVQA (2018) (Agrawal et al., 2018) | 31.30 | 57.99 | 13.68 | 22.14 | 48.24 | 72.03 | 31.17 | 34.65 | 39.77 | |||
| MCB (2016) (Fukui et al., 2016) | 36.33 | 41.01 | 11.96 | 40.57 | 59.71 | 77.91 | 37.47 | 51.76 | 48.02 | |||
| MuRel (2019) (Cadene et al., 2019a) | 39.54 | 42.85 | 13.17 | 45.04 | - | - | - | - | - | |||
| AdvReg (2018) (Ramakrishnan et al., 2018) | 41.17 | 65.49 | 15.48 | 35.48 | 62.75 | 79.84 | 42.35 | 55.16 | 51.96 | |||
| RUBi (2019) (Cadene et al., 2019b) | 47.11 | 68.65 | 20.28 | 43.18 | 61.16 | - | - | - | 54.14 | |||
| EraseAtt (2019) (Liu et al., 2019) | 37.43 | 41.98 | 13.00 | 41.74 | 65.99 | - | - | - | 51.71 | |||
| DecompLR (2020) (Jing et al., 2020) | 48.87 | 70.99 | 18.72 | 45.57 | 57.96 | 76.82 | 39.33 | 48.54 | 53.42 | |||
| SimpleReg (2020) (Shrestha et al., 2020) | 48.90 | - | - | - | 62.60 | - | - | - | 55.75 | |||
| RMFE (2020) (Gat et al., 2020) | 54.55 | 74.03 | 49.16 | 45.82 | - | - | - | - | - | |||
| RandImg (2020) (Teney et al., 2020) | 55.37 | 83.89 | 41.60 | 44.20 | 57.24 | 76.53 | 33.87 | 48.57 | 56.31 | |||
| SelfSup (2020) (Zhu et al., 2020) | 57.59 | 86.53 | 29.87 | 50.03 | 63.73 | - | - | - | 59.55 | |||
| CL (2020) (Liang et al., 2020) | 59.18 | 86.99 | 49.89 | 47.16 | 57.29 | 67.27 | 38.40 | 54.71 | 58.24 | |||
| UpDn (2018) (Anderson et al., 2018) | 39.74 | 42.27 | 11.93 | 46.05 | 63.48 | 81.18 | 42.14 | 55.66 | 51.61 | |||
| UpDn† (2018) (Anderson et al., 2018) | 40.09 | 42.16 | 12.36 | 46.61 | 63.77 | 81.54 | 43.64 | 55.59 | 51.93 | |||
| UpDn-SCR (2019) (Wu and Mooney, 2019) | QA | ✓ | 48.47 | 70.41 | 10.42 | 47.29 | 62.30 | 77.40 | 40.90 | 56.50 | 55.39 | |
| UpDn-HINT (2019) (Selvaraju et al., 2019) | HAT | ✓ | 46.73 | 67.27 | 10.61 | 45.88 | 63.38 | 81.18 | 42.99 | 55.56 | 55.06 | |
| UpDn-AttAlign (2019) (Selvaraju et al., 2019) | HAT | ✓ | 39.37 | 43.02 | 11.89 | 45.00 | 63.24 | 80.99 | 42.55 | 55.22 | 51.31 | |
| UpDn-CSS (2020) (Chen et al., 2020) | QA | ✓ | 41.16 | 43.96 | 12.78 | 47.48 | - | - | - | - | - | |
| UpDn-AttReg (Ours) | QA | ✓ | 46.75 | 66.23 | 11.94 | 46.09 | 64.13 | 81.72 | 43.77 | 56.13 | 55.44 | |
| LMH (2019) (Clark et al., 2019) | 52.45 | 69.81 | 44.46 | 45.54 | 61.64 | 77.85 | 40.03 | 55.04 | 57.05 | |||
| LMH† (2019) (Clark et al., 2019) | 52.99 | 72.02 | 39.24 | 46.79 | 62.40 | 79.42 | 41.48 | 54.99 | 57.70 | |||
| LMH-SCR (2019) (Wu and Mooney, 2019) | QA | ✓ | 52.31 | 73.43 | 36.75 | 45.51 | - | - | - | - | - | |
| LMH-HINT (2019) (Selvaraju et al., 2019) | HAT | ✓ | 52.58 | 74.41 | 36.78 | 45.48 | - | - | - | - | - | |
| LMH-CSS (2020) (Chen et al., 2020) | QA | ✓ | 58.95 | 84.37 | 49.42 | 48.21 | 59.91 | 73.25 | 39.77 | 55.11 | 59.43 | |
| LMH-AttReg (Ours) | QA | ✓ | 60.00 | 86.80 | 51.63 | 48.25 | 62.74 | 79.71 | 41.68 | 55.42 | 61.37 | |
4.2. Comparisons with State-of-the-Arts
Performance on VQA-CP v2 and VQA v2. Table 1 exhibits the results of our method and the SOTA VQA models on VQA-CP v2 and VQA v2. The test results of our method on VQA v2 are illustrated in Table 2. The main observations are as follows.
Firstly, our LMH-AttReg achieves a new state-of-the-art of 60.00% ACC on the VQA-CP v2 dataset. Specifically, the LMH-AttReg performs better than the existing best approach CL over all three answer categories. In addition, our LMH-AttReg also achieves the highest mean score over the two datasets among the existing state-of-the-arts, i.e., LMH-AttReg vs. SelfSup (61.37% vs. 59.55%)
Secondly, our AttReg dramatically improves the backbone model performance on the VQA-CP v2 dataset. By incorporating AttReg into UpDn, a large improvement is achieved (i.e., +6.66%). And LMH-AttReg also yields a large gain (i.e., +7.01%) over its backbone LMH, which highlights the effectiveness and the generalization capability of AttReg.
| Method | All | Yes/No | Number | Other |
|---|---|---|---|---|
| UpDn† | 64.90 | 81.82 | 42.73 | 55.51 |
| UpDn-AttReg (Ours) | 65.25 | 82.18 | 43.68 | 55.71 |
| LMH† | 63.31 | 78.15 | 41.08 | 55.48 |
| LMH-AttReg (Ours) | 63.43 | 78.28 | 40.7 | 55.72 |
| Method | All | Yes/No | Number | Other |
|---|---|---|---|---|
| SAN (Yang et al., 2016) | 26.88 | 35.34 | 11.34 | 24.70 |
| NMN (Andreas et al., 2016) | 29.64 | 38.85 | 11.23 | 27.88 |
| GVQA (Agrawal et al., 2018) | 39.23 | 64.72 | 11.87 | 24.86 |
| MCB (Fukui et al., 2016) | 34.39 | 37.96 | 11.80 | 39.90 |
| AdvReg (Ramakrishnan et al., 2018) | 43.43 | 74.16 | 12.44 | 25.32 |
| RUBi (Cadene et al., 2019b) | 50.90 | 80.83 | 13.84 | 36.02 |
| CL (Liang et al., 2020) | 61.27 | 88.14 | 34.43 | 45.34 |
| UpDn† (Anderson et al., 2018) | 38.88 | 42.48 | 13.12 | 45.66 |
| LMH† (Clark et al., 2019) | 55.73 | 78.59 | 24.68 | 45.47 |
| LMH-CSS (Chen et al., 2020) | 60.95 | 85.60 | 40.57 | 44.62 |
| UpDn-AttReg (Ours) | 47.66 | 66.17 | 12.11 | 43.54 |
| LMH-AttReg (Ours) | 62.25 | 88.29 | 35.30 | 47.18 |
Thirdly, our AttReg can enhance the backbone model performance on the VQA v2 dataset over all answer categories. In contrast, most approaches that perform well on VQA-CP v2 suffer performance drop over this dataset. For example, introducing SCR (Wu and Mooney, 2019) into UpDn leads to a significant improvement of +8.65% on VQA-CP v2; whereas the 1.47% performance drop can be observed when SCR works on VQA v2. By comparison, AttReg can enhance UpDn on both VQA-CP v2 (+6.66%) and VQA v2 (+0.36%), which further reveals the robustness of AttReg.
Fourthly, we compared our AttReg with a straightforward visual attention regularization method – AttAlign (Selvaraju et al., 2019), which directly aligns visual attention with human attentions. The result demonstrates that our AttReg outperforms AttAlign with a large margin on the two datasets, especially on VQA-CP v2 (46.75% vs. 39.37%). This proves the effectiveness and superiority of our method among the visual attention regularization ones.
Lastly, we compared our AttReg with the existing gradient-based regularization methods. It can be found that while these gradient-based methods enhance model performance significantly on VQA-CP v2, they usually deteriorate the backbone model performance on VQA v2. Instead, our AttReg is able to not only improve the model performance on the two datasets, but also achieve the highest mean score over the two datasets among the existing grounding enhancement approaches, i.e., LMH-AttReg vs. LMH-CSS (61.37% vs. 59.43%) and UpDn-AttReg vs. UpDn-SCR (55.44% vs. 55.39%). Furthermore, when incorporating SCR and HINT into the LMH backbone, the model performance even exhibits a decrease (similar experimental results can be found in (Chen et al., 2020)). In contrast, our AttReg performs well on both backbones.
Performance on VQA-CP v1. Table 3 shows the results of our method and the SOTA VQA models on the VQA-CP v1 dataset. From the results, we can observe that our LMH-AttReg achieves a new state-of-the-art performance on VQA-CP v1. In addition, our AttReg significantly improves the backbone performance on VQA-CP v1, i.e., +6.52% on LMH and +8.78% on UpDn.
| Method | VQA-CP v2 val (in-domain) | VQA-CP v2 test (OOD) | Mean | ||||||
|---|---|---|---|---|---|---|---|---|---|
| All | Yes/No | Number | Other | All | Yes/No | Number | Other | Other | |
| Random-predictions | 37.62 | 70.10 | 32.79 | 10.55 | 10.44 | 25.87 | 9.27 | 2.57 | 6.56 |
| Random-predictions-inverted | 24.35 | 55.36 | 11.12 | 0.00 | 31.81 | 83.25 | 49.30 | 0.02 | 0.01 |
| UpDn† | 67.91 | 83.82 | 49.86 | 57.97 | 39.83 | 43.2 | 12.36 | 45.61 | 51.79 |
| UpDn-TopAnsMasked | 30.96 | 44.12 | 25.00 | 20.85 | 40.61 | 82.44 | 27.63 | 22.26 | 21.56 |
| UpDn-RandImg | 54.24 | 64.22 | 34.40 | 50.46 | 55.37 | 83.89 | 41.60 | 44.20 | 47.33 |
| UpDn-SCR | 67.09 | 82.57 | 48.33 | 57.73 | 42.76 | 53.02 | 12.24 | 45.77 | 51.75 |
| UpDn-HINT | 67.2 | 82.86 | 46.13 | 58.27 | 42.5 | 51.43 | 11.76 | 46.25 | 52.26 |
| UpDn-AttReg (Ours) | 68.23 | 84.49 | 49.87 | 58.28 | 41.12 | 45.01 | 12.91 | 46.82 | 52.55 |
4.3. In-Domain and Out-of-Domain Testing
Settings. Following (Teney et al., 2020), we randomly held out 8,000 instances from the VQA-CP v2 train set to measure the in-domain performance (which we will refer to as “val” set), and we utilized the VQA-CP v2 test set to measure the out-of-domain (OOD) performance. In addition, as reported in (Shrestha et al., 2020; Teney et al., 2020), by exploiting the difference in the answer distribution, many ordinary baselines could achieve very high performance on the VQA-CP v2 test set, especially on the “Yes/No” and “Number” answer categories. Thus, we further added these baselines in the following and compared them with our AttReg on both the in-domain and OOD sets.
Random-predictions. It samples answers at random according to the distribution of answers observed per individual question type in the training set.
Random-predictions-inverted. This method exploits the knowledge that the distribution over the test data is approximately proportional to the inverse of the distribution over the training data.
TopAnsMasked. It assigns, at test time, the lowest possible score to the answer of highest predicted score.
RandImg. This method augments the training data with a copy of the same question paired with random image features : . Moreover, in the training phase, it encourages the score of the correct answer to be low if the given image is .
Comparison with Ordinary Baselines. Table 4 exhibits the performance of our methods and the baselines across the in-domain and OOD sets. From the results, we could observe that 1) our UpDn-AttReg achieves the best mean score (on the “Other” category) over the two datasets among four ordinary baselines, e.g., UpDn-AttReg (52.55%) vs. RandImg (47.33%); 2) RandImg and TopAnsMasked demonstrate great improvements over the “Yes/No” and “Number” categories on the OOD. However, their in-domain performance drops a lot on the same categories, which is exactly a clue that their obtained improvements are achieved by exploiting the difference in answer distributions. In contrast, our AttReg is hardly affected by this issue, and improves model performance over all answer categories on two datasets.
Comparison with SCR and HINT. To further validate the effectiveness of AttReg, we compared its performance with SCR and HINT on the in-domain and OOD datasets (see Table 4). It can be found that, while the SCR and HINT improve model performance on the OOD set, their accuracy on the in-domain set exhibits a decrease compared with the baseline UpDn. Contrary to that, our AttReg improves model performance on both sets, and achieves the highest mean score on the “Other” category, demonstrating advantages of AttReg over these two methods.
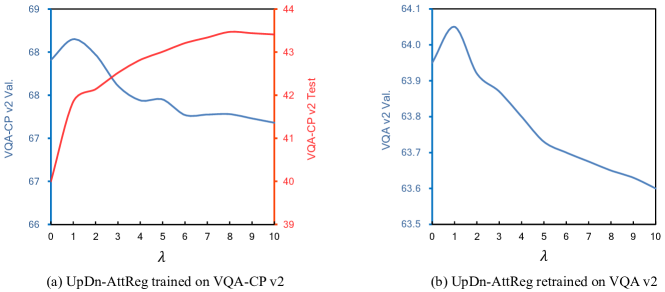
Retraining Results. As suggested in (Teney et al., 2020), the regularization weight tunes the trade-off between in-domain and OOD performance. As such, to further study the function of , we plotted the performance of UpDn-AttReg in Figure 4. It can be observed that 1) in most cases on the VQA-CP v2 dataset, a higher can help improve the model performance on the OOD test set, and simultaneously the in-domain set performance drops; 2) when adopting an appropriate (e.g., =1 for UpDn-AttReg), AttReg improves model performance on the all sets, i.e., in-domain and OOD sets in VQA-CP v2, and VQA v2.
4.4. Ablative Studies
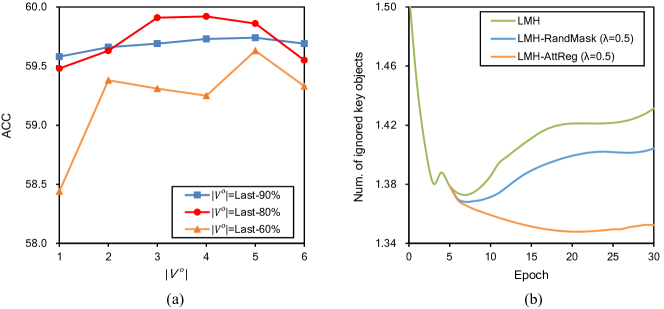
The Size of Key Objects . To evaluate the influence of , we varied it from 1 to 6 to train our model with different settings on the VQA-CP v2 dataset and reported the results in Figure 5 (a). It can be observed that the model accuracy obtains enhancement with a larger size of but deteriorates at some points, e.g., . The reason is that the image often contains certain number of key objects, and therefore the performance is promoted when more key objects are considered. Nonetheless, the objects with lower similarities with QA pairs can also be included when is too large. This would introduce noise into the identified key objects and deteriorate AttReg’s effect.
The Size of Deemed Ignored Objects . As aforementioned, we took the objects with attention weights in the last-% as the ignored objects . Thus, we quantify different values to examine the effects of , and the results are illustrated in Figure 5 (a). It can be found that our AttReg performs better when includes more objects with low weights, e.g., last-90%. This is because a majority of low-rank objects are less influential and should be deemed as ignored objects. As such, when is larger, the missed ignored objects in the locating process would be fewer and our AttReg can work better under this situation.
| Method | All | Yes/No | Number | Other |
|---|---|---|---|---|
| Updn | 40.09 | 42.16 | 12.36 | 46.61 |
| UpDn-AttReg (w/o finetuning) | 40.31 | 42.35 | 12.82 | 46.78 |
| UpDn-AttReg (finetuning) | 46.85 | 69.34 | 12.44 | 44.51 |
| LMH | 52.99 | 72.02 | 39.24 | 46.79 |
| LMH-AttReg (w/o finetuning) | 57.85 | 83.42 | 50.47 | 46.47 |
| LMH-AttReg (finetuning) | 59.92 | 87.28 | 52.39 | 47.65 |
| Ratio | All | Yes/No | Number | Other | ||
|---|---|---|---|---|---|---|
| UpDn-AttReg | 0.6 | 80% | 46.85 | 69.34 | 12.44 | 44.51 |
| 0.8 | 70% | 45.05 | 64.95 | 11.94 | 43.70 | |
| 1.0 | 20% | 44.01 | 59.37 | 12.31 | 44.66 | |
| LMH-AttReg | 0.6 | 80% | 59.92 | 87.28 | 52.39 | 47.65 |
| 0.8 | 70% | 58.41 | 83.65 | 50.64 | 47.33 | |
| 1.0 | 20% | 54.41 | 77.66 | 37.26 | 46.88 |
The Training Strategy. For a further analysis of AttReg, we compared the effect of AttReg when using different training strategies, and the results are reported in Table 6. It can be found that the AttReg performs best when using a finetuning way. The reason to this is that at the beginning of training, the visual attention module has not been trained favorably. As a result, it may introduce noises for the model learning if we apply our AttReg too early.
The Threshold . Table 6 presents the performance of AttReg when using different threshold to filter key objects. The results show that AttReg achieves better performance as becomes lower. This is because when the filtering condition is relatively looser, the objects whose category are more roughly related to the QA pair can be remained, e.g., computer (object category) and laptop (noun in QA). Meanwhile, in this situation, AttReg can utilize more samples to regularize the model.
4.5. Effectiveness in Improving Visual Attention
Quantitative Evaluation. Figure 5 (b) shows how the number of ignored key objects changes regarding the increase of training steps. It can be seen that the number of ignored key objects assigned by the visual attention in the baseline LMH continuously increases with more training iterations after epoch 5. In contrast, this number is decreasing when the visual attention is guided by our AttReg, which demonstrates the effectiveness of AttReg in regularizing the visual attention to focus more on the ignored key objects. In addition, we further introduced a new baseline (i.e., RandMask) for comparison, which can be regarded as a variant of our AttReg. That is, RandMask directly composes new samples by randomly masking images, while AttReg follows the human-based visual clues. As shown in Figure 5 (b), we can observe that the number of ignored key objects continuously increases when RandMask is employed, yielding the same trend as the baseline LMH but the opposite trend as our AttReg. This result further highlights the superiority of our AttReg to the simple regularization, i.e., the capability of guiding model attention.
To more intuitively understand the improvement of visual attention, we conducted ablation studies and calculated the performance gap for the backbone model with or without the visual attention module. As shown in Table 7, we can observe that the performance gap becomes larger if the visual attention is regularized by our AttReg, showing that the visual attention module plays a more pivotal role in model performance enhancement.
| Method | VQA-CP v2 | VQA v2 | |||
|---|---|---|---|---|---|
| All | Gap | All | Gap | ||
| UpDn | Baseline | 40.09 | - | 63.77 | - |
| w/o VAtt | 29.62 | 10.47 | 51.87 | 11.9 | |
| UpDn-AttReg | Baseline | 46.85 | - | 64.13 | - |
| w/o VAtt | 35.34 | 11.51 | 51.88 | 12.25 | |
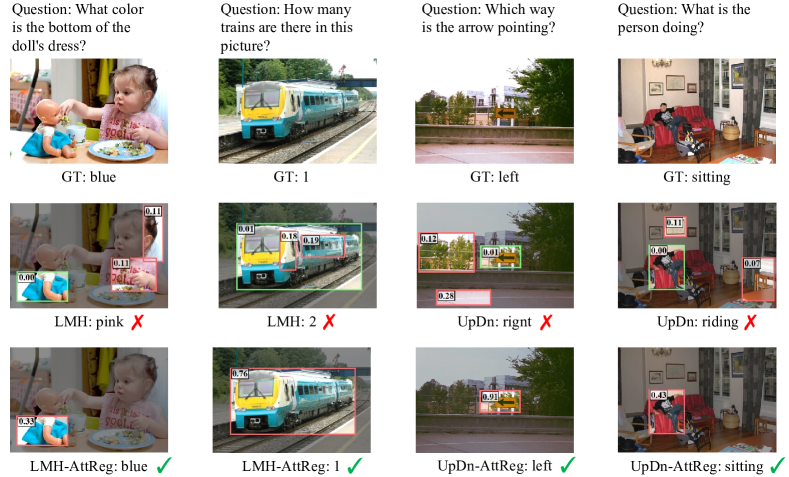
Qualitative Evaluation. To better illustrate the effectiveness of AttReg, we visualized the attention maps generated by the backbones with and without our AttReg, and exhibited the results in Figure 6. In all cases, the backbone model shifts more attention to the ignored key objects after introducing our AttReg. And the model is also promoted to predict the right answer with the correct visual grounding. Take the left one as an example, with our AttReg, the attention weight of the ignored key object dress grows from 0.00 to 0.33, and becomes the most influential one among all objects in the image, which further help to yield the correct answer of blue.
4.6. Visual Attention Faithfulness Exploration
One intuitive property in visual attention is that the image regions with larger attention weights should contribute more to model predictions, since these regions represent where the model focuses on when making decisions. Following (Selvaraju et al., 2019), we define this property as the faithfulness of visual attention. To justify it, we conduct occlusion studies and quantify the contribution of image regions via two measurement: performance change and prediction variation.
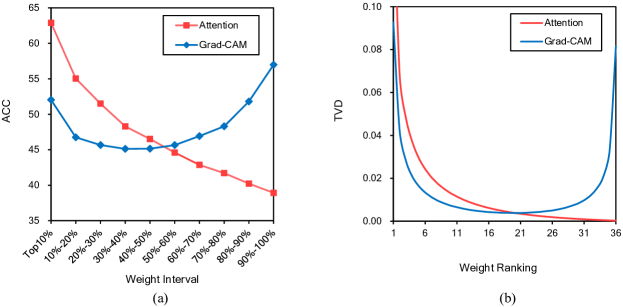
Contribution to Model Performance. We empirically characterize visual attention weights as the contribution of image regions towards model performance, and measure the performance change when using different portions of image features, e.g., image features with 10%-20% highest attention scores444Note that the image features we used are composed of 36 object proposal features extracted by Faster R-CNN.. In addition, we also leverage the same setting to testify the faithfulness of the Grad-CAM, and all the results are illustrated in Figure 7 (a). We can see that for the curve related to attention, the model performance continuously declines as the attention weights of the maintained regions decrease. In contrast, by employing Grad-CAM as the visual grounding, the model performance drops first but then improves with the descending of the maintained weights. Further, the model performance of maintaining the lowest gradient weights even superior to the one with the highest gradient weights, which is confusing since regions with larger gradients in Grad-CAM should contribute more to the model performance. Instead, the visual attention weight shows a more acceptable consistency in model performance change.
Contribution to Model Prediction. To further study the relationship between the attention weight and the contribution of the image region to model prediction, we remove each region sequentially according to its assigned weight value and observe the prediction variation. Specifically, the region contribution is quantified through the prediction variation with and without the current image region, which is expressed by the Total Variation Distance (TVD) (Jain and Wallace, 2019),
| (9) |
where and represent two different sets of predicted scores for each answer, respectively. A higher TVD denotes that the tested region is more influential for answer prediction.
We have computed the TVD for each image region with respect to its ranked weight and plotted the results in Figure 7 (b). It can be found that the TVD is monotonously decreasing along the descending of the ranked attention weight, which demonstrates the tight correlation between the attention weight and region contribution towards answer prediction. In contrast, many regions with a very low ranking of Grad-CAM weights (i.e., ranking 26 to 36) yield a strong influence for answer prediction, which is confusing and violates the visual-grounding ability of Grad-CAM to some extent. Based on the above experiments, we can conclude that the visual attention is more faithful than Grad-CAM pertaining to visual grounding in VQA.
5. Conclusion and Future Work
In this work, we present a model agnostic visual attention regularization approach, i.e., AttReg, to guide the attention learning in VQA. AttReg has been applied to two strong baselines and significantly improves the backbone model performance over the VQA-CP v2 and VQA-CP v1 datasets. As a by-product, AttReg achieves a new state-of-the-art performance on VQA-CP v2. In addition, we also empirically study the faithfulness of visual attention in VQA. The experimental results have demonstrated that the visual attention obviously outperform the Grad-CAM in terms of visual grounding.
In the future, we will extend our approach to other tasks which are also hindered by the unsupervised attention learning problems, e.g., image captioning.
References
- (1)
- Agrawal et al. (2018) Aishwarya Agrawal, Dhruv Batra, Devi Parikh, and Aniruddha Kembhavi. 2018. Don’t just assume; look and answer: Overcoming priors for visual question answering. In Proceedings of the IEEE Conference on Computer Vision and Pattern Recognition. IEEE, 4971–4980.
- Anderson et al. (2018) Peter Anderson, Xiaodong He, Chris Buehler, Damien Teney, Mark Johnson, Stephen Gould, and Lei Zhang. 2018. Bottom-up and top-down attention for image captioning and visual question answering. In Proceedings of the IEEE Conference on Computer Vision and Pattern Recognition. IEEE, 6077–6086.
- Andreas et al. (2016) Jacob Andreas, Marcus Rohrbach, Trevor Darrell, and Dan Klein. 2016. Deep compositional question answering with neural module networks. In Proceedings of the IEEE Conference on Computer Vision and Pattern Recognition. IEEE, 39–48.
- Antol et al. (2015) Stanislaw Antol, Aishwarya Agrawal, Jiasen Lu, Margaret Mitchell, Dhruv Batra, C Lawrence Zitnick, and Devi Parikh. 2015. Vqa: Visual question answering. In Proceedings of IEEE International Conference on Computer Vision. IEEE, 2425–2433.
- Cadene et al. (2019a) Remi Cadene, Hedi Ben-younes, Matthieu Cord, and Nicolas Thome. 2019a. MuRel: Multimodal relational reasoning for visual question answering. In Proceedings of the IEEE Conference on Computer Vision and Pattern Recognition. IEEE, 1989–1998.
- Cadene et al. (2019b) Remi Cadene, Corentin Dancette, Hedi Ben-younes, Matthieu Cord, and Devi Parikh. 2019b. Rubi: Reducing unimodal biases in visual question answering. In Proceedings of Advances in Neural Information Processing Systems. Curran Associates, Inc., 839–850.
- Chen et al. (2020) Long Chen, Xin Yan, Jun Xiao, Hanwang Zhang, Shiliang Pu, and Yueting Zhuang. 2020. Counterfactual samples synthesizing for robust visual question answering. In Proceedings of the IEEE Conference on Computer Vision and Pattern Recognition. IEEE, 10800–10809.
- Cho et al. (2014) Kyunghyun Cho, Bart van Merrienboer, Caglar Gulcehre, Dzmitry Bahdanau, Fethi Bougares, Holger Schwenk, and Yoshua Bengio. 2014. Learning phrase representations using RNN Encoder-Decoder for statistical machine translation. In Proceedings of the Conference on Empirical Methods in Natural Language Processing. ACL, 1724–1734.
- Clark et al. (2019) Christopher Clark, Mark Yatskar, and Luke Zettlemoyer. 2019. Don’t take the easy way out: Ensemble based methods for avoiding known dataset biases. In Proceedings of the Conference on Empirical Methods in Natural Language Processing. ACL, 4069–4082.
- Das et al. (2016) Abhishek Das, Harsh Agrawal, C. Lawrence Zitnick, Devi Parikh, and Dhruv Batra. 2016. Human attention in visual question answering: Do humans and deep networks look at the same regions?. In Proceedings of the Conference on Empirical Methods in Natural Language Processing. ACL, 932–937.
- Fan et al. (2020) Hehe Fan, Linchao Zhu, Yi Yang, and Fei Wu. 2020. Recurrent attention network with reinforced generator for visual dialog. ACM Trans. Multim. Comput. Commun. Appl. 16, 3 (2020), 1–16. Issue 3s.
- Fang et al. (2019) Zhiwei Fang, Jing Liu, Xueliang Liu, Qu Tang, Yong Li, and Hanqing Lu. 2019. BTDP: Toward sparse fusion with block term decomposition pooling for visual question answering. ACM Trans. Multimedia Comput. Commun. Appl. 15, 50 (2019), 1–21. Issue 2s.
- Fukui et al. (2016) Akira Fukui, Dong Huk Park, Daylen Yang, Anna Rohrbach, Trevor Darrell, and Marcus Rohrbach. 2016. Multimodal compact bilinear pooling for visual question answering and visual grounding. In Proceedings of the Conference on Empirical Methods in Natural Language Processing. ACL, 457–468.
- Gat et al. (2020) Itai Gat, Idan Schwartz, Alexander G. Schwing, and Tamir Hazan. 2020. Removing bias in multi-modal classifiers: regularization by maximizing functional entropies. In Proceedings of Advances in Neural Information Processing Systems. Curran Associates, Inc., 3197–3208.
- Goyal et al. (2017) Yash Goyal, Tejas Khot, Douglas Summers-Stay, Dhruv Batra, and Devi Parikh. 2017. Making the V in VQA matter: Elevating the role of image understanding in visual question answering. In Proceedings of the IEEE Conference on Computer Vision and Pattern Recognition. IEEE, 6325–6334.
- Guo et al. (2019) Yangyang Guo, Zhiyong Cheng, Liqiang Nie, Yibing Liu, Yinglong Wang, and Mohan Kankanhalli. 2019. Quantifying and alleviating the language prior problem in visual question answering. In SIGIR. ACM, 75–84.
- Guo et al. (2021) Yangyang Guo, Liqiang Nie, Zhiyong Cheng, Feng Ji, Ji Zhang, and Alberto Del Bimbo. 2021. AdaVQA: Overcoming language priors with adapted margin cosine Loss. In Proceedings of the International Joint Conference on Artificial Intelligence. ijcai.org, 708–714.
- Guo et al. (2020) Yangyang Guo, Liqiang Nie, Zhiyong Cheng, and Qi Tian. 2020. Loss-rescaling VQA: Revisiting language prior problem from a class-imbalance view. arXiv preprint arXiv:2010.16010 (2020).
- Honnibal et al. (2020) Matthew Honnibal, Ines Montani, Sofie Van Landeghem, and Adriane Boyd. 2020. spaCy: Industrial-strength aatural language processing in python. https://doi.org/10.5281/zenodo.1212303
- Jain and Wallace (2019) Sarthak Jain and Byron C. Wallace. 2019. Attention is not explanation. In Proceedings of the 2019 Conference of the North American Chapter of the Association for Computational Linguistics: Human Language Technologies. ACL, 3543–3556.
- Jing et al. (2020) Chenchen Jing, Yuwei Wu, Xiaoxun Zhang, Yunde Jia, and Qi Wu. 2020. Overcoming language priors in VQA via decomposed linguistic representations. In AAAI. AAAI Press, 11181–11188.
- Li et al. (2019c) Dong Li, Ting Yao, Ling-Yu Duan, Tao Mei, and Yong Rui. 2019c. Unified spatio-temporal attention networks for action recognition in videos. IEEE Trans. Multim. 21, 2 (2019), 416–428.
- Li et al. (2018) Jianan Li, Xiaodan Liang, Shengmei Shen, Tingfa Xu, Jiashi Feng, and Shuicheng Yan. 2018. Scale-aware Fast R-CNN for pedestrian detection. IEEE Trans. Multim. 20, 4 (2018), 985–996.
- Li et al. (2019a) Qun Li, Fu Xiao, Le An, Xianzhong Long, and Xiaochuan Sun. 2019a. Semantic concept network and deep walk-based visual question answering. ACM Trans. Multimedia Comput. Commun. Appl. 15, 49 (2019), 1–19. Issue 2s.
- Li et al. (2019b) Xirong Li, Chaoxi Xu, Xiaoxu Wang, Weiyu Lan, Zhengxiong Jia, Gang Yang, and Jieping Xu. 2019b. COCO-CN for cross-lingual image tagging, captioning, and retrieval. IEEE Trans. Multim. 21, 9 (2019), 2347–2360.
- Liang et al. (2019) Junwei Liang, Lu Jiang, Liangliang Cao, Li-Jia Li, and Alexander Hauptmann. 2019. Focal visual-text attention for visual question answering. IEEE Transactions on Pattern Analysis and Machine Intelligence 41, 8 (2019), 1893–1908.
- Liang et al. (2020) Zujie Liang, Weitao Jiang, Haifeng Hu, and Jiaying Zhu. 2020. Learning to contrast the counterfactual samples for robust visual question answering. In Proceedings of the Conference on Empirical Methods in Natural Language Processing. ACL, 3285–3292.
- Liu et al. (2019) Fei Liu, Jing Liu, Richang Hong, and Hanqing Lu. 2019. Erasing-based attention learning for visual question answering. In ACM Multimedia. ACM, 1175–1183.
- Lu et al. (2016) Jiasen Lu, Jianwei Yang, Dhruv Batra, and Devi Parikh. 2016. Hierarchical question-image co-attention for visual question answering. In Proceedings of Advances in Neural Information Processing Systems. Curran Associates, Inc., 289–297.
- Malinowski et al. (2018) Mateusz Malinowski, Carl Doersch, Adam Santoro, and Peter Battaglia. 2018. Learning visual question answering by bootstrapping hard attention. In Proceedings of European Conference on Computer Vision. Springer, 3–20.
- Patro et al. (2020) Badri N. Patro, Anupriy, and Vinay P. Namboodiri. 2020. Explanation vs attention: A two-player game to obtain attention for VQA. In AAAI. AAAI Press, 11848–11855.
- Pennington et al. (2014) Jeffrey Pennington, Richard Socher, and Christopher Manning. 2014. GloVe: Global vectors for word representation. In Proceedings of the Conference on Empirical Methods in Natural Language Processing. ACL, 1532–1543.
- Qiao et al. (2018) Tingting Qiao, Jianfeng Dong, and Duanqing Xu. 2018. Exploring human-Like attention supervision in visual question answering. In AAAI. AAAI Press, 7300–7307.
- Ramakrishnan et al. (2018) Sainandan Ramakrishnan, Aishwarya Agrawal, and Stefan Lee. 2018. Overcoming language priors in visual question answering with adversarial regularization. In Proceedings of Advances in Neural Information Processing Systems. Curran Associates, Inc., 1548–1558.
- Ren et al. (2015) Shaoqing Ren, Kaiming He, Ross Girshick, and Jian Sun. 2015. Faster r-cnn:Towards real-time object detection with region proposal networks. In Proceedings of Advances in Neural Information Processing Systems. Curran Associates, Inc., 91–99.
- Ross et al. (2017) Andrew Slavin Ross, Michael C. Hughes, and Finale Doshi-Velez. 2017. Right for the right reasons: Training differentiable models by constraining their explanations. In Proceedings of the International Joint Conference on Artificial Intelligence. ijcai.org, 2662–2670.
- Selvaraju et al. (2017) Ramprasaath R. Selvaraju, Michael Cogswell, Abhishek Das, Ramakrishna Vedantam, Devi Parikh, and Dhruv Batra. 2017. Grad-CAM: Visual explanations from deep networks via gradient-based localization. In Proceedings of IEEE International Conference on Computer Vision. IEEE, 618–626.
- Selvaraju et al. (2019) Ramprasaath R. Selvaraju, Stefan Lee, Yilin Shen, Hongxia Jin, Shalini Ghosh, Larry Heck, Dhruv Batra, and Devi Parikh. 2019. Taking a hint: Leveraging explanations to make vision and language models more grounded. In Proceedings of IEEE International Conference on Computer Vision. IEEE, 2591–2600.
- Shih et al. (2016) Kevin J. Shih, Saurabh Singh, and Derek Hoiem. 2016. Where to look: Focus regions for visual question answering. In Proceedings of the IEEE Conference on Computer Vision and Pattern Recognition. IEEE, 4613–4621.
- Shrestha et al. (2020) Robik Shrestha, Kushal Kafle, and Christopher Kanan. 2020. A negative case analysis of visual grounding methods for VQA. In Proceedings of the Conference on Empirical Methods in Natural Language Processing. ACL, 8172–8181.
- Teney et al. (2020) Damien Teney, Ehsan Abbasnejad, Kushal Kafle, Robik Shrestha, Christopher Kanan, and Anton van den Hengel. 2020. On the value of out-of-distribution testing: An example of Goodhart’s law. In Proceedings of Advances in Neural Information Processing Systems. Curran Associates, Inc., 407–417.
- Wu and Mooney (2019) Jialin Wu and Raymond J. Mooney. 2019. Self-critical reasoning for robust visual question answering. In Proceedings of Advances in Neural Information Processing Systems. Curran Associates, Inc., 8601–8611.
- Wu et al. (2017) Qi Wu, Damien Teney, Peng Wang, Chunhua Shen, Anthony Dick, and Anton van den Hengel. 2017. Visual question answering: A survey of methods and datasets. Computer Vision and Image Understanding 163 (2017), 21–40.
- Xu et al. (2017) Dejing Xu, Zhou Zhao, Jun Xiao, Fei Wu, Hanwang Zhang, Xiangnan He, and Yueting Zhuang. 2017. Video question answering via gradually refined attention over appearance and motion. In ACM Multimedia. ACM, 1645–1653.
- Yang et al. (2003) Hui Yang, Lekha Chaisorn, Yunlong Zhao, Shi-Yong Neo, and Tat-Seng Chua. 2003. VideoQA: question answering on news video. In ACM Multimedia. ACM, 632–641.
- Yang et al. (2016) Zichao Yang, Xiaodong He, Jianfeng Gao, Li Deng, and Alex Smola. 2016. Stacked attention networks for image question answering. In Proceedings of the IEEE Conference on Computer Vision and Pattern Recognition. IEEE, 21–29.
- Yu et al. (2019) Dongfei Yu, Jianlong Fu, Xinmei Tian, and Tao Mei. 2019. Multi-source multi-level attention networks for visual question answering. ACM Trans. Multimedia Comput. Commun. Appl. 15, 51 (2019), 1–20. Issue 2s.
- Zhang et al. (2016) Peng Zhang, Yash Goyal, Douglas Summers-Stay, Dhruv Batra, and Devi Parikh. 2016. Yin and yang: Balancing and answering binary visual questions. In Proceedings of Advances in Neural Information Processing Systems. Curran Associates, Inc., 5014–5022.
- Zhang et al. (2019) Yundong Zhang, Juan Carlos Niebles, and Alvaro Soto. 2019. Interpretable visual question answering by visual grounding from attention supervision mining. In Proceedings of the IEEE Winter Conference on Applications of Computer Vision. IEEE, 349–357.
- Zhao et al. (2017) Zhou Zhao, Jinghao Lin, Xinghua Jiang, Deng Cai, Xiaofei He, and Yueting Zhuang. 2017. Video question answering via hierarchical dual-level attention network learning. In ACM Multimedia. ACM, 1050–1058.
- Zhou et al. (2017) Luowei Zhou, Chenliang Xu, Parker A. Koch, and Jason J. Corso. 2017. Watch what you just said: Image captioning with text-conditional attention. In ACM Multimedia (Thematic Workshops). ACM, 305–313.
- Zhu et al. (2020) Xi Zhu, Zhendong Mao, Chunxiao Liu, Peng Zhang, Bin Wang, and Yongdong Zhang. 2020. Overcoming language priors with self-supervised learning for visual question answering. In Proceedings of the International Joint Conference on Artificial Intelligence. AAAI Press, 1083–1089.
- Zhu et al. (2016) Yuke Zhu, Oliver Groth, Michael Bernstein, and Li Fei-Fei. 2016. Visual7W: Grounded question answering in images. In Proceedings of the IEEE Conference on Computer Vision and Pattern Recognition. IEEE, 4995–5004.