Multi-wavelength observations of the Galactic X-ray binaries IGR J20155+3827 and Swift J1713.44219
Abstract
In recent years, thanks to the continuous surveys performed by INTEGRAL and Swift satellites, our knowledge of the hard X-ray/soft gamma-ray sky has greatly improved. As a result it is now populated with about 2000 sources, both Galactic and extra-galactic, mainly discovered by IBIS and BAT instruments. Many different follow-up campaigns have been successfully performed by using a multi-wavelength approach, shedding light on the nature of a number of these new hard X-ray sources. However, a fraction are still of a unidentified nature. This is mainly due to the lack of lower energy observations, which usually deliver a better constrained position for the sources, and the unavailability of the key observational properties, needed to obtain a proper physical characterization. Here we report on the classification of two poorly studied Galactic X-ray transients IGR J201553827 and Swift J1713.44219, for which the combination of new and/or archival X-ray and Optical/NIR observations have allowed us to pinpoint their nature. In particular, thanks to XMM-Newton archival data together with new optical spectroscopic and archival Optical/NIR photometric observations, we have been able to classify IGR J201553827 as a distant HMXB. The new INTEGRAL and Swift data collected during the 2019 X-ray outburst of Swift J1713.44219, in combination with the archival optical/NIR observations, suggest a LMXB classification for this source.
keywords:
gamma rays: observations — radiation mechanisms: non-thermal — stars: individual: IGR J201553827, Swift J1713.44219— stars: black hole, neutron star — X-rays: binaries.1 Introduction
In the last fifteen years our knowledge of the hard-X/soft gamma-ray sky has greatly improved thanks to the continuous surveys performed with both INTEGRAL Winkler et al. (2003) and the Neil Gehrels Swift Observatory (Swift) Gehrels et al. (2004) satellites, which have been in orbit since 2002 and 2004, respectively. To this aim, the main telescopes contributing to surveying are IBIS Ubertini et al. (2003) on board of INTEGRAL and BAT Barthelmy et al. (2005) on board of Swift. These instruments are both operative in a similar energy range (about 15-200 keV) with a mCrab sensitivity limit and afford a point source location accuracy of a few arcmin (depending on the source strength, though IBIS provides a better angular resolution than BAT). As a result, the hard X-ray/soft gamma-ray sky is now populated with about 2000 sources, compared to the about 70 objects in the all-sky survey performed with the detectors of A4/HEAO1 (in the range 13-180 keV at a flux sensitivity of 14 mCrab, Levine et al., 1984) and the 40 sources reported from the sky images collected during 8 years of operation of the SIGMA imaging telescope on board the GRANAT satellite Revnivtsev et al. (2004).
Indeed, the most recent IBIS survey Bird et al. (2016) lists about 1000 sources, of which 307 are new detections, distributed mainly along the Galactic Plane, while the one reported by BAT Oh et al. (2018) contains about 1630 sources (422 new detections), 70% of which are of extra-galactic origin, as this satellite was primarily designed to detect transient GRBs. A part of the newly reported detected sources have their nature still unidentified, about 20% and 10% for IBIS and BAT, respectively. This is mainly due to the transient nature of many of these sources, to the lack of a lower energy coverage which would allow a much better positional accuracy and to the lack of availability of key observational properties (such as spectral shape, flux, variability and absorption) which are needed to properly characterize these sources.
Many different follow-up campaigns have been performed by several groups, especially for the new sources discovered by IBIS (IGRs) and BAT (see Tomsick et al., 2008; Rodriguez et al., 2010; Bernardini et al., 2013; Tomsick et al., 2016; Landi et al., 2017; Tomsick et al., 2020, and references therein). These campaigns make use of archival data or new data-sets in the X-ray band with XMM-Newton, Chandra and XRT/Swift instruments, in order to detect the soft X-ray emission from these sources and thus drastically reduce the positional uncertainty down to (sub-)arcsecond size. Subsequently, optical and/or near-infrared (NIR) spectroscopy is performed on their putative lower-energy counterpart(s) with the aim to uncover their nature (see e.g. Rahoui et al., 2008; Masetti et al., 2013; Parisi et al., 2014; Rojas et al., 2017; Fortin et al., 2018; Karasev et al., 2018; Marchesini et al., 2019, and references therein, to name a few). As a result, the nature of more than 300 INTEGRAL-discovered sources (IGRs) have been identified on a total of 560 listed in Bird et al. (2016) – mainly active galactic nuclei, cataclysmic variables (CV), but also high-mass X–ray binaries (HMXB) and low-mass X–ray binaries (LMXB) and a similar number is available for the new BAT transients, though the latter are dominated by extra-galactic sources.
In this paper we report on the possible classification for two poorly studied transient sources: IGR J201553827 and Swift J1713.44219. For each of these objects we first briefly report on data presented so far in the literature, then we focus on new data obtained with INTEGRAL, XMM-Newton and Swift and finally we use archival and newly-acquired optical/NIR observations, in order to attempt to pinpoint their nature. In Table 1 the details of the observations available for both sources are shown.
All the Swift data reported throughout this manuscript have been processed by using the standard tools incorporated in HEAsoft (v6.26.1), while the the spectral analysis is always performed by using the software XSPEC v12.10.1 Arnaud (1996).
| MJD | Instrument | Obs. setup | Exp. time |
|---|---|---|---|
| (days) | (s) | ||
| (1) | (2) | (3) | (4) |
| IGR J201553827 | |||
| 57874.39 | EPIC/XMM-Newton | Medium filter | 22400 |
| 58746.90 | BFOSC/Cassini | Grism #4; slit 2′′ | 21800 |
| Swift J1713.44219 | |||
| 58148.89 | XRT/Swift | Photon Counting | 1421.64 |
| UVOT/Swift | 836.62 | ||
| 58149.82 | XRT/Swift | Photon Counting | 1923.09 |
| UVOT/Swift | 930.07 | ||
| 58759.70 | IBIS/INTEGRAL | Photon-by-Photon | 4200.00∗ |
| JEM-X/INTEGRAL | Photon-by-Photon | 7800.00∗ | |
| 58779.04 | XRT/Swift | Photon Counting | 1465.90 |
| UVOT/Swift | 1456.74 | ||
| 58785.81 | XRT/Swift | Windowed Timing | 2743.48 |
| UVOT/Swift | 1669.95 | ||
∗Effective exposure times
2 IGR J20155+3827
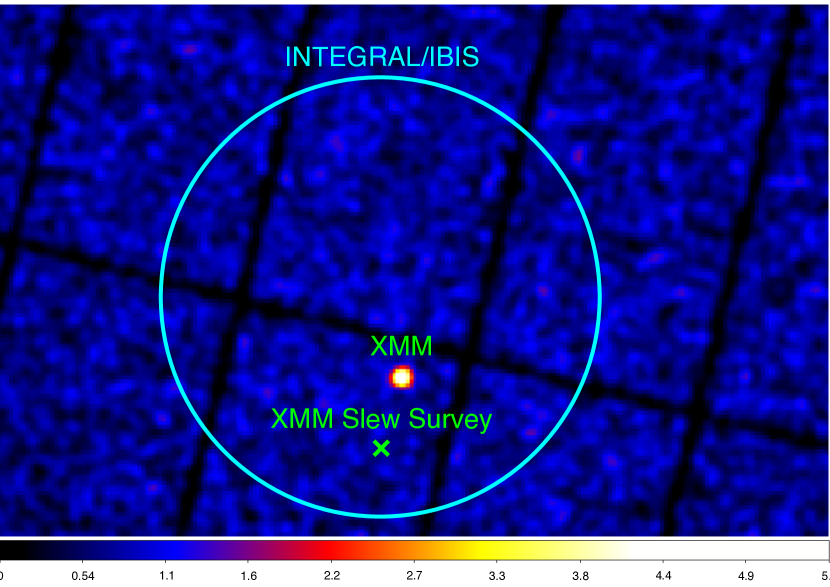
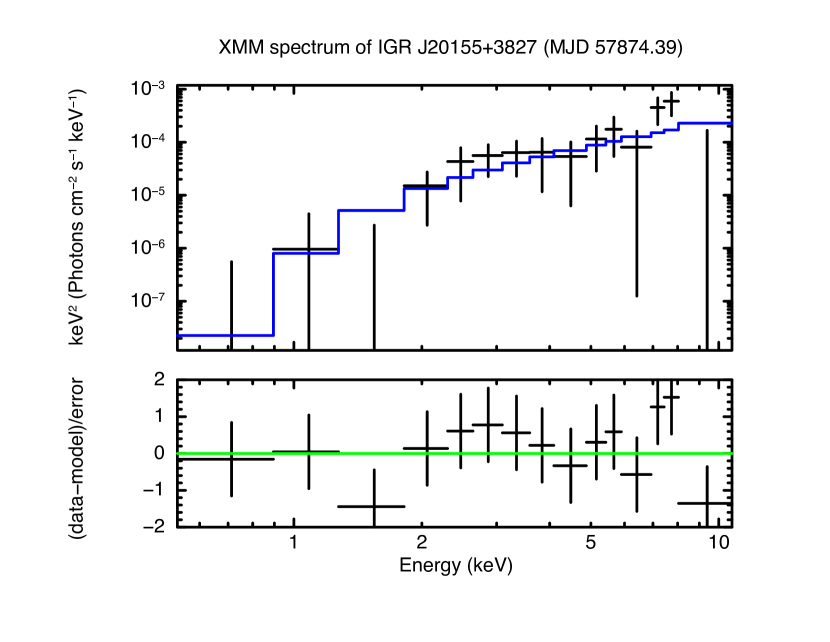
IGR J201553827 was first reported in the 4th IBIS/INTEGRAL catalog Bird et al. (2010) as new transient X-ray source. It was detected by using the "bursticity" method (see Bird et al., 2010) at a peak flux of 5.8 mCrab in the 17-30 keV band, during a 25.5 day outburst, starting on 2004 September 08 (MJD=53256.10). The position of the source as derived from the IBIS image analysis is RA (J2000) = 20:15:30 and DEC (J2000)= +38:27:00, within a 90% confidence radius of 4.2 arc minutes. The source was later confirmed in the 1000 orbit catalog, by using a much longer exposure time of 3.4 Ms versus 1.3 Ms Bird et al. (2016). IGR J201553827 was also detected by XMM-Newton on 2017 May 01 (MJD 57874.39), which was able to deliver a better constrained position of RA (J2000) = 20:15:28.03 and DEC(J2000) = +38:25:28.6, with a 90% confidence error radius of 11. The detection of this source is also reported in the 4XMMDR10 catalog Webb et al. (2020) with an observed flux in the 0.2-12 keV band of F0.2-12=(2.40.2) erg cm-2 s-1 . We note that the same field has been previously observed on 2011 May 05 in the framework of the XMM-Newton slew survey Saxton et al. (2008). The authors reported the detection of a source at the position RA (J2000) = 20:15:29.9 and DEC (J2000) = 38:24:06.5, which is inside the INTEGRAL /IBIS 90% confidence radius for IGR J201553827, but it is not compatible with the XMM-Newton position derived during the 2017 May 01 observation (see Figure 1)111We note however that the XMSLew position may be effected (flagged) by attitude reconstruction problems which provide an uncertainty on the source position of up to 1 arcmin, making the likelyhood of an association still possible. If the two XMM sources coincide, then the change in flux over a six years period is of a factor of 15.. Moreover, the source reported by the XMM-Newton slew survey is characterized by a soft emission in the 0.2-2 keV channel of F0.2-2=(1.550.46)10-12 erg cm-2 s-1 , while the flux measured in the total band is F0.2-12=(3.671.10)10-12 erg cm-2 s-1 . No flux measurements are reported for the 2-12 keV energy channel. Instead, the XMM-Newton and INTEGRAL observations of IGR J201553827 indicate that this source is characterized by an hard emission. In particular, the IGR J201553827 spectrum extracted from the XMM-Newton observations of MJD 57874.3 show that the source emission is mainly detected in the 2-10 keV band (see Figure 3). Thus, we tentatively exclude that the transient reported by the XMM-Newton slew survey is related to IGR J201553827.
We have identified an optical/infrared counterpart candidate for IGR J201553827 with the star USNOB1 12840410895222Other names of the source are 2MASS J20152803+3825260 and ALLWISE J201528.03+382526.0 Monet et al. (2003), at the position of RA(J2000) = 20:15:28.041, DEC(J2000) = +38:25:25.27. This is the only object laying within XMM-Newton position error radius for IGR J201553827, as shown in figure 2. USNOB1 12840410895 is reported in the Gaia Data Release 2 (DR2) catalog Gaia Collaboration et al. (2016a, 2018); Riello et al. (2018), where a distance d = 106 kpc can be derived through the small parallax measurement value of 0.09960.0589 mas. The source is also reported in the more recent Gaia Early Data Release 3 (EDR3) catalog Gaia Collaboration et al. (2016b); Riello et al. (2020); Fabricius & Makarov (2000) where an even smaller parallax measurement of 0.07950.0177 mas is delivered.
However there are some issues regarding the distance estimate from the Gaia parallax. First, according to Bailer-Jones et al. (2020) and Bailer-Jones et al. (2018), reliable distances cannot be obtained by inverting the parallax for the majority of stars in Gaia catalogs. Secondly, the parallax value delivered for USNOB1 12840410895 in Gaia DR2 is affected by an astrometric excess noise at a level of 0.474 mas, indicating that the fit for the parallax determination is not necessarily reliable. We note that the astrometric excess noise is considerably reduced to a level of 0.149 mas in Gaia EDR3, indicating a more reliable parallax fit with respect the DR2 estimate. Interestingly, distances for a number of Gaia DR2 and EDR3 stars have been inferred by applying the probabilistic analysis described in Bailer-Jones et al. (2018) and Bailer-Jones et al. (2020), respectively. For USNOB1 12840410895 a geometric distance d = 5.61.5 kpc has been derived by using Gaia DR2 data, while a geometric distance d = 7.21.0 kpc has been obtained from the more accurate EDR3 data. Thus, we assume a distance of d7 kpc as the most reliable for the optical counterpart of IGR J201553827.
The identification of an optical counterpart candidate and the derived distance from parallax measurements indicate that IGR J201553827 is a Galactic transient. In the following we report on new results obtained with XMM-Newton and optical data analysis.

, lays inside it.
2.1 XMM-Newton observation of IGR J201553827
We processed the IGR J201553827 XMM-Newton observation performed on 2017 May 01 (MJD 57874.39, see Table 1 for more details) using the XMM Science Analysis System SAS v16.1.0. Unluckily, the pointing was affected by a background flare and, consequently, to avoid its impact on our analysis, we applied a filter in time considering only the first 1.4104 s of the observation when extracting the PN and MOS spectra. Since the MOS data result in a poor signal-to-noise ratio, we report only the spectrum extracted from the PN data, which cover a broader energy range (0.2-10 keV) with a better sensitivity. The data can be modelled by an absorbed power-law (PHABS*POWERLAW), as shown by the residuals with respect to the model reported in Figure 3, bottom panel. As a result, we obtain a high value for the hydrogen column density with a wide error range: NH=(5.0)1022 cm-2. We also obtain a spectral index = 1.8 and d.o.f. of 7.92/12. We derived an upper limit for the unabsorbed flux in the 0.2-12 keV band, which is F1.210-10 erg cm-2 s-1 . Given the poorly constrained value of the NH parameter obtained in this way, we performed the fitting procedure with the hydrogen column density parameter fixed to the Galactic value NH=1.111022 cm2, as derived for the source position by using the Heasarch nH ftools and the HI4PI Collaboration map HI4PI Collaboration et al. (2016). In this case, we obtain a spectral index of =0.4, a d.o.f. of 10.11/13 and an unabsorbed flux in the 0.2-12 keV band of F0.2-12=(3.551.80)10-13 erg cm-2 s-1 .
In Table 2 the results obtained from both the spectral fitting procedures are reported. We remark that the use of more complex models (e.g., a power law with a high-energy cut-off; White et al., 1983) is not justified statistically and returns largely undetermined fit parameters. Finally, no periodicities have been found from the timing analysis performed on the XMM-Newton data in the 0.2-12 keV energy range.
| Model | Parameter | Value |
| PHABS | NH(1022 cm-2) | 5.0 |
| POWERLAW | 1.8 | |
| norm | 1.710-2 | |
| /d.o.f. | 7.92/12 | |
| ∗Flux in the 0.2-12 keV band: F1.210-10 erg cm-2 s-1 | ||
| PHABS | NH(1022 cm-2) | 1.11 (frozen) |
| POWERLAW | 0.4 | |
| norm | 1.810-5 | |
| /d.o.f. | 10.11/13 | |
| ∗Flux in the 0.2-12 keV band: F0.2-12=(3.551.80)10-13 erg cm-2 s-1 | ||
| calculated by freezing the normalization parameter. | ||
∗Fluxes are unabsorbed
2.2 Optical spectroscopy
We spectroscopically observed the putative optical counterpart of IGR J201553827, USNO-B1 1284-0410895, with the BFOSC instrument mounted on the 1.5m ‘G.D. Cassini’ telescope of the INAF-OAS in Loiano (Italy), equipped with a 13001340 pixels EEV CCD. The main information on these data are shown in Table 1. In particular, the observation were carried out on 2019 September 20, starting at 21:31 UT (MJD 58746.90). Two 1800s exposures were acquired with the grism #4 and using a slit width of 2′′. This observational setup secured a dispersion of 4.0 Å/pixel.
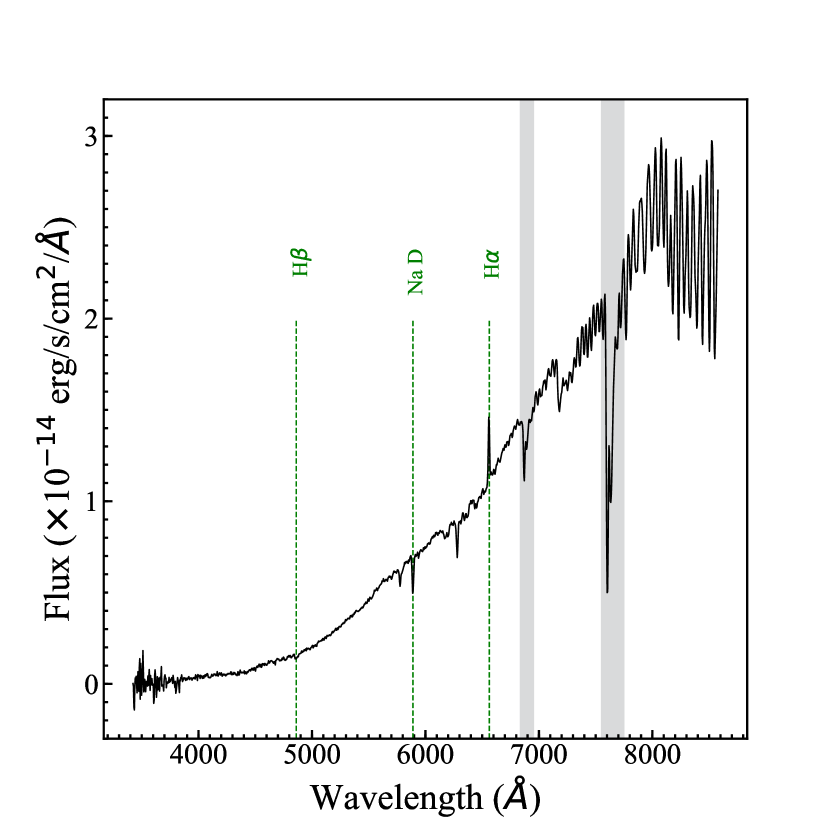
The observations were bias corrected, flat-fielded, cleaned for cosmic rays, background-subtracted and the corresponding spectra were extracted following standard procedures Horne (1986) using IRAF333IRAF is the Image Reduction and Analysis Facility, distributed by the National Optical Astronomy Observatories, which are operated by the Association of Universities for Research in Astronomy, Inc., under cooperative agreement with the National Science Foundation. It is available at http://iraf.noao.edu.. Wavelength calibration was performed with the use of Helium-Argon lamp acquisitions, taken after each science data frame. The final uncertainty in the wavelength calibration was of 3 Å. The object spectra were then flux-calibrated by means of the IRAF spectro-photometric standard star BD +26 2606 which was observed with the same setup described above. The two spectra of USNO-B1 1284-0410895 were eventually stacked together to increase the final signal-to-noise ratio (see Fig. 4).
The analysis of the spectrum of the putative optical counterpart of IGR J20155+3827 indicates the presence of a narrow Hα emission line consistent with its rest-frame wavelength superimposed on a very reddened continuum, likely affected by Galactic absorption along the line of sight of the source (see Section 2.1). Other apparent features in absorption correspond to the rest-frame Hβ, the interstellar Na doublet at 5890 Å and diffuse interstellar bands at 5780, 6280 Å. We measure flux and equivalent width (EW) of the Hα emission as FHα=(5.00.4)10-14 erg cm-2 s-1 and EW = (4.50.4) Å, respectively.
3 Swift J1713.44219
The X-ray transient Swift J1713.44219 was first detected by Swift/BAT on 2009 Nov 13 (MJD 55148) in the 15-50 keV band at position RA (J2000) = 17:13:26.6 and DEC (J2000) = -42:19:37.2, with a 90% confidence error radius of 3.0 arc minutes Krimm et al. (2009). On 2009 Nov 16 (MJD 55151), the transient was observed with RXTE and the spectral properties of the RXTE /PCA spectrum in the 2.5-30 keV band were interpreted as consistent with a black hole transient in the low-hard state Krimm et al. (2009). A renewed phase of activity of Swift J1713.44219 was observed during the INTEGRAL Galactic Plane Program scans of the Norma region on 2019 Oct 3, revolution 2144 (MJD 58759.70, Onori et al., 2019). The observations were executed between 2019-10-03 16:52:57 UTC and 2019-10-04 09:20:32 UTC. The source was detected by the IBIS/ISGRI instrument both in the 22-60 keV and 60-100 keV energy bands and by the JEM-X instrument, but only below 10 keV. Subsequent XRT/Swift observations have been executed on 2019 October 23 (MJD 58779.04), i.e. about 20 days after the INTEGRAL detection of the source, reporting the detection of the transient in the 0.3-10 keV band Baglio et al. (2019).
An optical counterpart was pinpointed among three possible candidates thanks to the Las Cumbres Observatory (LCO) -band images of the field Baglio et al. (2019) together with the Chandra refined localization of the transient Chakrabarty et al. (2019), which led to the identification of the Swift J1713.44219 optical counterpart with the star A of the LCO observations (see Baglio et al., 2019, for more details). The reported position of the star is RA (J2000) = 17:13:40.993 and DEC (J2000)= -42:18:38.20. No counterpart has been detected in the Swift/UVOT observation in the band. Finally, only an upper limit of 115 Jy was reported by radio measurements performed with MeerKAT on 2019 Oct 26 Girard et al. (2019).
In the following, we report on the results from the observations performed on the new INTEGRAL and Swift data collected during the 2019 X-ray outburst of Swift J1713.44219 and from the optical/NIR archival information available for the optical counterpart candidate.
3.1 The X-ray outburst of Swift J1713.44219
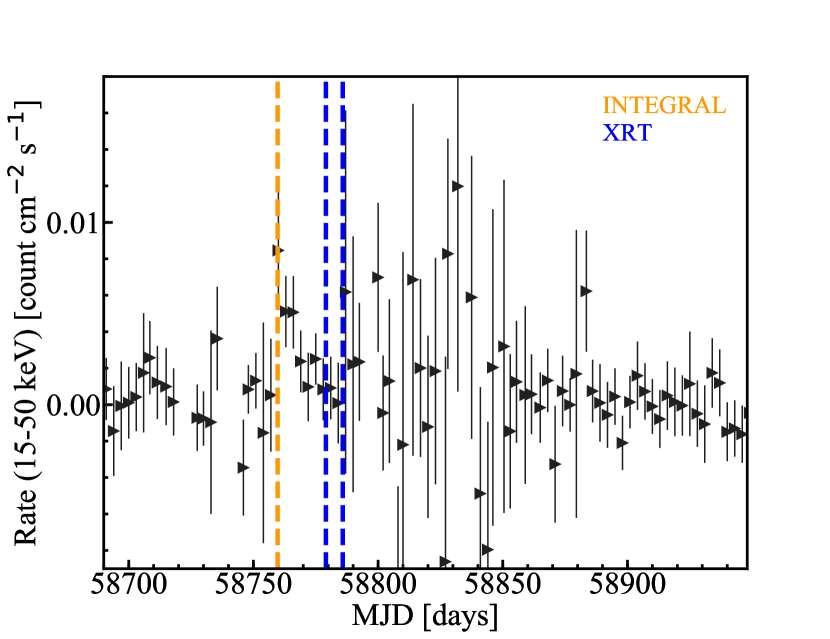
The Swift/BAT light curve of Swift J1713.44219 starting from MJD 58700 is shown in Figure 5, where the epochs of INTEGRAL and XRT observations are marked with yellow and blue vertical dashed lines, respectively. While the INTEGRAL observations of the source (MJD 58759.70) coincide with the peak emission of the hard X-ray outburst, the Swift/XRT pointings have been executed at later epochs, when it was fading. We note that the source is not monitored in the MAXI/GSC survey so that the only soft X-ray band observation simultaneous with the IBIS data is derived from the JEM-X instrument.
3.1.1 The Swift/XRT data
Starting from its first discovery, Swift J1713.44219 has been observed by the Swift/XRT instrument in different epochs, for a total of four observations, as shown in Table 1. The first three pointings were taken in photon counting mode, while the last one was executed in windowed timing mode.
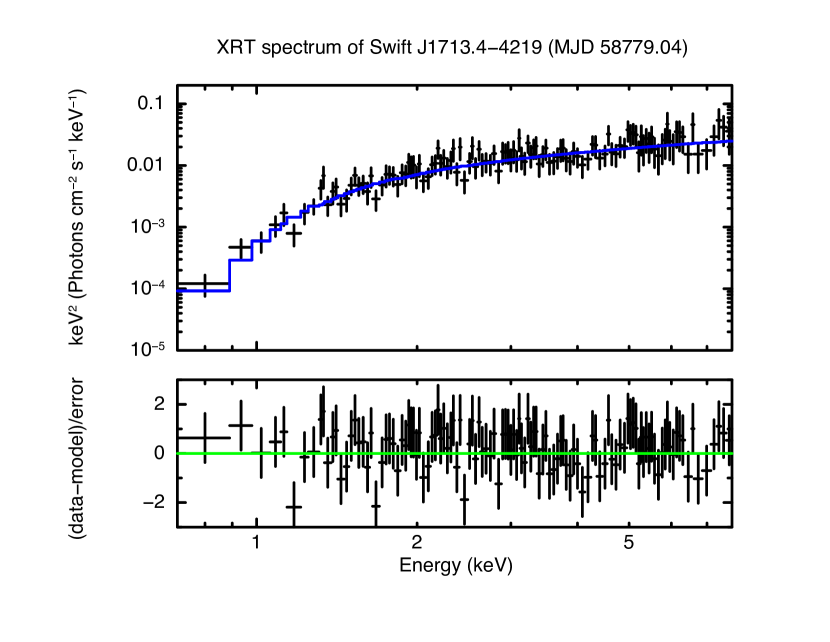
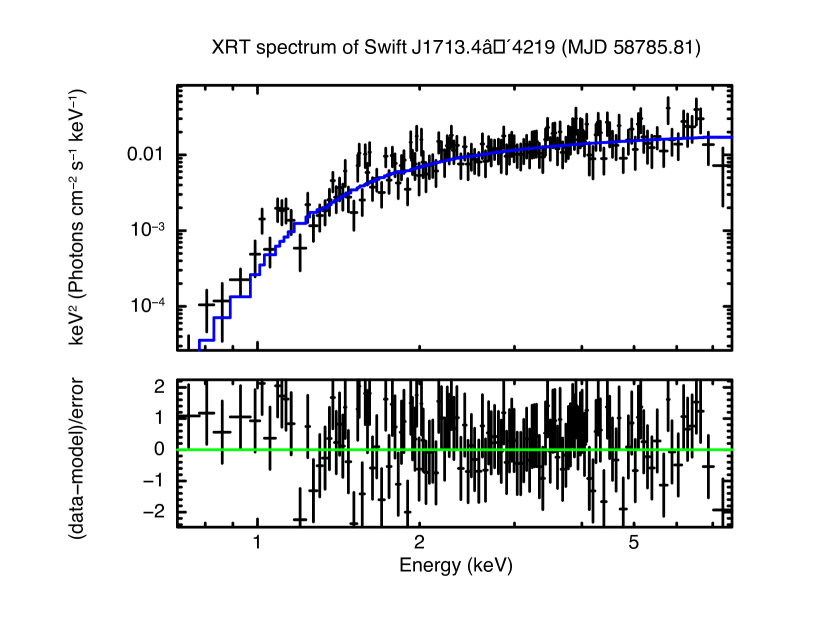
We do not detect emission from Swift J1713.44219 in the first two XRT observations (MJD 58148.89 and MJD 58149.82), while it is clearly detected in the data on MJD 58779.04 and MJD 58785.81, about 20 days after the INTEGRAL detection of the renewed activity of source in 2019. From these data we extracted the source spectrum by using a circular region of radius 50″ centered on the source position and a background circular region of radius 140″ placed in an area free of sources. In Figure 6 the spectra obtained from the observations taken on MJD 58779.04 (left panel) and MJD 58785.81 (right panel) are shown. In particular, the spectrum of MJD 58779.04 is well represented by the model PHABS*POWERLAW, as shown by the residuals (Fig. 6, left side, bottom panel). In this case, we obtain NH=(1.00.3)1022 cm-2, the spectral index =1.40.3 and a /d.o.f = 75.85/93. The unabsorbed flux in the 0.2-10 keV energy band is F0.2-10=7.810-11 erg cm-2 s-1 . In Table 3 we report the best fitting parameters obtained from this spectral analysis. These values are fully compatible with what has been found by Baglio et al. (2019), who interpreted these X-ray properties within an X-ray binary system in the hard state scenario.
When applying the same model to the subsequent spectrum of MJD 58785.81, a soft excess at energies 1.0 keV together with the iron line around 6.4 keV emerge from the residuals (bottom panel in Figure 6, right side). These spectral properties are indicative of transition of the system from a high state in correspondence of the INTEGRAL observation towards a soft state. This is also supported by the location of the XRT observations in the BAT lightcurve, shown in Figure 5 with blue dashed lines, with respect to the location of the INTEGRAL observation (yellow dashed line in Figure 5). While during the first XRT observation (corresponding to MJD 58148.89), the hard X-ray outburst was still declining, the XRT observation on MJD 58149.82, where the soft excess and the iron line around 6.4 keV appear, falls just at the end of the hard X-ray outburst.
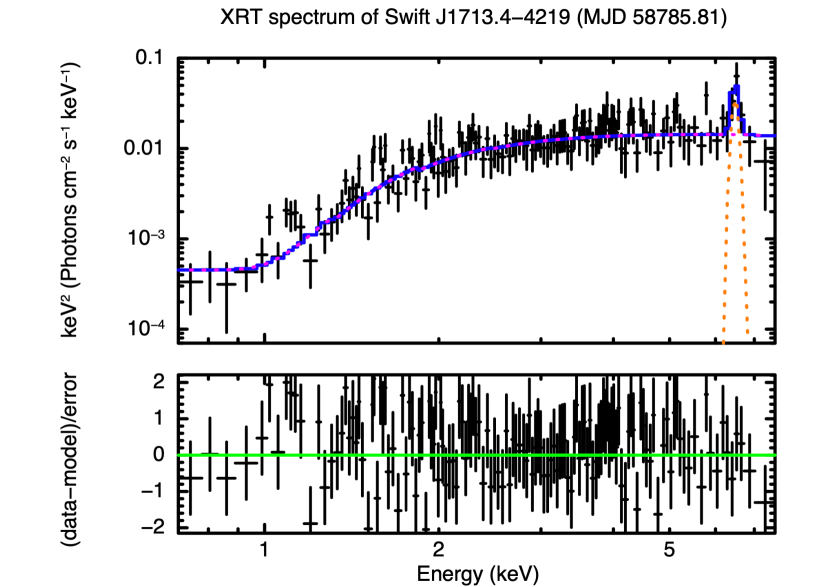
In order to model the soft excess and the iron line observed on MJD 58785.81 spectrum, we have analyzed it using the model PCFABS*(POWERLAW+GAUSS). In Figure 7 we show the spectral analysis of the MJD 58785.81 spectrum (upper panel) together with the residuals with respect to this model, shown by the solid blue line in the upper panel. The single components are shown with dashed lines of different colors. In Table 3 the best fitting parameters from this spectral analysis are reported. In particular, we obtain NH=(2.10.2)1022 cm-2, a covering fraction of 0.980.01, a photon index =2.10.1 and a /d.o.f = 129.25/132. The iron line is narrow and centered at 6.50.2 keV with an equivalent width (EW) of EW=0.58 keV. Unfortunately, only an upper limit is derived for the line width (0.30 keV). The unabsorbed flux in the 0.2-10 keV energy range is F0.2-10= 1.210-10 erg cm-2 s-1 .
| Model | Parameter | JEM-X+IBIS | XRT | XRT |
| MJD 58759.70 | MJD 58779.04 | MJD 58785.81 | ||
| (1) | (2) | (3) | (4) | (5) |
| PHABS*POWERLAW | ||||
| CONSTANT | (JEM-X) | 0.78 | ||
| (IBIS) | 1.0 (frozen) | |||
| PHABS | NH(10 cm-2 | 1.04 (frozen) | 1.040.30 | 1.380.35 |
| POWERLAW | 1.900.30 | 1.400.30 | 1.750.27 | |
| norm | 0.44 | 0.0080.004 | 0.0110.005 | |
| d.o.f. | 3.27/7 | 75.85/93 | 175.12/148 | |
| Unabs. Flux (10-10) erg cm-2 s-1 | 13.0 | 0.780.38 | 0.770.35 | |
| PCFABS*(POWERLAW+GAUSS) | ||||
| PCFABS | NH(10 cm-2 | 2.10.2 | ||
| CvrFract | 0.980.01 | |||
| POWERLAW | 2.10.1 | |||
| norm | (1.90.1)10-2 | |||
| GAUSSIAN | LineE keV | 6.480.20 | ||
| Sigma keV | 0.3 | |||
| norm | (2.01.3)10-4 | |||
| d.o.f. | 129.25/132 | |||
| Unabs. Flux (10-10) erg cm-2 s-1 | 1.20.1 | |||
3.1.2 The INTEGRAL data
Hard X-ray emission from Swift J1713.44219 is clearly detected in the IBIS 22-60 keV mosaic image, while the source is marginally detected in the JEM-X field of view, at 5 in the 3.0-10.0 keV energy band. Here we describe the data analysis performed on the INTEGRAL /IBIS Ubertini et al. (2003) and INTEGRAL /JEM-X Lund et al. (2003) consolidated data of revolution 2144. This data-set has been processed using the standard Off-line Scientific Analysis (OSA v11) software, released by the INTEGRAL Scientific Data Centre Courvoisier et al. (2003).
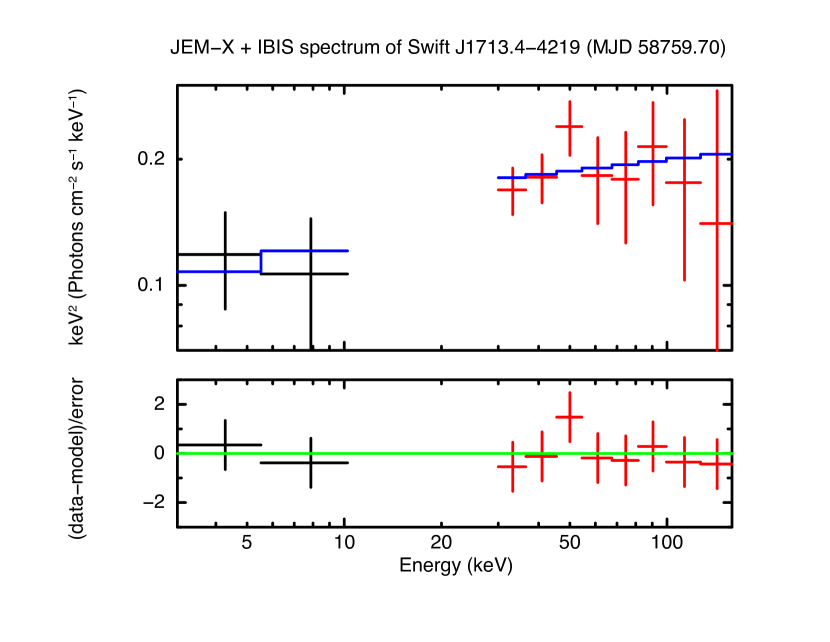
In order to study the X-ray spectral properties of the Swift J1713.44219 outburst in a broad energy range, we performed a joint spectral fitting by combining together JEM-X and IBIS data, thus covering the 3-200 keV energy band. A systematic error of 2 was included during the spectral analysis.
In Figure 8 we show the resulting JEM-X (black) and IBIS (red) spectrum together with the residuals with respect to the model used for the fit (bottom panel). We model the X-ray emission with an absorbed power-law and we included a constant normalization factor to take into account for the different instrumental calibration. Thus, the resulting model we used is CONST*PHABS*POWERLAW. In Table 3 the best fitting parameters of the JEM-X+IBIS spectral analysis are reported. In particular, we fixed to 1 the constant normalization factor for the IBIS data and we left the JEM-X one free to vary. As the fit appears insensitive to variation in the NH parameter, we fixed it to 1.041022 cm2, which is the value estimated from the XRT spectral analysis during the MJD 58779.04 observation (see Sect. 3.1.1 for more details). We obtain a spectral index =1.900.30 and d.o.f. of 3.27/7. We obtain only an upper limit for the unabsorbed flux in the 3-200 keV band , which is F1.310-9 erg cm-2 s-1 .
3.2 The optical/NIR counterpart of Swift J1713.44219
The field of Swift J1713.44219 has been observed by UVOT/Swift in different epochs and using , and filters. In particular, the first two sets of observations have been obtained at MJD 58148.89 and MJD 58149.82, when the source was quiescent, while the last two observations have been performed soon after the end of the new outburst, at MJD 58779.04 and MJD 58785.81, respectively. In order to investigate the nature of this X-ray transient, we retrieved the available archival Swift observations and analyzed them. To derive the apparent magnitude of the source we used the HEAsoft routine uvotsource with a 5″ wide aperture centered on the position of the star A and a background region of 60″ radius placed in an area free of sources. In Table 4 the measured apparent magnitudes in AB system, are reported.
Although the field was observed by UVOT at different epochs and with different bands, we do not detect the optical counterpart of Swift J1713.44219 and only moderately deep upper limits are obtained.
Optical observations of Swift J1713.44219 have been executed with the LCO telescopes on 2019 October 9, 10 and 12 by Baglio et al. (2019). An apparent magnitude of mi=(19.7380.075) mag has been derived for the star A by applying PSF photometry on the combined images taken on October 9 and using the APASS catalogue for the calibration. Instead, from the combined images of October 10, the derived apparent magnitude of the star A is mi=(20.0350.069) mag, showing a variation of 0.30.1 mag with respect to the value derived from the October 9 observations.
Star A is also found in Gaia EDR3 and DR2 databases Gaia Collaboration et al. (2016a, 2018); Riello et al. (2018, 2020); Fabricius & Makarov (2000), with magnitudes = 20.72, = 19.41 and = 21.64 in EDR3 (reference epoch: 2016.0), and = 20.80, = 19.31 and = 21.11 in DR2 (reference epoch: 2015.5); we assume that the source was in quescence on both epochs. The attempt to use the Gaia EDR3 photometric information444available at https://gea.esac.esa.int/archive/documentation/GEDR3/ to determine the corresponding magnitude of Swift J1713.44219 is however not viable because the relevant Gaia-to-SDSS transformation holds for 0.5 2.0, whereas in the present case = 2.27.
The reported DR2 apparent magnitudes correspond to colours = 1.80, = 0.31 and = 1.48 and lie in the range of application of the Gaia-to-SDSS photometric transformations for DR2; we however note that the signal-to-noise ratio (S/N) for is less than 1.7, which means that formally only a lower limit can be associated to this magnitude. Thus, using the S/N information available in the Gaia DR2, we determine the actual magnitudes for this object (not corrected for foreground absorption) as reported in Table 5.
We therefore applied the photometric transformations from Gaia passbands to the SDSS photometric system as reported in the Gaia DR2 documentation555https://gea.esac.esa.int/archive/documentation/GDR2/ to determine the SDSS quiescent magnitude for the source, in order to compare it with the LCO values reported in the literature during outburst. We remark that these conversion formulae depend on the colour, for which only a lower limit is available. Thus, we evaluated the corresponding magnitude by considering a range determined by the upper limit from the Gaia data (1.17) on one side and the applicability limit of the transformation formula (4.5) for the case of the SDSS photometric band on the other. The average magnitude value obtained in this way, together with the corresponding uncertainty, is reported in Table 5. For the sake of comparison, we also report there the LCO -band magnitudes.
| MJD | Filter | Exp. time | Magnitudes |
|---|---|---|---|
| (days) | (s) | (AB mag) | |
| (1) | (2) | (3) | (4) |
| 58148.89 | 836.6246 | 20.62 | |
| 58149.82 | 930.07 | 21.25 | |
| 58779.04 | 1456.744 | 21.02 | |
| 58785.81 | 1669.948 | 21.39 |
| Filter | LCO | LCO | Gaia DR2 | VVV DR2 |
| (2019 Oct 9) | (2019 Oct 10) | (2015 June) | (2010 Mar 29) | |
| 20.800.02 | ||||
| 20.48 | ||||
| 19.310.10 | ||||
| 19.7380.075 | 20.0350.069 | 20.30.2∗ | ||
| 17.8430.082 | ||||
| 17.1650.104 | ||||
| 16.7380.112 | ||||
| ∗:This magnitude was determined using the GaiaDR2-SDSS | ||||
| photometry transformation formulae (see text). | ||||
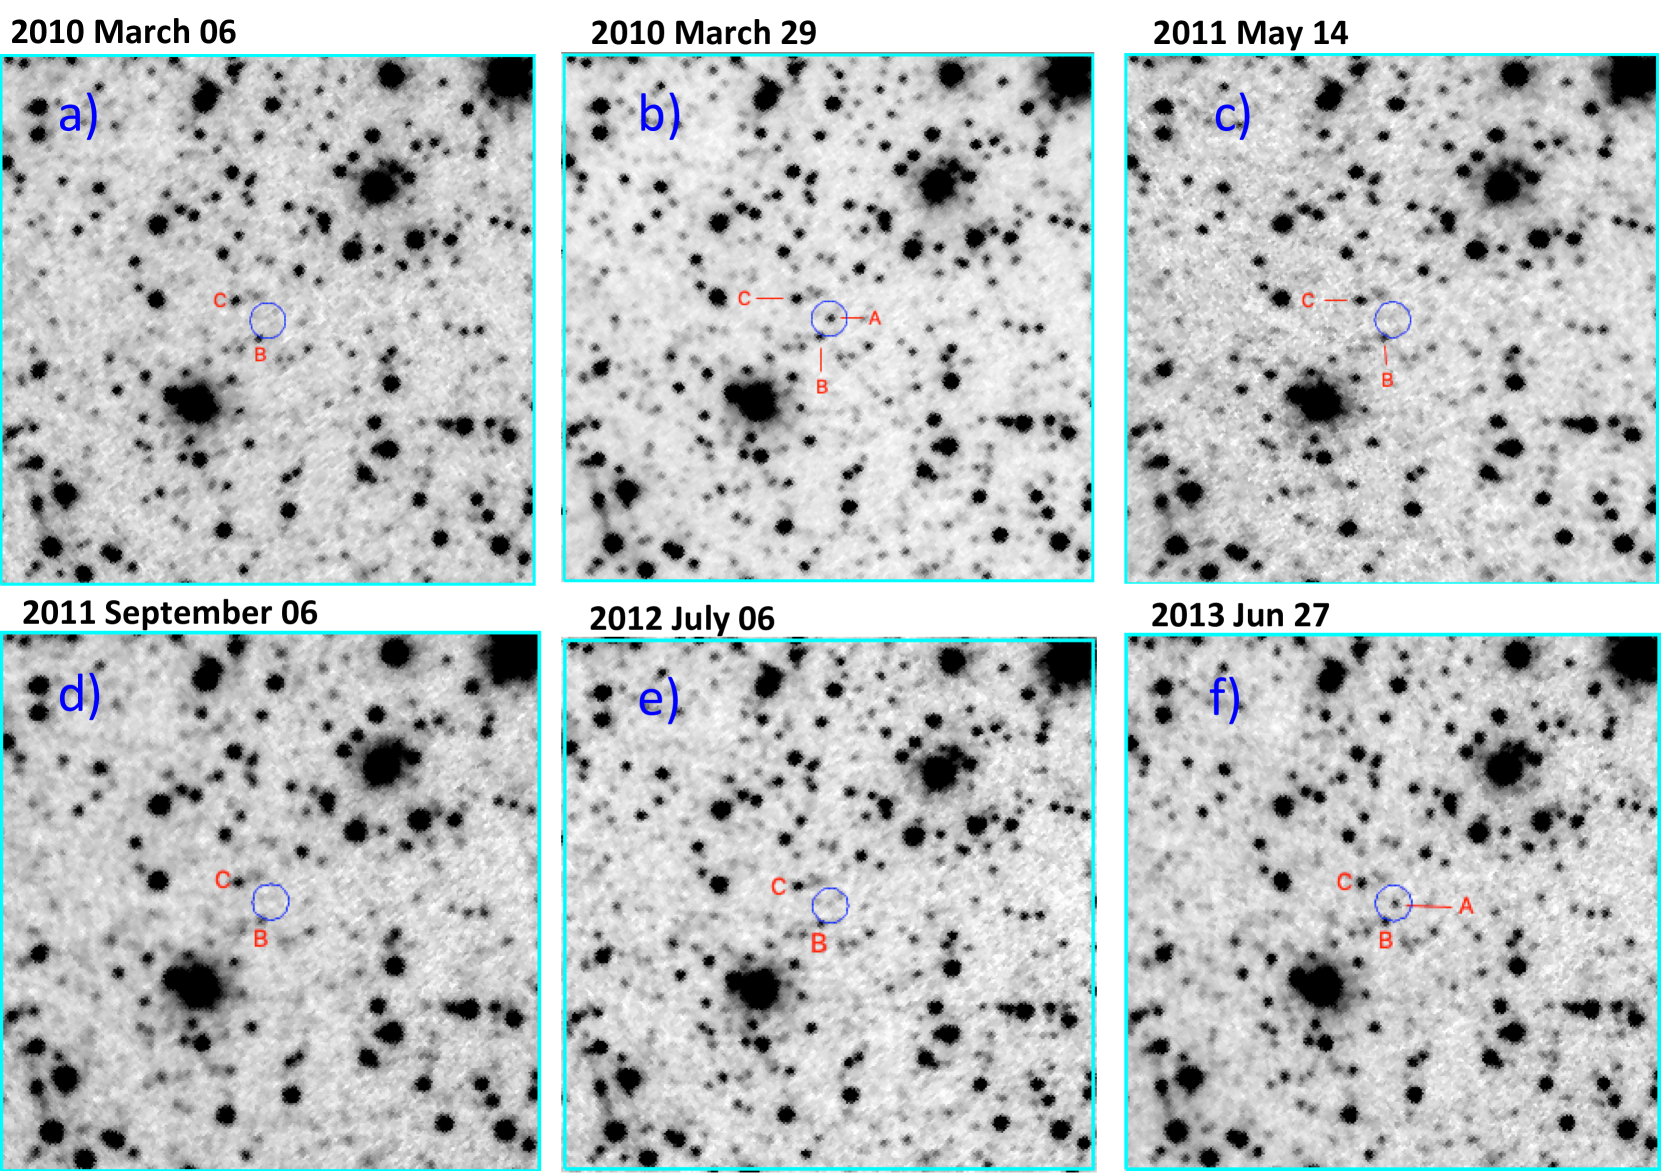
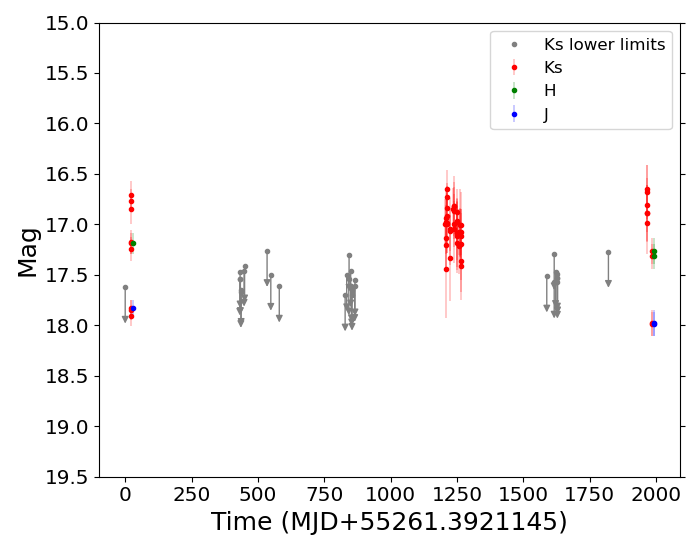
A NIR counterpart for this source is found in the Second Data Release of the Vista Variables in the Vía Láctea (VVV) survey666vvvsurvey.org Minniti et al. (2010). This survey of the Galactic Bulge and inner disk was obtained with the 4.1m VISTA telescope at Cerro Paranal (Chile) between years 2010 and 2015. The aforementioned source, indicated with the alias VVV J171340.98421838.06, lies 016 from the optical position of star A reported in Baglio et al. (2019), thus well within the positional uncertainty of the latter (02 according to those authors, while the 1- positional error of the VVV survey is 01). The magnitudes in the bands are reported in Table 5.
For the sake of completeness we explored and reduced all the available images containing the field of Swift J1713.44219 (tile of the survey; details on these NIR observations are reported in the table in the Appendix). We find that the source shows marked variability of at least 1.5 magnitudes in the band over a time scale of months to years (see Figure 9 and Figure 10), definitely proving its transient nature and, thus enforcing its identification as the NIR counterpart of Swift J1713.44219.
4 Discussion
4.1 IGR J20155+3827 as a distant supergiant HMXB
As shown in the previous sections, the multi-wavelength properties of IGR J201553827, such as the 0.2-10 keV and the optical spectra (see Sections 2.1 and 2.2), point to a High Mass X-ray Binary (HMXB) identification.
In particular, although the signal-to-noise is low, the XMM-Newton spectrum in the 0.2-10 keV energy band can be modelled by an absorbed powerlaw with a spectral index =0.4, a value which is not unusual in these kinds of source (e.g. Coburn et al., 2002, and references therein).
Moreover, by using the optical dataset available for this source, we may place broad constraints to the spectral type and luminosity class of the secondary star of this system as well as to its distance.
The optical spectrum of the object (Fig. 4) points to an HMXB identification due to the presence of the Hα emission line at a redshift consistent with 0, superimposed on an intrinsically blue spectral continuum. However, the optical spectral shape appears to be largely modified by intervening reddening. This points to the presence of substantial interstellar dust along the source line of sight, which is indeed usual for Galactic HMXBs detected with INTEGRAL (see e.g. Masetti et al., 2013) and indicates that the object lies far from the Earth. Moreover, given that the equivalent width of the Hα line (4.50.4 Å) as measured from the optical spectrum of the source has a value similar to those seen in blue supergiants Leitherer (1988), we suggest this broad spectral identification for the companion star in this binary system. Also, the detection of a bright NIR counterpart for IGR J20155+3827 does favour the presence of an early type companion and, consequently, its classification as HMXB.
Unfortunately, the Gaia EDR3 photometry transformations cannot be used to determine the Johnson magnitudes for this source given that no magnitude is available in the latest data release for it. Similarly, the DR2 information is not applicable as well for this task because the colour of the object (3.280.01) is out of the range of applicability of the Gaia-to-Johnson systems photometry transformations, which is 0.5 2.75 (see the Gaia DR2 documentation mentioned in footnote 5 of Section 3.2).
Therefore, we can determine the -band absorption along the line of sight of the IGR J201553827 by using the USNO-B1.0 catalogue optical magnitudes available for this source ( 17.2–17.5, 14.1–14.6; Monet et al., 2003) and assuming an intrinsic color of 0.2 Lang (1992), which is typical of early-type stars. In this way we obtain 6.5 mag. This value is comparable, within the above approximations, to the total Galactic absorption towards IGR J201553827 ( = 5.7 mag according to Schlafly & Finkbeiner 2011) and numerically equal to the estimate of Schlegel et al. 1998. This indeed suggests that the system lies on the far side of the Galaxy with respect to Earth.
As an aside, we also note that this value is substantially lower than the one derived from the NH parameter obtained in our first X–ray fit (see Table 2), which is 30 mag (admittedly very large), according to the conversion formula of Predehl & Schmitt (1995). This justifies our decision of freezing NH to the Galactic value in our best fit of Section 2.1.
The above considerations allow us to put general constraints on the distance of the system and, consequently, on the luminosity class of the secondary star. The sky position of IGR J201553827 corresponds to the Galactic coordinates = 7590, = +192. Therefore, taking as a reference the Galaxy map reported in Figure 2 of Bodaghee et al. (2012) (see also Vallée, 2008), it emerges that this object lies in the direction of the Perseus and Cygnus arms of the Galaxy. However, because of the observed reddening, it conceivably lies within or beyond the Cygnus arm, rather than the Perseus one. This implies that the distance to the system is 8 kpc, which is compatible with the Gaia parallax estimate reported in Section 1.
In turn, given that the de-reddened -band apparent magnitude of the system is +9.0, its intrinsic absolute optical magnitude is M. This further supports the classification of the secondary star as a late O/early B spectral type of luminosity class I, i.e., a blue supergiant.
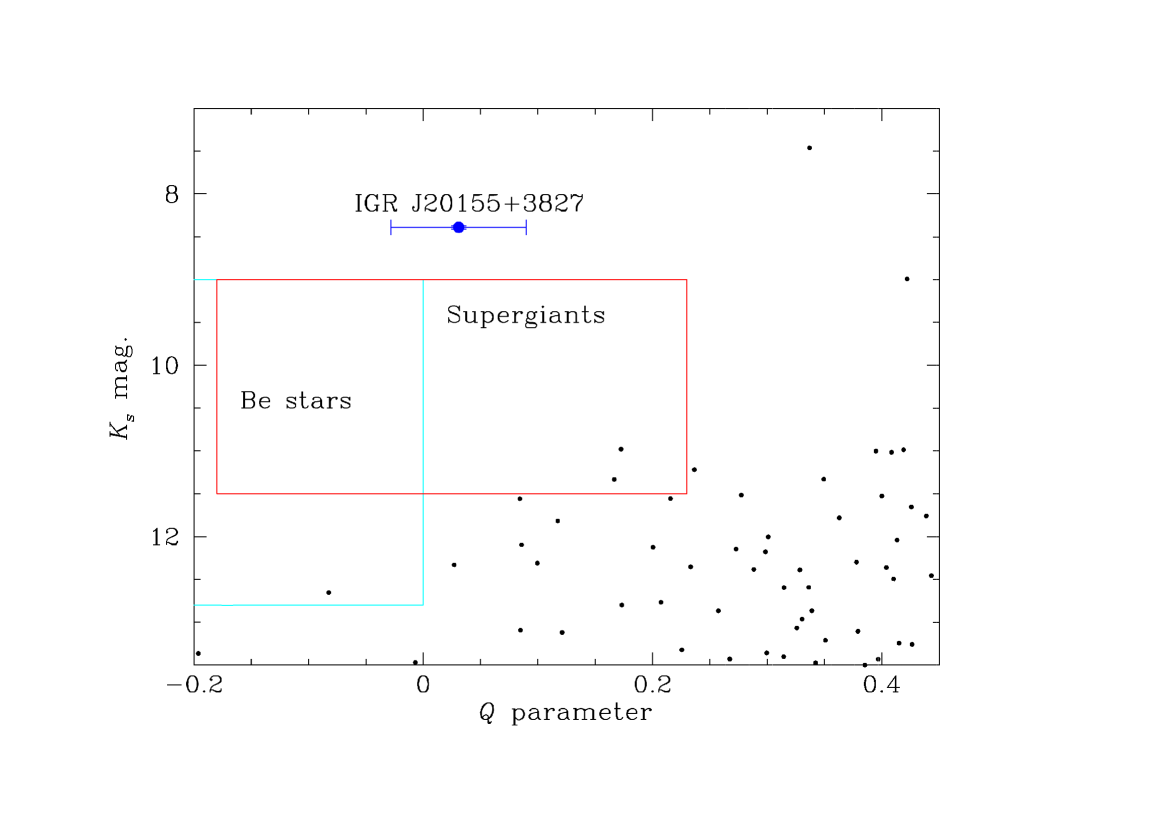
The spectral type classification proposed here for the optical counterpart of IGR J201553827 can also be tested through the -magnitude vs. parameter diagnostic diagram introduced by Comerón & Pasquali (2005) (see also Negueruela & Schurch, 2007; Reig & Milonaki, 2016). Following these authors, we can use the 2MASS NIR photometry Skrutskie et al. (2006) to compute the reddening-free parameter = which, together with the NIR magnitude, allows the construction of a diagram useful to separate early-type from late-type stars. While the latter are mostly concentrated around values =0.4–0.5 (which correspond to spectral types K to M), the early-type objects typically display 0. In Figure 11, we show the location of IGR J201553827 in the - plane, modeled following the right panel of Fig. 1 in Reig & Milonaki (2016) and constructed by using the NIR photometric information of all 2MASS objects within a box of 55′, centered on the position of the optical/NIR counterpart of IGR J201553827 and for which the magnitudes in the three bands are known accurately (i.e. with ‘AAA’ coding in the 2MASS catalogue). From the catalogued 2MASS magnitudes, we obtain a value = 0.030.06 for IGR J201553827, which allows us to place the source in the upper left quadrant of the - plane of Figure 11. The location of IGR J201553827 in this diagram falls slightly above the locus of blue supergiant stars in Reig & Milonaki (2016) but nevertheless in the region populated by this kind of objects, according to Negueruela & Schurch (2007), i.e., with 11 and 0.2, which supports our conclusions.
We also note that from the unabsorbed flux in the 0.2-10 keV band, as derived from our best fit of the XMM-Newton spectrum of IGR J201553827, and assuming a distance of d7 kpc, we obtain a luminosity of LX=(0.30.1)1034 erg s-1, whereas that observed with INTEGRAL at the outburst peak in the 17-30 keV band roughly corresponds to 1036 erg s-1. This indicates an X-ray luminosity dynamic range of 100 for IGR J20155+3827.
Finally, this system is not associated with any catalogued radio source and, in the hypothesis of an X-ray binary nature, this implies that it does not display radio-emitting collimated (jet-like) outflows, i.e. this source is not a microquasar.
4.2 The X–ray binary nature of Swift J1713.44219
The high energy properties of Swift J1713.44219 as derived from our analysis of the INTEGRAL and Swift observations, together with the ones inferred from the RXTE/PCA data reported in Krimm et al. (2009), suggest that this source is a X-ray binary. In particular, the emergence of a soft excess and the iron emission line at 6.5 keV in the XRT spectrum of MJD 58785.81 can be indicative of a transition of the source from a hard state, characterized by the emission from the corona, toward a soft state, where the X–ray reflection from an accretion disk produces the iron line at 6.5 keV, which in turn indicates that the line photons are emitted by neutral or low-ionization iron atoms. However, this high energy data-set does not allow us to uniquely derive the nature of the compact object (WD, BH or NS), as the iron line emission is observed both in LMXBs and CVs (e.g., Asai et al., 2000; Cackett et al., 2009).
The lower-energy counterpart of Swift J1713.44219, star A of Baglio et al. (2019), besides being the only optical source inside the subarcsecond Chandra X–ray error circle, presents substantial variability when one compares the - and -band magnitudes acquired in outburst and in quiescence, reported in Table 5 and in the Appendix.
All this evidence suggests that this object is the actual optical counterpart of Swift J1713.44219. Moreover, the red colours of the source, its low optical/NIR luminosity in quiescence and its location towards the Galactic bulge ( = 345283, = 1986) are compatible with a transient LMXB nature. The large (1 mag) excursion of the NIR brightness between outburst and quiescence suggests a (late-type) dwarf star as secondary component of the system.
Assuming a very conservative lower limit 18 for the quiescent magnitude of Swift J1713.44219, a M0 V spectral type for the companion star in this system, an absolute magnitude of M +9.0 Lang (1992), a = +3.29 color Ducati et al. (2001) for this classification, and a Galactic absorption = 0.65 mag Schlafly & Finkbeiner (2011) (compatible with the best-fit NH value from the X–ray spectroscopic data of Section 3.1.1), we obtain a lower limit for distance to the source of 2.8 kpc. Instead, considering an M5 (K0) dwarf as the mass donor star, this limit changes to 1.4 kpc ( 5.2 kpc). Looking at these numbers, and at the compatibility between our best-fit column density and the total line-of-sight Galactic absorption, we favor an early K dwarf as the secondary star in this binary; this consideration can however be revised once a detection of the quiescent magnitude of the source is achieved.
Finally, from the unabsorbed flux of F1.310-9 erg cm-2 s-1 , as derived in the spectral analysis of INTEGRAL data, and assuming the distance of the system 5 kpc, we obtain a upper limit for the luminosity in outburst of L 41036erg s-1. From the soft state unabsorbed flux in the 0.2-10 keV, we derive a luminosity of L0.2-10keV = 3.61035erg s-1. These values are fully compatible with what is generally observed in a LMXB system during outburst (see e.g. Tanaka & Shibazaki, 1996), but admittedly too large for a CV (e.g., Brunschweiger et al., 2009; Yuasa et al., 2010; de Martino et al., 2020).
5 Conclusion
We have analysed the multi-wavelength dataset available for two poorly studied X–ray transients, IGR J201553827 and Swift J1713.44219, with the aim to pinpoint their nature.
From the analysis of the XMM-Newton archival data available for IGR J201553827 in combination with our Cassini/BFOSC spectroscopic observations of its optical counterpart and the archival optical/NIR photometric data, we have been able to classify this X-ray transient as a distant HMXB. In particular, our analysis implies a distance of the system of 7 kpc and a blue supergiant classification for the secondary star.
The data collected for Swift J1713.44219, instead, suggest a LMXB transient nature; a CV nature cannot be excluded, albeit this interpretation appears quite unlikely on X-ray luminosity grounds. Indeed, our INTEGRAL observations together with the archival XRT dataset have shown the emergence of a soft excess and an iron line at 6.5 keV in the X-ray spectrum taken after the end of the X-ray outburst detected by BAT and IBIS/ISGRI in 2019. Moreover, the observed VVV and LCO magnitudes obtained for the Swift J1713.44219 optical/NIR counterpart, the variability between quiescence and outburst phases, the location towards the Galactic Bulge and the red colours of the source suggest a late-type dwarf classification for the secondary star.
Acknowledgements
We thank the referee for several useful comments that allowed us to improve this paper.
This work has made use of data from the European Space Agency (ESA) mission Gaia (https://www.cosmos.esa.int/gaia), processed by the Gaia Data Processing and Analysis Consortium (DPAC, https://www.cosmos.esa.int/web/gaia/dpac/consortium). Funding for the DPAC has been provided by national institutions, in particular the institutions participating in the Gaia Multilateral Agreement.
We thank the Loiano Observatory staff (Ivan Bruni, Antonio De Blasi and Roberto Gualandi) for the assistance during the optical observations.
We acknowledge the ASI financial/programmatic support via ASI-INAF agreements n.2019-35-HH.0 and n.2017-14-H.0; we also acknowledge the ‘INAF Mainstream’ project on the same subject.
F.O. acknowledges the support of the H2020 European Hemera program, grant agreement No 730970, and the support of the GRAWITA/PRIN-MIUR project: "The new frontier of the Multi-Messenger Astrophysics: follow-up of electromagnetic transient counterparts of gravitational wave sources".
This research has made use of the services of the ESO Science Archive Facility and data products from the Vista Science Archive (VSA). Based on observations collected at the European Southern Observatory under ESO programme 179.B-2002 (PI: D. Minniti).
Data availability
The data underlying this article are available in the article and in its online supplementary material. The INTEGRAL data are publicity available on http://gps.iaps.inaf.it
References
- Arnaud (1996) Arnaud K. A., 1996, in Jacoby G. H., Barnes J., eds, Astronomical Society of the Pacific Conference Series Vol. 101, Astronomical Data Analysis Software and Systems V. p. 17
- Asai et al. (2000) Asai K., Dotani T., Nagase F., Mitsuda K., 2000, ApJS, 131, 571
- Baglio et al. (2019) Baglio M. C., Coti Zelati F., Russell D. M., Lewis F., Saikia P., 2019, The Astronomer’s Telegram, 13226, 1
- Bailer-Jones et al. (2018) Bailer-Jones C. A. L., Rybizki J., Fouesneau M., Mantelet G., Andrae R., 2018, AJ, 156, 58
- Bailer-Jones et al. (2020) Bailer-Jones C. A. L., Rybizki J., Fouesneau M., Demleitner M., Andrae R., 2020, arXiv e-prints, p. arXiv:2012.05220
- Barthelmy et al. (2005) Barthelmy S. D., et al., 2005, Space Sci. Rev., 120, 143
- Bernardini et al. (2013) Bernardini F., et al., 2013, MNRAS, 435, 2822
- Bird et al. (2010) Bird A. J., et al., 2010, ApJS, 186, 1
- Bird et al. (2016) Bird A. J., et al., 2016, ApJS, 223, 15
- Bodaghee et al. (2012) Bodaghee A., Tomsick J. A., Rodriguez J., James J. B., 2012, ApJ, 744, 108
- Brunschweiger et al. (2009) Brunschweiger J., Greiner J., Ajello M., Osborne J., 2009, A&A, 496, 121
- Cackett et al. (2009) Cackett E. M., et al., 2009, ApJ, 690, 1847
- Chakrabarty et al. (2019) Chakrabarty D., Jonker P. G., Markwardt C. B., 2019, The Astronomer’s Telegram, 13247, 1
- Coburn et al. (2002) Coburn W., Heindl W. A., Rothschild R. E., Gruber D. E., Kreykenbohm I., Wilms J., Kretschmar P., Staubert R., 2002, ApJ, 580, 394
- Comerón & Pasquali (2005) Comerón F., Pasquali A., 2005, A&A, 430, 541
- Courvoisier et al. (2003) Courvoisier T. J.-L., et al., 2003, A&A, 411, L53
- Ducati et al. (2001) Ducati J. R., Bevilacqua C. M., Rembold S. r. B., Ribeiro D., 2001, ApJ, 558, 309
- Fabricius & Makarov (2000) Fabricius C., Makarov V. V., 2000, A&A, 356, 141
- Fortin et al. (2018) Fortin F., Chaty S., Coleiro A., Tomsick J. A., Nitschelm C. H. R., 2018, A&A, 618, A150
- Gaia Collaboration et al. (2016a) Gaia Collaboration et al., 2016a, A&A, 595, A1
- Gaia Collaboration et al. (2016b) Gaia Collaboration et al., 2016b, A&A, 595, A2
- Gaia Collaboration et al. (2018) Gaia Collaboration et al., 2018, A&A, 616, A1
- Gehrels et al. (2004) Gehrels N., et al., 2004, ApJ, 611, 1005
- Girard et al. (2019) Girard J. N., Tremou E., Corbel S., Fender R., Woudt P., Miller-Jones J., 2019, The Astronomer’s Telegram, 13250, 1
- HI4PI Collaboration et al. (2016) HI4PI Collaboration et al., 2016, A&A, 594, A116
- Horne (1986) Horne K., 1986, PASP, 98, 609
- Karasev et al. (2018) Karasev D. I., et al., 2018, Astronomy Letters, 44, 522
- Krimm et al. (2009) Krimm H. A., et al., 2009, The Astronomer’s Telegram, 2300, 1
- Landi et al. (2017) Landi R., et al., 2017, MNRAS, 470, 1107
- Lang (1992) Lang K. R., 1992, Astrophysical Data I. Planets and Stars.
- Leitherer (1988) Leitherer C., 1988, ApJ, 326, 356
- Levine et al. (1984) Levine A. M., et al., 1984, ApJS, 54, 581
- Lund et al. (2003) Lund N., et al., 2003, A&A, 411, L231
- Marchesini et al. (2019) Marchesini E. J., et al., 2019, Ap&SS, 364, 153
- Masetti et al. (2013) Masetti N., et al., 2013, A&A, 556, A120
- Minniti et al. (2010) Minniti D., et al., 2010, New Astron., 15, 433
- Monet et al. (2003) Monet D. G., et al., 2003, AJ, 125, 984
- Negueruela & Schurch (2007) Negueruela I., Schurch M. P. E., 2007, A&A, 461, 631
- Oh et al. (2018) Oh K., et al., 2018, ApJS, 235, 4
- Onori et al. (2019) Onori F., et al., 2019, The Astronomer’s Telegram, 13169, 1
- Parisi et al. (2014) Parisi P., et al., 2014, A&A, 561, A67
- Predehl & Schmitt (1995) Predehl P., Schmitt J. H. M. M., 1995, A&A, 500, 459
- Rahoui et al. (2008) Rahoui F., Chaty S., Lagage P. O., Pantin E., 2008, A&A, 484, 801
- Reig & Milonaki (2016) Reig P., Milonaki F., 2016, A&A, 594, A45
- Revnivtsev et al. (2004) Revnivtsev M. G., Sunyaev R. A., Gilfanov M. R., Churazov E. M., Goldwurm A., Paul J., Mandrou P., Roques J. P., 2004, Astronomy Letters, 30, 527
- Riello et al. (2018) Riello M., et al., 2018, A&A, 616, A3
- Riello et al. (2020) Riello M., et al., 2020, arXiv e-prints, p. arXiv:2012.01916
- Rodriguez et al. (2010) Rodriguez J., Tomsick J. A., Bodaghee A., 2010, A&A, 517, A14
- Rojas et al. (2017) Rojas A. F., et al., 2017, A&A, 602, A124
- Saxton et al. (2008) Saxton R. D., Read A. M., Esquej P., Freyberg M. J., Altieri B., Bermejo D., 2008, A&A, 480, 611
- Schlafly & Finkbeiner (2011) Schlafly E. F., Finkbeiner D. P., 2011, ApJ, 737, 103
- Schlegel et al. (1998) Schlegel D. J., Finkbeiner D. P., Davis M., 1998, ApJ, 500, 525
- Skrutskie et al. (2006) Skrutskie M. F., et al., 2006, AJ, 131, 1163
- Tanaka & Shibazaki (1996) Tanaka Y., Shibazaki N., 1996, ARA&A, 34, 607
- Tomsick et al. (2008) Tomsick J. A., Chaty S., Rodriguez J., Walter R., Kaaret P., 2008, ApJ, 685, 1143
- Tomsick et al. (2016) Tomsick J. A., Krivonos R., Wang Q., Bodaghee A., Chaty S., Rahoui F., Rodriguez J., Fornasini F. M., 2016, ApJ, 816, 38
- Tomsick et al. (2020) Tomsick J. A., et al., 2020, ApJ, 889, 53
- Ubertini et al. (2003) Ubertini P., et al., 2003, A&A, 411, L131
- Vallée (2008) Vallée J. P., 2008, ApJ, 681, 303
- Webb et al. (2020) Webb N. A., et al., 2020, A&A, 641, A136
- White et al. (1983) White N. E., Swank J. H., Holt S. S., 1983, ApJ, 270, 711
- Winkler et al. (2003) Winkler C., et al., 2003, A&A, 411, L1
- Yuasa et al. (2010) Yuasa T., Nakazawa K., Makishima K., Saitou K., Ishida M., Ebisawa K., Mori H., Yamada S., 2010, A&A, 520, A25
- de Martino et al. (2020) de Martino D., Bernardini F., Mukai K., Falanga M., Masetti N., 2020, Advances in Space Research, 66, 1209
Appendix A VVV survey photometry
| Date | time | MJD | exptime | |||
|---|---|---|---|---|---|---|
| (UT) | (days) | (s) | (Vega mag) | (Vega mag) | (Vega mag) | |
| (1) | (2) | (3) | (4) | (5) | (6) | (7) |
| 2010-03-06 | 09:22:51 | 55261.39 | 48 | 17.625 | ||
| 2010-03-29 | 06:39:20 | 55284.28 | 240 | 16.764 0.112 | 17.830 0.082 | 17.189 0.104 |
| 2011-05-12 | 07:44:33 | 55693.32 | 48 | 17.545 | ||
| 2011-05-13 | 09:14:49 | 55694.39 | 48 | 17.474 | ||
| 2011-05-14 | 09:50:33 | 55695.41 | 48 | 17.539 | ||
| 2011-05-16 | 06:56:22 | 55697.29 | 48 | 17.668 | ||
| 2011-05-17 | 08:22:48 | 55698.35 | 48 | 17.647 | ||
| 2011-05-28 | 08:03:44 | 55709.34 | 48 | 17.457 | ||
| 2011-05-30 | 07:22:08 | 55711.31 | 44 | 17.414 | ||
| 2011-08-23 | 01:03:47 | 55796.04 | 48 | 17.262 | ||
| 2011-09-06 | 02:39:13 | 55810.11 | 48 | 17.497 | ||
| 2011-10-08 | 00:34:46 | 55842.02 | 48 | 17.615 | ||
| 2012-06-12 | 04:39:57 | 56090.19 | 48 | 17.703 | ||
| 2012-06-18 | 01:57:33 | 56096.08 | 48 | 17.502 | ||
| 2012-06-25 | 23:47:12 | 56103.99 | 48 | 17.543 | ||
| 2012-06-27 | 00:41:17 | 56105.03 | 48 | 17.308 | ||
| 2012-07-03 | 01:01:45 | 56111.04 | 48 | 17.464 | ||
| 2012-07-05 | 23:57:11 | 56114.00 | 48 | 17.610 | ||
| 2012-07-08 | 01:21:18 | 56116.06 | 48 | 17.695 | ||
| 2012-07-18 | 05:03:31 | 56126.21 | 48 | 17.608 | ||
| 2012-07-19 | 05:20:43 | 56127.22 | 48 | 17.553 | ||
| 2013-06-24 | 07:06:30 | 56467.30 | 48 | 16.992 0.244 | ||
| 2013-06-27 | 04:54:27 | 56470.20 | 48 | 17.204 0.248 | ||
| 2013-06-28 | 02:32:56 | 56471.11 | 48 | 16.942 0.192 | ||
| 2013-06-30 | 03:08:19 | 56473.13 | 48 | 16.730 0.142 | ||
| 2013-07-02 | 04:15:05 | 56475.18 | 48 | 16.842 0.178 | ||
| 2013-07-11 | 02:21:33 | 56484.10 | 48 | 17.050 0.211 | ||
| 2013-07-24 | 05:19:26 | 56497.22 | 48 | 17.282 | ||
| 2013-07-25 | 01:52:29 | 56498.08 | 48 | 16.845 0.204 | ||
| 2013-07-28 | 03:07:49 | 56501.13 | 48 | 16.997 0.230 | ||
| 2013-07-28 | 03:56:30 | 56501.16 | 48 | 16.821 0.189 | ||
| 2013-08-07 | 01:00:32 | 56511.04 | 48 | 17.184 0.295 | ||
| 2013-08-08 | 01:34:34 | 56512.07 | 48 | 16.968 0.223 | ||
| 2013-08-08 | 04:16:39 | 56512.18 | 48 | 16.981 0.213 | ||
| 2013-08-09 | 01:29:53 | 56513.06 | 48 | 16.876 0.229 | ||
| 2013-08-09 | 03:19:17 | 56513.14 | 48 | 17.088 0.264 | ||
| 2013-08-17 | 00:20:04 | 56521.01 | 48 | 17.216 0.272 | ||
| 2013-08-17 | 01:49:43 | 56521.08 | 48 | 17.072 0.228 | ||
| 2013-08-18 | 00:02:16 | 56522.00 | 48 | 17.080 0.247 | ||
| 2013-08-20 | 02:57:00 | 56524.12 | 48 | 17.083 0.234 | ||
| 2013-08-21 | 00:34:20 | 56525.02 | 48 | 17.415 0.336 | ||
| 2013-08-21 | 02:36:33 | 56525.11 | 48 | 17.366 0.301 | ||
| 2013-08-22 | 01:53:11 | 56526.08 | 48 | 17.118 0.232 | ||
| 2013-08-23 | 00:58:23 | 56527.04 | 48 | 17.077 0.228 | ||
| 2013-09-02 | 00:04:08 | 56537.00 | 48 | 17.413 | ||
| 2014-07-12 | 01:17:27 | 56850.05 | 48 | 17.515 | ||
| 2014-08-08 | 23:42:35 | 56877.99 | 48 | 17.575 | ||
| 2014-08-09 | 01:03:40 | 56878.04 | 48 | 17.294 | ||
| 2014-08-14 | 01:17:39 | 56883.05 | 48 | 17.469 | ||
| 2014-08-21 | 01:13:44 | 56890.05 | 48 | 17.576 | ||
| 2014-08-21 | 03:54:22 | 56890.16 | 48 | 17.535 | ||
| 2015-03-01 | 08:34:36 | 57082.36 | 48 | 17.270 | ||
| 2015-07-26 | 02:01:12 | 57229.08 | 48 | 16.889 0.277 | ||
| 2015-07-26 | 02:35:39 | 57229.11 | 48 | 16.682 0.270 | ||
| 2015-07-26 | 02:51:41 | 57229.12 | 48 | 16.652 0.236 | ||
| 2015-07-29 | 03:24:35 | 57232.14 | 48 | 17.371 | ||
| 2015-08-14 | 00:51:03 | 57248.04 | 240 | 17.266 0.130 | 17.985 0.120 | 17.316 0.125 |
| 2015-08-14 | 00:52:10 | 57248.04 | 240 | 17.985 0.120 | 17.979 0.129 | 17.265 0.130 |