Measurement of ion displacement via RF power variation for excess micromotion compensation
Abstract
We demonstrate a method of micromotion minimization of a trapped ion in a linear Paul trap based on the precision measurement of the ion trapping position displacement due to a stray electric field in the radial plane by ion fluorescence imaging. The amount of displacement in the radial plane is proportional to the strength of a stray electric field. Therefore, we evaluated the micromotion compensation condition by measuring the ion displacements from the ion equilibrium position using two different radial trap frequencies with various combinations of the compensation voltage. The residual electric field uncertainty of this technique reached a few volts per meter. This compensation technique does not depend on the orientation of the incident cooling laser or the detuning and imaging direction. Therefore, this method is suitable for a planar ion trap, a stylus ion trap, which limits the propagation angle of lasers, or miniaturized ion trap systems for sensing and metrological applications.
I Introduction
A laser-cooled ion stored in an ion trap is a valuable platform for developing devices based on quantum phenomena. A single to several trapped ions in a vacuum, considered as a well-isolated system, is used in the development of quantum techniques, especially quantum computing, quantum simulation, and quantum sensing. The design and architecture of an ion trap have been investigated to optimize scaling up the number of entangling ions or enable miniaturization. Examples of ingenious ion traps for quantum devices include the segmented ion trap[1], microfabricated ion trap[2, 3], planar trap[4, 5], and stylus trap[6, 7].
An ion in a Paul trap has a motional mode directly driven by the RF electric field that confines the ion in a harmonic potential in terms of pseudopotential approximation, so-called micromotion[8], regardless of the complexity of the trap architecture. Because micromotion minimization has a strong relationship with the ion trap’s performance, micromotion compensation is a necessary and essential initial procedure for utilizing trapped ions for precise quantum level manipulation. Therefore, several compensation methods have been developed. These compensation procedures are characterized by an indicator of excess micromotion, and include motional sideband spectroscopy[9, 10], RF-photon correlation[8, 11], parametric excitation[12, 13], atomic loss due to atom-ion collisions[14], and ion trajectory[15].
This paper demonstrates a micromotion minimization method based on ion position detection with two different trap confinement variations. In an ideal case, an ion in a Paul trap is stored at the RF null point due to the trap RF electric field, while in general, an unexpected stray electric field shifts the equilibrium position from the RF null point. The strength of the stray electric field can be evaluated from the measurement of the ion displacement due to two different radial confinements. Minimization of the ion displacement gives us the micromotion well-compensated codition. Finally, we obtain a residual electric field uncertainty of a few volts per meter by our compensation measurement.
The method introduced in this study does not depend on the orientation of the incident cooling laser or its detuning and imaging direction. Therefore this technique is suitable for various ion trap architectures, including planar traps, and miniaturized ion trap systems for metrological applications, which have structural limitations for an incident laser. Furthermore, this method does not require any stable lasers to excite the narrow transition for sideband spectroscopy or any high-speed measuring instruments to detect photon emission timing for RF-photon correlation measurements. Only a conventional ion fluorescence imaging system is required to determine the ion trapping position. By comparison with the compensation method of ion trajectory [15], which requires continuous scanning of the RF amplitude, our method is simple and convenient because we seek the RF null from two different RF amplitudes. While this compensation method relies on ion fluorescence images, the residual electric field’s limitation is carried out by the resolution of ion images in principle. We also mention systematic error due to forces other than the electric field; thus, our imaging resolution of ion position sensing reached a sensitivity of 125 . This is comparable to the scattering force of the cooling laser.
II Theory and Method
In this section, we introduce the theoretical treatment of micromotion in a linear Paul trap and the concept of our micromotion minimization technique.
We provide an overview of the trapped single ion motion in a conventional linear Paul trap. Micromotion in a linear Paul trap arises in a radial plane in an ideal case. Therefore, we describe the ion motion only in a radial plane for brevity. An equation of motion of a single ion that has mass and charge in a linear Paul trap can be described as
| (1) |
where is time, is the ion position, and indicates the Cartesian coordinate in the radial plane. The and are usually called the trapping parameters and can be determined by the mass of the ion, the ion trap geometric condition, and the applied voltage to the electrodes. is the stray electric field and is assumed to be a static and uniform electric field in the region of the trapped ion.
The solution of Eq.(1), which is called the Mathieu equation, in the case where is approximately
| (2) |
where
| (3) |
Here, and are determined by the initial condition of the ion. The secular frequency is described as .
From Eq.(2), the ion motion is characterized by two frequencies: one is that of the motion in a harmonic potential commonly called secular motion, and the other is the micromotion following the RF frequency .
The term in Eq.(2) that is dependent on the stray electric field shows the equilibrium position of the ion from the RF node. In the case of stray electric field , a trapped ion is confined at the RF node. In such a well-compensated condition, the ion’s motional energy can be minimized by the laser cooling technique. A non-negligible stray electric field shifts the ion trapping position given by Eq.(3) from the RF node. This positional shift arises from a motion driven by the RF electric field, which is called excess micromotion. This excess micromotion cannot be significantly reduced by laser cooling because it synchronizes with the RF period, and energy transfer between the ion and RF electric field always exists in a single RF period[8]. Thus, to minimize the ion motional energy in the ion trap, the external electric field should be applied to reduce the stray electric field and compensate for the trapping position of the ion in two dimensions.
Excess micromotion can arise not only from a finite stray electric field, such as one caused by a charged insulator, for example, but also from RF phase mismatching between the electrodes or geometric distortion of the ion trap. However, we will not consider these factors here.
Next, we discuss the trapping position shift of the ion from the RF node due to the stray electric field in relation to trap confinement. From Eq.(3), the ion’s trapping position is described by an equilibrium of the spring force resulting from the pseudopotential and the electrostatic force of the stray field. Therefore, the ion trapping position is close to the RF node with asymptotically increasing RF confinement. In case of infinite trap confinement , the trapping position of the ion is coincident with the RF node under the condition of a finite stray electric field .
Let us assume two different trap confinements and . Then the ion displacement between the two different trapping positions can be written as
| (4) |
This equation shows that the stray electric field is detectable by measuring the ion displacement due to the two different trap frequencies. The ion displacement is proportional to the stray electric field; thus, the ion displacement becomes zero when the stray electric field is reduced by applying another external electric field for compensation.
The ion displacement in Eq.(4) is represented in one dimension. Therefore, yields the ion displacement in the radial plane.
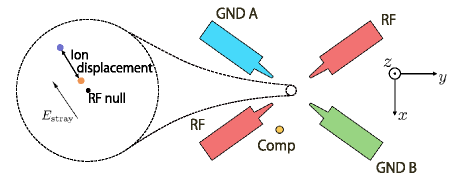
Our compensation method concept is based on measuring the ion displacement due to the difference in the ion confinement in the radial plane (see the left side of Fig1). Moreover, we determine the trap condition in which the trapping position does not change with RF power variation by applying an external electric field.
An external force can also cause the trapping position to shift due to the light pressure of the Doppler cooling laser or gravity, for example. These external forces can cause systematic errors in micromotion compensation. Therefore we have to manage these forces carefully for the precise detection of the RF node. On the other hand, this fact shows that the detection of the trapping position can also be used as a small force sensor.
III Experimental Setup
In this study, we used a conventional linear Paul trap that has nine electrodes (two RF electrodes, two RF ground (GND) electrodes, four END electrodes, and a Comp electrode for compensation of ion position). The schematic diagram of our linear ion trap seen from the axial direction is shown in the right side of Fig. 1. Radial confinement was realized by two RF electrodes and two GND electrodes (shown as RF, GND A, and GND B in Fig.1). DC voltage was applied to four END electrodes, which are attached to the front and back of the GND electrodes along the direction to achieve axial trap confinement.
Neutral ytterbium vapor from an atomic oven was photoionized by and lasers and then a single ion was trapped at the center of the ion trap. The trapped single ion was cooled by Doppler cooling of the – transition using a cooling laser and a repumping laser. We also irradiated laser to pump out the ion in state to the cooling cycle. These lasers were overlapped and co-propagated through the trap center along the axial direction. Another set of cooling and repumping lasers was incident through the trap center in the - plane to cool the radial ion motion efficiently.
In typical trapping conditions, we drove the RF electrodes using a helical resonator with at a resonance frequency of . The radial secular trap frequency was . We also applied to the END electrodes, and the secular frequency along the direction was . We deliberately applied modulation voltage superposing to the GND A or END electrode and excited the secular ion motion to independently measure the trap frequency. In our proposed micromotion minimization method, we trapped the ion in several radial trap confinement conditions by changing the RF power applied to the helical resonator.
To compensate the excess micromotion in the radial plane, we applied additional compensation voltages and to the electrodes GND A and Comp (colored blue and yellow in Fig.1), respectively. The GND A and Comp electrodes were aligned from the trap center at counterclockwise with respect to axis and at clockwise with respect to the axis, respectively. Each electrode and the trap center made an angle of . Applying DC voltages to these electrodes created a static and approximately uniform electric field around the trap center in each direction.
The ion fluorescence from – transition due to the laser cooling cycle was collected by an objective lens installed at the top of the ion trap in Fig.1. Because our imaging system captured the fluorescence image in the – plane, we estimated the ion position in direction by imaging the lens position when an ion image was in focus[15]. Ion images were acquired around the focus position typically while scanning the imaging lens mounted on the motorized stage. The objective lens for imaging the ion, which had a numerical aperture of 0.28, was mounted on a piezo motor stage and the focusing lens was positioned along the direction. The gathered fluorescence light propagated along the axis and reached an electron-multiplying charge-coupled device (EMCCD) camera and a photomultiplier tube (PMT). The imaging magnification of our imaging system was 27.0, and the estimated collection efficiency of emitted photons from the ion was . Finally, approximately of the photons collected by the lens could reach the EMCCD camera.
IV Result
IV.1 Measurement of ion position in radial plane
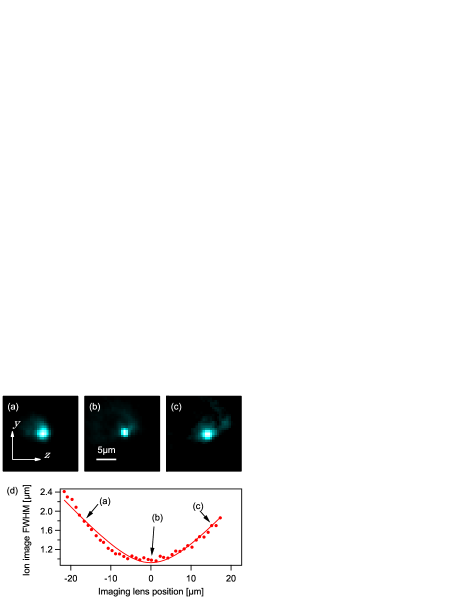
To compensate for the excess micromotion caused by a stray electric field based on ion displacement due to trap confinement variation, we measured the two-dimensional ion position in the radial plane, namely the - plane in our system. Figure 2 shows a typical result of ion position measurement. Each fluorescence image in Fig.2(a–c) was captured during accumulation of emitting photons from an ion; furthermore, it was fitted by Gaussian to estimate the position in direction and width of the ion image. The width of the ion image as a function of imaging lens position is illustrated in Fig.2(d). We determined the focus position by fitting these data using an equation of the Gaussian beam waist and deducing the position in the direction. The absolute position of an ion in the radial plane was measured using this procedure.
The absolute position in the direction had a few micrometer systematic error in each scanning sequence, caused by lack of piezo motor stage position repeatability. To avoid this crucial error, we measured the ion position in different radial confinements in a single scan of the stage.
IV.2 Two dimensional ion displacement
We measured the trapping position of an ion at two different radial trap confinements using the method described in Section II. These two equilibrium points yielded the ion displacement at the compensation condition derived from the voltage applied to electrodes GND A and Comp. To detect and minimize micromotion, we scanned the compensation voltage two-dimensionally and measured the ion displacement.
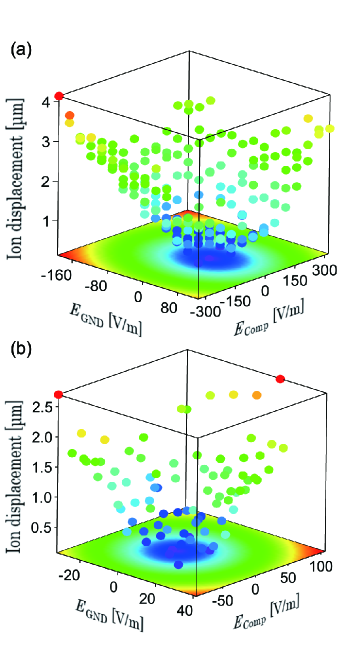
Figure 3 shows ion displacement measurement results for determining the optimum trap condition. , axes show the induced electric field around the small region of the trap center derived by applying a voltage to the GND A and Comp electrode, respectively. This electric field for compensation was calibrated from the other measurements by detecting the equilibrium position with the varying voltage applied to the GND A or Comp electrode. Each point represents the observed ion displacement at each compensation electric field combination. This ion displacement was induced by varying the radial trap frequency with a finite stray electric field condition. Therefore, we realized a change in the trap frequency by tuning the RF power applied to the RF electrodes.
The ion displacement measurement with RF power variation is shown in Fig.3(a). This RF power change corresponds to variation of the radial trap frequencies. This result clearly shows the cone shape expected from Eq.4 and an intensity profile on the bottom of the graph displays a fitted outcome by a cone function. We estimated the residual stray electric field uncertainty of from this measurement.
To reveal the optimum trap condition more precisely, we investigated the same measurement with a larger RF power variation of with smaller scanning of the electric field for compensation, and the result is displayed in Fig.3(b). In this measurement, we changed the radial confinement of to evaluate the ion displacement. was obtained from this result. The residual stray electric field uncertainty improved compared to the result of the RF power variation because the ion displacement becomes sensitive by tuning the magnitude of the RF power variation.
This tunable sensitivity of micromotion compensation is a notable point of this method because we can seek a compensated condition step by step to suit the current trap situation. Therefore, we expect that a better residual electric field can be obtained by decreasing the lower limit of radial confinement. However, this is restricted by the instability of an ion with less than of radial trap confinement in our system. This trap instability could be caused by a radial trap frequency lower than the axial one, micromotion induced by other factors (e.g., geometrical distortion of an ion trap), micromotion in the axial direction due to the breakdown of an ion trap translational symmetry, or a combination of these elements.
The optimum condition of the ion trap can be determined instinctively and simply from Fig.3 because the minimum ion displacement condition is represented in the two-dimensional parameter space that corresponds to electric fields canceling out the stray electric field in the two-dimensional radial plane. This easy-to-recognize representation is one of the advantages of this compensation technique compared to the other techniques based on ion position sensing. Moreover, only an imaging system of ion fluorescence is required to introduce this compensation measurement. This convenience is another advantage of this technique. From the point of view of sensitivity, the obtained uncertainty of the residual electric field is not smaller than but comparable to that of other reported techniques[16].
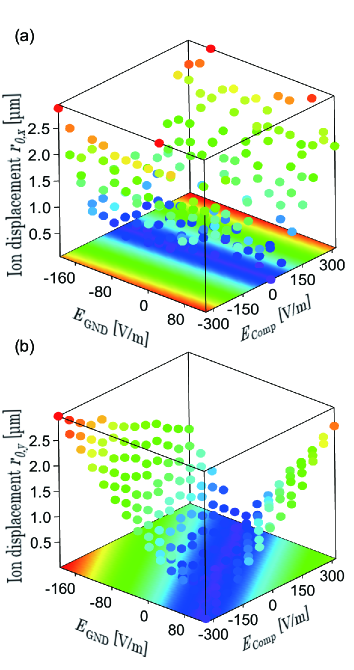
Because the ion displacements were evaluated by two absolute equilibrium points of an ion in the radial plane, we can analyze the ion displacements in the respective axes of and , which are shown in Fig.4(a) and (b), respectively. The measured data are indicated as the plots, and the intensity plot at the bottom represents fitting by a valley shape function. The valley bottoms of the results in Fig.4(a) and (b) show the micromotion-minimized position in the and directions, respectively. This line represents the nodal line of the RF electric field near the trap center along the or direction, and the geometry of the ion trap determines the slope of the line. Because the valley bottom of each direction only has a sensitivity for the respective axis, the intersection of these two lines coincides with the two-dimensional micromotion-minimized condition of Fig.3. A similar situation occurs in the RF-photon correlation method, which is only sensitive to micromotion in a projection direction to the radial plane of the incident cooling laser.
The data of are noisier than the data of by comparison between Fig.4(a) and (b). This is caused by the low accuracy of ion position determination in the imaging depth () direction compared to that in the imaging plane ( and directions). Because an angle between near the trap center and the axis is supposed to be small from the trap geometry, the shifts of the equilibrium positions induced by are nearly along direction. It is reasonable that the value of the residual stray electric field uncertainty in direction is larger than that in the direction.
IV.3 Limitation of detecting residual micromotion
Next, to reveal the performance of this measurement method, the sensitivity and the limitation of detecting residual micromotion are discussed. We also mention the equilibrium position shift due to forces other than the electric field. These unexpected shifts may induce systematic error for micromotion minimization in the case of the compensation method based on ion position detection.
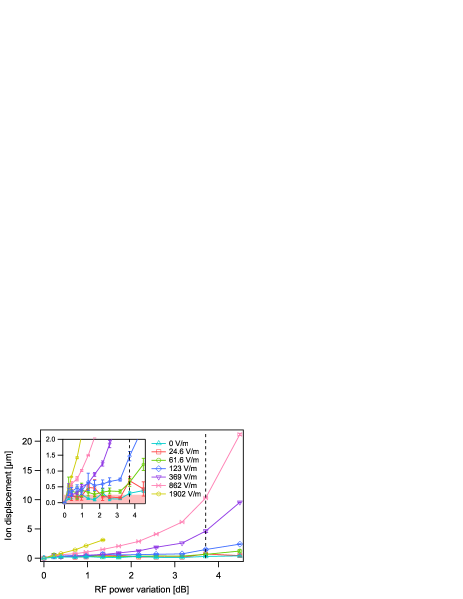
We evaluated the magnitude of the RF power variation dependence of the two-dimensional ion displacement of with the various static electric fields in Fig.5. In this measurement, to change the magnitude of the RF power variation, the higher trap frequencies were fixed, and only the lower frequencies were tuned. We started measuring the ion displacements at RF null in the radial plane determined by the procedure discussed above (data set of ) and applied the electric field by tuning . The RF power variation corresponding to the condition in Fig.3(a) is shown as the black dashed line and the inset displays a small region of the vertical axis.
The ion displacements increased along the horizontal axis because the large equilibrium position shift was derived by low trap confinement. This result shows the sensitivity of this method in terms of distinguishable residual micromotion at each RF power variation in our system. It is evident that a better residual stray electric field uncertainty can be achieved by lowering the trap confinement for measuring the ion displacement. The red shaded area in the inset indicates the uncertainty of the ion displacement determination measurement. Therefore, the plots in the shaded area cannot be distinguished from one another. The accuracy of the ion position measurement is mainly determined by a focal point measurement (namely, a position measurement in the direction) in the current situation because the typical uncertainty of a focal point is more than one order of magnitude larger than that in the imaging plane. The uncertainty of a focal point depends on the depth of the field. Thus, we can improve the accuracy of a focal point measurement by replacing the imaging lens with one having a smaller focal length and larger numerical aperture. In principle, this is restricted by the Rayleigh length. On the other hand, the limitation of ion position determination in the imaging plane (namely, the and directions) depends on the imaging resolution. The calculated localized area of an ion in the ion trap is much smaller than the ion image width at the focal point (typical value is about ; refer to Fig.2(d)). Therefore, the current imaging resolution is approximately , and it can be reduced approximately by a factor of in terms of the diffraction limit. To sum up, measuring ion displacement with a considerable RF power variation and accuracy of the ion position determination are crucial for this micromotion minimization technique.
Finally, we mention the equilibrium position shift of an ion due to forces other than the electric field. The detectable minimum ion displacements of , , and by our imaging system are approximately , , and , respectively (the minimum detectable corresponds to the red shaded area in the inset of Fig.5). This detectable minimum ion displacement is equivalent to an ion displacement due to a force of , , at trap frequency. This detection limit is one order of magnitude larger than that reported in the previous work[17]. We do not have to consider the shift in ion equilibrium position due to gravity because the gravitational force for a single ytterbium ion is . On the other hand, we must consider the light pressure due to the cooling laser. The calculated light pressure is about assuming the – transition of ion, in which the cooling laser is half red detuned of the line width from the resonance and the saturation parameter is equal to ten. Therefore, we can ignore the ion position shift due to the cooling laser along the direction. In contrast, the shift in the direction is comparable to the accuracy of the ion position determination in the imaging plane. This can cause a systematic error in the determination of ion position if the cooling laser intensity or detuning fluctuates.
V Conclusion
In conclusion, we have developed and demonstrated a simple method for minimizing the excess micromotion in a linear Paul trap based on measuring the ion displacement due to a stray electric field. The magnitude of the stray electric field was evaluated by its ion displacement, which was measured by determining the equilibrium position with two different radial trap frequencies detected by fluorescence images of an ion. We found the micromotion-compensated condition by searching for an ion displacement of zero, and the uncertainty of the residual electric field reached a few volts per meter. The sensitivity achieved is not superior but comparable to that of existing compensation techniques[16]. Because the equilibrium position shift increases with decreasing trap frequency, the sensitivity of micromotion detection can easily be tuned using this method. Furthermore, this compensation technique does not depend on the orientation and detunig of the incident cooling laser or imaging direction. Therefore, this method is applicable to planar ion traps, stylus ion traps, which limit the propagation angle of lasers, or miniaturized ion traps and systems. Moreover, complex laser systems or instruments are not required in this measurement because this method is based on the detection of ion positions with trap potential modulation. Thus, this technique can simplify the ion trap system and its experiments. This can lead to the development of quantum information and sensing techniques using ion traps.
VI Acknowledgement
This work was supported by JST-Mirai Program Grant Number JPMJMI17A3, Japan.
VII Data Availability
The data that support the findings of this study are available from the corresponding author upon reasonable request.
References
- Kielpinski, Monroe, and Wineland [2002] D. Kielpinski, C. Monroe, and D. J. Wineland, “Architecture for a large-scale ion-trap quantum computer,” Nature , 709 (2002).
- Stick et al. [2006] D. Stick, W. K. Hensinger, S. Olmschenk, M. J. Madsen, K. Schwab, and C. Monroe, “Ion trap in a semiconductor chip,” Nature Physics 2, 36 (2006).
- Seidelin et al. [2006] S. Seidelin, J. Chiaverini, R. Reichle, J. J. Bollinger, D. Leibfried, J. Britton, J. H. Wesenberg, R. B. Blakestad, R. J. Epstein, D. B. Hume, W. M. Itano, J. D. Jost, C. Langer, R. Ozeri, N. Shiga, and D. J. Wineland, “Microfabricated surface-electrode ion trap for scalable quantum information processing,” Phys. Rev. Lett. 96, 253003 (2006).
- Chiaverini et al. [2005] J. Chiaverini, R. Blakestad, J. Britton, J. Jost, C. Langer, D. Leibfried, R. Ozeri, and D. Wineland, “Surface-electrode architecture for ion-trap quantum information processing,” Quantum Information and Computation 5, 419 (2005).
- Pearson et al. [2006] C. E. Pearson, D. R. Leibrandt, W. S. Bakr, W. J. Mallard, K. R. Brown, and I. L. Chuang, “Experimental investigation of planar ion traps,” Phys. Rev. A 73, 032307 (2006).
- Maiwald et al. [2009] R. Maiwald, D. Leibfried, J. Britton, J. C. Bergquist, G. Leuchs, and D. J. Wineland, “Stylus ion trap for enhanced access and sensing,” Nature Physics 5, 551 (2009).
- Arrington et al. [2013] C. L. Arrington, K. S. McKay, E. D. Baca, J. J. Coleman, Y. Colombe, P. Finnegan, D. A. Hite, A. E. Hollowell, R. Jördens, J. D. Jost, D. Leibfried, A. M. Rowen, U. Warring, M. Weides, A. C. Wilson, D. J. Wineland, and D. P. Pappas, “Micro-fabricated stylus ion trap,” Review of Scientific Instruments 84, 085001 (2013), https://doi.org/10.1063/1.4817304 .
- Berkeland et al. [1998] D. J. Berkeland, J. D. Miller, J. C. Bergquist, W. M. Itano, and D. J. Wineland, “Minimization of ion micromotion in a Paul trap,” Journal of Applied Physics 83, 5025–5033 (1998), https://doi.org/10.1063/1.367318 .
- Schulz et al. [2008] S. A. Schulz, U. Poschinger, F. Ziesel, and F. Schmidt-Kaler, “Sideband cooling and coherent dynamics in a microchip multi-segmented ion trap,” New Journal of Physics 10, 045007 (2008).
- Doret et al. [2012] S. C. Doret, J. M. Amini, K. Wright, C. Volin, T. Killian, A. Ozakin, D. Denison, H. Hayden, C. Pai, R. E. Slusher, et al., “Controlling trapping potentials and stray electric fields in a microfabricated ion trap through design and compensation,” New Journal of Physics 14, 073012 (2012).
- Pyka et al. [2014] K. Pyka, N. Herschbach, J. Keller, and T. E. Mehlstäubler, “A high-precision segmented paul trap with minimized micromotion for an optical multiple-ion clock,” Applied Physics B 114, 231–241 (2014).
- Narayanan et al. [2011] S. Narayanan, N. Daniilidis, S. A. Möller, R. Clark, F. Ziesel, K. Singer, F. Schmidt-Kaler, and H. Häffner, “Electric field compensation and sensing with a single ion in a planar trap,” Journal of Applied Physics 110, 114909 (2011), https://doi.org/10.1063/1.3665647 .
- Tanaka et al. [2012] U. Tanaka, K. Masuda, Y. Akimoto, K. Koda, Y. Ibaraki, and S. Urabe, “Micromotion compensation in a surface electrode trap by parametric excitation of trapped ions,” Applied Physics B 107, 907–912 (2012).
- Härter et al. [2013] A. Härter, A. Krükow, A. Brunner, and J. Hecker Denschlag, “Minimization of ion micromotion using ultracold atomic probes,” Applied Physics Letters 102, 221115 (2013), https://doi.org/10.1063/1.4809578 .
- Gloger et al. [2015] T. F. Gloger, P. Kaufmann, D. Kaufmann, M. T. Baig, T. Collath, M. Johanning, and C. Wunderlich, “Ion-trajectory analysis for micromotion minimization and the measurement of small forces,” Phys. Rev. A 92, 043421 (2015).
- Keller et al. [2015] J. Keller, H. L. Partner, T. Burgermeister, and T. E. Mehlstäubler, “Precise determination of micromotion for trapped-ion optical clocks,” Journal of Applied Physics 118, 104501 (2015), https://doi.org/10.1063/1.4930037 .
- Blūms et al. [2018] V. Blūms, M. Piotrowski, M. I. Hussain, B. G. Norton, S. C. Connell, S. Gensemer, M. Lobino, and E. W. Streed, “A single-atom 3d sub-attonewton force sensor,” Science advances 4, eaao4453 (2018).