A Graphical Interpretation of Circumgalactic Precipitation
Abstract
Both observations and recent numerical simulations of the circumgalactic medium (CGM) support the hypothesis that a self-regulating feedback loop suspends the gas density of the ambient CGM close to the galaxy in a state with a ratio of cooling time to freefall time . This limiting ratio is thought to arise because circumgalactic gas becomes increasingly susceptible to multiphase condensation as the ratio declines. If the timescale ratio gets too small, then cold clouds precipitate out of the CGM, rain into the galaxy, and fuel energetic feedback that raises the ambient cooling time. The astrophysical origin of this so-called precipitation limit is not simple but is critical to understanding the CGM and its role in galaxy evolution. This paper therefore attempts to interpret its origin as simply as possible, relying mainly on conceptual reasoning and schematic diagrams. It illustrates how the precipitation limit can depend on both the global configuration of a galactic atmosphere and the degree to which dynamical disturbances drive CGM perturbations. It also frames some tests of the precipitation hypothesis that can be applied to both CGM observations and numerical simulations of galaxy evolution.
1 Introduction
This Letter outlines some key concepts underlying the phenomenon sometimes called circumgalactic precipitation. The topic’s history stretches back to investigations of thermal instability in both stratified interstellar gas (e.g., Spitzer, 1956; Field, 1965; Defouw, 1970; Binney et al., 2009) and the gaseous cores of galaxy clusters (e.g., Fabian & Nulsen, 1977; Mathews & Bregman, 1978; Cowie et al., 1980; Nulsen, 1986; Malagoli et al., 1987; Balbus & Soker, 1989; Loewenstein, 1989; McCourt et al., 2012; Gaspari et al., 2013; Choudhury & Sharma, 2016; Voit et al., 2017; Voit, 2018; Choudhury et al., 2019). Many of those rather technical papers are difficult for non-experts to interpret and yet have deep implications for both observations of the circumgalactic medium (CGM) and analyses of numerical simulations designed to model galaxy evolution.
Several recent analyses of multiphase111The term multiphase describes a medium in which temperatures and densities of neighboring regions differ by orders of magnitude. circumgalactic gas produced in numerical simulations of galaxy evolution have underscored the need for a broader understanding of the astrophysics at play (e.g., Lochhaas et al., 2020; Nelson et al., 2020; Fielding et al., 2020; Esmerian et al., 2020). Those simulations show that feedback from both supernovae and active galactic nuclei can maintain the CGM in a multiphase state characterized by radial profiles of pressure, gas density, temperature, and specific entropy that have a well-defined median. Around each median profile, fluctuations in density, temperature, and entropy exhibit approximately log-normal distributions with long tails toward lower temperature and entropy and greater gas density. A similar tail is generally not present in the pressure fluctuations, indicating that the tail consists of gas condensing out of the ambient medium and producing cooler clouds, also known as precipitation, in the CGM.
The explanatory illustrations presented here are therefore intended to help further an intuitive understanding of the CGM conditions that promote or inhibit development of a multiphase galactic atmosphere. Section 2 discusses thermal instability and how it damps in stratified galactic atmospheres. Section 3 shows how various perturbations of those atmospheres can overcome damping and produce multiphase condensation. Section 4 relates the rate of multiphase condensation to both the median state of the galactic atmosphere and the dispersion of perturbations around the median. Section 5 briefly considers the consequences of altering a galactic atmosphere’s entropy gradient. Section 6 summarizes the paper.
2 Damped Thermal Instability
Thermal stability of a galactic atmosphere depends on whether a low-entropy perturbation within it cools more quickly (or heats more slowly) than its surroundings, causing its entropy contrast to increase with time (e.g., Field, 1965; Balbus, 1986, 1988). In an optically thin medium, a low-entropy perturbation can grow because its greater particle density usually makes its radiative cooling rate greater. If the background medium is homogeneous and not gravitationally stratified, then the entropy contrast of a low-entropy gas parcel continually increases, without damping, until it reaches a temperature that slows or halts radiative cooling. Such a medium is thermally unstable and tends to develop multiphase structure on a cooling timescale
| (1) |
where is the radiative cooling function of astrophysical plasma with temperature , metallicity , and particle density , defined with respect to electron density and ion density .
Gravity makes thermal instability more interesting. The equilibrium configuration of a galactic atmosphere that is both hydrostatic and convectively stable in its potential well must have a negative pressure gradient and a positive entropy gradient. Otherwise, convection sorts the gas parcels until specific entropy becomes a monotonically rising function of the gravitational potential . The result is an atmosphere with an entropy gradient that can be expressed in terms of the logarithmic slope , where , because changes in are proportional to changes of specific entropy in a monatomic ideal gas.
An adiabatic low-entropy perturbation in such an atmosphere does not remain a low-entropy perturbation because of buoyancy. Instead, it accelerates toward the center, causing its entropy contrast to decrease. Eventually it passes through a layer of equivalent specific entropy into a layer of lower specific entropy. It is then a high-entropy perturbation and begins to decelerate. What follows is a series of buoyancy-driven oscillations with frequency
| (2) |
where the freefall time is based on the local gravitational acceleration (e.g., Voit et al., 2017). More formally, the perturbation has become an internal gravity wave with a Brunt-Väisälä frequency .
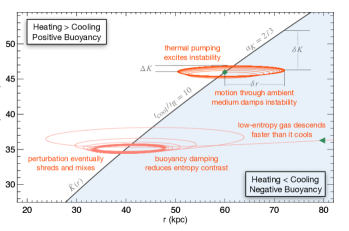
Those buoyant oscillations can prevent thermal instability from producing multiphase structure in an otherwise static atmosphere with . Figure 1 illustrates the reason. The trajectories it shows were computed with the heuristic non-linear thermal instability model of Voit (2018). At the upper right is a trajectory beginning at the green diamond on the atmosphere’s median entropy profile, . Along that median profile, heating equals cooling and . Initially, the perturbation is moving to greater altitude, into the part of the diagram where cooling exceeds heating. Its entropy therefore starts to decline on a timescale , but it accelerates inward on a shorter timescale . Before condensation can occur, the perturbation crosses the median entropy line, into the part of the diagram where heating exceeds cooling. Its entropy then rises, it accelerates outward, and it returns to the median line. Buoyant oscillations follow, as shown in the figure.
While the perturbation remains small, thermal pumping amplifies those oscillations on a timescale . Each time the perturbation goes below the median entropy, cooling drops it further below the median. Each time it goes above the median, heating pushes it further above the median. But amplitude growth also increases the damping rate of the oscillations, as motion through the ambient medium transfers increasing amounts of kinetic energy away from the perturbation. Growth therefore saturates at an amplitude
| (3) |
at which energy losses to the ambient medium equal energy gains through thermal pumping (e.g., Nulsen, 1986; McCourt et al., 2012; Voit et al., 2017).
Voit et al. (2017) called this saturation process “buoyancy damping” but misidentified the channel that drains kinetic energy from the perturbation. The Erratum to Voit et al. (2017) shows that internal gravity waves excited by thermal instability damp by coupling to resonant pairs of lower frequency gravity waves. Those wave-triad interactions transfer kinetic energy away from the original unstable wave on a timescale , where is the wavenumber of the original wave. Growth of the original wave therefore saturates as this dissipation timescale approaches . Long-wavelength disturbances () consequently saturate at the amplitude expressed in equation (3), corresponding to entropy fluctuations with a fractional amplitude , relative to the background. However, the actual entropy changes experienced by a moving perturbation have an amplitude .
Perturbations starting with a larger amplitude than the saturation amplitude can also fail to result in multiphase condensation. The lower trajectory in Figure 1 shows an example. It enters the figure with at 80 kpc and proceeds toward smaller radii. However, the perturbation it represents is falling faster than it can cool and ultimately descends through a layer of equivalent entropy at kpc. Buoyant oscillations of decaying amplitude follow until the perturbation reaches the saturation scale. A more complete model would include fluid instabilities that would shred the oscillating perturbation and mix it with the ambient medium, perhaps before it is able to reach the saturation scale.
3 Gravity Waves & Precipitation
Precipitation models have recently received considerable attention because both observations (Voit et al., 2015a, b, 2018, 2019; Voit, 2019; Hogan et al., 2017; Pulido et al., 2018; Babyk et al., 2018) and simulations (McCourt et al., 2012; Sharma et al., 2012; Gaspari et al., 2012, 2013; Li et al., 2015; Prasad et al., 2015, 2018; Yang & Reynolds, 2016; Meece et al., 2017; Fielding et al., 2017; Esmerian et al., 2020) suggest that coupling between energetic feedback and multiphase condensation enables at least some galactic atmospheres to self-regulate at a median ratio –20. The precipitation hypothesis suggests that feedback fueled by cold, centrally accreting gas naturally suspends a galactic atmosphere in a state that is marginally unstable to multiphase condensation (e.g., Tabor & Binney, 1993; Binney & Tabor, 1995; Maller & Bullock, 2004; Pizzolato & Soker, 2005, 2010; McCourt et al., 2012; Sharma et al., 2012; Gaspari et al., 2012, 2017; Soker, 2016; Voit et al., 2017). However, the median ratio of the emergent marginal state is an order of magnitude greater than the value at which buoyancy should interfere with thermal instability and suppress multiphase condensation, according to the findings outlined in §2. Something must therefore be offsetting the damping effects of buoyancy so that multiphase condensation can proceed. This section outlines some of the possibilities.
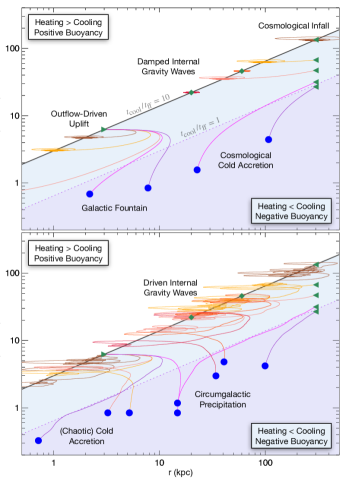
The upper panel of Figure 2 illustrates two pathways that can lead to condensation in an otherwise static galactic atmosphere. As in Figure 1, all of the perturbation trajectories it shows were computed using the heuristic non-linear dynamical model from Voit (2018). In fact, the trajectory beginning at 300 kpc and ending up at 40 kpc is identical to the infalling one in Figure 1. Several other infalling trajectories also begin at 300 kpc, and their fate depends on the perturbation’s initial ratio. If the ratio begins near unity, the perturbation can cool as least as quickly as it falls, allowing it to condense. But if an infalling perturbation begins with a ratio much greater than unity, buoyancy damping causes it to settle into and merge with the ambient atmosphere at an entropy level not very different from its original value. The fate of infalling gas coming from cosmological accretion therefore depends on both its initial ratio and the entropy profile of the galactic atmosphere it is entering. A complementary analysis of this perturbation mode can be found in Choudhury et al. (2019), who consider how development of a multiphase medium depends on the amplitude of isobaric density perturbations and find that condensation of those perturbations depends jointly on their initial amplitude and the ambient value of .
The second condensation pathway in the upper panel of Figure 2 begins at small radii. Outflows that lift low-entropy gas to greater altitude can stimulate condensation if they are able to make in the uplifted gas (e.g., Revaz et al., 2008; Li & Bryan, 2014; McNamara et al., 2016; Voit et al., 2017). In the atmosphere pictured, uplift by a factor in radius is required. Atmospheres with greater median values of require greater amounts of uplift. The essential features of this condensation mode were captured decades ago by galactic fountain models for the origin of high-velocity clouds in a galactic atmosphere (Shapiro & Field, 1976; Bregman, 1980) and are inherent in modern simulations of condensing galactic winds (e.g., Vijayan et al., 2018; Schneider et al., 2018).
Trajectories in the lower panel of Figure 2 begin with the same initial conditions as those in the upper panel. The only difference is the presence of dynamical noise in the ambient atmosphere. Perturbation trajectories in the Voit (2018) model can be given random momentum impulses intended to resemble the effects of turbulence and other forms of kinetic disturbance. That feature of the model was inspired by the finding of Gaspari et al. (2013) that driving of turbulence in a galactic atmosphere with a median ratio can interfere with buoyancy and promote multiphase condensation. The perturbations that condense correspond to internal gravity waves that have been driven toward amplitudes large enough for the perturbation’s local value of to approach unity.
The lower panel of Figure 2 shows that dynamical noise can cause condensation of perturbations that would otherwise damp and converge to the saturation amplitude. Two examples are the red trajectories starting at the green diamonds located 20 kpc and 60 kpc from the center. Those trajectories represent internal gravity waves that saturate in the upper panel but result in condensation near kpc in the bottom panel. Two more examples are the orange and salmon colored trajectories starting 3 kpc from the center. In the upper panel, uplift alone is not enough to make them condense, but random momentum impulses in the lower panel end up driving those trajectories into condensation near kpc.
Collectively, all of the condensing trajectories in the lower panel of Figure 2 can be considered routes to precipitation. Grouping all of them into a generic category called “precipitation” is useful, because it can be difficult to infer the origin of condensing CGM gas from the location where it condenses. Consider, for example, the two trajectories that end in condensation near kpc, which are represented with magenta lines. One comes from infall of a gas parcel with . The other comes from uplifted gas originally at kpc. In a static atmosphere, the uplifted gas parcel condenses at kpc (see upper panel). But in the noisy atmosphere of the lower panel, random momentum impulses push that parcel’s trajectory considerably farther from the center, leading to condensation in the CGM.
Notice also that random momentum impulses can push other condensing gas parcels inward. In the lower panel, the uplifted parcel that initially has the greatest outward velocity at 3 kpc (purple line) ends up condensing closer to the center, at kpc. This form of precipitation near the center of a galaxy is representative of the chaotic cold accretion process that can strongly boost the feedback output from a massive galaxy’s central black hole (e.g., Pizzolato & Soker, 2005; Gaspari et al., 2013; Tremblay et al., 2016).
4 The Global Precipitation Limit
The trajectories in Figure 2 demonstrate that is a local criterion for precipitation in a stratified atmosphere.222The criterion is more general (see §5) Individually, those trajectories do not account for why a galactic atmosphere would self-regulate near a much larger median ratio , but collectively they provide a clue. Internal gravity waves driven by dynamical noise in the lower panel’s calculations typically reach amplitudes roughly half of what is necessary to end in condensation. The distribution of those amplitudes can be characterized by the resulting dispersion of the fractional entropy perturbation amplitude relative to the local median. The low-entropy tail of that distribution represents perturbations transitioning into condensation. Consequently, the precipitation rate of an atmosphere depends on how its typical perturbation amplitude compares with the fractional difference between the median entropy and the entropy level at which within a perturbation (see Figure 3). That link between median entropy and precipitation rate enables a galactic atmosphere to self-adjust so that feedback fueled by precipitation deposits just enough thermal energy in the CGM to balance radiative cooling, as outlined in Voit (2018).
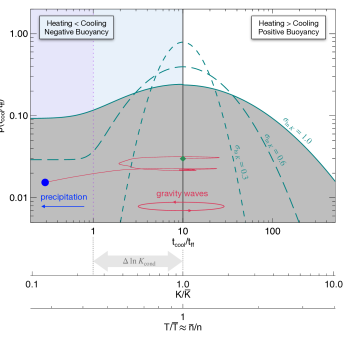
Figure 3 presents the idea schematically. It shows distribution functions that are log-normal around a median entropy , except for a flat tail at the low-entropy end, where . The figure presents a case in which the median entropy corresponds to . More generally, can be considered an adjustable parameter of the distribution function that determines the median ratio. The relationship shown between and the ratio assumes pressure balance and , which is appropriate for (e.g., Sutherland & Dopita, 1993; Schure et al., 2009). Together, those assumptions give and the relationships and (e.g., Voit, 2019).
Evidence for such a perturbation distribution can be observed in both idealized and cosmological simulations of feedback-regulated circumgalactic gas. See, for example, Figure 1 of Lochhaas et al. (2020) and especially Figure 4 of Fielding et al. (2020). The distributions of appear log-normal in the core and have tails that level off near . Fielding et al. (2020) show that the dispersions of those distributions differ, depending on features peculiar to each simulation. The cosmological simulations (from Joung et al., 2012; Springel et al., 2018) analyzed by Fielding et al. (2020) show greater dispersion in CGM conditions, particularly at large radii, presumably because they include dynamical disturbances, such as cosmological infall, mergers, and stirring of the CGM by orbiting subhalos, that are not present in idealized simulations. In those cosmological simulations, the peak of the log-normal distribution is roughly twice the level of the flat tail, similar to the distribution with in Figure 3. Interestingly, the corresponding temperature dispersion () is consistent with the one inferred by Voit (2019) from observations of CGM O VI absorption around galaxies like the Milky Way.
For the idealized distribution functions in Figure 3, the precipitation rate is exponentially sensitive to the ratio , because
| (4) |
for . The model represented in the figure has , because at and . Given this difference between and the value of at which , approximately 9% of a log-normal distribution with has . That percentage drops to % in the distribution with . Precipitation depletes the fraction of the ambient atmosphere with on a dynamical timescale (because in those perturbations). And dynamical noise presumably restores the tail of the distribution function on a similar timescale.
That line of reasoning leads to a hypothesis about the precipitation rate: In a given layer of a galactic atmosphere it should be similar to the gas mass of the layer, divided by , times the fraction of mass with . Within the virial radius, the expected precipitation rate of a galactic atmosphere represented by the solid line in Figure 3 () is then similar to the CGM gas mass divided by a Hubble time. The precipitation rate corresponding to the long-dashed line () is an order of magnitude smaller. In a state of long-term balance, entropy fluctuations cannot be much greater than without exhausting the ambient CGM (unless the median ratio is ), and they cannot be much smaller than while still providing enough precipitation to fuel feedback. This hypothesis for the CGM precipitation rate seems reasonable but remains to be tested with numerical simulations.
Another observable CGM property connected with the distribution functions in Figure 3 is the velocity dispersion of internal gravity waves. According to the numerical experiments in Voit (2018), the dynamical disturbances required to promote precipitation in an atmosphere with and a median ratio –20 maintain a one-dimensional “turbulent” velocity dispersion –0.4. Note that the density fluctuations shown in Figure 3 can be considerably larger than the compressive density fluctuations produced by turbulent speeds of this magnitude in a hydrostatic atmosphere, which have fractional amplitudes . That is because the fluctuations depicted in Figure 3 arise instead from vertical displacements of gas in an atmosphere with an entropy gradient. Recent numerical simulations by Mohapatra et al. (2020, 2021) have shown turbulence in a stratified medium generates density fluctuations of amplitude .
The critical velocity dispersion implied by the Voit (2018) model is broadly consistent with the findings of Gaspari et al. (2013) for numerical simulations that drive turbulence, as well as with the observed velocity dispersions of galaxy-cluster cores that appear to be precipitating (Gaspari et al., 2018). The turbulence cannot be much greater without either damping the perturbations through mixing with the ambient gas or overheating the ambient medium through turbulent dissipation (Gaspari et al., 2013, 2017; Banerjee & Sharma, 2014; Buie et al., 2018, 2020). Around a galaxy like the Milky Way, the predicted one-dimensional velocity dispersion of hot gas in a precipitating CGM is therefore –. Around a massive elliptical galaxy the prediction rises to –.
5 Tilting of the Entropy Profile
So far, the paper has focused entirely on entropy profiles with a constant median ratio, corresponding to in an isothermal potential well. Tilting the entropy profile away from that special slope has consequences. The most extreme case is an isentropic atmosphere with , which eliminates buoyancy and produces singularities in the model of §2. In that case, buoyancy is unable to damp thermal instability, allowing low-entropy perturbations to condense on a timescale regardless of the median ratio. This may be how massive galaxies in the Illustris TNG50 simulation manage to maintain multiphase circumgalactic gas, even though their ambient atmospheres have a median –100 at –300 kpc (Nelson et al., 2020). Those large values of would appear to be unfavorable to development of a multiphase medium, but the median entropy slope in that radial range is only in this subsample of massive galaxies from TNG50. Also, many of the individual entropy profiles have radial intervals with , making those regions convectively unstable, free from buoyancy damping, and susceptible to precipitation.
Tilting the entropy slope the opposite way has consequences that may be more dramatic. An entropy profile steep enough for the median ratio to rise with radius tends to focus multiphase condensation onto the galaxy’s center, potentially supercharging feedback from the galaxy’s central black hole. Voit et al. (2020) have recently demonstrated how such a tilt may link quenching of star formation by black-hole feedback with a galaxy’s central stellar velocity dispersion. Observations indeed show that central entropy profiles with are rare (e.g., Lakhchaura et al., 2018; Babyk et al., 2018). And observations of some massive elliptical galaxies with show that this slope flattens within the central kiloparsec (Werner et al., 2012; Frisbie et al., 2020), allowing centralized precipitation that is maximized at radii where is minimized (Voit et al., 2015b).
6 Summary
This paper has attempted to present the following key concepts of self-regulating circumgalactic precipitation as simply as possible, primarily through schematic diagrams.
-
1.
Buoyancy Damping. Thermal instability in static galactic atmospheres with drives internal gravity-wave oscillations that damp before producing multiphase condensation (see §2 and Figure 1). Instead of condensing, those thermally unstable perturbations saturate at a fractional entropy amplitude , relative to the background medium.
-
2.
Local Precipitation Threshold. Because of buoyancy damping, a low-entropy perturbation within an atmosphere having must have a local cooling time satisfying the criterion in order to condense (see §4 and Figure 2). If the atmosphere’s entropy slope is , then the local threshold for precipitation is .
-
3.
Uplift. Galactic outflows that lift ambient gas nearly adiabatically can lower the local ratio of the uplifted gas by increasing without significantly changing (see Figure 2, upper panel). The amount of uplift required to achieve depends on the global median ratio. Therefore, the global ratio is a measure of the atmosphere’s susceptibility to multiphase condensation, when it is disturbed. This route to condensation resembles a classic galactic fountain.
-
4.
Infall. Alternatively, cosmological infall or stripping of low-entropy gas from an orbiting subhalo can introduce perturbations of non-linear amplitude that are able to condense if they start with (see Figure 2, upper panel).
-
5.
Dynamical Driving. Hydrodynamical disturbances strong enough to interfere with buoyancy damping produce additional opportunities for condensation (see Figure 2, lower panel). If all CGM perturbations are represented as internal gravity waves of amplitude , then condensation corresponds to driving of those gravity-wave oscillations to amplitudes that locally satisfy . Drivers of CGM fluctuations may include galactic winds, turbulence, cosmological infall, or stirring by orbiting subhalos.
-
6.
Circumgalactic Precipitation. Given the randomness produced by multiple sources of dynamical driving, it may be difficult to pinpoint the origin of a particular multiphase gas cloud in the CGM (see Figure 2, lower panel). However, considering all routes to condensation to be forms of circumgalatic precipitation helps to link their collective presence with the global characteristics of the ambient galactic atmosphere.
-
7.
Global Precipitation Limit. The susceptibility to precipitation of a stratified galactic atmosphere () depends on both its median ratio and the dispersion of entropy fluctuations within it (see §4 and Figure 3). The median ratio determines the fractional entropy difference between the atmosphere’s median entropy and the entropy of a perturbation in which . The fraction of the CGM that is able to precipitate therefore depends on the ratio . Numerical simulations of the CGM indicate that its entropy fluctuations have a log-normal distribution around the median, with –1.0, implying that the CGM precipitation rate is exponentially sensitive to . Consequently, the ratio needs to be large enough to avert catastrophic precipitation and an overwhelming feedback response. In a typical galactic atmosphere (with ), these considerations yield a global precipitation limit
(5) on the median ratio that reduces to for . Self-regulating precipitation converges to a value of at which accretion of cold gas into the galaxy fuels just enough feedback to keep the CGM in approximate thermal balance. That equilibrium value is likely to be in the range because of the exponential sensitivity of the precipitation criterion.
-
8.
Observable Features. Two distinct observable features allow tests of this interpretation of circumgalactic precipitation. Entropy fluctuations in approximate pressure balance with their surroundings correspond to temperature and density fluctuations with log-normal dispersion (see Figure 3). Around a galaxy like the Milky Way, with a CGM temperature , the O VI absorption-line column densities are sensitive to the amplitude of temperature fluctuations, and observations are so far consistent with (Voit, 2019). Also, dynamical disturbances great enough to cause precipitation maintain a radial velocity dispersion – in the CGM gas, amounting to 50– around a galaxy like the Milky Way and 100– around a massive elliptical galaxy. However, additional modeling will be required to obtain predictions of correlations between O VI column density and absorption-line width.
-
9.
Entropy-Profile Tilt. All of these predictions for precipitation substantially change if the CGM entropy profile becomes nearly flat () because buoyancy damping is eliminated as . All low-entropy perturbations can then condense on a timescale , regardless of the median ratio (§5). Those atmospheres call for an amendment to equation (5) that replaces with the atmosphere’s median value of , giving a more general global precipitation limit for .
-
10.
Minimum Precipitation Limit. Notice also that thermal instability near the saturation limit can generate perturbations large enough to precipitate without dynamical driving, as along as the median of is sufficiently small. Making another change to equation (5) by replacing with the saturation amplitude gives the relation
(6) which implies a firm lower limit on the median ratio of for .
References
- Babyk et al. (2018) Babyk, I. V., McNamara, B. R., Nulsen, P. E. J., et al. 2018, ApJ, 862, 39, doi: 10.3847/1538-4357/aacce5
- Balbus (1986) Balbus, S. A. 1986, ApJ, 303, L79, doi: 10.1086/184657
- Balbus (1988) —. 1988, ApJ, 328, 395, doi: 10.1086/166301
- Balbus & Soker (1989) Balbus, S. A., & Soker, N. 1989, ApJ, 341, 611, doi: 10.1086/167521
- Banerjee & Sharma (2014) Banerjee, N., & Sharma, P. 2014, MNRAS, 443, 687, doi: 10.1093/mnras/stu1179
- Binney et al. (2009) Binney, J., Nipoti, C., & Fraternali, F. 2009, MNRAS, 397, 1804, doi: 10.1111/j.1365-2966.2009.15113.x
- Binney & Tabor (1995) Binney, J., & Tabor, G. 1995, MNRAS, 276, 663, doi: 10.1093/mnras/276.2.663
- Bregman (1980) Bregman, J. N. 1980, ApJ, 236, 577, doi: 10.1086/157776
- Buie et al. (2018) Buie, Edward, I., Gray, W. J., & Scannapieco, E. 2018, ApJ, 864, 114, doi: 10.3847/1538-4357/aad8bd
- Buie et al. (2020) Buie, Edward, I., Gray, W. J., Scannapieco, E., & Safarzadeh, M. 2020, ApJ, 896, 136, doi: 10.3847/1538-4357/ab9535
- Choudhury & Sharma (2016) Choudhury, P. P., & Sharma, P. 2016, MNRAS, 457, 2554, doi: 10.1093/mnras/stw152
- Choudhury et al. (2019) Choudhury, P. P., Sharma, P., & Quataert, E. 2019, MNRAS, 488, 3195, doi: 10.1093/mnras/stz1857
- Cowie et al. (1980) Cowie, L. L., Fabian, A. C., & Nulsen, P. E. J. 1980, MNRAS, 191, 399, doi: 10.1093/mnras/191.2.399
- Defouw (1970) Defouw, R. J. 1970, ApJ, 160, 659, doi: 10.1086/150460
- Esmerian et al. (2020) Esmerian, C. J., Kravtsov, A. V., Hafen, Z., et al. 2020, arXiv e-prints, arXiv:2006.13945. https://arxiv.org/abs/2006.13945
- Fabian & Nulsen (1977) Fabian, A. C., & Nulsen, P. E. J. 1977, MNRAS, 180, 479
- Field (1965) Field, G. B. 1965, ApJ, 142, 531, doi: 10.1086/148317
- Fielding et al. (2017) Fielding, D., Quataert, E., McCourt, M., & Thompson, T. A. 2017, MNRAS, 466, 3810, doi: 10.1093/mnras/stw3326
- Fielding et al. (2020) Fielding, D. B., Tonnesen, S., DeFelippis, D., et al. 2020, arXiv e-prints, arXiv:2006.16316. https://arxiv.org/abs/2006.16316
- Frisbie et al. (2020) Frisbie, R. L. S., Donahue, M., Voit, G. M., et al. 2020, arXiv e-prints, arXiv:2006.12568. https://arxiv.org/abs/2006.12568
- Gaspari et al. (2013) Gaspari, M., Ruszkowski, M., & Oh, S. P. 2013, MNRAS, 432, 3401, doi: 10.1093/mnras/stt692
- Gaspari et al. (2012) Gaspari, M., Ruszkowski, M., & Sharma, P. 2012, ApJ, 746, 94, doi: 10.1088/0004-637X/746/1/94
- Gaspari et al. (2017) Gaspari, M., Temi, P., & Brighenti, F. 2017, MNRAS, 466, 677, doi: 10.1093/mnras/stw3108
- Gaspari et al. (2018) Gaspari, M., McDonald, M., Hamer, S. L., et al. 2018, ApJ, 854, 167, doi: 10.3847/1538-4357/aaaa1b
- Hogan et al. (2017) Hogan, M. T., McNamara, B. R., Pulido, F. A., et al. 2017, ApJ, 851, 66, doi: 10.3847/1538-4357/aa9af3
- Joung et al. (2012) Joung, M. R., Putman, M. E., Bryan, G. L., Fernández, X., & Peek, J. E. G. 2012, ApJ, 759, 137, doi: 10.1088/0004-637X/759/2/137
- Lakhchaura et al. (2018) Lakhchaura, K., Werner, N., Sun, M., et al. 2018, MNRAS, 481, 4472, doi: 10.1093/mnras/sty2565
- Li & Bryan (2014) Li, Y., & Bryan, G. L. 2014, ApJ, 789, 153, doi: 10.1088/0004-637X/789/2/153
- Li et al. (2015) Li, Y., Bryan, G. L., Ruszkowski, M., et al. 2015, ApJ, 811, 73, doi: 10.1088/0004-637X/811/2/73
- Lochhaas et al. (2020) Lochhaas, C., Bryan, G. L., Li, Y., Li, M., & Fielding, D. 2020, MNRAS, 493, 1461, doi: 10.1093/mnras/staa358
- Loewenstein (1989) Loewenstein, M. 1989, MNRAS, 238, 15, doi: 10.1093/mnras/238.1.15
- Malagoli et al. (1987) Malagoli, A., Rosner, R., & Bodo, G. 1987, ApJ, 319, 632, doi: 10.1086/165483
- Maller & Bullock (2004) Maller, A. H., & Bullock, J. S. 2004, MNRAS, 355, 694, doi: 10.1111/j.1365-2966.2004.08349.x
- Mathews & Bregman (1978) Mathews, W. G., & Bregman, J. N. 1978, ApJ, 224, 308, doi: 10.1086/156379
- McCourt et al. (2012) McCourt, M., Sharma, P., Quataert, E., & Parrish, I. J. 2012, MNRAS, 419, 3319, doi: 10.1111/j.1365-2966.2011.19972.x
- McNamara et al. (2016) McNamara, B. R., Russell, H. R., Nulsen, P. E. J., et al. 2016, ApJ, 830, 79, doi: 10.3847/0004-637X/830/2/79
- Meece et al. (2017) Meece, G. R., Voit, G. M., & O’Shea, B. W. 2017, ApJ, 841, 133, doi: 10.3847/1538-4357/aa6fb1
- Mohapatra et al. (2020) Mohapatra, R., Federrath, C., & Sharma, P. 2020, MNRAS, 493, 5838, doi: 10.1093/mnras/staa711
- Mohapatra et al. (2021) —. 2021, MNRAS, 500, 5072, doi: 10.1093/mnras/staa3564
- Nelson et al. (2020) Nelson, D., Sharma, P., Pillepich, A., et al. 2020, arXiv e-prints, arXiv:2005.09654. https://arxiv.org/abs/2005.09654
- Nulsen (1986) Nulsen, P. E. J. 1986, MNRAS, 221, 377, doi: 10.1093/mnras/221.2.377
- Pizzolato & Soker (2005) Pizzolato, F., & Soker, N. 2005, ApJ, 632, 821, doi: 10.1086/444344
- Pizzolato & Soker (2010) —. 2010, MNRAS, 408, 961, doi: 10.1111/j.1365-2966.2010.17156.x
- Prasad et al. (2015) Prasad, D., Sharma, P., & Babul, A. 2015, ApJ, 811, 108, doi: 10.1088/0004-637X/811/2/108
- Prasad et al. (2018) —. 2018, ApJ, 863, 62, doi: 10.3847/1538-4357/aacce8
- Pulido et al. (2018) Pulido, F. A., McNamara, B. R., Edge, A. C., et al. 2018, ApJ, 853, 177, doi: 10.3847/1538-4357/aaa54b
- Revaz et al. (2008) Revaz, Y., Combes, F., & Salomé, P. 2008, A&A, 477, L33, doi: 10.1051/0004-6361:20078915
- Schneider et al. (2018) Schneider, E. E., Robertson, B. E., & Thompson, T. A. 2018, ApJ, 862, 56, doi: 10.3847/1538-4357/aacce1
- Schure et al. (2009) Schure, K. M., Kosenko, D., Kaastra, J. S., Keppens, R., & Vink, J. 2009, A&A, 508, 751, doi: 10.1051/0004-6361/200912495
- Shapiro & Field (1976) Shapiro, P. R., & Field, G. B. 1976, ApJ, 205, 762, doi: 10.1086/154332
- Sharma et al. (2012) Sharma, P., McCourt, M., Quataert, E., & Parrish, I. J. 2012, MNRAS, 420, 3174, doi: 10.1111/j.1365-2966.2011.20246.x
- Soker (2016) Soker, N. 2016, New A Rev., 75, 1, doi: 10.1016/j.newar.2016.08.002
- Spitzer (1956) Spitzer, Lyman, J. 1956, ApJ, 124, 20, doi: 10.1086/146200
- Springel et al. (2018) Springel, V., Pakmor, R., Pillepich, A., et al. 2018, MNRAS, 475, 676, doi: 10.1093/mnras/stx3304
- Sutherland & Dopita (1993) Sutherland, R. S., & Dopita, M. A. 1993, ApJS, 88, 253
- Tabor & Binney (1993) Tabor, G., & Binney, J. 1993, MNRAS, 263, 323
- Tremblay et al. (2016) Tremblay, G. R., Oonk, J. B. R., Combes, F., et al. 2016, Nature, 534, 218, doi: 10.1038/nature17969
- Vijayan et al. (2018) Vijayan, A., Sarkar, K. C., Nath, B. B., Sharma, P., & Shchekinov, Y. 2018, MNRAS, 475, 5513, doi: 10.1093/mnras/sty198
- Voit (2018) Voit, G. M. 2018, ApJ, 868, 102, doi: 10.3847/1538-4357/aae8e2
- Voit (2019) —. 2019, ApJ, 880, 139, doi: 10.3847/1538-4357/ab2bfd
- Voit et al. (2015a) Voit, G. M., Donahue, M., Bryan, G. L., & McDonald, M. 2015a, Nature, 519, 203, doi: 10.1038/nature14167
- Voit et al. (2015b) Voit, G. M., Donahue, M., O’Shea, B. W., et al. 2015b, ApJ, 803, L21, doi: 10.1088/2041-8205/803/2/L21
- Voit et al. (2019) Voit, G. M., Donahue, M., Zahedy, F., et al. 2019, ApJ, 879, L1, doi: 10.3847/2041-8213/ab2766
- Voit et al. (2018) Voit, G. M., Ma, C. P., Greene, J., et al. 2018, ApJ, 853, 78, doi: 10.3847/1538-4357/aaa084
- Voit et al. (2017) Voit, G. M., Meece, G., Li, Y., et al. 2017, ApJ, 845, 80, doi: 10.3847/1538-4357/aa7d04
- Voit et al. (2020) Voit, G. M., Bryan, G. L., Prasad, D., et al. 2020, arXiv e-prints, arXiv:2006.09381. https://arxiv.org/abs/2006.09381
- Werner et al. (2012) Werner, N., Allen, S. W., & Simionescu, A. 2012, MNRAS, 425, 2731, doi: 10.1111/j.1365-2966.2012.21245.x
- Yang & Reynolds (2016) Yang, H. Y. K., & Reynolds, C. S. 2016, ApJ, 818, 181, doi: 10.3847/0004-637X/818/2/181