Size, shade or shape? The contribution of galaxies of different types to the star-formation history of the Universe from SDSS-IV MaNGA
Abstract
By fitting stellar populations to SDSS-IV MaNGA survey observations of suitably-weighted individual galaxies, we reconstruct the star-formation history of the Universe, which we find to be in reasonable agreement with previous studies. Dividing the galaxies by their present-day stellar mass, we demonstrate the downsizing phenomenon, whereby the more massive galaxies hosted the most star-formation at earlier times. Further dividing the galaxy sample by colour and morphology, we find that a galaxy’s present-day colour tell us more about its historical contribution to the cosmic star formation history than its current morphology. We show that downsizing effects are greatest among galaxies currently in the blue cloud, but that the level of downsizing in galaxies of different morphologies depends quite sensitively on the morphological classification used, due largely to the difficulty in classifying the smaller low-mass galaxies from their ground-based images. Nevertheless, we find agreement that among galaxies with stellar masses , downsizing is most significant in spirals. However, there are complicating factors. For example, for more massive galaxies, we find that colour and morphology are predictors of the past star formation over a longer timescale than in less massive systems. Presumably this effect is reflecting the longer period of evolution required to alter these larger galaxies’ physical properties, but shows that conclusions based on any single property don’t tell the full story.
keywords:
galaxies: evolution1 Introduction
The question of when and where the stars residing in today’s galaxies formed is essential to understanding the present-day Universe. Since early works by Madau et al. (1996), Connolly et al. (1997) and others, many studies have measured the average instantaneous star-formation rate in galaxy populations observed at different redshift snapshots to build a picture of the overall cosmic star-formation history; see Madau & Dickinson 2014 for a comprehensive review. These approaches have built up a picture of a two-phase star-formation history of the Universe, with the mean star-formation rate per unit of comoving volume rising rapidly during the first (i.e. ) after the Big Bang, and declining in more recent times. The exact lookback time at which the peak of cosmic star-formation occurred is uncertain, but most sources agree that it is broadly in the range of , corresponding to approximately before the present day; see analyses by Hopkins & Beacom (2006), Behroozi et al. (2013), and Madau & Dickinson (2014), and references therein.
Within this picture, studies of galaxy populations at different redshifts have demonstrated the link between the star-formation history of the Universe and the evolution of its constituent galaxies. For example, many show that the star-formation rate of galaxies with high stellar mass peaked and declined at preferentially earlier times than low-mass galaxies (Cowie et al., 1996; Fontanot et al., 2009; Peng et al., 2010; Muzzin et al., 2013), an effect normally referred to as “downsizing”. Others have proven that a link between a galaxy’s morphology and its contribution to the cosmic star-formation history exists over a range of redshifts (Wuyts et al., 2011; Bell et al., 2012; Cheung et al., 2012; Mortlock et al., 2013; Moresco et al., 2013), although determining detailed morphologies at high redshift is of course difficult.
It has long been known that in the present-day Universe, spirals are generally bluer in colour (e.g. Holmberg 1958) due to their higher rate of star formation (e.g. Roberts 1963; Kennicutt 1983), and are less massive (Blanton & Moustakas, 2009) than earlier-type galaxies, suggesting an evolutionary sequence of galaxies transitioning from late to early types as they grow and subsequently cease their star-formation. However, the exact mechanisms by which galaxies are able to alter their shape and colour are still not fully understood. One avenue to studying the typical evolution processes which have occurred in galaxies could be to determine whether a present-day galaxy’s colour111“Colour” here refers to a broadband measure of the spectral energy distribution in the optical region or its morphology is the strongest indicator to its past. It would then be possible to understand which property transition — morphology or colour; “shape” or “shade” — is more fundamental, and whether the associated timescales vary according to galaxy properties such as stellar mass.
Unfortunately, by their nature, studies of galaxy populations at different redshifts are limited to studying the average statistical behaviour of a galaxy population’s star-formation at different snapshots in the Universe’s history, and are therefore unable to trace how individual galaxies have evolved. In order to understand the link between a galaxy’s present-day properties and its past contribution to the cosmic star-formation history, an alternative approach is therefore required.
Using large samples of galaxies from spectroscopic surveys, Panter et al. (2003); Panter et al. (2007) and Heavens et al. (2004) showed that by measuring galaxies’ individual star-formation histories using spectral fitting techniques, the star-formation history of the Universe can be reconstructed. Despite significant progress in more recent years, obtaining accurate non-parametric star-formation histories of galaxies in this manner is still subject to significant uncertainties, particularly those due to difficulties in creating reliable stellar population templates using stellar evolution models which are still poorly understood (Charlot et al., 1996; Maraston, 1998, 2005; Yi, 2003; Lee et al., 2007; Ge et al., 2019), and also due to assumptions about the behaviour of the stellar initial mass function (Maraston, 1998; van Dokkum et al., 2008; Pforr et al., 2012; Cid Fernandes et al., 2014) and the treatment of stellar elemental abundances. See Conroy et al. (2009, 2010), and Conroy & Gunn (2010) for a set of detailed reviews and discussion on this important subject.
However, notwithstanding these difficulties, many studies have shown that non-parametric stellar population fitting methods produce generally reliable results (see e.g. Cid Fernandes et al. 2005; Panter et al. 2007; Sánchez et al. 2016; Li et al. 2017; de Amorim et al. 2017; Ge et al. 2018; Cid Fernandes 2018; see also Appendix A of Peterken et al. 2020 for tests specific for the spectral fitting methods used here), and these stellar population “fossil record” methods have therefore been successfully applied to modern integral-field spectroscopic galaxy surveys to uncover the history of low-redshift galaxies and their physical components (see e.g. Cid Fernandes et al. 2013; Pérez et al. 2013; Ibarra-Medel et al. 2016; González Delgado et al. 2016, 2017; Peterken et al. 2019; Peterken et al. 2020; García-Benito et al. 2019; Fraser-McKelvie et al. 2019). Others have used spectral fitting analyses to show that a galaxy’s observed colour (e.g. Ibarra-Medel et al. 2016; or equivalently star-formation rate, e.g. Sánchez et al. 2019) and morphology (e.g. García-Benito et al. 2017; López Fernández et al. 2018; Lacerna et al. 2020; Bellstedt et al. 2020) are directly linked to the historical evolution of its star formation rate. In a cosmological context, López Fernández et al. (2018) and Sánchez et al. (2019) have demonstrated the power of using fossil record techniques to reconstruct how galaxies’ physical properties have evolved over cosmic time, showing good agreement with redshift snapshot studies, and thereby justifying this approach as a complementary analysis technique to study the connection between the Universe’s evolution with its present-day galaxies.
With its consistent radial coverage of a large sample of galaxies with varying physical properties, the integral-field spectroscopic MaNGA survey (Bundy et al., 2015) (part of the fourth generation of the Sloan Digital Sky Survey; SDSS-IV; Blanton et al. 2017) offers an ideal tool to investigate the link between today’s galaxies and the Universe’s past. In Peterken et al. (2021), we explored how the stellar population fossil record can reveal the cosmic evolution of the star-formation “main sequence” and the mass function of galaxies. Here, we use the same measured star-formation histories of a large sample of galaxies to derive the star-formation history of the Universe, and make use of morphological information from both citizen science and machine learning classifications to explore the connection between present-day stellar mass, colour, and morphology to a galaxy’s star-formation rate evolution over the age of the Universe.
This paper is structured as follows. In Section 2, we outline the relevant details of the SDSS-IV MaNGA survey. We outline how the samples were selected and describe the division of these samples into morphological and colour sub-samples in Section 3. We then briefly summarise the spectral fitting methods we employ to measure galaxy star-formation histories in Section 4. Section 5 contains the derivation of the cosmic star-formation history and its contribution from galaxies of different present-day stellar masses (5.1), colour (5.2), and morphological classifications (5.3). Finally, we interpret how these results fit into a context of downsizing and discuss the relative importance of morphology and broadband colour in Section 6.
Throughout this paper, we assume a flat CDM cosmology with and , consistent with Planck Collaboration et al. (2016).
2 MaNGA
As part of the SDSS-IV, Mapping Nearby Galaxies at Apache Point Observatory (MaNGA; Bundy et al. 2015) is an integral-field spectroscopic galaxy survey. As of the time of writing, on-site operations have been completed, and by the end of 2020 the fully-reduced observations will be available for over 10,000 low-redshift (, median ) galaxies with a spatial resolution of 2.5 arcseconds (Yan et al., 2016b). Observations make use of specially-designed integral field units of five sizes ranging from 12 to 32 arcsecond diameters with 19 to 127 fibres (Drory et al., 2015), which are mounted onto plates on the 2.5-metre Sloan telescope at Apache Point Observatory in New Mexico (Gunn et al., 2006). The fibres are fed into the BOSS spectrographs (Smee et al., 2013) and the spectra are calibrated to better than 5% accuracy (Yan et al., 2016a) covering a wavelength range of with a resolution of . Observations are designed to reach a minimum signal-to-noise ratio of at (Law et al., 2015), where is the effective radius of each observed galaxy measured by the NASA-Sloan Atlas (NSA; Blanton et al. 2011).
The calibrated spectra are reduced and combined into three-dimensional datacubes by a custom data reduction pipeline (DRP; Law et al. 2016; Law et al. in preparation), and a data analysis pipeline (DAP; Westfall et al. 2019; Cherinka et al. 2019) provides data analysis products such as spectral index maps, stellar and gas kinematics, and emission line fluxes (Belfiore et al., 2019).
3 Sample selection
MaNGA targets galaxies with a flat distribution in log(stellar mass) over the range of , and the full targeting catalogue assigns galaxies to designated samples. The Primary sample galaxies are observed to a radius of , while the Secondary sample contains observations to . The Primary sample is supplemented by a colour-enhanced sample to form the Primary+ sample, which over-samples unusual regions of the stellar mass–colour plane such as high-mass blue galaxies, low-mass red galaxies, and the “green valley” (Law et al., 2015).
From the latest internal MaNGA data release (MaNGA Product Launch 9; MPL-9), we selected all galaxies belonging to any of the Primary, Primary+, or Secondary samples. In doing so, we required the MaNGA DRP to have assigned no warning flags at all to any galaxy (i.e. drp3qual=0 for all galaxies). We also require the DAP to have successfully modelled an emission spectrum cube for each galaxy. These criteria produce a full sample of 6861 galaxies, of which 3255 belong to the Primary sample, 4342 to the Primary+ sample, and 2519 to the larger-coverage Secondary sample.
3.1 Sample weightings
As a result of MaNGA’s sampling, none of the survey’s galaxy samples are intrinsically volume-limited. However, since the sampling strategies are well-defined, each galaxy can be assigned an appropriate weighting such that any analysis can be performed on an effectively volume-limited sample (Wake et al., 2017). An implementation of these weightings is described in detail by Wake et al. (2017), but here — as in Peterken et al. (2021) — we use weightings generated using the method implemented by Sánchez et al. (2019); see also Rodriguez-Puebla et al. (2020) and Calette et al. (in preparation) for further details. This choice of which set of weightings to use was due to the Sánchez et al. (2019) weightings being more robust at lower stellar masses and more detailed in its treatment of galaxy colour. However, since the sample-weighting calculations are similar, we find that the results shown here are unchanged when the Wake et al. (2017) sample weightings are used instead. The adopted galaxy weights are reliable for galaxies with stellar mass , making this the limit above which each of the properly-weighted samples are effectively volume-limited.
3.2 Comparison to single-fibre spectra
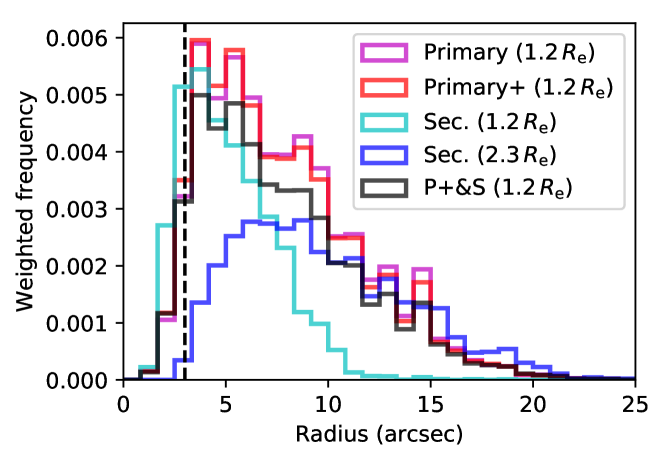
The weighted distributions of angular radii for each of the samples is shown in Figure 1. For each of the samples, the majority of galaxies’ radius threshold (as used in this work; see Section 4) is larger than the radius probed by single-fibre SDSS spectra, highlighting the extra information available with integral-field spectroscopic observations. As well as including more of the total star-formation in the Universe, the spectra we use here are measuring consistent radii in all galaxies regardless of their observed redshift.
4 Spectral fitting
In Peterken et al. (2021), we describe how we implemented full-spectrum fitting techniques to each Primary+ galaxy. We use an identical method here but also including galaxies in the Secondary sample. To summarise; we removed emission lines from each spaxel using the DAP’s emission-line spectrum, and combined all spaxels’ spectra within of each galaxy after removing line-of-sight velocities. We then fit a single spectrum of the stellar component for each galaxy using Starlight, with a combination of 54 single stellar population (SSP) spectra from the E-MILES (Vazdekis et al., 2016) and Asa’d et al. (2017) libraries as templates. We also assume a Calzetti et al. (2000) dust extinction model and fit within the range . Typical combined signal-to-noise ratios for each galaxy within the fitting range are at least . Further description of the fitting method can be found in Peterken et al. (2021), and we also refer the reader to Peterken et al. (2020) for a full assessment of its reliability.
As well as fitting the spectrum of each galaxy sampled to , we also repeat the above fitting method using all spaxels of all Secondary galaxies sampled to . We therefore obtained 9380 individual fits; one of each Primary+ galaxy, and two for each Secondary galaxy (sampled to each radius limit). The two aperture limits were chosen to balance the inclusion of as much of the MaNGA field of view as possible, while avoiding overlap with the hexagonal IFU edges which might contaminate and bias results (see e.g. Ibarra-Medel et al. 2016).
We then obtain a time-smoothed star-formation history of each of the fits using the SSP weights assigned by Starlight using the method described in Peterken et al. (2021). In smoothing, the Starlight-derived star-formation history (in units of ) is first resampled at 250 lookback times which are evenly spaced in log(time) over the range of stellar populations used in fitting, and then convolved in the log(time) axis with a Gaussian function of width .
4.1 Comparison of measured star-formation rates
To establish the trustworthiness of the spectral fitting methods, we compare the measured outputs with known results obtained through established analyses. We find that the total stellar mass measurements for each galaxy agree well with those determined photometrically by the NASA-Sloan Atlas (see Peterken et al. 2020).
We are also able to compare the present-day star-formation rates of each galaxy measured using the Starlight-derived star-formation histories with those calculated entirely independently from H fluxes. For each galaxy, we corrected the DAP’s map of Gaussian-modelled H emission line flux using the Balmer decrement, assuming an intrinsic value of (corresponding to electron temperature K and density cm-3 under Osterbrock & Ferland (2006) “Case B” recombination) and a Calzetti et al. (2000) reddening curve with . Note that in the stellar population modelling in Section 4, we assume , but the lower value is used when considering the emission lines; see Catalán-Torrecilla et al. (2015) and Greener et al. (2020) for an explanation on the difference between dust corrections applied to stellar and gas spectra. These calculations and corrections are detailed fully by Greener et al. (2020).
We then summed the flux from all spaxels within (and for the Secondary sample) which have an emission-line signal-to-noise ratio of at least 10 and calculated the star-formation rate using the relation described by Kennicutt (1998). For consistency with the SSP templates used in fitting with Starlight, we assume a Chabrier (2003) IMF for this calculation.
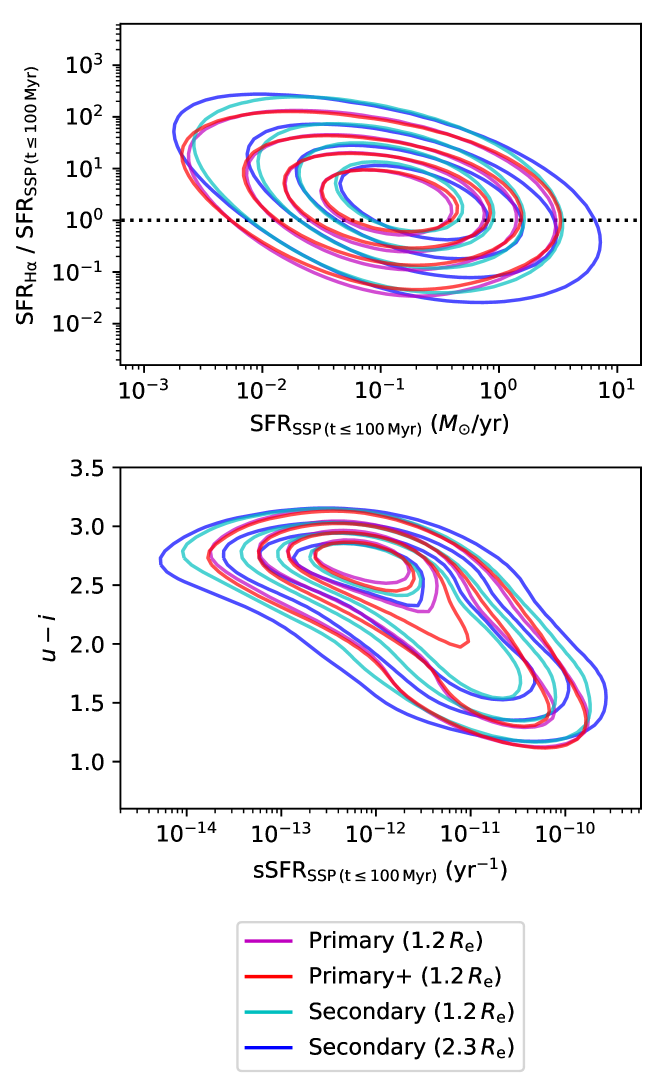
We also calculate a present-day star-formation rate from Starlight by extracting from the smoothed star-formation histories the total mass added to each galaxy over the last . By plotting the offset between and as a function of , we show in Figure 2 that these two measurements of the ongoing star-formation rate are broadly comparable despite the H emission having been removed from the spectra prior to fitting. The offset from the line of equality is to be expected given that the two measurements are using completely different approaches and calibrations, contain differing systematics, and are sensitive to different timescales of star-formation. For the Primary+ sample, we find that the relationship between the two measurements can be described by
| (1) |
with a root mean square deviation of from this best-fit line. Comparable relationships are found for the other samples. The relatively small offset does not affect any conclusions, reassuring that the stellar population fits are reliable.
We obtain Starlight-derived specific star-formation rates by calculating the ratio of to the total Starlight-measured stellar mass contained within each present day galaxy. We also show in Figure 2 that such specific star-formation rates are closely correlated with a galaxy’s NSA broadband colour, with a best-fit relation in the Primary+ sample described by
| (2) |
which has a root mean square devation of . As before, comparable relationships also exist for the other galaxy samples. This link is unsurprising, as the redder band is most sensitive to the low-mass stars which comprise the bulk of a galaxy’s total stellar mass, while the band is more sensitive to bluer stars and is therefore indicative of recent star-formation, making a suitable proxy for specific star-formation rate.
5 The star-formation history of the Universe
Having obtained individual star-formation histories for each galaxy, the cosmic star-formation history can be constructed. To do so, the individual star-formation histories measured for each galaxy must be carefully weighted and combined. In combining galaxy star-formation histories, we account for the lookback time due to the observed reshift of each galaxy. Each star-formation history’s age sampling is shifted onto a lookback-time sampling by adding the galaxy’s redshift’s lookback time. The galaxy star-formation histories are then combined and interpolated onto a common sampling of lookback times.
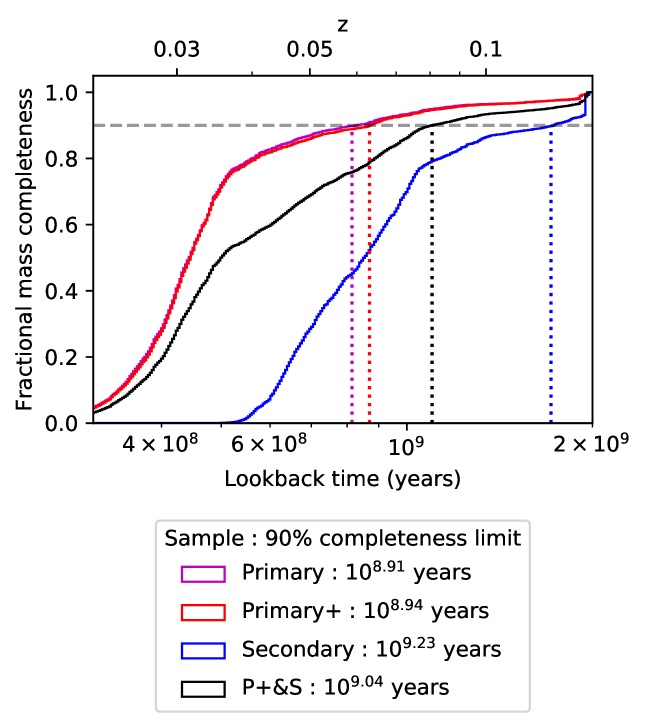
Since the Primary(+) and Secondary samples are selected from different redshift distributions (Wake et al., 2017) — as shown in Figure 3 — any derived star-formation history of the Universe will only be able to probe down to a specific limit in lookback times, depending on which sample is used. Since the distribution of galaxy redshifts within any sample is dependent on the galaxy mass, we only measure cosmic star-formation histories at lookback times greater than that for which each sample has at least 90% completeness in sample-weighted mass. The specific adopted limits are shown in the legend in Figure 3.
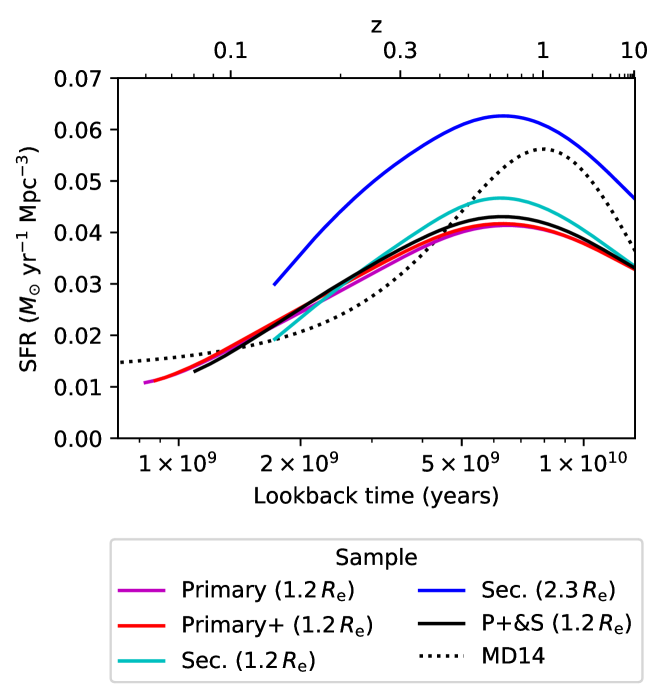
The cosmic star-formation histories measured from each sample is shown for each sample in Figure 4. We show that the calculated star-formation history of the Universe measured within 1.2 of each galaxy agrees well at all lookback times regardless of the MaNGA sample used, and that all samples show a peak cosmic star-formation history at a lookback time of (corresponding to ).
Figure 4 also shows the best-fit function derived by Madau & Dickinson (2014) of the cosmic star-formation history measured through galaxy redshift studies. To ensure a like-for-like comparison, we calculated the mass weights which would be assigned to each SSP template age used in our fitting method based on Equation 15 of Madau & Dickinson (2014), by integrating the curve within a box centred in log-space on each SSP’s nominal age, to obtain a raw star-formation history as might ideally be measured using the stellar population fitting methods described in Section 4. We then smoothed the modelled SSP weights using the procedure described in Section 4 and in Peterken et al. (2021). This smoothing procedure results in the smoothed profile showing a broader peak in the cosmic star-formation history which occurs at a lower redshift (at rather than ) compared to the unsmoothed Madau & Dickinson (2014) best-fit function (not shown).
We find that the smoothed Madau & Dickinson (2014) star-formation history is in general agreement with the results obtained through the completely independent approach performed here — with particularly strong agreement at lookback times less than () — lending further evidence that such a fossil record analysis is trustworthy. We suggest that the broader peak obtained here is due to having co-added multiple star-formation histories which have each been smoothed to rather than simply smoothing a single function by in the comparison measurement. We argue that this effect could also partly explain the difference in lookback times to the peak in cosmic star formation, although the observed difference is small given the entirely independent approaches of the two methods. Our results also show good quantitative agreement with the cosmic star-formation histories obtained through fossil-record analyses performed by both López Fernández et al. (2018) and Sánchez et al. (2019), and also with the earlier best-fit parametric models to observational redshift studies determined by Behroozi et al. (2013) and Hopkins & Beacom (2006).
If the measured lookback time corresponding to the peak of cosmic star-formation was dictated primarily by artefacts of the SSP templates or of the fitting method, we would expect to find that the peak in each galaxy’s individual star-formation history might be biased towards a certain stellar population age. In such a case, the derived cosmic star-formation history measured in each sample would therefore display its peak at different lookback times once galaxies’ observed redshifts are accounted for, since each MaNGA sample targets galaxies from different redshift distributions. The close match between star-formation histories shown in Figure 4 therefore shows that the signal being measured is intrinsic to the data rather than being the product of artefacts. Indeed, we find that the agreement between the star-formation histories measured using each MaNGA sample is only seen when the galaxy redshifts are taken into account, and that the above close agreement is smaller than the difference in median lookback times for each sample’s galaxy populations.
We find that increasing the aperture from to using the Secondary sample results in a cosmic star-formation history which is greater at all lookback times than Madau & Dickinson (2014)’s best fit to cosmological results. This excess could either be due to overly-conservative aperture corrections or to surface brightness limits causing cosmological studies to have underestimated the total star-formation rates at different redshifts.
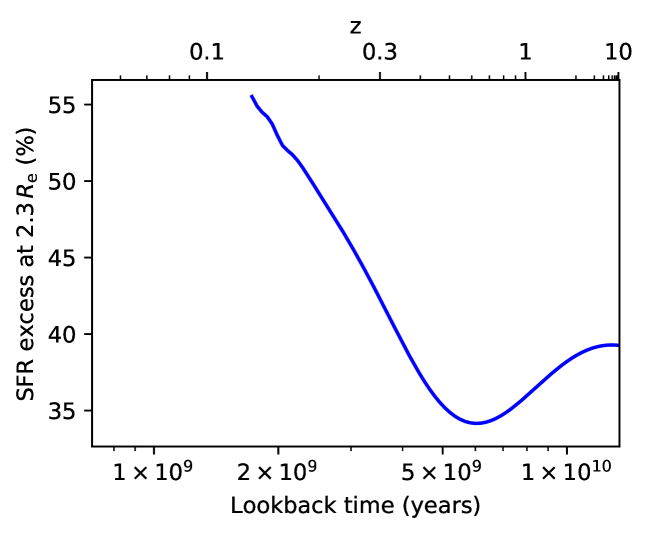
Having derived the cosmic star-formation history using the Secondary-sample galaxies with radius limits of and separately, we are able to quantify what extra fraction of star-formation is included by increasing the FOV diameter by a factor of . Comparison between the two Secondary-derived cosmic star-formation histories of Figure 4 shows that the effect of the increased FOV results in a 35–40% enhancement in the measured star-formation histories at lookback times , increasing to a 55% enhancement by , as illustrated in Figure 5. This increase over time is indicative of inside-out growth resulting in a greater star formation contribution by the galaxy outskirts at more recent times, as we explored for spiral galaxies in Peterken et al. (2020); see also Pérez et al. (2013); Ibarra-Medel et al. (2016); García-Benito et al. (2017); Goddard et al. (2017). It is interesting to note that even at recent times, the ratio in star-formation rate between larger to the smaller aperture of is smaller than the corresponding ratio of sky coverage area (), showing that star-formation density is still greatest at galactic centres on average despite the effect of inside-out growth.
5.1 Size222We are not using “size” here in its usual meaning of a galaxy’s physical or apparent radius or diameter; rather, we mean its stellar mass. Still, such a simple substitution is suitable to sufficiently sustain a satisfactory sibilance with subsequent subheadings.: effects of present-day stellar mass
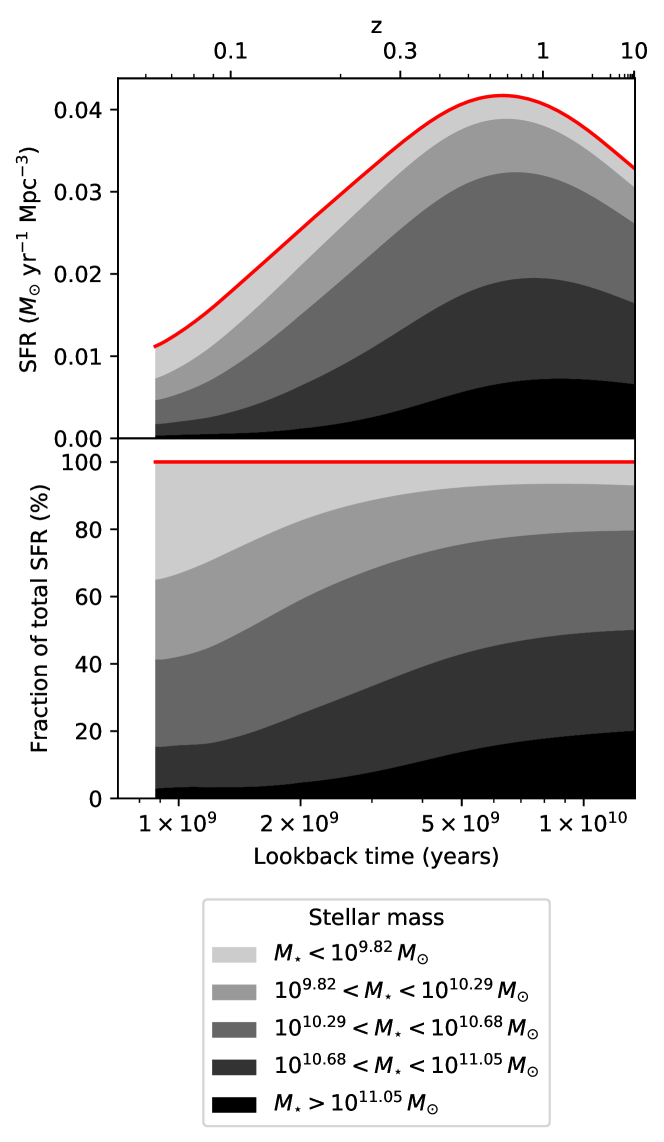
Having obtained the cosmic star-formation history, we now begin to explore the connection between a galaxy’s present-day physical properties with its historical contribution to the Universe’s star-formation. We split the galaxy sample into five discrete bins of present-day photometrically-measured stellar mass such that each bin contains an equal (unweighted) number of Primary+-sample galaxies. The thresholds of these bins and the star-formation history of the Universe split into contributions of these mass bins are shown in Figure 6. We have shown the stellar-mass breakdown for the Primary+ sample within , but all other samples’ are similar. We see that the star-formation contribution from higher-mass galaxies becomes less significant at more recent times. For example, galaxies with present-day stellar mass dominated the cosmic star formation until ago to contribute only in the local Universe. We have therefore recovered the known observational effects of downsizing.
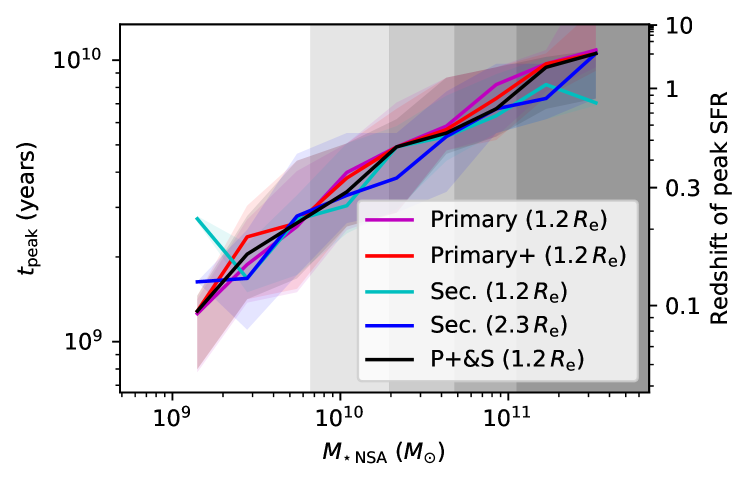
A similar perspective of downsizing is gained by measuring the lookback time at which each individual galaxy reached its maximum star-formation rate. The volume-weighted median lookback time of peak star-formation in galaxies as a function of their present-day stellar mass is shown in Figure 7. We find that the peak in star formation typically occurred at ago (corresponding to ) in the galaxies with the highest present-day stellar masses in the samples (), falling to () for galaxies with present-day stellar masses of . We also see some signs of downsizing effects being strongest among low-mass galaxies where the gradient is greatest.
By measuring the lookback time by which galaxies had built the bulk of their present-day stellar mass, Ibarra-Medel et al. (2016), García-Benito et al. (2017), and Peterken et al. (2020) have previously found that low-mass galaxies typically show larger variation in the characteristic formation times than high-mass galaxies. However, we find here that the scatter in remains approximately constant at over all stellar masses. The two results are not incompatible: we interpret such an apparent dichotomy as indicative of low-mass galaxies having greater variation in the rate of decline in star-formation after their common peak time.
Figure 7 again shows strong agreement between each MaNGA sample. We therefore present hereafter only results measured using the Primary+ sample, but results for other samples are similar throughout.
5.2 Shade: effects of present-day colour
By splitting each galaxy sample by the galaxies’ locations on the stellar mass–colour plot, we are also able to investigate the effect of present-day colour on a galaxy’s contribution to the cosmic star-formation history.
5.2.1 Colour classifications

We separate galaxies by their colours according to the following criteria:
-
•
Red sequence:
-
•
Green valley:
-
•
Blue cloud:
where the galaxies’ stellar masses (measured in ) and broadband colours are taken from the NSA (Blanton et al., 2011) photometry-derived measurements.333Note that a galaxy’s broadband colour is affected by its inclination due to increased internal dust extinction. We do not attempt to correct for this effect, so that our measurements resemble those of other studies of galaxy populations as closely as possible. These thresholds and the subsequent classifications of Primary+ galaxies are illustrated in Figure 8.
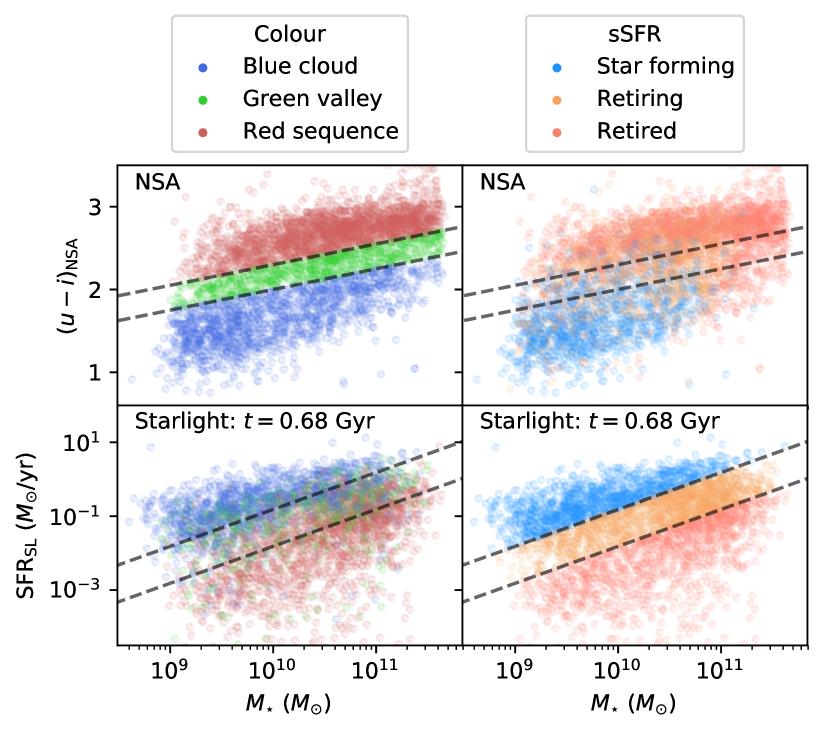
We showed in Section 4.1 and Equation 2 that broadband colour and specific star-formation rate are closely correlated. To demonstrate how the above colour classifications are linked to star-formation properties, we have also split the galaxy sample into star-forming, retiring, and retired populations using thresholds of and — as used in Peterken et al. (2021) — where is the ratio of the average Starlight-measured instantaneous star-formation rate to the Starlight-measured instantaneous stellar mass at a lookback time of , which is the lowest lookback time measurable with the Primary+ sample as defined in Figure 3. Figure 9 shows a direct comparison of galaxies’ classifications under both schemes on the – plane (using NSA-measured colours and stellar masses ) and on the – plane at a lookback time of (using Starlight-derived star-formation rates SFRSL and stellar masses ). We find that most star-forming galaxies map onto the blue cloud region, most retiring galaxies to the green valley region, and most retired galaxies to the red sequence region, and vice-versa, showing that the colour classifications defined above are broadly analogous to classifications of star formation444This strong link is by constuction; we chose the broadband colour in Section 4.1 as a proxy for specific star-formation rate due to the sensitivity of to recent star-formation and to the total stellar mass. Classifications based on broadband colours at longer wavelengths (e.g. ) will not be so closely linked to the classifications of specific star-formation rates., and therefore linking the observed measurements to physical galaxy properties.
Having demonstrated the commutativity of broadband colour and specific star-formation rate, it would be feasible to investigate how either of these properties relates to a galaxy’s history. Ibarra-Medel et al. (2016) showed that colour and specific star-formation rate have similar effects on the star-formation history of galaxies. However, since colour is a more readily-measurable property of a galaxy, we will continue to investigate the role of present-day broadband colour rather than present-day specific star-formation rate in the analysis shown here, for more straightforward application of the results to other studies of galaxy populations.
5.2.2 Present-day colour and the star-formation history of the Universe
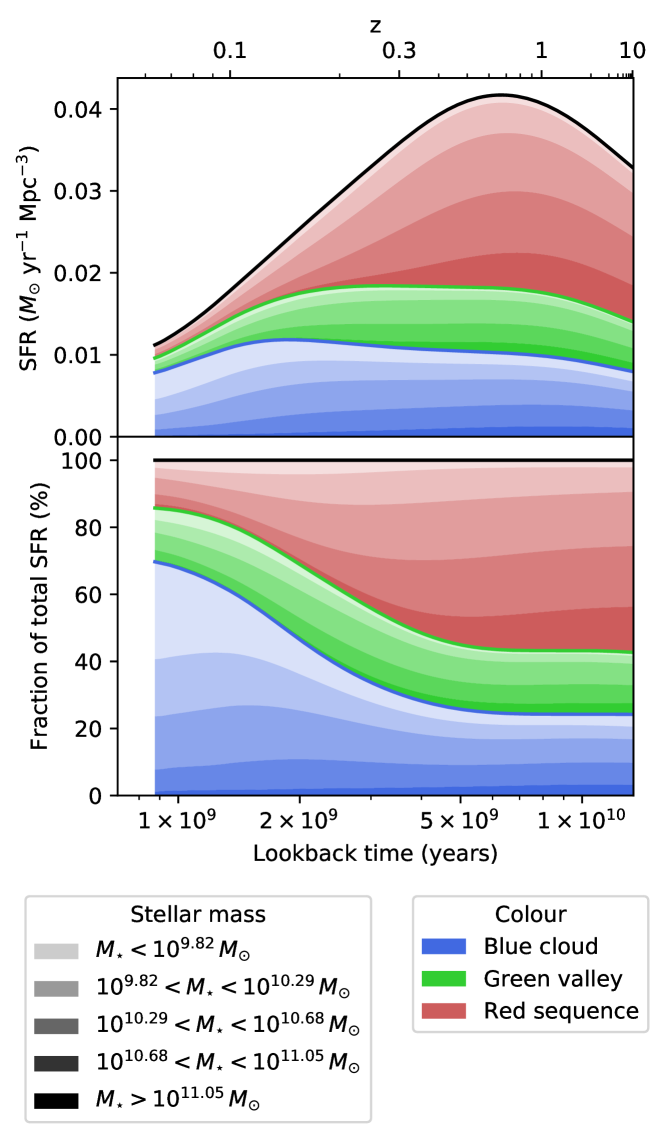
Figure 10 shows the Primary+-derived star-formation history of the Universe showing the relative contributions from galaxies classified as currently belonging to the blue cloud, the green valley, and the red sequence as defined above. There is a strong correlation between a galaxy’s present-day colour and its past contribution to the total star formation, with the blue cloud contributing only 20% at early times and rising to more than 70% at the present day. We recover how galaxies which are currently exhibiting very low levels of star formation were once the dominant source of new stars.
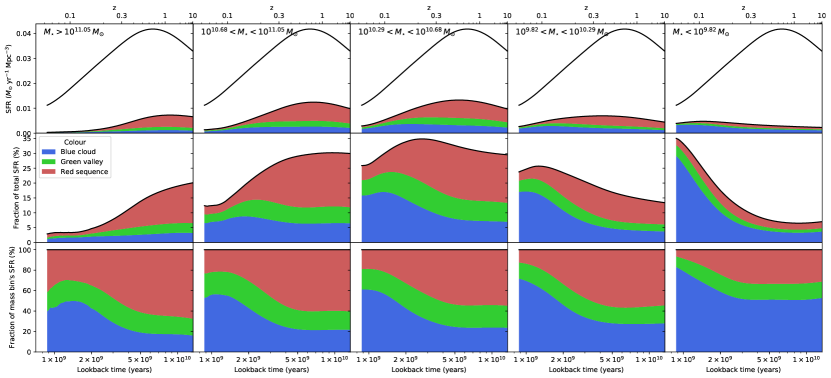
However, stellar mass and colour classification are not independent galaxy properties, as can be seen in Figure 8. Specifically, high-mass galaxies are more likely to belong to the red sequence and vice-versa. To determine how the effect of present-day colour varies with a galaxy’s stellar mass, we show the relative contribution of each colour classification to each mass bin’s star-formation history in Figure 11. We find that the blue cloud’s increase in contribution to the star-formation history between lookback times of 10 and 1 Gyr varies from a % increase in the highest-mass bin to a % increase in the lowest-mass bins:555The discrepancy between these mass-bin values and the increase of % in the blue cloud’s contribution overall is due to the dependent nature of colour and stellar mass: lower-mass bins with a larger fraction of blue cloud galaxies becoming more dominant at more recent times. a galaxy’s colour is therefore more strongly correlated to its historical contribution to the star-formation history in low-mass than in high-mass galaxies.
We additionally see some evidence for the colour designations reflecting shorter star-formation timescales in low-mass galaxies than in their high-mass counterparts. The most massive blue cloud galaxies began increasing their contribution to that mass bin’s star-formation history ago to reach its current level ago, while the lowest-mass bin’s blue cloud only started to become more dominant ago and appears to still be increasing to the present-day.
We find that galaxies currently in the green valley have contributed an approximately constant 20% to the star-formation history in all mass bins. Such a consistency of the green valley’s contribution between mass bins is to be expected assuming that the timescale of star-formation transition is independent of stellar mass. However, the constancy of the present-day green valley’s contribution over the last indicates a complex picture. If these galaxies are those caught in the act of a rapid “quenching” transition from the blue cloud to the red sequence or a rapid rejuvenation transition in the opposite direction, it would be expected that their historical contributions to the cosmic star-formation history should be similar to either the blue cloud’s or the red sequence’s until recent times. The fact that this does not hold true could hint towards the possibility that the galaxies designated as belonging to the green valley using the colour criteria above contain a mix of quenching and rejuvenating galaxies. However, further analysis of the individual star-formation histories of galaxies currently in the green valley shows that this is not true in that most show declining levels of star-formation over the last Gyr, and there is no significant population of rejuvenating green valley galaxies. Instead, it seems that most present-day green valley galaxies have always had low but sustained levels of star formation, with star-formation histories which have generally followed the star-formation history of the Universe as a whole.
While we do not speculate here as to a possible physical explanation for this observation, it might reflect the slower retiring processes proposed by Schawinski et al. (2014), for example. Possible drivers of such a “slow quenching” scenario are thought to be predominantly internal processes (Martig et al., 2009; Fang et al., 2013; Bluck et al., 2014; Smethurst et al., 2018; Das et al., 2021). There is observational evidence to suggest that cessation of star-formation occurs on long (several Gyr) timescales in a significant number of galaxies, including ellipticals (see e.g. Smethurst et al. 2015, 2017; Belfiore et al. 2018; Lacerna et al. 2020), although other studies argue otherwise (see e.g. Bremer et al. 2018).
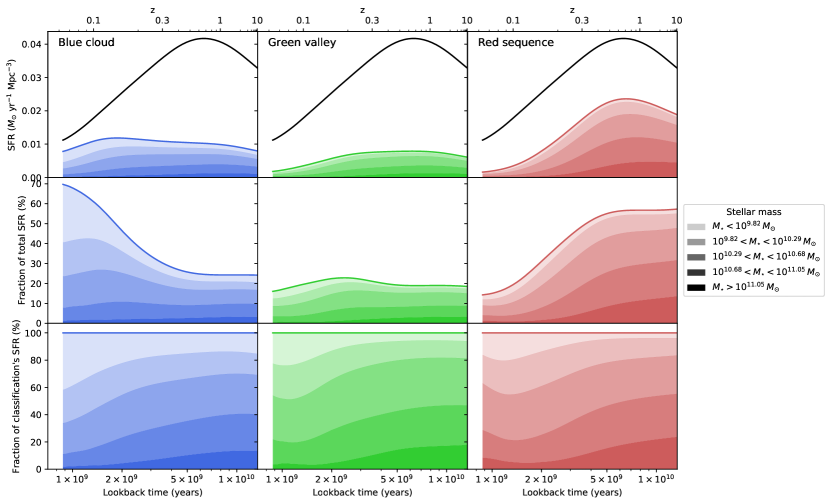
By considering how galaxies of each colour classification in the five bins of stellar mass used in Section 5.1 have contributed to the cosmic star-formation history, we see in Figure 10 some signs of downsizing effects being present in all colour classifications; low-mass galaxies of all colours become relatively more dominant at smaller lookback times. To measure how downsizing effects vary between colour classifications in this way, we also show the relative contribution of galaxies in each mass bin to each colour classification’s star-formation history in Figure 12. We find evidence for downsizing having occurred most strongly in galaxies currently in the blue cloud, with galaxies in the two lowest-mass bins increasing their contribution by 20% in the red sequence and 30% in the blue cloud, with the green valley lying in between.
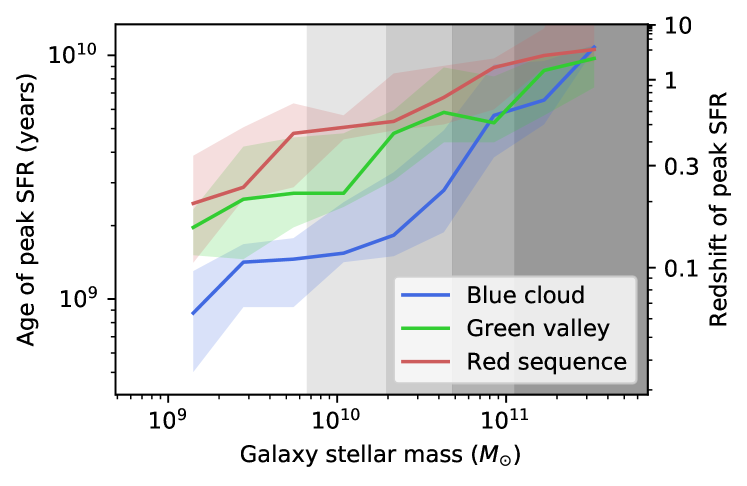
This difference in the strength of the downsizing effect seen in galaxies of different colour classifications is illustrated further in Figure 13, where we see that red sequence galaxies reached peak star formation at earlier times than green valley or blue cloud galaxies at all stellar masses, but that this effect is greatest in low-mass galaxies.
5.3 Shape: effects of present-day morphology
Having quantitatively measured the link between a galaxy’s present day colour and its historical contribution to the cosmic star-formation history, we can now independently assess the relative role of a galaxy’s present-day morphology.
5.3.1 Morphological classifications
Over 91% of galaxies in all MaNGA samples have been classified by the Galaxy Zoo “citizen science” project (Lintott et al., 2008), in which volunteers are asked to classify galaxies’ morphological features. We make use of the redshift-debiased vote fractions of Hart et al. (2016) from Galaxy Zoo 2 (Willett et al., 2013) to split the galaxy samples by their present-day morphology. We classify each galaxy according to the following criteria:
-
•
Elliptical:
-
•
S0: and
-
•
Spiral: and
where indicates the debiased vote fraction for [class] from Hart et al. (2016). These thresholds were chosen to minimise the number of unclassifiable or ambiguous galaxies, and are therefore less stringent than those recommended by Willett et al. (2013), and hence open to significant contamination between morphological classes.
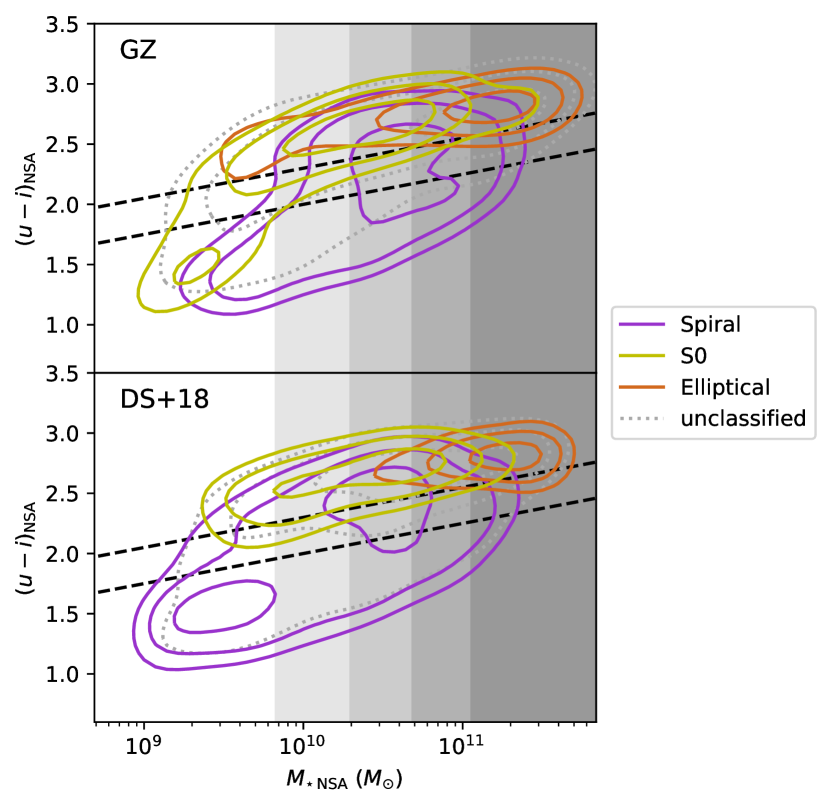
The stellar mass–colour distribution of the Primary+ galaxies indicating their Galaxy Zoo morphologies is shown in the upper panel of Figure 14. Over most of the sample’s range in stellar mass, the spirals occupy the bluer region of parameter space, but at the low-mass () end, blue galaxies are likely to have been classified as earlier-type galaxies, as we noted in Peterken et al. (2021). This unexpected trend is likely because spiral structure in low-mass disk galaxies is harder to discern in SDSS imagery due to resolution effects. The classifications we have implemented from the vote fractions to minimise the number of unclassified galaxies will therefore result in a high level of contamination between morphologies. A lower spiral vote-fraction threshold might more reliably distinguish between morphologies in low-mass galaxies, but only at the expense of increasing the number of high-mass early-type disk galaxies being mis-classified as spirals. Alternatively, using the recommended criteria of Willett et al. (2013) to obtain clean samples of galaxies of each morphology creates a large number of unclassified “ambiguous” galaxies, which when removed from the sample will render the MaNGA sample weightings described in Section 3.1 inaccurate. However, we have repeated the analysis using debiased vote fraction thresholds of 80% instead of 50% in the criteria above and found no change to the results at high stellar masses, but at low stellar masses the dominance of galaxies with “ambiguous” morphologies makes any quantitative results impossible.
Alternative morphological classifications using the deep learning methods developed by Domínguez Sánchez et al. (2018) are available for galaxies which were part of the SDSS data release 15 (DR15; Aguado et al. 2019). This approach uses Galaxy Zoo and Nair & Abraham (2010) classifications as training sets to classify SDSS galaxy images. Instead of replicating vote fractions for the presence of morphological features in each galaxy, the Domínguez Sánchez et al. (2018) approach directly provides a prediction for each galaxy’s morphological T-type. The resulting separation of different morphologies is cleaner at low stellar masses in the colour–mass plane, as illustrated in the lower panel of Figure 14. The question then arises of which classification method should be used. Fortunately, in most cases we find that the results presented here do not change depending on which classification we use and we have therefore primarily presented results using the Galaxy Zoo classifications to make use of the larger sample size. In the instances where we find that the two classification methods provide conflicting results, we will describe and discuss those differences.
5.3.2 Present-day morphology and the star-formation history of the Universe
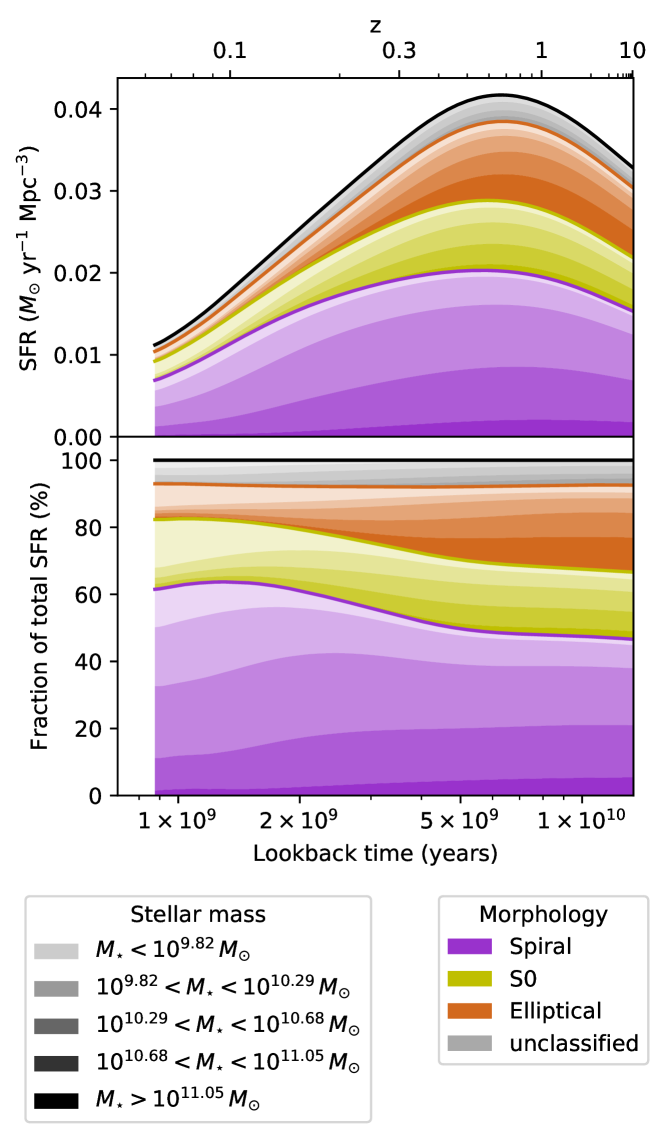
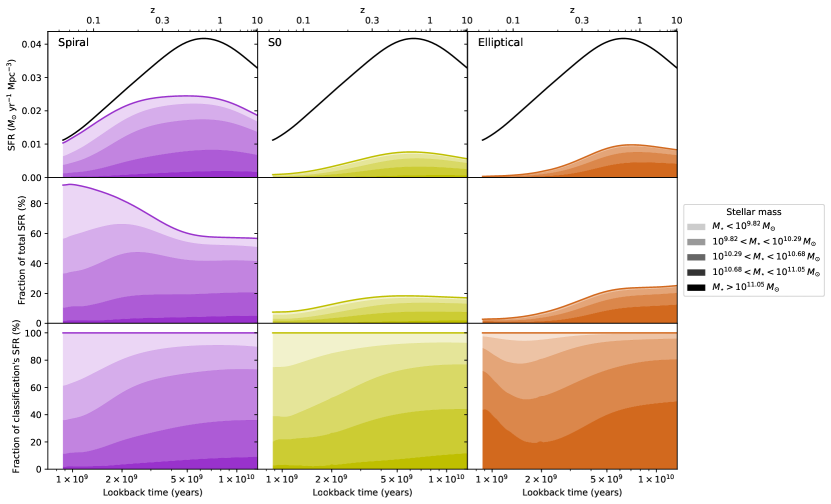
The cosmic star-formation history separated into contributions from galaxies of different present-day stellar masses and the Galaxy Zoo morphologies is shown in Figure 15. Present-day spiral galaxies have contributed the greatest amount (at least 40%) to the total star formation of any morphology at all lookback times, and contribute the majority (60%) at the present day. This 20% morphology effect on a galaxy’s past contribution to the star-formation history of the Universe is smaller than the 40% colour increase seen in Figure 10, implying that colour is a stronger indicator of a galaxy’s full star-formation history than morphology, as found by others (e.g. Ibarra-Medel et al. 2016).
We find that a galaxy’s morphology only reflects the last of its star-formation history on average, in that the relative contributions to the cosmic star-formation history by galaxies of different morphologies did not change until this lookback time. We have previously demonstrated this result in more detail (see Peterken et al. 2021).
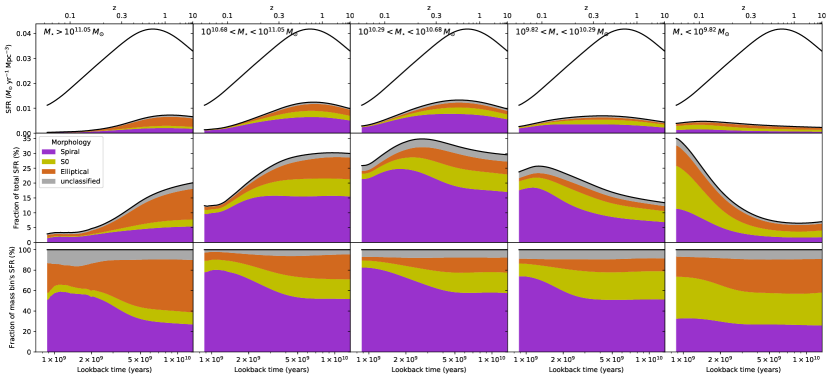
However, morphology and mass are correlated, as shown in Figure 14: observed morphology effects could be simply a result of early-type galaxies having higher stellar mass on average, and will therefore exhibit star-formation histories with higher star-formation rates at earlier lookback times than their late-type and less massive counterparts, as we saw in Figure 7. To properly distinguish between downsizing and morphological effects, Figure 16 shows the same data as in Figure 15 but with each mass bin separated. We find that regardless of the morphological composition of the mass bin, spirals have increased their contribution to the star-formation history by % between lookback times of 10 and 1 Gyr. We therefore find the effects of present-day morphology on the contribution to the star-formation history of the Universe to be independent of present-day stellar mass.
However, we also see some evidence for the morphological classifications reflecting different timescales of star-formation histories in different mass bins in the same manner as we saw for the colour classifications in Figure 11. Spiral galaxies with the largest present-day stellar mass began increasing in their contribution to their mass bin’s star-formation history ago to reach the current level ago, compared to ago for the lowest-mass spirals to start increasing their contribution with a trend of continued increase.
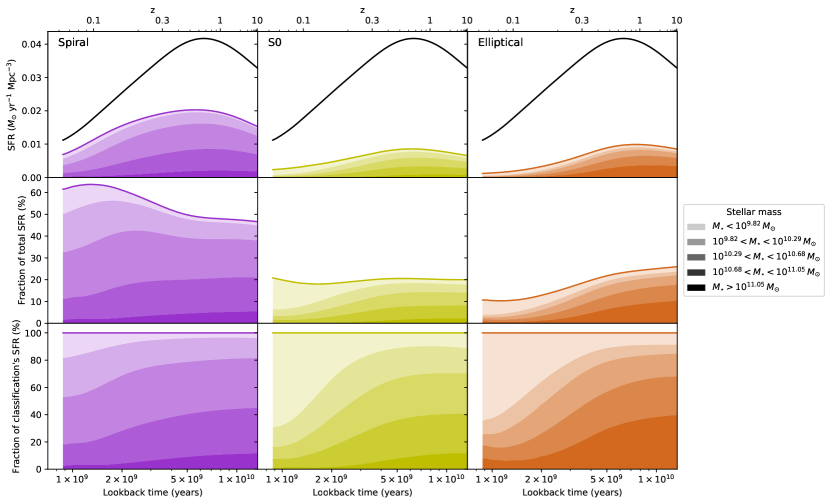
As in Figure 10, we are also able to reorganise the area plot of Figure 15 by morphology, to show how galaxies of different present-day stellar masses have contributed to each morphological classification’s star-formation history to reveal how the effects of stellar mass change among galaxies of different morphologies, as shown in Figure 17. For the Galaxy Zoo morphologies, we find that downsizing effects are stronger in earlier-type galaxies; galaxies in the lowest-mass bin become more dominant among lenticular and elliptical galaxies at smaller lookback times than the equivalent effect in spiral galaxies.
However, when using the Domínguez Sánchez et al. (2018) machine learning morphological classifications — as shown in Figure 18 — we find the opposite; spiral galaxies show stronger downsizing effects than lenticular or elliptical galaxies. We also find that elliptical galaxies have contributed almost no star formation in the last . This difference highlights how carefully morphological classifications must be used to avoid biases associated with the difficulties inherent in identifying structures in low-mass galaxies.
The observed differences are easily explained by uncertainty in the classification of low-mass spiral galaxies, which appears to be more reliably resolved by the machine learning approach. We wish to stress here that such a discrepancy merely highlights the importance of careful consideration of what exact morphological classifications are being used, and does not imply that Galaxy Zoo classifications are inherently flawed. Instead, we argue that studies using any morphological classification method should be wary of how galaxies with potentially ambiguous morphologies are treated. This is especially important if the classification scheme is based on a “pure” Hubble approach, which often contains significant subjectivity (Naim et al., 1995) and assumptions (Freeman, 1970; Hart et al., 2017, 2018; Masters et al., 2019), and does not necessarily reflect the physical processes occurring within galaxies (Cappellari, 2016; Wang et al., 2020). Indeed, we note again here that the implementation of morphological classifications using Galaxy Zoo vote fractions described in Section 5.3.1 goes contrary to the advice of Willett et al. (2013), who detail how low-contamination samples of Galaxy Zoo galaxies with any required morphology can be effectively obtained.
In Figure 18 (and to a lesser extent also in Figure 17), we see some apparent “upsizing” occurring in elliptical galaxies; high-mass galaxies appear to increase their relative contribution to the star-formation history of all ellipticals in the last . This phenomenon is likely due to the problems that we addressed in Peterken et al. (2020) of the “UV upturn” (see also Yi 2008; Cid Fernandes & González Delgado 2010) being most dominant in high-mass ellipticals due to their extremely old stellar populations. That this effect is strongest using the Domínguez Sánchez et al. (2018) morphological classifications is therefore due to the population of possibly misclassified low-mass galaxies in the Galaxy Zoo classifications diluting the effect with “real” star formation; see also Fischer et al. (2019, Section 4.4) who describe this phenomenon in more detail. However, we note that the observed effects are extremely small; even with this spurious increase of star-formation rate in high-mass elliptical galaxies, those galaxies still only account for of the star formation in the present-day Universe regardless of which morphological classification method is used, so these effects do not significantly affect the derived cosmic star-formation history.
We find the total star-formation histories of all galaxies with stellar mass (i.e. in the three bins of greatest stellar mass) to be similar for lenticular and elliptical classifications. This similarity could imply that all massive present-day early-type galaxies have experienced similar star-formation histories, with the difference in morphologies due to other factors such as merger rate histories. Alternatively, it could be evidence for visually-determined shape being an ineffective way to separate the bimodality of fast- and slow-rotating early-type galaxies (Emsellem et al., 2007; Cappellari et al., 2011; Cappellari, 2016; Graham et al., 2018), or a combination of both of these effects.
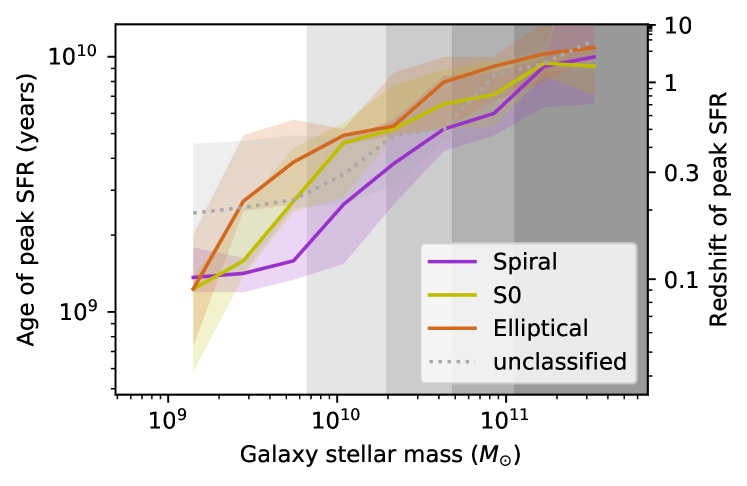
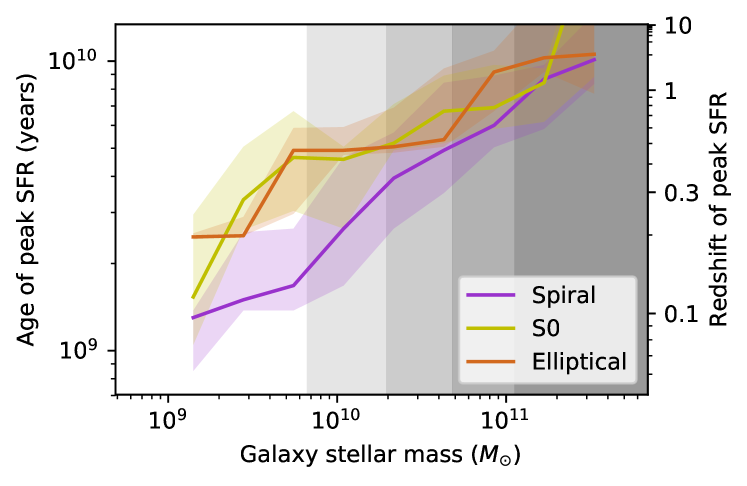
By comparing the lookback time of peak star formation of galaxies with different present-day morphologies in Figures 19 (for Galaxy Zoo morphologies) and 20 (for Domínguez Sánchez et al. (2018) machine learning morphologies), we see that spiral galaxies peaked more recently than early-type galaxies at all present-day stellar masses regardless of the classification method. We find that this difference is greater in galaxies with low stellar mass, and is greatest around ; above this threshold we find that both classification schemes display stronger downsizing among spirals than in early-type galaxies, in agreement with Goddard et al. (2017).
We also find that the peak in star-formation history of lenticular and elliptical galaxies is similar for early-type galaxies with stellar masses using the Galaxy Zoo classifications (Figure 19) and for stellar masses using the Domínguez Sánchez et al. (2018) classifications (Figure 20), again reflecting either the similar histories of these galaxies or the difficulty in distinguishing between them through imagery alone. We see that the star-formation peak in present-day lenticular galaxies classified by Galaxy Zoo becomes systematically more recent for lower stellar masses, highlighting likely contamination of mis-classified spiral galaxies using the thresholds applied here.
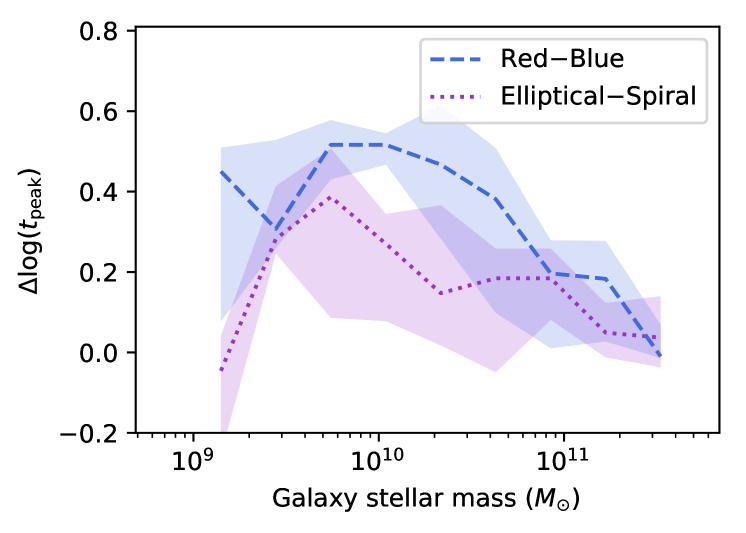
However, regardless of which classification method is used, we see again that the effect of morphology on a galaxy’s contribution to the cosmic star-formation history is smaller than the effect of colour: the difference in peak star-formation times between early- and late-type galaxies is smaller than the difference between blue cloud and red sequence galaxies ( dex and dex respectively at for example). This is illustrated at all present-day stellar masses in Figure 21.
6 Size versus shade versus shape: Conclusions and interpretation
Here, we have recovered evidence for downsizing, in that the fraction of star-formation occurring in the galaxies with greatest present-day stellar mass was largest at early times, with low-mass galaxies dominating the cosmic star-formation at more recent times, and that the lookback time corresponding to a galaxy’s peak star-formation rate is therefore correlated with its present-day stellar mass. We find that this correlation exhibits the strongest gradient among low-mass galaxies, suggesting accelerating downsizing at more recent times. By further splitting the galaxy sample, we subsequently showed that downsizing effects are present in galaxies of all present-day colours (which we showed to be analogous to specific star-formation rate) and morphologies. A galaxy’s present-day stellar mass is therefore a significant indicator of its star-formation history regardless of its other properties.
In quantifying these effects, we found that galaxies currently in the blue cloud exhibited stronger downsizing effects than those in the green valley or red sequence. However, we found some differences in whether downsizing is strongest in present-day early- or late-type galaxies depending on which classification method was used, which we argue is due to our non-standard implementation of Galaxy Zoo morphologies, and therefore highlights the care that must be taken when separating galaxies by their visual morphologies. Reassuringly, there is agreement that late-type galaxies exhibit the stronger downsizing effects among galaxies with stellar mass and that high-mass elliptical and lenticular galaxies have had similar star-formation histories.
Irrespective of classification scheme, we find that the effect of present-day colour is greater than the effect of present-day morphology on a galaxy’s star-formation history — confirming previous results (Ibarra-Medel et al., 2016; García-Benito et al., 2019) — in that the contribution from present-day blue cloud galaxies increased by over the past but that from spirals only increased by over the same time period by comparison. Similarly, although we found that present-day spirals and blue cloud galaxies exhibited the more recent peaks in star-formation at all stellar masses, the typical difference between spiral and elliptical galaxies () is less than that between blue cloud and red sequence galaxies (). These results suggest that galaxies of similar morphologies are more likely to have undergone more significantly different histories compared to the equivalent variation in histories among galaxies of similar colours.
However, we also find evidence that these straightforward results do not tell the complete story. Specifically, we find that both present-day colour and morphology reflect only the more recent star-formation histories among lower-mass galaxies compared to their counterparts with high stellar mass. We interpret this as reflective of a galaxy’s inertia to change. The physical processes required to suppress or rejuvenate star-formation or to restructure a galaxy must occur over longer timescales to significantly alter a massive galaxy’s observed properties. Meanwhile, the tidal, stripping, starvation, or inflow processes experienced by less massive galaxies are able to affect their star-formation rates (and therefore colours) and morphologies much more rapidly.
We have therefore demonstrated that a galaxy’s mass, colour and morphology — size, shade and shape — all indicate its historical contribution to the cosmic star-formation history, but to different extents and with codependencies such that all three properties must be considered to build a full picture.
7 Summary
Using an established stellar population “fossil record” analysis, we obtained star-formation histories of the inner of 6861 galaxies from the SDSS-IV MaNGA survey, with 2519 galaxies also sampled to . By carefully weighting each galaxy to create an effectively volume-limited sample, we inferred the star-formation history of the Universe, which was found to be in general agreement with previous observations of galaxy populations at different redshifts.
We showed that a galaxy’s star-formation history is linked to its present-day mass, its colour, and its morphology, although colour is more strongly connected than morphology regarding historical contributions to the cosmic star-formation history. We also found evidence for downsizing effects being significant in galaxies of all present-day colours and morphologies, in that low-mass galaxies of all types have become more dominant in their contribution to the cosmic star-formation rate in more recent times. These effects, however, were found to be most significant among galaxies currently in the blue cloud. Different morphological classification schemes gave contradictory results on whether downsizing is strongest among galaxies designated as being currently early or late type, but show agreement that spiral galaxies exhibit the stronger effects among galaxies with present-day stellar mass .
We also found that the historical contribution to the cosmic star-formation history from galaxies currently in the “green valley” does not directly follow that of either the blue cloud or the red sequence populations, with these galaxies’ star-formation histories being remarkably representative of that of the Universe as a whole.
These results once again demonstrate the power of stellar population fossil record techniques in uncovering the link between the Universe’s past with the galaxies we see today.
8 Data Availability
This publication uses the team-internal MPL-9 version of the MaNGA science data products, which are broadly similar to previous versions available publicly through SDSS Data Releases DR13 (Albareti et al., 2017), DR14 (Abolfathi et al., 2018), and DR15 (Aguado et al., 2019). Comparable data products containing the full MaNGA galaxy sample — including the full sample used here — will be publicly released in 2021 as part of SDSS DR17, as will the raw data and all previous versions of the data reduction pipeline.
Acknowledgements
The authors thank the anonymous reviewer for their helpful suggestions and improvements to this paper.
The authors also thank S. F. Sánchez, D. Wake, A. R. Calette and A. Rodriguez-Puebla for their extensive help and support on the technical aspects of this work.
Funding for the Sloan Digital Sky Survey IV has been provided by the Alfred P. Sloan Foundation, the U.S. Department of Energy Office of Science, and the Participating Institutions. SDSS acknowledges support and resources from the Center for High-Performance Computing at the University of Utah. The SDSS web site is www.sdss.org.
SDSS is managed by the Astrophysical Research Consortium for the Participating Institutions of the SDSS Collaboration including the Brazilian Participation Group, the Carnegie Institution for Science, Carnegie Mellon University, the Chilean Participation Group, the French Participation Group, Harvard-Smithsonian Center for Astrophysics, Instituto de Astrofísica de Canarias, The Johns Hopkins University, Kavli Institute for the Physics and Mathematics of the Universe (IPMU) / University of Tokyo, the Korean Participation Group, Lawrence Berkeley National Laboratory, Leibniz Institut f ur Astrophysik Potsdam (AIP), Max-Planck-Institut f ur Astronomie (MPIA Heidelberg), Max-Planck-Institut f ur Astrophysik (MPA Garching), Max-Planck-Institut f ur Extraterrestrische Physik (MPE), National Astronomical Observatories of China, New Mexico State University, New York University, University of Notre Dame, Observatório Nacional / MCTI, The Ohio State University, Pennsylvania State University, Shanghai Astronomical Observatory, United Kingdom Participation Group, Universidad Nacional Autónoma de México, University of Arizona, University of Colorado Boulder, University of Oxford, University of Portsmouth, University of Utah, University of Virginia, University of Washington, University of Wisconsin, Vanderbilt University, and Yale University.
This publication uses data generated via the Zooniverse.org platform, development of which is funded by generous support, including a Global Impact Award from Google, and by a grant from the Alfred P. Sloan Foundation.
We are grateful for access to the University of Nottingham’s Augusta high performance computing facility.
References
- Abolfathi et al. (2018) Abolfathi B., et al., 2018, ApJS, 235, 42
- Aguado et al. (2019) Aguado D. S., et al., 2019, ApJS, 240, 23
- Albareti et al. (2017) Albareti F. D., et al., 2017, ApJS, 233, 25
- Asa’d et al. (2017) Asa’d R. S., Vazdekis A., Cerviño M., Noël N. E. D., Beasley M. A., Kassab M., 2017, MNRAS, 471, 3599
- Behroozi et al. (2013) Behroozi P. S., Wechsler R. H., Conroy C., 2013, ApJ, 770, 57
- Belfiore et al. (2018) Belfiore F., et al., 2018, MNRAS, 477, 3014
- Belfiore et al. (2019) Belfiore F., et al., 2019, AJ, 158, 160
- Bell et al. (2012) Bell E. F., et al., 2012, ApJ, 753, 167
- Bellstedt et al. (2020) Bellstedt S., et al., 2020, arXiv e-prints, p. arXiv:2005.11917
- Blanton & Moustakas (2009) Blanton M. R., Moustakas J., 2009, ARA&A, 47, 159
- Blanton et al. (2011) Blanton M. R., Kazin E., Muna D., Weaver B. A., Price-Whelan A., 2011, AJ, 142, 31
- Blanton et al. (2017) Blanton M. R., et al., 2017, AJ, 154, 28
- Bluck et al. (2014) Bluck A. F. L., Mendel J. T., Ellison S. L., Moreno J., Simard L., Patton D. R., Starkenburg E., 2014, MNRAS, 441, 599
- Bremer et al. (2018) Bremer M. N., et al., 2018, MNRAS, 476, 12
- Bundy et al. (2015) Bundy K., et al., 2015, ApJ, 798, 7
- Calzetti et al. (2000) Calzetti D., Armus L., Bohlin R. C., Kinney A. L., Koornneef J., Storchi-Bergmann T., 2000, ApJ, 533, 682
- Cappellari (2016) Cappellari M., 2016, ARA&A, 54, 597
- Cappellari et al. (2011) Cappellari M., et al., 2011, MNRAS, 416, 1680
- Catalán-Torrecilla et al. (2015) Catalán-Torrecilla C., et al., 2015, A&A, 584, A87
- Chabrier (2003) Chabrier G., 2003, PASP, 115, 763
- Charlot et al. (1996) Charlot S., Worthey G., Bressan A., 1996, ApJ, 457, 625
- Cherinka et al. (2019) Cherinka B., et al., 2019, AJ, 158, 74
- Cheung et al. (2012) Cheung E., et al., 2012, ApJ, 760, 131
- Cid Fernandes (2018) Cid Fernandes R., 2018, MNRAS, 480, 4480
- Cid Fernandes & González Delgado (2010) Cid Fernandes R., González Delgado R. M., 2010, MNRAS, 403, 780
- Cid Fernandes et al. (2005) Cid Fernandes R., Mateus A., Sodré L., Stasińska G., Gomes J. M., 2005, MNRAS, 358, 363
- Cid Fernandes et al. (2013) Cid Fernandes R., et al., 2013, A&A, 557, A86
- Cid Fernandes et al. (2014) Cid Fernandes R., et al., 2014, A&A, 561, A130
- Connolly et al. (1997) Connolly A. J., Szalay A. S., Dickinson M., SubbaRao M. U., Brunner R. J., 1997, ApJ, 486, L11
- Conroy & Gunn (2010) Conroy C., Gunn J. E., 2010, ApJ, 712, 833
- Conroy et al. (2009) Conroy C., Gunn J. E., White M., 2009, ApJ, 699, 486
- Conroy et al. (2010) Conroy C., White M., Gunn J. E., 2010, ApJ, 708, 58
- Cowie et al. (1996) Cowie L. L., Songaila A., Hu E. M., Cohen J. G., 1996, AJ, 112, 839
- Das et al. (2021) Das A., Pandey B., Sarkar S., 2021, arXiv e-prints, p. arXiv:2101.02564
- Domínguez Sánchez et al. (2018) Domínguez Sánchez H., Huertas-Company M., Bernardi M., Tuccillo D., Fischer J. L., 2018, MNRAS, 476, 3661
- Drory et al. (2015) Drory N., et al., 2015, AJ, 149, 77
- Emsellem et al. (2007) Emsellem E., et al., 2007, MNRAS, 379, 401
- Fang et al. (2013) Fang J. J., Faber S. M., Koo D. C., Dekel A., 2013, ApJ, 776, 63
- Fischer et al. (2019) Fischer J. L., Domínguez Sánchez H., Bernardi M., 2019, MNRAS, 483, 2057
- Fontanot et al. (2009) Fontanot F., De Lucia G., Monaco P., Somerville R. S., Santini P., 2009, MNRAS, 397, 1776
- Fraser-McKelvie et al. (2019) Fraser-McKelvie A., et al., 2019, MNRAS, 488, L6
- Freeman (1970) Freeman K. C., 1970, ApJ, 160, 811
- García-Benito et al. (2017) García-Benito R., et al., 2017, A&A, 608, A27
- García-Benito et al. (2019) García-Benito R., González Delgado R. M., Pérez E., Cid Fernandes R., Sánchez S. F., de Amorim A. L., 2019, A&A, 621, A120
- Ge et al. (2018) Ge J., Yan R., Cappellari M., Mao S., Li H., Lu Y., 2018, MNRAS, 478, 2633
- Ge et al. (2019) Ge J., Mao S., Lu Y., Cappellari M., Yan R., 2019, MNRAS, 485, 1675
- Goddard et al. (2017) Goddard D., et al., 2017, MNRAS, 466, 4731
- González Delgado et al. (2016) González Delgado R. M., et al., 2016, A&A, 590, A44
- González Delgado et al. (2017) González Delgado R. M., et al., 2017, A&A, 607, A128
- Graham et al. (2018) Graham M. T., et al., 2018, MNRAS, 477, 4711
- Greener et al. (2020) Greener M. J., et al., 2020, MNRAS,
- Gunn et al. (2006) Gunn J. E., et al., 2006, AJ, 131, 2332
- Hart et al. (2016) Hart R. E., et al., 2016, MNRAS, 461, 3663
- Hart et al. (2017) Hart R. E., et al., 2017, MNRAS, 472, 2263
- Hart et al. (2018) Hart R. E., Bamford S. P., Keel W. C., Kruk S. J., Masters K. L., Simmons B. D., Smethurst R. J., 2018, MNRAS, 478, 932
- Heavens et al. (2004) Heavens A., Panter B., Jimenez R., Dunlop J., 2004, Nature, 428, 625
- Holmberg (1958) Holmberg E., 1958, Meddelanden fran Lunds Astronomiska Observatorium Serie II, 136, 1
- Hopkins & Beacom (2006) Hopkins A. M., Beacom J. F., 2006, ApJ, 651, 142
- Ibarra-Medel et al. (2016) Ibarra-Medel H. J., et al., 2016, MNRAS, 463, 2799
- Kennicutt (1983) Kennicutt R. C. J., 1983, ApJ, 272, 54
- Kennicutt (1998) Kennicutt Jr. R. C., 1998, ARA&A, 36, 189
- Lacerna et al. (2020) Lacerna I., Ibarra-Medel H., Avila-Reese V., Hernández-Toledo H. M., Vázquez-Mata J. A., Sánchez S. F., 2020, A&A, 644, A117
- Law et al. (2015) Law D. R., et al., 2015, AJ, 150, 19
- Law et al. (2016) Law D. R., et al., 2016, AJ, 152, 83
- Lee et al. (2007) Lee H.-c., Worthey G., Trager S. C., Faber S. M., 2007, ApJ, 664, 215
- Li et al. (2017) Li H., et al., 2017, ApJ, 838, 77
- Lintott et al. (2008) Lintott C. J., et al., 2008, MNRAS, 389, 1179
- López Fernández et al. (2018) López Fernández R., et al., 2018, A&A, 615, A27
- Madau & Dickinson (2014) Madau P., Dickinson M., 2014, ARA&A, 52, 415
- Madau et al. (1996) Madau P., Ferguson H. C., Dickinson M. E., Giavalisco M., Steidel C. C., Fruchter A., 1996, MNRAS, 283, 1388
- Maraston (1998) Maraston C., 1998, MNRAS, 300, 872
- Maraston (2005) Maraston C., 2005, MNRAS, 362, 799
- Martig et al. (2009) Martig M., Bournaud F., Teyssier R., Dekel A., 2009, ApJ, 707, 250
- Masters et al. (2019) Masters K. L., et al., 2019, MNRAS, 487, 1808
- Moresco et al. (2013) Moresco M., et al., 2013, A&A, 558, A61
- Mortlock et al. (2013) Mortlock A., et al., 2013, MNRAS, 433, 1185
- Muzzin et al. (2013) Muzzin A., et al., 2013, ApJ, 777, 18
- Naim et al. (1995) Naim A., et al., 1995, MNRAS, 274, 1107
- Nair & Abraham (2010) Nair P. B., Abraham R. G., 2010, ApJS, 186, 427
- Osterbrock & Ferland (2006) Osterbrock D. E., Ferland G. J., 2006, Astrophysics of gaseous nebulae and active galactic nuclei. University Science Books
- Panter et al. (2003) Panter B., Heavens A. F., Jimenez R., 2003, MNRAS, 343, 1145
- Panter et al. (2007) Panter B., Jimenez R., Heavens A. F., Charlot S., 2007, MNRAS, 378, 1550
- Peng et al. (2010) Peng Y.-j., et al., 2010, ApJ, 721, 193
- Pérez et al. (2013) Pérez E., et al., 2013, ApJ, 764, L1
- Peterken et al. (2019) Peterken T. G., et al., 2019, MNRAS, 489, 1338
- Peterken et al. (2020) Peterken T., Merrifield M., Aragón-Salamanca A., Fraser-McKelvie A., Avila-Reese V., Riffel R., Knapen J., Drory N., 2020, MNRAS, 495, 3387
- Peterken et al. (2021) Peterken T., Merrifield M., Aragón-Salamanca A., Avila-Reese V., Boardman N. F., Drory N., Lane R. R., 2021, MNRAS, 500, L42
- Pforr et al. (2012) Pforr J., Maraston C., Tonini C., 2012, MNRAS, 422, 3285
- Planck Collaboration et al. (2016) Planck Collaboration et al., 2016, A&A, 594, A13
- Roberts (1963) Roberts M. S., 1963, ARA&A, 1, 149
- Rodriguez-Puebla et al. (2020) Rodriguez-Puebla A., Calette A. R., Avila-Reese V., Rodriguez-Gomez V., Huertas-Company M., 2020, arXiv e-prints, p. arXiv:2004.13740
- Sánchez et al. (2016) Sánchez S. F., et al., 2016, Rev. Mex. Astron. Astrofis., 52, 21
- Sánchez et al. (2019) Sánchez S. F., et al., 2019, MNRAS, 482, 1557
- Schawinski et al. (2014) Schawinski K., et al., 2014, MNRAS, 440, 889
- Smee et al. (2013) Smee S. A., et al., 2013, AJ, 146, 32
- Smethurst et al. (2015) Smethurst R. J., et al., 2015, MNRAS, 450, 435
- Smethurst et al. (2017) Smethurst R. J., Lintott C. J., Bamford S. P., Hart R. E., Kruk S. J., Masters K. L., Nichol R. C., Simmons B. D., 2017, MNRAS, 469, 3670
- Smethurst et al. (2018) Smethurst R. J., et al., 2018, MNRAS, 473, 2679
- Vazdekis et al. (2016) Vazdekis A., Koleva M., Ricciardelli E., Röck B., Falcón-Barroso J., 2016, MNRAS, 463, 3409
- Wake et al. (2017) Wake D. A., et al., 2017, AJ, 154, 86
- Wang et al. (2020) Wang B., Cappellari M., Peng Y., Graham M., 2020, MNRAS, 495, 1958
- Westfall et al. (2019) Westfall K. B., et al., 2019, AJ, 158, 231
- Willett et al. (2013) Willett K. W., et al., 2013, MNRAS, 435, 2835
- Wuyts et al. (2011) Wuyts S., et al., 2011, ApJ, 742, 96
- Yan et al. (2016a) Yan R., et al., 2016a, AJ, 151, 8
- Yan et al. (2016b) Yan R., et al., 2016b, AJ, 152, 197
- Yi (2003) Yi S. K., 2003, ApJ, 582, 202
- Yi (2008) Yi S. K., 2008, in Heber U., Jeffery C. S., Napiwotzki R., eds, Astronomical Society of the Pacific Conference Series Vol. 392, Hot Subdwarf Stars and Related Objects. Astronomical Society of the Pacific, p. 3
- de Amorim et al. (2017) de Amorim A. L., et al., 2017, MNRAS, 471, 3727
- van Dokkum et al. (2008) van Dokkum P. G., et al., 2008, ApJ, 677, L5