11email: lighina@uninsubria.it 22institutetext: DiSAT - Università degli Studi dell’ Insubria, via Valleggio 11, 22100, Como, Italy 33institutetext: International Centre for Radio Astronomy Research, Curtin University, 1 Turner Avenue, Bentley, WA 6102, Australia
Radio detection of VIK J23183113, the most distant radio-loud quasar (=6.44)
We report the 888 MHz radio detection in the Rapid ASKAP Continuum Survey (RACS) of VIK J23183113, a =6.44 quasar. Its radio luminosity (1.2 W Hz-1 at 5 GHz) compared to the optical luminosity (1.8 W Hz-1 at 4400 Å) makes it the most distant radio-loud quasar observed so far, with a radio loudness R70 (R). Moreover, the high bolometric luminosity of the source (Lbol=7.4 erg s-1) suggests the presence of a supermassive black hole with a high mass (6 108 M⊙) at a time when the Universe was younger than a billion years. Combining the new radio data from RACS with previous ASKAP observations at the same frequency, we found that the flux density of the source may have varied by a factor of 2, which could suggest the presence of a relativistic jet oriented towards the line of sight, that is, a blazar nature. However, currently available radio data do not allow us to firmly characterise the orientation of the source. Further radio and X-ray observations are needed.
Key Words.:
galaxies: active – galaxies: high-redshift – galaxies: jets – quasars: general – quasars individual: VIKING~J231818.3$-$3113461 Introduction
In recent years, the exploitation of numerous optical and infrared (IR) wide-area surveys (e.g. the Panoramic Survey Telescope and Rapid Response System, Pan-STARRS, Chambers et al. 2016; the VISTA Kilo-degree Infrared Galaxy Survey, VIKING, Edge et al. 2013; the Dark Energy Survey, DES, Dark Energy Survey Collaboration et al. 2016, etc.) has led to the discovery of thousands of high- quasars (QSOs), with more than 200 sources discovered at >6 (e.g. Mazzucchelli et al. 2017; Matsuoka et al. 2019; Fan et al. 2019; Wang et al. 2019; Andika et al. 2020), the three most distant of which are at z7.5 (Bañados et al., 2018; Yang et al., 2020a; Wang et al., 2021).
These sources have already proved to be very useful tools for investigating the intergalactic medium (IGM) at early cosmic times through the absorption of their optical spectra bluewards of Ly (e.g. Kashikawa et al. 2006; Gaikwad et al. 2020).
Moreover, the mere presence of such powerful and massive objects in the primordial Universe places strong constraints on theoretical models describing the evolution and the accretion rate of supermassive black holes (SMBHs; e.g. Volonteri et al. 2015; Wang et al. 2020).
Decades of studies at low redshift have now established that radio-loud (RL111We considered a QSO to be radio loud when it has a radio loudness >10, with defined as the ratio of the 5 GHz and 4400 Å rest-frame flux densities, (Kellermann et al., 1989).) sources represent 10-15% of the total QSO population (e.g. Retana-Montenegro & Röttgering 2017), with no significant deviations until z6 (e.g. Stern et al. 2000; Liu et al. 2021; Diana et al. in prep.). However, of all the >6 QSOs, only a few have a radio detection, which means that there are far fewer confirmed high- RL QSOs.
To date, only five have been found at >6 (McGreer et al., 2006; Bañados et al., 2015; Belladitta et al., 2020; Liu et al., 2021), with the most distant being at =6.21 (Willott et al. 2010).
As described by Kellermann et al. (2016), the RL classification (R>10), as opposed to the radio quiet (RQ; R<10), should identify sources that produce the radio emission through a relativistic jet, which can significantly affect both the accretion process itself and the environment of the source (see Blandford et al. 2019 for a recent review).
Identifying and characterising powerful RL sources at the highest redshifts therefore is of key importance for studying the role of relativistic jets in the primordial Universe.
In this Letter we report the radio detection of the =6.4440.005 QSO VIKING J231818.35311346.3 (hereafter VIK J23183113; Decarli et al. 2018). With a relatively bright radio flux density (1.4 mJy at 888 MHz), this source is the most distant RL QSO observed to date.
VIK J23183113 was discovered from the near-IR (NIR) VIKING survey with the dropout technique, and its redshift was confirmed with both X-Shooter in the NIR and the Atacama Large Millimetre/submillimetre Array (ALMA) in the submillimetre (Decarli et al., 2018; Yang et al., 2020b). In this Letter we present its radio properties using recent observations, and by combining them with archival data, we also compare VIK J23183113 with the small number of other high- RL QSOs.
We use a flat CDM cosmology with =70 km s-1 Mpc-1, =0.3, and =0.7. Spectral indices are given assuming , and all errors are reported at 1 unless otherwise specified.
2 Radio observations
2.1 888 MHz ASKAP observations
VIK J23183113 has been detected in the first data release of the Rapid ASKAP Continuum Survey (RACS; McConnell et al. 2020)222https://data.csiro.au/collections/collection/CIcsiro:46532. with a peak flux density of 1.43 mJy beam-1at 888 MHz, which considering the associated RMS (0.19 mJy beam-1), corresponds to a signal-to-noise ratio (S/N) >7 (values as reported in the catalogue released on 2020 December 17).
The overall RACS survey is planned to cover the entire sky south of declination (36656 deg2 in total) in three different radio bands centred at 888, 1296, and 1656 MHz, all with a bandwidth of 288 MHz.
These observations are designed as a pilot project to prepare for the data calibration and handling of future deeper surveys (e.g. the evolutionary map of the Universe, EMU, Norris et al. 2011) with the Australian SKA Pathfinder (ASKAP; Johnston et al. 2008).
In the first data release (December 2020), the sky south of declination was covered in the lower frequency band (888 MHz) with a spatial resolution of 15′′.
By cross-matching this first data release with the list of >6 QSOs discovered to date in the same sky area (169 sources in total), we found the radio counterparts of three of them: VIK J23183113, and two other RL QSOs. For these last two objects a discussion of their radio properties has already been reported in the literature: FIRST J1427385+331241 (=6.12; McGreer et al. 2006) and PSO J030947.49+271757.31 (=6.10; Belladitta et al. 2020).
The radio source is located 1.6′′ from the optical/NIR counterpart of VIK J23183113, which is consistent with the positional error reported in the RACS catalogue (4′′).
Even considering typical uncertainties in interferometric radio positions (0.9′′, where is the size of the beam; Fomalont 1999) together with the typical astrometric precision of the survey (0.8′′; McConnell et al. 2020), the observed offset is still consistent. Moreover, from the source density of the RACS survey (80 sources deg-2, McConnell et al. 2020), we can also compute the probability of finding an unrelated radio source within a 1.6′′ radius from any given position (see e.g. eq. 4 in Condon et al. 1998). In this case, the probability is 510-5, which means that the expected number of spurious associations of the 169 >6 QSOs that we based the query on is <0.01.
We can therefore conclude that the association between VIK J23183113 and the radio source is statistically significant and unlikely to be spurious.
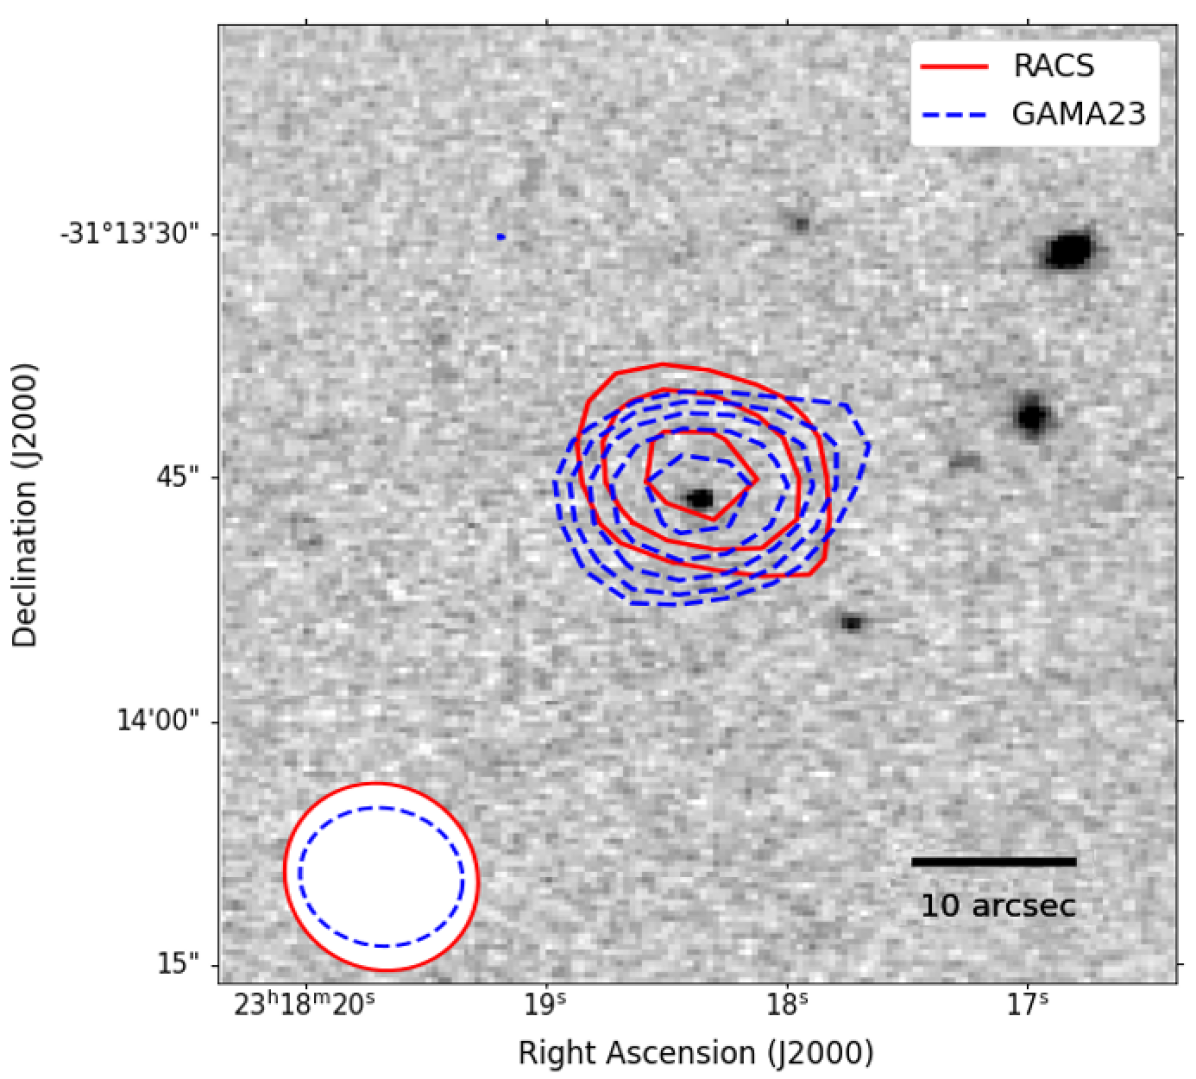
At the same time, VIK J23183113 also belongs to one of the Galaxy and Mass Assembly (GAMA; Driver et al. 2011) fields, GAMA23 (339 < R.A. [deg] < 351 and 35 < Dec. [deg] < 30). In particular, this region has recently (2019 March) been covered by a deeper ASKAP observation (RMS0.04 mJy beam-1), again at 888 MHz, within an ASKAP/EMU early science project333https://data.csiro.au/collections/collection/CIcsiro:40262. and was reduced as described in Seymour et al. (2020). We report in Fig. 1 the 888 MHz radio contours from the RACS and GAMA23 observations, overlaid on the NIR VIKING image in the -band.
| Project: | RACS | GAMA23 |
|---|---|---|
| Total flux density (mJy): | 1.440.34∗ | 0.590.07 |
| Peak surf. brightness (mJy/beam): | 1.480.20 | 0.590.04 |
| Major axis∗∗ (arcsec): | 13.22.0 | 10.50.8 |
| Minor axis∗∗ (arcsec): | 10.21.2 | 8.20.5 |
| P.A. east of north (deg): | 4518 | 10510 |
| Off-source RMS (mJy/beam): | 0.20 | 0.04 |
$**$$**$footnotetext: Convolved with the beam of the instrument.
In Tab. 1 we report the results of a single Gaussian fit performed on the RACS and GAMA23 images using the Common Astronomy Software Applications package (CASA; McMullin et al. 2007). In the GAMA23 observation the best-fit position is only 0.37′′ away from the NIR counterpart, thus providing further strong evidence for the radio association. Given the very similar angular resolution in both cases, the source is point-like and not resolved. However, the estimated flux density varies by a factor 2.4 in the two images, from 0.590.07 to 1.440.34 mJy.
The time separation between the two observations is one year (2019 March – 2020 March), which in the source rest frame corresponds to 50 days (without taking possible relativistic effects into account).
In order to verify whether the source variation between the GAMA23 and RACS observations is real or is only a systematic effect related to the calibration, we compared the integrated flux densities of the sources detected in the two images. In particular, as for VIK J23183113, we performed a single Gaussian fit with the CASA software on 70 sources with a flux density between 1 and 10 mJy and within one square degree from the QSO position555Although a primary beam correction was performed during the data reduction of the RACS survey and the GAMA23 images, we applied a search radius cutoff in order avoid any possible residual fluctuation of the flux calibration..
The distribution of the ratios of the flux densities measured in the two images is a Gaussian centred at one and with =0.16, consistent with the statistical errors on the flux densities and thus indicating that the observed difference for VIK J23183113 cannot be attributed to a systematic calibration offset in the two datasets. When we sum in quadrature the uncertainties related to the two flux density estimates, the significance of the variation observed in VIK J23183113 is 2.4. A large variation in a short period of time as observed in this case is usually associated with the presence of a relativistic jet oriented towards the line of sight, that is, a blazar nature (e.g. Hovatta et al. 2008).
The uncertainty on the flux density ratios reported above (=0.16) was derived from the relative comparison of the RACS and GAMA23 images, that is, from datasets obtained from the same telescope. McConnell et al. (2020) have studied the uncertainties on the absolute flux density scale of RACS images by comparing sources with multiple independent RACS observations (i.e. on the overlapping edges of different tiles), also with other catalogues in the literature, finding Sν = 0.5 mJy + 0.07Sν (eq. 7 in their paper). In the particular case of VIK J23183113, the corresponding value is 0.60 mJy. We take this uncertainty into account in section 4 when we compute the quantities based on the RACS flux density (e.g. radio luminosity and radio loudness).
2.2 Archival radio observations
Even though VIK J23183113 is not reported in any other public radio catalogue, we checked archival radio images at the NIR position of the source to search for the presence of a faint but significant (S/N>2.5) radio signal.
We did not detect the source in the TIFR Giant Metrewave Radio Telescope Sky Survey (TGSS; Intema et al. 2017) at 150 MHz (image RMS2.9 mJy beam-1), the Sydney University Molonglo Sky Survey (SUMSS; Mauch et al. 2003) at 843 MHz (image RMS2.5 mJy beam-1), or in the NRAO Karl G. Jansky Very Large Array Sky Survey (NVSS; Condon et al. 1998) at 1.4 GHz (image RMS0.45 mJy beam-1).
In contrast, we did find a radio excess less than 0.6′′ away from the NIR position of the source in the first (2018 February) and second (2020 November) epochs of the Very Large Array Sky Survey (VLASS; Lacy et al. 2020) at 3 GHz. The peak flux density of the emission in the two epochs is 0.290.11 mJy beam-1 in the first and 0.400.13 mJy beam-1 in the second, which corresponds to a S/N of 2.6 and 3.0, respectively. Even though the two estimates are marginally consistent, we consider the average of the two and the overall range of uncertainty because of the possible intrinsic variability of the source: 0.350.18 mJy.
In Tab. 2 we report the radio data and the 2.5 upper limits obtained from archival observations as described above.
When we take currently available data with their uncertainties and the upper limits derived from non-detections into account, the spectral index of a single power law covering the observed frequency range is poorly constrained (=0–1.2).
However, in addition to information on the flux density and the dimensions of the sources, the RACS catalogue also reports the spectral index computed within the 288 MHz band centred at 888 MHz. The spectral index reported for VIK J23183113 is =0.98, which is similar to what is typically observed in high- QSOs (e.g. Coppejans et al. 2017; Bañados et al. 2018). In the following, we consider this to be the best-fit value despite the relatively low S/N across the ASKAP band, even though a different assumption does not affect the results.
A more detailed discussion of the broad-band radio properties of VIK J23183113 will be presented in a forthcoming work.
| Survey: | TGSS | SUMSS | NVSS | VLASS |
|---|---|---|---|---|
| Obs. Freq. (GHz): | 0.15 | 0.843 | 1.4 | 3 |
| Flux density (mJy/beam): | <7.3 | <6.3 | <1.1 | 0.350.18 |
3 Optical/UV properties
Given the high-redshift nature of VIK J23183113, the NIR photometric data from the VIKING survey (reported in Tab. 3) cover the UV/optical spectrum in its rest frame. Therefore we used these photometric points to estimate the bolometric luminosity (Lbol) of the source. In the following, we assume an optical spectral index given by the slope observed between the and bands, , which is consistent with what is normally found in other QSOs (e.g. Vanden Berk et al. 2001). We started by computing the rest-frame monochromatic luminosities at 1350 and 3000 Å using the observed magnitudes in the filter with the closest corresponding rest-frame wavelength, that is, (1370 Å) and (2860 Å), respectively. The bolometric luminosity can then be inferred using the correction factors derived in Shen et al. (2008) for 1350 Å (= 8.0 2.7 1046 erg s-1) and in Runnoe et al. (2012) for 3000 Å (= 7.4 0.3 1046 erg s-1). Averaging the two results with the corresponding variances as weights, we obtain = 7.4 0.3 1046 erg s-1. Assuming an Eddington-limited accretion, that is, Lbol LEDD,666Where LEDD = 1.26 1038 (MBH/M⊙) erg s-1. this value of the bolometric luminosity implies that the SMBH mass must be higher than 6 M⊙.
| Filter: | |||||
|---|---|---|---|---|---|
| (m): | 0.878 | 1.021 | 1.254 | 1.646 | 2.149 |
| magnitude: | 21.42 | 20.17 | 19.89 | 19.61 | 18.67 |
| mag. error: | 0.11 | 0.08 | 0.11 | 0.18 | 0.14 |
4 Radio loudness and comparison with high- RL QSOs
In order to estimate the rest-frame monochromatic luminosity at 5 GHz, we considered the 888 MHz flux density obtained from the RACS observation (S888MHz= 1.44 mJy) with an uncertainty that takes the absolute calibration of the map into account (0.60 mJy, see previous section) and the spectral index reported in the RACS catalogue (=0.98). We also considered the GAMA23 flux density (S888MHz= 0.590.07 mJy) and a spectral index in the range =0–1.2 to estimate the associated uncertainty.
The result, however, has little dependence on the assumption because the observed frequency of 888 MHz corresponds to a rest-frame frequency of 6.6 GHz, which is very close to 5 GHz. The resulting radio luminosity is L5GHz= 1.2 W Hz-1. Combining this estimate with the optical luminosity at 4400 Å (L4400Å= 1.80.1 erg s-1 Hz-1), computed from the observed magnitude, we obtain a radio loudness R= 66.3. Adopting the typical value of R=10 as the threshold between RL and RQ sources, this makes VIK J23183113 the most distant RL QSO observed so far, at =6.44.
We note that this classification does not depend on the somewhat arbitrary criterion for separating the RL and RQ populations. Even if we consider a radio loudness as defined by Jiang et al. (2007)777In this case, the radio loudness is defined as the following rest-frame ratio: R=. or a single threshold in the radio luminosity (L5GHz> erg s-1 Hz-1; Jiang et al. 2007), the RL classification still holds.
In RL QSOs, the radio emission is thought to be produced by relativistic jets and not by star-formation (SF) processes (e.g. Kellermann et al. 2016). VIK J23183113 was found to be very luminous in the far-IR (FIR) (log(LFIR/L⊙) in the range 11.89–12.46, between 42.5 and 122.5 m; Decarli et al. 2018; Venemans et al. 2018, 2020), and this may imply that at least part of the observed radio emission is due to SF. However, considering the relation between radio and FIR luminosity observed in SF galaxies (Condon et al., 2002), we expect that only a few percent (<5%) of the observed radio emission can be produced by SF. This confirms that the high radio power observed in VIK J23183113 is likely produced by relativistic jets, as expected in RL sources. Interestingly, Venemans et al. (2020) also found that the FIR continuum and [C II] emissions extend up to 5 kpc (0.2′′) with an irregular morphology. Further radio observations at similar resolution would be fundamental for understanding the role of the different components at work in this complex QSO.

Following Bañados et al. (2015), we report in Fig. 2 (left) the rest-frame radio luminosity (5 GHz) as a function of the rest-frame optical luminosity (4400 Å) for the updated list of >5.5 QSOs with a radio observation and thus a firm RL/RQ classification888Data from Bañados et al. (2015, 2018), Belladitta et al. (2020), and Liu et al. (2021). Clearly, the radio loudness of VIK J23183113 is similar to that of the majority of >5.5 RL QSOs, with 10<R<100.
Moreover, in Fig. 2 (right) we compare the confirmed RL QSOs at >5.5 to the optically selected sample at lower redshift (800 sources) discussed in Zhu et al. (2020) and to the >4 RL QSOs discovered so far999These are all the RL QSOs published to date. To estimate their radio loudness, we considered the radio spectral index, if present; otherwise, we assumed =0.75 (Bañados et al., 2015) and considered a 0.25 variation to estimate the uncertainty. The full list of sources with the corresponding radio data and references will be presented in Belladitta et al. (in prep.)..
Interestingly, only a small fraction of very radio-powerful
high- sources (logR>2.5) has been found at >5.5 compared to low redshifts. This may be a consequence of the fact that at these redshifts, QSOs have been selected mainly in the optical/UV, with only three radio-selected sources (which include the two radio-brightest sources at >6). Nevertheless, we expect that upcoming and ongoing wide-area surveys such as RACS and the development of dedicated selection techniques in the radio band (e.g. Drouart et al. 2020) will find many more radio-powerful sources at >6 (e.g. Amarantidis et al. 2019).
5 Conclusions
We have presented the radio detection (at 888 MHz) of VIK J23183113, a =6.44 QSO. Combining the new radio information from RACS with the archival data, we estimate a radio-loudness value of R70, which means that this source is the most distant RL QSO observed to date. The radio association was made by cross-matching the first data release of the RACS survey and a list of the 169 previously discovered >6 QSOs in the same area of the sky. As a result, we found radio counterparts for a total of three RL sources, VIK J23183113 included, which corresponds to a radio detection rate of 2% in the aforementioned list of >6 QSOs. Because the RACS flux density limit is not deep enough to detect all the >6 RL QSOs discovered so far, which have typical NIR magnitudes 22, this detection rate should be considered as a lower limit to the actual RL fraction at >6.
We cannot fully characterise the radio spectral properties of VIK J23183113, and thus establish whether it is a flat, steep, or peaked source, with the currently available radio data. This is an important diagnostic for understanding the orientation of the relativistic jet with respect to the line of sight, that is, whether VIK J23183113 is a blazar. The possible presence of variability at 888 MHz, as found in the comparison of the RACS and GAMA23 observations, may suggest that the emission of this source is dominated by the relativistic beaming, which could mean that the jet is oriented at small angles from the line of sight. More data are required to confirm this result, however.
Assuming an Eddington-limited accretion, the relatively high bolometric luminosity suggests the presence of a central SMBH with a mass 6 108M⊙.
This detection anticipates the discovery of many more RL high- sources in the next years when the new generation of all-sky radio surveys will be performed by the Square Kilometre Array and its precursors.
Acknowledgements.
We thank the anonymous referee for the useful comments and suggestions. We acknowledge financial contribution from the agreement ASI-INAF n. I/037/12/0 and n.2017-14-H.0 and from INAF under PRIN SKA/CTA FORECaST. In this work we have used data from the ASKAP observatory. The Australian SKA Pathfinder is part of the Australia Telescope National Facility which is managed by CSIRO. Operation of ASKAP is funded by the Australian Government with support from the National Collaborative Research Infrastructure Strategy. ASKAP uses the resources of the Pawsey Supercomputing Centre. Establishment of ASKAP, the Murchison Radio-astronomy Observatory and the Pawsey Supercomputing Centre are initiatives of the Australian Government, with support from the Government of Western Australia and the Science and Industry Endowment Fund. We acknowledge the Wajarri Yamatji people as the traditional owners of the Observatory site. This paper includes archived data obtained through the CSIRO ASKAP Science Data Archive, CASDA (http://data.csiro.au). This research made use of Astropy (http://www.astropy.org) a community-developed core Python package for Astronomy (Astropy Collaboration et al., 2013, 2018). This research has made use of the SIMBAD database, operated at CDS, Strasbourg, France (Wenger et al., 2000).References
- Amarantidis et al. (2019) Amarantidis, S., Afonso, J., Messias, H., et al. 2019, MNRAS, 485, 2694
- Andika et al. (2020) Andika, I. T., Jahnke, K., Onoue, M., et al. 2020, ApJ, 903, 34
- Astropy Collaboration et al. (2018) Astropy Collaboration, Price-Whelan, A. M., Sipőcz, B. M., et al. 2018, AJ, 156, 123
- Astropy Collaboration et al. (2013) Astropy Collaboration, Robitaille, T. P., Tollerud, E. J., et al. 2013, A&A, 558, A33
- Bañados et al. (2018) Bañados, E., Venemans, B. P., Mazzucchelli, C., et al. 2018, Nature, 553, 473
- Bañados et al. (2015) Bañados, E., Venemans, B. P., Morganson, E., et al. 2015, ApJ, 804, 118
- Belladitta et al. (2020) Belladitta, S., Moretti, A., Caccianiga, A., et al. 2020, A&A, 635, L7
- Blandford et al. (2019) Blandford, R., Meier, D., & Readhead, A. 2019, ARA&A, 57, 467
- Chambers et al. (2016) Chambers, K. C., Magnier, E. A., Metcalfe, N., et al. 2016, eprint arXiv:1612.05560 [arXiv:1612.05560]
- Condon et al. (2002) Condon, J. J., Cotton, W. D., & Broderick, J. J. 2002, AJ, 124, 675
- Condon et al. (1998) Condon, J. J., Cotton, W. D., Greisen, E. W., et al. 1998, AJ, 115, 1693
- Coppejans et al. (2017) Coppejans, R., van Velzen, S., Intema, H. T., et al. 2017, MNRAS, 467, 2039
- Dark Energy Survey Collaboration et al. (2016) Dark Energy Survey Collaboration, Abbott, T., Abdalla, F. B., et al. 2016, MNRAS, 460, 1270
- Decarli et al. (2018) Decarli, R., Walter, F., Venemans, B. P., et al. 2018, ApJ, 854, 97
- Driver et al. (2011) Driver, S. P., Hill, D. T., Kelvin, L. S., et al. 2011, MNRAS, 413, 971
- Drouart et al. (2020) Drouart, G., Seymour, N., Galvin, T. J., et al. 2020, PASA, 37, e026
- Edge et al. (2013) Edge, A., Sutherland, W., Kuijken, K., et al. 2013, The Messenger, 154, 32
- Fan et al. (2019) Fan, X., Wang, F., Yang, J., et al. 2019, ApJ, 870, L11
- Fomalont (1999) Fomalont, E. B. 1999, in Astronomical Society of the Pacific Conference Series, Vol. 180, Synthesis Imaging in Radio Astronomy II, ed. G. B. Taylor, C. L. Carilli, & R. A. Perley, 301
- Gaikwad et al. (2020) Gaikwad, P., Rauch, M., Haehnelt, M. G., et al. 2020, MNRAS, 494, 5091
- Hovatta et al. (2008) Hovatta, T., Nieppola, E., Tornikoski, M., et al. 2008, A&A, 485, 51
- Intema et al. (2017) Intema, H. T., Jagannathan, P., Mooley, K. P., & Frail, D. A. 2017, A&A, 598, A78
- Jiang et al. (2007) Jiang, L., Fan, X., Ivezić, Ž., et al. 2007, ApJ, 656, 680
- Johnston et al. (2008) Johnston, S., Taylor, R., Bailes, M., et al. 2008, Experimental Astronomy, 22, 151
- Kashikawa et al. (2006) Kashikawa, N., Shimasaku, K., Malkan, M. A., et al. 2006, ApJ, 648, 7
- Kellermann et al. (2016) Kellermann, K. I., Condon, J. J., Kimball, A. E., Perley, R. A., & Ivezić, Ž. 2016, ApJ, 831, 168
- Kellermann et al. (1989) Kellermann, K. I., Sramek, R., Schmidt, M., Shaffer, D. B., & Green, R. 1989, AJ, 98, 1195
- Lacy et al. (2020) Lacy, M., Baum, S. A., Chandler, C. J., et al. 2020, PASP, 132, 035001
- Liu et al. (2021) Liu, Y., Wang, R., Momjian, E., et al. 2021, ApJ, 908, 124
- Matsuoka et al. (2019) Matsuoka, Y., Onoue, M., Kashikawa, N., et al. 2019, ApJ, 872, L2
- Mauch et al. (2003) Mauch, T., Murphy, T., Buttery, H. J., et al. 2003, MNRAS, 342, 1117
- Mazzucchelli et al. (2017) Mazzucchelli, C., Bañados, E., Venemans, B. P., et al. 2017, ApJ, 849, 91
- McConnell et al. (2020) McConnell, D., Hale, C. L., Lenc, E., et al. 2020, PASA, 37, e048
- McGreer et al. (2006) McGreer, I. D., Becker, R. H., Helfand, D. J., & White, R. L. 2006, ApJ, 652, 157
- McMullin et al. (2007) McMullin, J. P., Waters, B., Schiebel, D., Young, W., & Golap, K. 2007, in Astronomical Society of the Pacific Conference Series, Vol. 376, Astronomical Data Analysis Software and Systems XVI, ed. R. A. Shaw, F. Hill, & D. J. Bell, 127
- Norris et al. (2011) Norris, R. P., Hopkins, A. M., Afonso, J., et al. 2011, PASA, 28, 215
- Retana-Montenegro & Röttgering (2017) Retana-Montenegro, E. & Röttgering, H. J. A. 2017, A&A, 600, A97
- Runnoe et al. (2012) Runnoe, J. C., Brotherton, M. S., & Shang, Z. 2012, MNRAS, 422, 478
- Seymour et al. (2020) Seymour, N., Huynh, M., Shabala, S. S., et al. 2020, PASA, 37, e013
- Shen et al. (2008) Shen, Y., Greene, J. E., Strauss, M. A., Richards, G. T., & Schneider, D. P. 2008, ApJ, 680, 169
- Stern et al. (2000) Stern, D., Djorgovski, S. G., Perley, R. A., de Carvalho, R. R., & Wall, J. V. 2000, AJ, 119, 1526
- Vanden Berk et al. (2001) Vanden Berk, D. E., Richards, G. T., Bauer, A., et al. 2001, AJ, 122, 549
- Venemans et al. (2018) Venemans, B. P., Decarli, R., Walter, F., et al. 2018, ApJ, 866, 159
- Venemans et al. (2020) Venemans, B. P., Walter, F., Neeleman, M., et al. 2020, ApJ, 904, 130
- Volonteri et al. (2015) Volonteri, M., Silk, J., & Dubus, G. 2015, ApJ, 804, 148
- Wang et al. (2020) Wang, F., Fan, X., Yang, J., et al. 2020, arXiv e-prints, arXiv:2011.12458
- Wang et al. (2021) Wang, F., Yang, J., Fan, X., et al. 2021, arXiv e-prints, arXiv:2101.03179
- Wang et al. (2019) Wang, F., Yang, J., Fan, X., et al. 2019, ApJ, 884, 30
- Wenger et al. (2000) Wenger, M., Ochsenbein, F., Egret, D., et al. 2000, A&AS, 143, 9
- Willott et al. (2010) Willott, C. J., Delorme, P., Reylé, C., et al. 2010, AJ, 139, 906
- Yang et al. (2020a) Yang, J., Wang, F., Fan, X., et al. 2020a, ApJ, 897, L14
- Yang et al. (2020b) Yang, J., Wang, F., Fan, X., et al. 2020b, ApJ, 904, 26
- Zhu et al. (2020) Zhu, S. F., Brandt, W. N., Luo, B., et al. 2020, MNRAS, 496, 245