Tracking Advanced Planetary Systems (TAPAS) with HARPS-N. ††thanks: Based on observations obtained with the Hobby-Eberly Telescope, which is a joint project of the University of Texas at Austin, the Pennsylvania State University, Stanford University, Ludwig-Maximilians-Universität München, and Georg-August-Universität Göttingen. ††thanks: Based on observations made with the Italian Telescopio Nazionale Galileo (TNG) operated on the island of La Palma by the Fundación Galileo Galilei of the INAF (Istituto Nazionale di Astrofisica) at the Spanish Observatorio del Roque de los Muchachos of the Instituto de Astrofísica de Canarias.
Abstract
Context. We present the current status of and new results from our search for exoplanets in a sample of solar-mass, evolved stars observed with the HARPS-N and the 3.6-m Telescopio Nazionale Galileo (TNG), and the High Resolution Spectrograph (HRS) and the 9.2-m Hobby Eberly Telescope (HET).
Aims. The aim of this project is to detect and characterise planetary-mass companions to solar-mass stars in a sample of 122 targets at various stages of evolution from the main sequence (MS) to the red giant branch (RGB), mostly sub-gaints and giants, selected from the Pennsylvania-Toruń Planet Search (PTPS) sample, and use this sample to study relations between stellar properties, such as metallicity, luminosity, and the planet occurrence rate.
Methods. This work is based on precise radial velocity (RV) measurements. We have observed the program stars for up to 11 years with the HET/HRS and the TNG/HARPS-N.
Results. We present the analysis of RV measurements with the HET/HRS and the TNG/HARPS-N of four solar-mass stars, HD 4760, HD 96992 , BD+02 3313, and TYC 0434-04538-1. We found that: HD 4760 hosts a companion with a minimum mass of ( au, ); HD 96992 is a host to a companion on a au and orbit, and TYC 0434-04538-1 hosts an companion on a au and orbit. In the case of BD+02 3313 we found a correlation between the measured RVs and one of the stellar activity indicators, suggesting that the observed RV variations may originate in either stellar activity or be caused by the presence of an unresolved companion. We also discuss the current status of the project and a statistical analysis of the RV variations in our sample of target stars.
Conclusions. In our sample of 122 solar-mass stars, of them appear to be single, and are spectroscopic binaries. The three giants hosting low-mass companions presented in this paper add to the six ones previously identified in the sample.
Key Words.:
Stars: late-type - Planets and satellites: detection - Techniques: radial velocities - Techniques: spectroscopic1 Introduction
After the discovery of the first exoplanetary system around a pulsar (PSR 1257+12 b, c, d – Wolszczan & Frail 1992) with the pulsar timing technique, and of the first exoplanet orbiting a solar-type star (51 Peg b – Mayor & Queloz 1995) with the precise velocimetry, the photometric observations of planetary transits have proved to be the most successful way of detecting exoplanets.
Nearly 3000 out of about 4300 exoplanets were detected with the planetary transit method, most of them by just one project, Kepler/K2 (Borucki et al., 2010). Detailed characterisation of these systems requires both photometric (transits) and spectroscopic (radial velocities, abundances) observations, but not all of them are available for spectroscopic follow-up with ground-based instruments, due to the faintness of the hosts. This emphasizes the need for missions such as TESS (Ricker et al., 2015) and PLATO (Catala & PLATO Consortium, 2008).
Our knowledge of exoplanets orbiting the solar-type or less massive stars on the MS is quite extensive due to combined output of the RV and transit searches (see Winn & Fabrycky 2015 for a review). The domain of larger orbital separations or more evolved hosts clearly requires more exploration.
| Star | [K] | Fe/H | ||||||
|---|---|---|---|---|---|---|---|---|
| HD 4760 | 407615 | 1.620.08 | -0.910.09 | 2.930.11 | 1.050.19 | 42.49.2 | ||
| HD 96992 | 472510 | 2.760.04 | -0.450.08 | 1.470.09 | 0.960.09 | 7.431.1 | ||
| BD+02 3313 | 442513 | 2.640.05 | 0.100.07 | 1.440.24 | 1.030.03 | 8.471.53 | ||
| TYC 0434-04538-1 | 467910 | 2.490.04 | -0.380.06 | 1.670.09 | 1.040.15 | 9.991.6 |
So far, the RV searches for exoplanets orbiting more evolved stars, like Lick K-giant Survey (Frink et al., 2002a), Okayama Planet Search(Sato et al., 2003), Tautenberg Planet Search (Hatzes et al., 2005), Retired A Stars and Their Companions (Johnson et al., 2007), PennState - Toruń Planet Search (Niedzielski et al., 2007; Niedzielski & Wolszczan, 2008a; Niedzielski & Wolszczan, 2008b) or Boyunsen Planet Search (Lee et al., 2011), have resulted in a rather modest population of 112 substellar companions in 102 systems111https://www.lsw.uni-heidelberg.de/users/sreffert/giantplanets/giantplanets.php.
The Pennsylvania-Toruń Planet Search (PTPS) is one of the most extensive RV searches for exoplanets around the evolved stars. The project was designed to use the Hobby-Eberly Telescope (Tull, 1998) (HET) and its High Resolution Spectrograph (Ramsey et al., 1998) (HRS). It has surveyed a sample of stars distributed across the northern sky, with the typical, apparent V-magnitudes between 7.5 and 10.5 mag, and the B-V colour indices between 0.6 and 1.3. On the Hertzsprung-Russell (H-R) diagram, these stars occupy an area delimited by the MS, the instability strip, and the coronal dividing line (Linsky & Haisch, 1979). In total, the program sample of 885 stars contains 515 giants, 238 subgiants, and 132 dwarfs (Deka-Szymankiewicz et al., 2018). A detailed description of this sample, including their atmospheric and integrated parameters (masses, luminosities, and radii), is presented in a series of the following papers: Zieliński et al. (2012); Adamów et al. (2014); Niedzielski et al. (2016a); Adamczyk et al. (2016); Deka-Szymankiewicz et al. (2018). The first detection of a gas giant orbiting a red giant star by the PTPS project has been published by Niedzielski et al. (2007).
So far, twenty-two planetary systems have been detected by the PTPS and TAPAS projects. The most interesting ones include: a multiple planetary system around TYC 1422-00614-1, an evolved solar-mass, K2 giant, with two planets orbiting it (Niedzielski et al., 2015a); the most massive, , red giant star TYC 3667-1280-1, hosting a warm Jupiter (Niedzielski et al., 2016c), and BD+48 740, a Li overabundant giant star with a planet, which possibly represents a case of recent engulfment (Adamów et al., 2012). Of specific interest is BD+14 4559 b, a gas giant orbiting a dwarf in an eccentric orbit (e=0.29) at a distance of a=0.78 au from the host star (Niedzielski et al., 2009b). The International Astronomical Union chose this planet and its host on the occasion of its 100th anniversary, to be named by the Polish national poll organized by the ExoWorlds project. They have been assigned the names of Pirx and Solaris to honor the famous Polish science fiction writer Stanisław Lem.
The PTPS sample is large enough to investigate planet occurrence as a function of a well-defined set of stellar parameters. For instance, the sample of 15 Li-rich giants has been studied in a series of papers (Adamów et al., 2012, 2014, 2015, 2018) and resulted in a discovery of 3 Li-rich giants with planetary-mass companions: BD+48 740, HD 238914, and TYC 3318-01333-1 and two planetary-mass companions candidates: TYC 3663-01966-1 and TYC 3105-00152-1. Another interesting subsample of the PTPS contains 115 stars with masses greater than . So far, four giants with planets were detected in that sample: HD 95127, HD 216536, BD+49 828 (Niedzielski et al., 2015b), and TYC 3667-1280-1 (Niedzielski et al., 2016c) with masses as high as . A giant TYC 3663-01966-1, mentioned above, also belongs to this subsample.
There are more PTPS stars to be investigated in search for low-mass companions: these are 74 low metallicity ([Fe/H]-0.5) giant stars, including BD +20 2457 (Niedzielski et al., 2009b) and BD +03 2562 (Villaver et al., 2017) - both with [Fe/H]-0.7), 57 high luminosity giants with , cf. BD +20 2457 (Niedzielski et al., 2009b), HD 103485 (Villaver et al., 2017) both with ), and a number of others. All these investigations are still in progress. Here, we present the results for four of the program stars.
2 Sample and observations
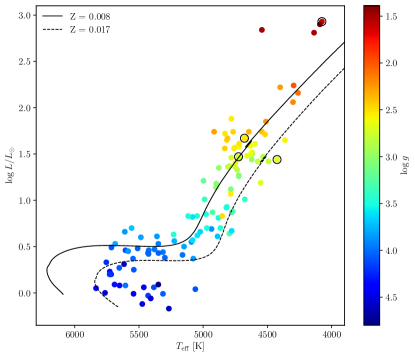
There are 133 stars in the PTPS sample with masses in the range: 12 dwarfs, 39 subgiants, and 82 giants (Deka-Szymankiewicz et al. 2018 and references therein). Due to an insufficient RV time series coverage (less than two epochs of observations), we have removed eleven of these stars from further considerations. Consequently, the final, complete sample of 122 solar-mass stars contains 11 dwarfs, 33 subgiants, and 78 giant stars (Fig. 1). In what follows, we will call them elder suns, representing a range of evolutionary stages (from the MS through the subgiant branch and along the RGB) and a range of metallicities (between [Fe/H]=-1.44 and [Fe/H]=+0.34, with [Fe/H]=-0.17 being the average). However, within the estimated uncertainties, their estimated masses are all the same. The small group of dwarfs included in the sample represents stars similar to the Sun with different metallicities. The sample defined this way allows us to study the planet occurrence ratio as a function of stellar metallicity for a fixed solar mass.
Here we present the results for four stars from this sample, that show RV variations appearing be caused by low-mass companions. Their basic atmospheric and stellar parameters are summarised in Table 1. The atmospheric parameters, , , and Fe/H, were derived using a strictly spectroscopic method based on the LTE analysis of the equivalent widths of FeI and FeII lines by Zieliński et al. (2012). The estimates of the rotational velocities are given in Adamów et al. (2014). The stellar parameters (masses, luminosities, and radii) were estimated using the Bayesian approach of Jørgensen & Lindegren (2005), modified by da Silva et al. (2006) and adopted for our project by Adamczyk et al. (2016), using the theoretical stellar models from Bressan et al. (2012). In the case of BD+02 3313, we determined the luminosity using the Gaia Collaboration et al. (2016) DR2 parallax (see Deka-Szymankiewicz et al. 2018 for details).
2.1 Observations
The spectroscopic observations presented in this paper were made with two instruments: the 9.2-m Hobby-Eberly Telescope (HET, Ramsey et al. 1998) and its High-Resolution Spectrograph (HRS, Tull 1998) in the queue scheduling mode (Shetrone et al., 2007), and the 3.58-meter Telescopio Nazionale Galileo (TNG) and its High Accuracy Radial velocity Planet Searcher in the Northern hemisphere (HARPS-N, Cosentino et al. 2012). A detailed description of the adopted observing strategies and the instrumental configurations for both HET/HRS and TNG/HARPS-N can be found in Niedzielski et al. (2007) and Niedzielski et al. (2015a).
All HET/HRS spectra were reduced with the standard IRAF222IRAF is distributed by the National Optical Astronomy Observatories, which are operated by the Association of Universities for Research in Astronomy, Inc., under cooperative agreement with the National Science Foundation. procedures. The TNG/HARPS-N spectra were processed with the standard user’s pipeline, Data Reduction Software (DRS; Pepe et al. 2002a; Lovis & Pepe 2007).
2.2 Radial velocities
The HET/HRS is a general purpose spectrograph, which is neither temperature nor pressure-controlled. Therefore the calibration of the RV measurements with this instrument is best accomplished with the I2 gas cell technique (Marcy & Butler, 1992; Butler et al., 1996). Our application of this technique to HET/HRS data is described in detail in Nowak (2012) and Nowak et al. (2013).
The RVs from the HARPS-N were obtained with the cross-correlation method (Queloz, 1995; Pepe et al., 2002b). The wavelength calibration was done using the simultaneous Th-Ar mode of the spectrograph. The RVs were calculated by cross-correlating the stellar spectra with the digital mask for a K2 type star.
The RV data acquired with both instruments are shown in Table LABEL:RV-DATA. There are different zero point offsets between the data sets for every target listed in Table 3.
3 Keplerian analysis
To find the orbital parameters, we combined a global genetic algorithm (GA; Charbonneau 1995) with the MPFit algorithm (Markwardt, 2009). This hybrid approach is described in Goździewski et al. (2003); Goździewski & Migaszewski (2006); Goździewski et al. (2007). The range of the Keplerian orbital parameters found with the GA was searched with the RVLIN code (Wright & Howard, 2009), which we modified to introduce the stellar jitter as a free parameter to be fitted in order to find the optimal solution (Ford & Gregory, 2007; Johnson et al., 2011). The uncertainties were estimated with the bootstrap method described by Marcy et al. (2005).
For a more detailed description of the Keplerian analysis presented here, we refer the reader to the first TAPAS paper Niedzielski et al. (2015a). The results of the analysis of our RV data are listed in Table 3.
| Parameter | HD 4760 | BD+02 3313 | TYC 0434-04538-1 | HD 96992 |
|---|---|---|---|---|
| (days) | ||||
| (MJD) | ||||
| () | ||||
| (deg) | ||||
| () | ||||
| () | ||||
| () | ||||
| offset () | ||||
| () | 64 | 10.3 | 22 | 22 |
| 1.13 | 1.33 | 1.26 | 1.23 | |
| RMS () | 66 | 13.1 | 26.1 | 27 |
| 35 | 29 | 29 | 76 |
3.1 HD 4760
HD 4760 (BD+05 109, TYC-0017-01084-1) is one of the least metal abundant giants in our sample, with ([Fe/H]=-0.910.09).
We have measured the RVs for this star at 35 epochs over about a nine year period. Twenty-five epochs of the HET/HRS data were obtained between Jan 12, 2006 and Jan 22, 2013 (2567 days, which is more than seven years). These data exhibit a RV amplitude of . We have also made additional ten observations of this star with the HARPS-N between Nov 30, 2012 and June 23, 2015 (935 days). For these observations, the measured RV amplitude is . These RV variations are more than two orders of magnitude larger than the estimated RV precision of our measurements.
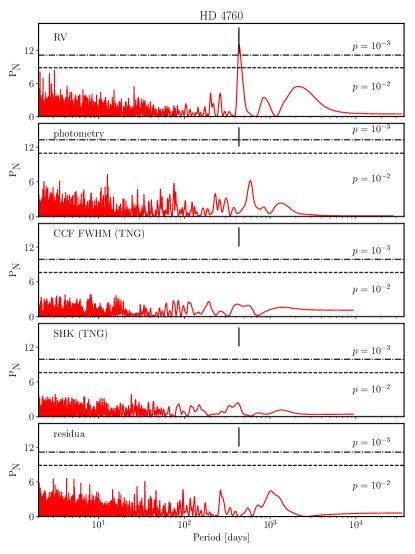
The measured RVs show a statistically significant periodic signal in Lomb-Scargle periodogram (Lomb, 1976; Scargle, 1982; Press et al., 1992) (with a false alarm probability ) with a peak at about 430 days (Figure 2, top panel).
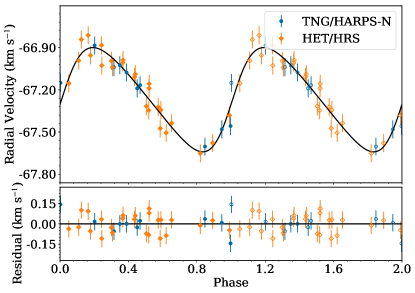
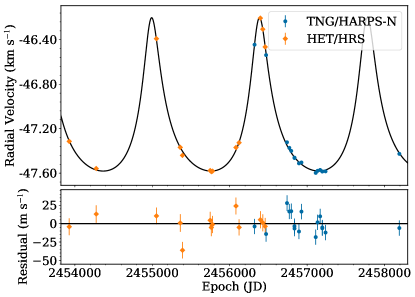
These data, interpreted in terms of a Keplerian motion, show that this star hosts a low-mass companion on an au, eccentric () orbit (Figure 3). The calculated minimum mass of , makes the system similar to the one hosted by BD+20 2457. See Table 3 and Figure 3 for the details of the Keplerian model.
After fitting this model out of the data, the remaining RV residuals leave no trace of a periodic signal (Figure 2, bottom panel).
3.2 HD 96992
HD 96992 (BD+44 2063, TYC 3012-00145-1) is another low-metallicity ([Fe/H]=) giant in our sample.
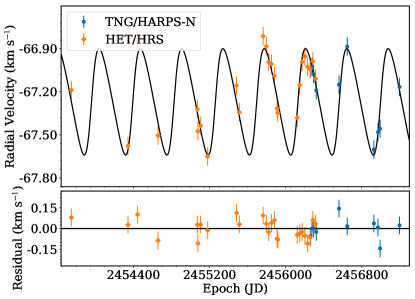
For this star, we have measured the RVs at 74 epochs over a 14 year period. The HET/HRS data have been obtained at 52 epochs between Jan 20, 2004 and Feb 06, 2013 (3305 days, or nine years), showing a maximum amplitude of Twenty-four more epochs of the HARPS-N data were collected between Dec 16, 2012 and Mar 14, 2018 (1914 days, over 5 years), resulting in a maximum RV amplitude of .
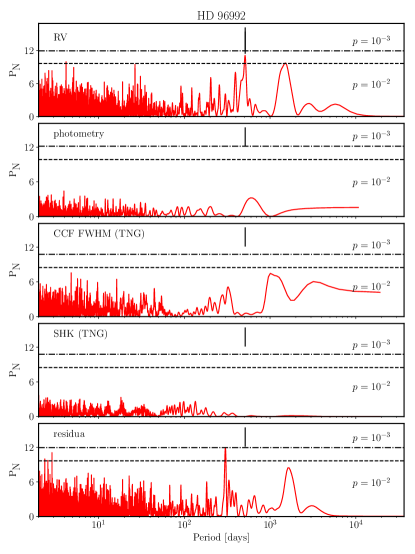
The observed maximum RV amplitude is 25-100 times larger than the estimated RV precision. Our RV measurements show a statistically significant periodic signal (with a false alarm probability of about ) with a peak at about 510 days (Figure 4, top panel).
As the result of our Keplerian model fitting to data, this single periodic RV signal suggests that HD 96992 hosts a mass planet on a au, rather eccentric orbit (). The parameters of this fit are listed in Table 3, and Fig. 5 shows the fit to RV data.
As seen in Fig. 4 (bottom panel), the RV residuals, after removing the Keplerian model, reveal yet another long period signal of similar statistical significance to the 514 days one, at a period of about 300 days.
We find this periodicity consistent with our estimate of the rotation period for HD 96992. To test alternative scenarios for this system, we tried to model a planetary system with two planets, but the dynamical modeling with Systemic 2.16 (Meschiari et al., 2009) shows that such a system is highly unstable and disintegrates after about 1000 years. We also attempted to interpret the signal at 300 days as a single, Keplerian orbital motion, but it resulted in a highly eccentric orbit, and the quality of the fit was unsatisfactory. We therefore rejected these alternative solutions.
In conclusion, we postulate that the signal at 514 days, evident in the RV data for HD 96992 is due to a Keplerian motion, and the days signal remaining in the post-fit RV residuals reflects rotation of a feature on the stellar surface.
3.3 BD+02 3313
BD+02 3313 (TYC 0405-01114-1) has a solar like metallicity of [Fe/H]=0.100.07, but it has 27 times higher luminosity.
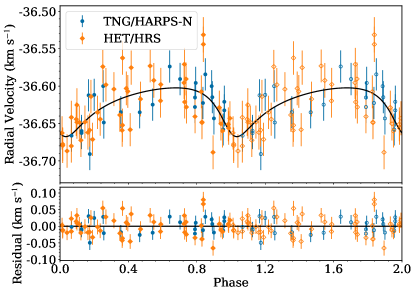
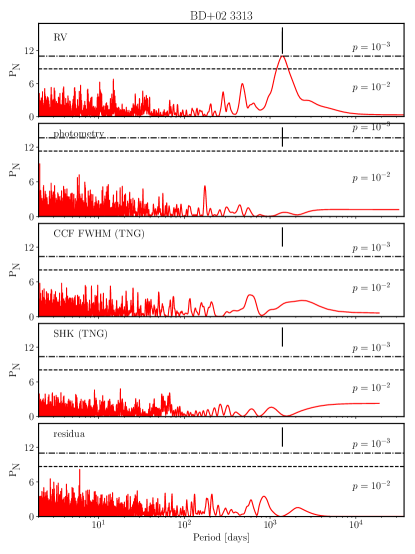
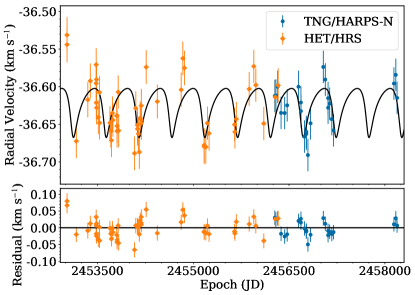
We have measured the RV’s for this star at 29 epochs over 4264 days (11.6 years). Thirteen epochs worth of the HET/HRS RV data were gathered between Jul 11, 2006 and Jun 15, 2013 (2531 days, nearly a seven year time span). These RVs show a maximum amplitude of . Additional sixteen RV measurements were made with the HARPS-N between Jan 29, 2013 and Mar 14, 2018 (1870 day or over a 5 year time span). In this case, the maximum RV amplitude is , which is three orders of magnitude larger than the estimated RV precision. The data show a statistically significant periodic signal (with a false alarm probability of about 10-3) with a peak at about 1400 days (Figure 6, top panel).
Interpreted in terms of the Keplerian motion, the available RVs show that this star hosts a low-mass companion, a brown dwarf, with a minimum mass of . The companion is located on a relatively eccentric orbit (), at au, within the brown dwarf desert (Marcy & Butler, 2000), an orbital separation area below 3-5 au, known for paucity of brown dwarf companions to solar-type stars. Parameters of the Keplerian fit to these RV data are listed in Table 3, and shown in Fig. 7.
After removing the Keplerian model from the RV data, the residuals leave no sign of any leftover periodic signal (Figure 6, bottom panel).
3.4 TYC 0434-04538-1
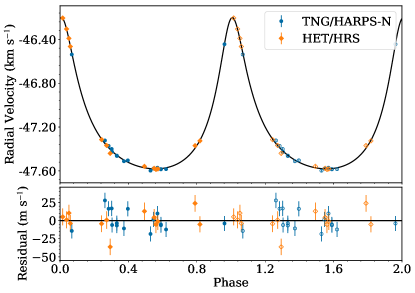
TYC 0434-04538-1 (GSC 00434-04538), another low metallicity ([Fe/H]=-0.380.06) giant, has been observed 29 times over a period of 3557 days (9.7 years).
The HET/HRS measurements were made at twelve epochs, between Jun 23, 2008 and Jun 13, 2013 (over 1816 days, or nearly five years), showing a maximum RV amplitude of Additional RV measurements for this star were made with the HARPS-N at 17 eopchs between Jun 27, 2013 and Mar 14, 2018 (1721 days, 4.7 years). These data show a maximum RV amplitude of , which is similar to that seen in the HET/HRS measurements. This is over two orders of magnitude more than the estimated RV precision. The data show a strong, statistically significant, periodic signal (false alarm probability ) with a peak at about 193 days (Figure 8, top panel).
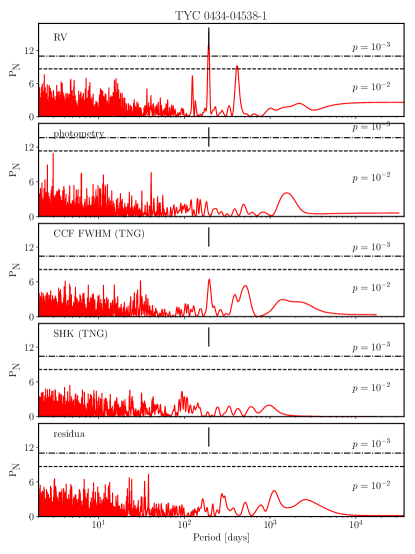
Our Keplerian analysis shows that this star hosts a mass planet on au, almost circular () orbit, at the edge of the avoidance zone. The model parameters of the best Keplerian fit to data are presented in Table 3 and in Fig. 9.
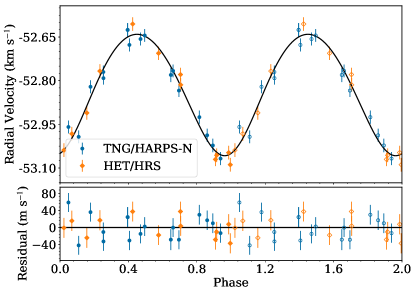
After removing this model from the observed RV measurements we do not see any other periodic signal in the periodogram of the post-fit residuals. (Figure 8, bottom panel).
4 Stelar variability and activity analysis
Stars beyond the MS, especially the red giants, exhibit activity and various types of variability that either alter their line profiles and mimic RV shifts or cause the line shifts. Such phenomena, if periodic, may be erroneously taken as evidence for the presence of orbiting, low-mass companions.
A significant variability of the red giants has been already noted by Payne-Gaposchkin (1954) and Walker et al. (1989), and made the nature of these variations a topic of numerous studies.
All the red giants of spectral type of K5 or later have been found to be variable photometrically with amplitudes increasing for the cooler stars (Edmonds & Gilliland, 1996; Henry et al., 2000).
Short-period RV variations in giants were demonstrated to originate from the -mode oscillations by Hatzes & Cochran (1994). The first detection of multimodal oscillations in a K0 giant, UMa, was published by Buzasi et al. (2000).
The solar-type, -mode (radial) oscillations (Kjeldsen & Bedding, 1995; Corsaro et al., 2013) are easily observable in the high precision, photometric time-series measurements, and they have been intensely studied based on the COROT (Baglin et al., 2006) and KEPLER (Gilliland et al., 2010) data, leading to precise mass determinations of many stars (De Ridder et al., 2009; Bedding et al., 2010; Kallinger et al., 2010; Hekker et al., 2011). Yu et al. (2020) present an HRD with the amplitudes and frequencies of solar-like oscillations from the MS up to the tip of the RGB.
The granulation induced ,,flicker” (Corsaro et al., 2017; Tayar et al., 2019), with characteristic time scales of hours, is undoubtedly an additional unresolved component to the RV scatter in the red giants.
Low amplitude, non-radial oscillations (mixed modes of Dziembowski et al. 2001) in the red giants (with frequencies of 5-60 cycles per day) were first detected by Hekker et al. (2006). They were later unambiguously confirmed using the COROT data by De Ridder et al. (2009), who also found that the lifetimes of these modes are on the order of a month.
With the typical timescales for the red giants, ranging from hours to days, the short-period variations typically remain unresolved in low-cadence observations, focused on the long-term RV variations, and they contribute an additional uncertainty to the RV measurements.
In the context of planet searches, long period variations of the red giant stars are more intriguing, because they may masquerade as the low-mass companions. Therefore, to distinguish between line profile shifts due to orbital motion from those caused by, for instance, pulsations, and line profile variations induced by stellar activity, it is crucial to understand processes that may cause the observed line shifts by studying the available stellar activity indicators.
As the HET/HRS spectra do not cover the spectral range, where Ca II H & K lines are present, we use the line bisector, and the Hα line index as activity indicators. In the case of TNG HARPS-N spectra, in addition to the RVs, the DRS provides the FWHM of the cross-correlation function (CCF) between the stellar spectra and the digital mask and the line bisector (as defined in Queloz et al. 2001), both being sensitive activity indicators.
4.1 Line bisectors
The spectral line bisector (BIS) is a measure of the asymmetry of a spectral line, which can arise for such reasons as blending of lines, a surface feature (dark spots, for instance), oscillations, pulsations, and granulation (see Gray 2005 for a discussion of BIS properties). BIS has been proven to be a powerful tool to detect starspots and background binaries (Queloz et al., 2001; Santos et al., 2002) that can mimic a planet signal in the RV data. In the case of surface phenomena (cool spots), the anti-correlation between BIS and RV is expected Queloz et al. (2001). In the case of a multiple star system with a separation smaller than that of the fiber of the spectrograph, the situation is more complicated: a correlation, anti-correlation, or lack of correlation may occur, depending on the properties of the components (see Santerne et al. 2015 and Günther et al. 2018 for a discussion). Unfortunately, for the slow-rotating giant stars, like our targets, BIS is not a sensitive activity indicator (Santos et al., 2003, 2014).
The HET/HRS and the HARPS-N bisectors are defined differently and were calculated from different instruments and spectral line lists. They are not directly comparable and have to be considered separately. All the HET/HRS spectral line bisector measurements were obtained from the spectra used for the I2 gas-cell technique (Marcy & Butler, 1992; Butler et al., 1996). The combined stellar and iodine spectra were first cleaned of the I2 lines by dividing them by the corresponding iodine spectra imprinted in a flat-field ones, and then cross-correlated with a binary K2 star mask. A detailed description of this procedure is described in Nowak et al. (2013). As stated in Sect. 2.2 , HET/HRS is not a stabilized spectrograph, and the lack of correlation for BIS should be treated with caution, as it might be a result of the noise introduced by the varying instrumental profile.
The Bisector Inverse Slopes of the cross-correlation functions from the HARPS-N data were obtained with the Queloz et al. (2001) method, using the standard HARPS-N user’s pipeline, which utlilizes the simultaneous Th-Ar calibration mode of the spectrograph and the cross-correlation mask with a stellar spectrum (K2 in our case).
4.2 The activity index
The Hα line is a widely used indicator of the chromospheric activity, as the core of this line is formed in the chromosphere. The increased stellar activity shows a correspondigly filled Hα profile. Variations in the flux in the line core can be measured with the activity index, defined as the flux ratio in a band centered on the Hα to the flux in the reference bands. We have measured the Hα activity index () in both the HET/HRS and the TNG/HARPS-N spectra using the procedure described in Maciejewski et al. (2013) (cf. also Gomes da Silva et al. 2012 or Robertson et al. 2013, and references therein).
The HET/HRS spectra were obtained with the use of the iodine cell technique meaning that the iodine spectrum was imprinted on the stellar one. To remove the weak iodine lines in the Hα region, we divided an order of spectrum by the Hα by the corresponding order of the GC flat spectrum, before performing the index analysis.
4.3 Calcium H & K doublet
The reversal profile in the cores of Ca H and K lines, i.e., the emission structure at the core of the Ca absorption lines, is another commonly used indicator of stellar activity (Eberhard & Schwarzschild, 1913). The Ca II H & K lines are located at the blue end of the TNG/HARPS-N spectra, which is the region with the lowest S/N for our red targets. The S/N of the spectra for the stars discussed here varies between 2 and 10. Stacking the spectra to obtain a better S/N is not possible here as they have been taken at least a month apart. For every epoch’s usable spectrum for a given star, we calculated the index following the formula of Duncan et al. (1991), and we calibrated it against the Mount Wilson scale with the formula provided in Lovis et al. (2011). We also searched the indices for variability and found none (see periodograms in Figures 2, 4, 6 and 8). Therefore, we conclude that the determined indices are not related to the observed RV variations.
4.4 Photometry
Stellar activity and pulsations can also manifest themselves through changes in the brightness of a star. All our targets have been observed by large photometric surveys. We collected the available data for them from several different catalogs: ASAS (Pojmanski, 1997), NSVS (Woźniak et al., 2004), Hipparcos (Perryman & ESA, 1997) and SuperWASP (Pollacco et al., 2006). We then selected the richest and the most precise data set from all available ones for a detailed variability and period search. The original photometric time series were binned by one day intervals. We found no periodic signal in the selected time-series photometry for any of our targets (see periodograms in Figures 2, 4, 6 and 8). Table 5 summarizes the results for the selected data.
4.5 CCF FWHM
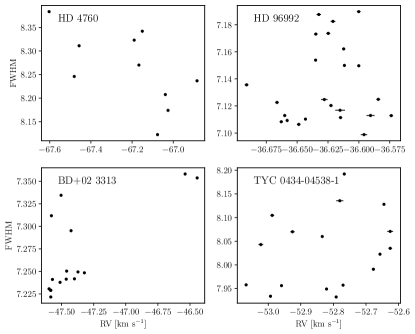
The stellar activity and surface phenomena impact the shape of the lines in the stellar spectrum. Properties of CCF, a mean profile of all spectral lines, are used as activity indicators. In a recent paper Oshagh et al. (2017) found the CCF FWHM to be the best indicator of stellar activity available from the HARPS-N DRS (for main sequence sun-like stars), in accordance with the previous results of Queloz et al. (2009) and Pont et al. (2011). These authors recommend it to reconstruct the stellar RV jitter as the CCF FWHM correlates well with the activity-induced RV in the stars of various activity levels.
For all the HARPS-N observations available for our targets, we have correlated the FWHM of the CCF against the RV measurements for the TNG/HARPS-N data set. The presence of a correlation means that the observed variability may stem from distorted spectral lines, possibly due to stellar activity. The results of this analysis are shown in Table 4 and in Fig. 10. In the case of BD+02 3313 we found a statistically significant () correlation at the accepted confidence level of p=0.01 between the observed RV and the CCF FWHM.
We also searched the CCF FWHM from HARPS-N for variability but found no statistically significant signal (see periodograms in Figures 2, 4, 6 and 8).
| Star | HET/HRS | |||||||||
| OS | OSHET | BIS | No | |||||||
| [days] | [] | [days] | [] | [] | r | p | r | p | ||
| HD 4760 | 3449 | 2567 | ||||||||
| HD 96992 | 5167 | 3305 | ||||||||
| BD+02 3313 | 4264 | 2531 | ||||||||
| TYC 0434-04538-1 | 3551 | 1816 | ||||||||
| Star | OSTNG | BIS | FWHM | No | ||||||||
|---|---|---|---|---|---|---|---|---|---|---|---|---|
| [days] | [] | r | p | r | p | r | p | r | p | |||
| HD 4760 | 934 | 10 | ||||||||||
| HD 96992 | 1914 | 24 | ||||||||||
| BD+02 3313 | 1870 | 16 | ||||||||||
| TYC 0434-04538-1 | 1721 | 17 | ||||||||||
| HD 4760 | HD 96992 | BD+02 3313 | TYC 0434 04538 1 | |
|---|---|---|---|---|
| Source | ASAS | Hipparcos | ASAS | ASAS |
| to [HJD] | 2455168.56291 | 2448960.99668 | 2455113.52337 | 2455122.52181 |
| N points | 288 | 96 | 414 | 419 |
| filter | V | Hp | V | V |
| mean mag. | 7.483 | 8.741 | 9.477 | 10.331 |
| rms mag. | 0.023 | 0.019 | 0.018 | 0.019 |
5 Discussion.
Hatzes & Cochran (1993a) have suggested that the low-amplitude, long-period RV variations in red giants are attributable to pulsations, stellar activity - a spot rotating with a star, or low-mass companions. Such RV variations have been successfully demonstrated to be due to a presence of low-mass companions to many giants. Starting from Dra (Frink et al., 2002b), 112 giants with planets have been listed in the compilation by Sabine Reffert - https://www.lsw.uni-heidelberg.de/users/sreffert/giantplanets/giantplanets.php. For some giants, however, the companion hypothesis has been debatable.
The nature of the observed RV long-term variability in some giants (O’Connell, 1933; Payne-Gaposchkin, 1954; Houk, 1963) remains a riddle. Long, secondary period (LSP) photometric variations of AGB stars but also the luminous red giant (K5-M) stars near the tip of the first giant branch (TFGB), brighter than logL/L⊙2.7, were detected in MACHO (Wood et al., 1999): their sequence D in the period-luminosity relation for the variable semi-regular giants), and in OGLE (Soszyński, 2007; Soszyński et al., 2009, 2011, 2013) data. They associate primary (but not always stronger) pulsations in these stars with typically 10 times shorter periods (usually on sequence B, first overtone pulsations, of Wood et al. 1999). Depending on the adopted detection limit, 30-50 of luminous red giants may display LSP (Soszynski et al., 2007). With photometric amplitudes of the order of 1 mag, periods ranging from 250 to 1400 days, and RV amplitudes of 2-7 (Wood et al., 2004; Nicholls et al., 2009), LSP in luminous giants should be easily detectable in precise RV planet searches.
Soszynski et al. (2004a), following suggestions by Ita et al. (2002) and Kiss & Bedding (2003), demonstrated that in the LMC, LSP are also present in stars below the TFGB, in the first ascent giants. These stars, OGLE Small Amplitude Red Giants (OSARGs, Wray et al. 2004), show much lower amplitudes (mag in I band).
The origin of LSP is practically unknown. Various scenarios: the eccentric motion of an orbiting companion of mass , radial and nonradial pulsations, rotation of an ellipsoidal-shaped red giant, episodic dust ejection, and starspot cycles, were discussed in Wood et al. (2004). These authors propose a composite effect of large-amplitude non-radial, g+ mode pulsation, and strong starspot activity as the most feasible model. Soszyński & Udalski (2014) proposed another scenario, a low-mass companion in a circular orbit just above the surface of the red giant, followed by a dusty cloud that regularly obscures the giant and causes the apparent luminosity variations. More recently, Saio et al. (2015) proposed oscillatory convective modes as another explanation for the LSP. Thse models, however, cannot explain effective temperatures of AGB stars (, ) and periods at the same time.
Generally, the observational data seem to favour binary-type scenarios for LSP in giants, as for shorter periods the sequence D coincides with the E sequence of Wood et al. (1999), formed by close binary systems, in which one of the components is a red giant deformed due to the tidal force (Soszynski et al., 2004b; Nicholls & Wood, 2012). Sequence E appears then, to be an extension of the D sequence towards lower luminosity giants (Soszynski et al., 2004b), and some of the LSP cases may be explained by ellipsoidal variability (ibid.). See Nicholls & Wood (2012) for a discussion of differences of properties of pulsating giants in sequences D and E.
Recently, Lee et al. (2014), Lee et al. (2016), and Delgado Mena et al. (2018), invoked LSP as a potential explanation of observed RV variations in HD 216946 (M0 Iab var, logg=0.5 0.3, R=350R⊙, M=6.81.0 M⊙), UMa (M0 III SB, Teff=3899 35K, logg=1.0, M=2.2M⊙, R=74.7R⊙, L=1148L⊙); and NGC 4349 No. 127 (L=504.36L⊙, logg=1.990.19, R=36.984.89R⊙, M=3.810.23M⊙), respectively.
An interesting case of Eltanin ( Dra), a giant with RV variations that disappeared after several years, was recently discussed by Hatzes et al. (2018). This star, (, and , op. cit. and [Fe/H] = +0.11 0.09, K, and Koleva & Vazdekis 2012) exhibited periodic RV variations that mimicked an companion in 702 day orbit between 2003 and 2011. In the more recent data, collected between 2011 and 2017, these variations disappeared. The nature of this type of variability is unclear. The authors suggest a new form of stellar variability, possibly related to oscillatory convective modes (Saio et al., 2015).
Aldebaran ( Tau) was studied in a series of papers (Hatzes & Cochran, 1993b, 1998) in search for the origin of observed long-term RV variations. Hatzes et al. (2015), based on 30 year long observations, put forward a planetary hypothesis to this giant star ( K, , and [Fe/H]=-0.27 0.05, , op.cit.). They proposed a planet in 629 day orbit and a 520 day rotation modulation by a stellar surface structure. Recently, Reichert et al. (2019) showed, that in 2006/2007, the statistical power of the day period exhibited a temporary but significant decrease. They also noted an apparent phase shift between the RV variations and orbital solution at some epochs. These authors note the resemblance of this star and Dra, and also point to oscillatory convective modes of Saio et al. (2015) as the source of observed variations.
Due to the unknown underlying physics of the LSP, these claims are difficult to dispute. However, a mysterious origin of the LSP certainly makes luminous giants very intriguing objects, especially in the context of searching for low-mass companions around them.
Another phenomenon that can mimic low-mass companions in precise RV measurements is starspots rotating with the stellar disk. They can affect spectral line profiles of magnetically active stars and mimic periodic RV variations caused by orbiting companions (Vogt et al., 1987; Walker et al., 1992; Saar & Donahue, 1997).
Slowly rotating, large G and K giants, are not expected to exhibit strong surface magnetic fields. Nevertheless, they may show activity in the form of emission in the cores of strong chromospheric lines, photometric variability, or X-ray emission (Korhonen, 2014). In their study of 17 377 oscillating red giants from Kepler Ceillier et al. (2017) identified only 2.08 of the stars to show a pseudo-periodic photometric variability likely originating from surface spots (a frequency consistent with the fraction of spectroscopically detected, rapidly rotating giants in the field).
The most extreme example of a slowly rotating giant with a relatively strong magnetic field of 100 G (Aurière et al., 2008) is EK Eri. This star was found to be a , GIV-III giant with K, and photometric period of days by Strassmeier et al. (1999). A detailed spectroscopic study by dall et al. (2005) has shown RV variations of about with the rotation period and a positive correlation between RV and BIS. In a following extensive study of this object, Dall et al. (2010) constrain the atmospheric parameters, suggest that the rotation period is twice the photometric period days, and present a 1979-2009 V photometry time series. The amplitude of the periodic variations is about 0.3 mag.
Another example is Pollux ( Gem), a slowly rotating M=2.30.2M⊙ (Lyubimkov et al., 2019) giant with a detected magnetic field. In a series of papers: Hatzes & Cochran (1993a); Larson et al. (1993); Reffert et al. (2006), it has been found to have a planetary-mass companion in days orbit, and no sign of activity. Later on, that result was confirmed by Hatzes et al. (2006), who also estimated the star’s rotation period to be 135 days. Aurière et al. (2009) detected a weak magnetic field of -0.460.04 G in Pollux, and Aurière et al. (2014) proposed a two-spot model that might explain the observed RV variations. However, in their model ,,photometric variations of larger amplitude than those detected in the Hipparcos data were predicted”. In their recent paper Aurière et al. (2021) find that the longitudinal magnetic field of Pollux varies with a sinusoidal behaviour and a period of 66015 days, similar, to that of the RV variations but different.
The presence of spots on a stellar surface may mimic low-mass companions, if the spots show a similar, repetitive pattern for a sufficiently long period of time. However, very little is known about the lifetime of spots on the surface of single inactive, slowly rotating giants. Mosser et al. (2009) estimate that on the surface of F-G type, MS stars spots may form for a duration of 0.5-2 times the rotation period. Hall et al. (1990) studied the evolution of four spots on the surface of a long-period RS CVN binary V1817 Cygni (K2III), and estimated their lifetimes to be two years. Also, Gray & Brown (2006) identified a magnetically active region on the surface of Arcturus (K2 III) that lasted for a period of 2.0 0.2 yr (the star was found to present a weak magnetic field by Sennhauser & Berdyugina 2011). Brown et al. (2008) have published observations that suggest migration of an active region on the surface of Arcturus over a timescale of 115-253 days. A similar result, suggesting a 0.5-1.3 year recurrence period in starspot emergence, was derived in the case of a rapidly rotating K1IV star, KIC 11560447 (Özavcı et al., 2018).
The lifetime of spots on surfaces of single, low activity giants appears to be on the order of 2 years. A long enough series of data, covering several lifetimes of starspots is clearly required to rule out or confirm activity-related features as the origin of the observed RV variability.
5.1 HD 4760
HD 4760 is the most luminous and one of the most evolved stars in our sample with . Its large radius (), low metallicity ([Fe/H]=-0.910.09), and small make it a twin to BD+20 2457, taking into account the estimated uncertainties.
The observed RV amplitude is about four times larger than the expected amplitude of the -mode oscillations (cf. Table 3). We find the actual RV jitter () in HD 4760 about three times smaller than the expected () from the p-mode oscillations (Table 3). Such discrepancy cannot be explained by the estimated uncertainties, and it suggests that they may have been underestimated in either luminosity or mass (or both).
The high luminosity of HD 4760 makes it an interesting candidate for an LSP object. However, the existing photometric data from ASAS do not indicate any variability. Moreover, our RV data covering about nine periods of the observed variation timescale, although not very numerous, do not show changes in amplitude or phase, as those detected in Dra or Tau (Figure 11).
The rotation period of HD 4760 (1531 days) is highly uncertain, and, given the uncertainties in and , its maximum value () may range between 672 and 8707 days. The orbital period from the Keplerian fit to the RV data is shorter than the maximum allowed rotation period and we cannot exclude the possibility that the periodic distortions of spectral lines by a spot rotating with the star are the reason for the observed RV variations. However, HD 4760 does not show an increased activity (relative to the other stars in our sample) and none of activity indicators studied here is correlatec with the observed RV variations. Also, an estimate of the spot fraction that would cause the observed RV amplitude, based on the scaling relation of Hatzes (2002), gives a rather unrealistic value of f=53[]. Our data also show that the periodic RV variation have been present in HD 4760 for over nine years, which is unlikely, if caused by a surface feature. Together with the apparent lack of photometric variability, we find that available data exclude that scenario.
We conclude that the reflect motion due to a companion appears to be the most likely hypothesis that explains the observed RV variations in HD 4760.
The mass of the companion and a rather tight orbit of HD 4760 b locate it deep in the zone of engulfment (Villaver & Livio, 2009; Villaver et al., 2014; Veras, 2016). However, predicting its future requires more detailed analysis, as this relatively massive companion may survive the common envelope phase of this system’s evolution (Livio & Soker, 1984).
See Table 3 for details of the Keplerian model.
5.2 HD 96992
Of the time series presented in this paper, this is certainly the noisiest one. The Keplerian model for the 514-day period results in a RV semi-amplitude of only (about five times greater than estimated HET/HRS precision), similar to the jitter of (Figure 12). The observed RV amplitude is about twenty times larger than the expected amplitude of the p-mode oscillations. The jitter resulting from the Keplerian fit is larger than that expected from the scaling relations of Kjeldsen & Bedding (1995). This suggests an additional contribution, like granulation ,,flicker”, to the jitter.
HD 96992 is much less luminous than HD 4760, with =1.470.09. It is located much below the TFGB, which makes it unlikely to be an irregular LSP giant. An apparent lack of photometric variability supports that claim as well.
The orbital period of 514 days is much longer than the estimated rotation period of days ( days within uncertainties), which, together with absence of a photometric variability of similar period and no correlation with activity indicators, excludes a spot rotating with the star as a cause of the observed RV variations. The days period present in RV residua is more likely to be due to rotation.
The apparent absence of any correlation of observed RV variations with activity indicators and no trace of periodic variations in those indices makes the keplerian model the most consistent with the existing data. Details of our Keplerian model are shown in Table 3.
The planet of this system orbits the star deep in the engulfment zone (Villaver & Livio, 2009) and will most certainly be destroyed by its host before the AGB phase.
5.3 BD+02 3313
BD+02 3313 is a very intriguing case of a solar metallicity giant. With =1.440.24 it is located well below the TFGB, even below the horizontal branch, which makes it very unlikely to be an LSP pulsating red giant.
The RV signal is very apparent; the Keplerian orbit suggests a RV semi-amplitude of and a period of 1393 days.
These RV data show an amplitude over two orders of magnitude larger than that expected of the p-modes oscillations.
The fitted jitter of 10 ms-1 is close to the expected from the scaling relations of Kjeldsen & Bedding (1995), within uncertainties of mass and luminosity.
The estimated rotation period of days ( within uncertainties) is much shorter than the Keplerian orbital period. The extensive photometric data set from ASAS, contemporaneous with our HET/HRS data, shows no periodic signal and no excess scatter that might be a signature of spots on the surface of the star.
None of the activity indices studied here shows a significant periodic signal. Line bisectors, and are uncorrelated with the RV variations. The value of does not indicate a significant activity, compared to other stars in our sample. The persistence of the RV periodicity for over 11 years also advocates against a possible influence of an active region rotating with the star.
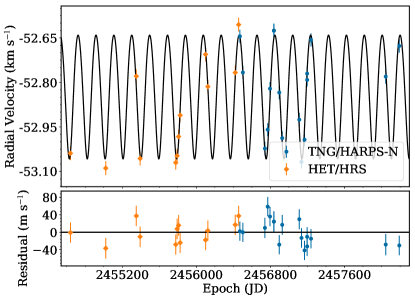
The resulting Keplerian model (Figure 14), which suggests an companion in a 2.47 au, eccentric () orbit (i.e., a brown dwarf in the brown dwarf desert) is consistent with the available RV data for the total time-span of the observing run.
However, FWHM of the CCF from HARPS-N data for BD+02 3313 shows an correlation, which is statistically significant at the accepted confidence level of p=0.01 (Figure 10, lower left panel). Given the small number of CCF FWHM data points, we cannot exclude the possibility that the observed correlation is spurious. This possibility seems to be supported by the apparent lack of a periodic signal in the LS periodogram for CCF FWHM (Figure 6).
An assumption that all the observed RV variations in this inactive star are due to the rotation of a surface feature is inconsistent with the existing photometry and our rotation period estimate. A more likely explanation would be the presence of a spatially unresolved companion associated with BD+02 3313.
We conclude that the observed RV and CCF FWHM correlation seriously undermines the Keplerian model of the observed RV variations in BD+02 3313. The actual cause of the reported RV variations remains to be identified with the help of additional observations.
5.4 TYC 0434-04538-1
TYC 0434-04538-1 is a low metallicity, [Fe/H]=-0.380.06 giant, with a luminosity of , which locates it near the horizontal branch. As such, the star is unlikely to be an irregular LSP giant.
It shows a strong, periodic RV signal, which, when modelled under the assumption of a Keplerian motion, shows a semi amplitude of , and a period of 193 days. The RV data show an amplitude about forty times larger than that expected of the p-mode oscillation. Again, the jitter is larger than expected form the p-mode oscillations only, so it likely contains an additional component, unresolved by our observations, like the granulation ,,flicker”.
This period is shorter than the estimate of days, hence the observed RV variation may originate, in principle, from a feature on the stellar surface rotating with the star. The spot would have to cover f= of the stellar surface according to the simple model of Hatzes Hatzes (2002) to explain the observed RV variations. Photometric data from ASAS, which show no variability, do not support this scenario. We also note that such a large spot coverage () was successfully applied to model spots on the surface of the overactive spotted giant in a binary system EPIC 211759736 by Oláh et al. (2018).
Consequently, we conclude that the available data favour the low-mass companion hypothesis.
5.5 The current status of the project
The sample contains 122 stars in total, with at least two epochs of observations that allowed us to measure the RV variation amplitude.
Sixty stars in the sample (49) are assumed to be single, as they show in several epochs of data over a period of, typically, 2-3 years. This group of stars may still contain long period and/or low-mass companions, which means that the number of single stars may be overestimated. Due to available telescope time further observations of these stars have been ceased.
The estimate of single star frequency in our sample, although based on a small sample of GK stars at various stages of evolution from the MS to the RGB, agrees with the results of a study of a sample of 454 stars by Raghavan et al. 2010 who found that of solar-type stars are single. We take this agreement as a confirmation that our sample is not biased towards binary or single stars.
Nineteen stars in our sample () are spectroscopic binaries with . Technically not only HD 181368 b (Adamów et al., 2018) but also BD+20 274 b (Gettel et al., 2012) belongs to this group, due to the observed RV trend. Although we cannot exclude more low-mass companions associated with binary stellar systems for these targets, they were rejected from further observations after several epochs, due to a limited telescope time available.
Finally, 43 of the stars in our sample () show RV amplitudes between and and are assumed to be either active stars or planetary/BD companion candidates. These stars have been searched for low-mass companions by this project.
Six low-mass companion hosts have been identified in the sample so far: HD 102272 (Niedzielski et al., 2009a), BD+20 2457 (Niedzielski et al., 2009b), BD+20 274 (Gettel et al., 2012), HD 219415 (Gettel et al., 2012), HD 5583 (Niedzielski et al., 2016b), and HD 181368 (Adamów et al., 2018).
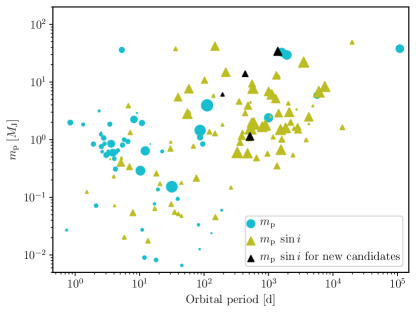
This paper presents low-mass companions to another three stars: HD 4760, TYC 0434 04538 1, HD 96992. Our findings add to a population of 228 planets orbiting solar-mass stars in exoplanets.org (Figure 15).
Seven stars from the sample (HD 102272, BD+20 2457, BD+20 274, HD 219415, HD 5583, TYC 0434 04538 1, HD 96992) show RV variations consistent with planetary-mass companions (), which represents of the sample.
6 Conclusions
Based on precise RV measurements gathered with the HET/HRS and Harps-N for over 11 years, we have discussed three solar-mass giants with low mass companions: HD 4760 hosts a companion in an au and orbit; HD 96992 has a companion in an au, eccentric, orbit; TYC 0434-04538-1 is accompanied with a companion in an au, nearly circular orbit with . In the case of BD+02 3313 we find the Keplerian model uncertain because of statistically significant correlation between RV and CCF FWHM in the HARPS-N data.
The analysis of RV amplitudes in our sample of 122 solar-mass stars at various stellar evolution stages shows that single star frequency is , which means that the sample is not biased against stellar binarity.
Acknowledgements.
We thank the HET and IAC resident astronomers and telescope operators for their support. AN was supported by the Polish National Science Centre grant no. 2015/19/B/ST9/02937. EV acknowledges support from the Spanish Ministerio de Ciencia Inovación y Universidades under grant PGC2018-101950-B-100. KK was funded in part by the Gordon and Betty Moore Foundation’s Data-Driven Discovery Initiative through Grant GBMF4561. This research was supported in part by PL-Grid Infrastructure. The HET is a joint project of the University of Texas at Austin, the Pennsylvania State University, Stanford University, Ludwig- Maximilians-Universität München, and Georg-August-Universität Göttingen. The HET is named in honor of its principal benefactors, William P. Hobby and Robert E. Eberly. The Center for Exoplanets and Habitable Worlds is supported by the Pennsylvania State University, the Eberly College of Science, and the Pennsylvania Space Grant Consortium. This research has made use of the SIMBAD database, operated at CDS, Strasbourg, France. This research has made use of NASA’s Astrophysics Data System. The acknowledgements were compiled using the Astronomy Acknowledgement Generator. This research made use of SciPy (Jones et al., 2001–). This research made use of the yt-project, a toolkit for analyzing and visualizing quantitative data (Turk et al., 2011). This research made use of matplotlib, a Python library for publication quality graphics (Hunter, 2007). This research made use of Astropy, a community-developed core Python package for Astronomy (Astropy Collaboration et al., 2013). IRAF is distributed by the National Optical Astronomy Observatory, which is operated by the Association of Universities for Research in Astronomy (AURA) under cooperative agreement with the National Science Foundation (Tody, 1993). This research made use of NumPy (Walt et al., 2011). We thank the referee for comments that have significantly contributed to improving this paper.References
- Adamczyk et al. (2016) Adamczyk, M., Deka-Szymankiewicz, B., & Niedzielski, A. 2016, A&A, 587, A119
- Adamów et al. (2018) Adamów, M., Niedzielski, A., Kowalik, K., et al. 2018, A&A, 613, A47
- Adamów et al. (2012) Adamów, M., Niedzielski, A., Villaver, E., Nowak, G., & Wolszczan, A. 2012, ApJ, 754, L15
- Adamów et al. (2014) Adamów, M., Niedzielski, A., Villaver, E., Wolszczan, A., & Nowak, G. 2014, A&A, 569, A55
- Adamów et al. (2015) Adamów, M., M., Niedzielski, A., Villaver, E., et al. 2015, A&A, 581, A94
- Astropy Collaboration et al. (2013) Astropy Collaboration, Robitaille, T. P., Tollerud, E. J., et al. 2013, A&A, 558, A33
- Aurière et al. (2014) Aurière, M., Konstantinova-Antova, R., Espagnet, O., et al. 2014, in IAU Symposium, Vol. 302, Magnetic Fields throughout Stellar Evolution, ed. P. Petit, M. Jardine, & H. C. Spruit, 359–362
- Aurière et al. (2008) Aurière, M., Konstantinova-Antova, R., Petit, P., et al. 2008, A&A, 491, 499
- Aurière et al. (2021) Aurière, M., Petit, P., Mathias, P., et al. 2021, arXiv e-prints, arXiv:2101.02016
- Aurière et al. (2009) Aurière, M., Wade, G. A., Konstantinova-Antova, R., et al. 2009, A&A, 504, 231
- Baglin et al. (2006) Baglin, A., Auvergne, M., Barge, P., et al. 2006, in ESA Special Publication, Vol. 1306, The CoRoT Mission Pre-Launch Status - Stellar Seismology and Planet Finding, ed. M. Fridlund, A. Baglin, J. Lochard, & L. Conroy, 33
- Bedding et al. (2010) Bedding, T. R., Huber, D., Stello, D., et al. 2010, ApJ, 713, L176
- Borucki et al. (2010) Borucki, W. J., Koch, D., Basri, G., et al. 2010, Science, 327, 977
- Bressan et al. (2012) Bressan, A., Marigo, P., Girardi, L., et al. 2012, MNRAS, 427, 127
- Brown et al. (2008) Brown, K. I. T., Gray, D. F., & Baliunas, S. L. 2008, ApJ, 679, 1531
- Butler et al. (1996) Butler, R. P., Marcy, G. W., Williams, E., et al. 1996, PASP, 108, 500
- Buzasi et al. (2000) Buzasi, D., Catanzarite, J., Laher, R., et al. 2000, ApJ, 532, L133
- Catala & PLATO Consortium (2008) Catala, C. & PLATO Consortium. 2008, in Journal of Physics Conference Series, Vol. 118, Journal of Physics Conference Series, 012040
- Ceillier et al. (2017) Ceillier, T., Tayar, J., Mathur, S., et al. 2017, A&A, 605, A111
- Charbonneau (1995) Charbonneau, P. 1995, ApJS, 101, 309
- Corsaro et al. (2013) Corsaro, E., Fröhlich, H. E., Bonanno, A., et al. 2013, MNRAS, 430, 2313
- Corsaro et al. (2017) Corsaro, E., Mathur, S., García, R. A., et al. 2017, A&A, 605, A3
- Cosentino et al. (2012) Cosentino, R., Lovis, C., Pepe, F., et al. 2012, in SPIE Conference Series, Vol. 8446, SPIE Conference Series
- da Silva et al. (2006) da Silva, L., Girardi, L., Pasquini, L., et al. 2006, A&A, 458, 609
- Dall et al. (2010) Dall, T. H., Bruntt, H., Stello, D., & Strassmeier, K. G. 2010, A&A, 514, A25
- dall et al. (2005) dall, T. H., Bruntt, H., & Strassmeier, K. G. 2005, A&A, 444, 573
- De Ridder et al. (2009) De Ridder, J., Barban, C., Baudin, F., et al. 2009, Nature, 459, 398
- Deka-Szymankiewicz et al. (2018) Deka-Szymankiewicz, B., Niedzielski, A., Adamczyk, M., et al. 2018, A&A, 615, A31
- Delgado Mena et al. (2018) Delgado Mena, E., Lovis, C., Santos, N. C., et al. 2018, A&A, 619, A2
- Duncan et al. (1991) Duncan, D. K., Vaughan, A. H., Wilson, O. C., et al. 1991, ApJS, 76, 383
- Dziembowski et al. (2001) Dziembowski, W. A., Gough, D. O., Houdek, G., & Sienkiewicz, R. 2001, MNRAS, 328, 601
- Eberhard & Schwarzschild (1913) Eberhard, G. & Schwarzschild, K. 1913, ApJ, 38, 292
- Edmonds & Gilliland (1996) Edmonds, P. D. & Gilliland, R. L. 1996, ApJ, 464, L157
- Ford & Gregory (2007) Ford, E. B. & Gregory, P. C. 2007, in ASP Conference Series, Vol. 371, Statistical Challenges in Modern Astronomy IV, ed. G. J. Babu & E. D. Feigelson, 189
- Frink et al. (2002a) Frink, S., Mitchell, D. S., Quirrenbach, A., et al. 2002a, ApJ, 576, 478
- Frink et al. (2002b) Frink, S., Mitchell, D. S., Quirrenbach, A., et al. 2002b, ApJ, 576, 478
- Gaia Collaboration et al. (2016) Gaia Collaboration, Brown, A. G. A., Vallenari, A., et al. 2016, aap, 595, A2
- Gettel et al. (2012) Gettel, S., Wolszczan, A., Niedzielski, A., et al. 2012, ApJ, 756, 53
- Gilliland et al. (2010) Gilliland, R. L., Brown, T. M., Christensen-Dalsgaard, J., et al. 2010, PASP, 122, 131
- Gomes da Silva et al. (2012) Gomes da Silva, J., Santos, N. C., Bonfils, X., et al. 2012, A&A, 541, A9
- Goździewski et al. (2003) Goździewski, K., Konacki, M., & Maciejewski, A. J. 2003, ApJ, 594, 1019
- Goździewski et al. (2007) Goździewski, K., Maciejewski, A. J., & Migaszewski, C. 2007, ApJ, 657, 546
- Goździewski & Migaszewski (2006) Goździewski, K. & Migaszewski, C. 2006, A&A, 449, 1219
- Gray (2005) Gray, D. F. 2005, PASP, 117, 711
- Gray & Brown (2006) Gray, D. F. & Brown, K. I. T. 2006, PASP, 118, 1112
- Günther et al. (2018) Günther, M. N., Queloz, D., Gillen, E., et al. 2018, MNRAS, 478, 4720
- Hall et al. (1990) Hall, D. S., Gessner, S. E., Lines, H. C., & Lines, R. D. 1990, AJ, 100, 2017
- Hatzes (2002) Hatzes, A. P. 2002, Astronomische Nachrichten, 323, 392
- Hatzes & Cochran (1993a) Hatzes, A. P. & Cochran, W. D. 1993a, ApJ, 413, 339
- Hatzes & Cochran (1993b) Hatzes, A. P. & Cochran, W. D. 1993b, ApJ, 413, 339
- Hatzes & Cochran (1994) Hatzes, A. P. & Cochran, W. D. 1994, ApJ, 432, 763
- Hatzes & Cochran (1998) Hatzes, A. P. & Cochran, W. D. 1998, MNRAS, 293, 469
- Hatzes et al. (2015) Hatzes, A. P., Cochran, W. D., Endl, M., et al. 2015, A&A, 580, A31
- Hatzes et al. (2006) Hatzes, A. P., Cochran, W. D., Endl, M., et al. 2006, A&A, 457, 335
- Hatzes et al. (2018) Hatzes, A. P., Endl, M., Cochran, W. D., et al. 2018, AJ, 155, 120
- Hatzes et al. (2005) Hatzes, A. P., Guenther, E. W., Endl, M., et al. 2005, A&A, 437, 743
- Hekker et al. (2006) Hekker, S., Aerts, C., De Ridder, J., & Carrier, F. 2006, A&A, 458, 931
- Hekker et al. (2011) Hekker, S., Gilliland, R. L., Elsworth, Y., et al. 2011, MNRAS, 414, 2594
- Henry et al. (2000) Henry, G. W., Fekel, F. C., Henry, S. M., & Hall, D. S. 2000, ApJS, 130, 201
- Houk (1963) Houk, N. 1963, AJ, 68, 253
- Hunter (2007) Hunter, J. D. 2007, Computing In Science & Engineering, 9, 90
- Ita et al. (2002) Ita, Y., Tanabé, T., Matsunaga, N., et al. 2002, MNRAS, 337, L31
- Johnson et al. (2007) Johnson, J. A., Fischer, D. A., Marcy, G. W., et al. 2007, ApJ, 665, 785
- Johnson et al. (2011) Johnson, J. A., Payne, M., Howard, A. W., et al. 2011, AJ, 141, 16
- Jones et al. (2001–) Jones, E., Oliphant, T., Peterson, P., et al. 2001–, SciPy: Open source scientific tools for Python, [Online; accessed ¡today¿]
- Jørgensen & Lindegren (2005) Jørgensen, B. R. & Lindegren, L. 2005, A&A, 436, 127
- Kallinger et al. (2010) Kallinger, T., Mosser, B., Hekker, S., et al. 2010, A&A, 522, A1
- Kiss & Bedding (2003) Kiss, L. L. & Bedding, T. R. 2003, MNRAS, 343, L79
- Kjeldsen & Bedding (1995) Kjeldsen, H. & Bedding, T. R. 1995, A&A, 293, 87
- Koleva & Vazdekis (2012) Koleva, M. & Vazdekis, A. 2012, A&A, 538, A143
- Korhonen (2014) Korhonen, H. 2014, in IAU Symposium, Vol. 302, Magnetic Fields throughout Stellar Evolution, ed. P. Petit, M. Jardine, & H. C. Spruit, 350–358
- Larson et al. (1993) Larson, A. M., Irwin, A. W., Yang, S. L. S., et al. 1993, PASP, 105, 825
- Lee et al. (2014) Lee, B. C., Han, I., Park, M. G., Hatzes, A. P., & Kim, K. M. 2014, A&A, 566, A124
- Lee et al. (2016) Lee, B.-C., Han, I., Park, M.-G., et al. 2016, AJ, 151, 106
- Lee et al. (2011) Lee, B.-C., Mkrtichian, D. E., Han, I., Kim, K.-M., & Park, M.-G. 2011, A&A, 529, A134
- Linsky & Haisch (1979) Linsky, J. L. & Haisch, B. M. 1979, ApJ, 229, L27
- Livio & Soker (1984) Livio, M. & Soker, N. 1984, MNRAS, 208, 763
- Lomb (1976) Lomb, N. R. 1976, Ap&SS, 39, 447
- Lovis et al. (2011) Lovis, C., Dumusque, X., Santos, N. C., et al. 2011, ArXiv e-prints [arXiv:1107.5325]
- Lovis & Pepe (2007) Lovis, C. & Pepe, F. 2007, A&A, 468, 1115
- Lyubimkov et al. (2019) Lyubimkov, L. S., Petrov, D. V., & Poklad, D. B. 2019, Astrophysics, 62, 338
- Maciejewski et al. (2013) Maciejewski, G., Niedzielski, A., Wolszczan, A., et al. 2013, AJ, 146, 147
- Marcy & Butler (1992) Marcy, G. W. & Butler, R. P. 1992, PASP, 104, 270
- Marcy & Butler (2000) Marcy, G. W. & Butler, R. P. 2000, PASP, 112, 137
- Marcy et al. (2005) Marcy, G. W., Butler, R. P., Vogt, S. S., et al. 2005, ApJ, 619, 570
- Markwardt (2009) Markwardt, C. B. 2009, in Astronomical Society of the Pacific Conference Series, Vol. 411, Astronomical Data Analysis Software and Systems XVIII, ed. D. A. Bohlender, D. Durand, & P. Dowler, 251
- Mayor & Queloz (1995) Mayor, M. & Queloz, D. 1995, Nature, 378, 355
- Meschiari et al. (2009) Meschiari, S., Wolf, A. S., Rivera, E., et al. 2009, PASP, 121, 1016
- Mosser et al. (2009) Mosser, B., Baudin, F., Lanza, A. F., et al. 2009, A&A, 506, 245
- Nicholls & Wood (2012) Nicholls, C. P. & Wood, P. R. 2012, MNRAS, 421, 2616
- Nicholls et al. (2009) Nicholls, C. P., Wood, P. R., Cioni, M. R. L., & Soszyński, I. 2009, MNRAS, 399, 2063
- Niedzielski et al. (2016a) Niedzielski, A., Deka-Szymankiewicz, B., Adamczyk, M., et al. 2016a, A&A, 585, A73
- Niedzielski et al. (2009a) Niedzielski, A., Goździewski, K., Wolszczan, A., et al. 2009a, ApJ, 693, 276
- Niedzielski et al. (2007) Niedzielski, A., Konacki, M., Wolszczan, A., et al. 2007, ApJ, 669, 1354
- Niedzielski et al. (2009b) Niedzielski, A., Nowak, G., Adamów, M., & Wolszczan, A. 2009b, ApJ, 707, 768
- Niedzielski et al. (2016b) Niedzielski, A., Villaver, E., Nowak, G., et al. 2016b, A&A, 588, A62
- Niedzielski et al. (2016c) Niedzielski, A., Villaver, E., Nowak, G., et al. 2016c, A&A, 589, L1
- Niedzielski et al. (2015a) Niedzielski, A., Villaver, E., Wolszczan, A., et al. 2015a, A&A, 573, A36
- Niedzielski & Wolszczan (2008a) Niedzielski, A. & Wolszczan, A. 2008a, in IAU Symposium, Vol. 249, IAU Symposium, ed. Y.-S. Sun, S. Ferraz-Mello, & J.-L. Zhou, 43–47
- Niedzielski & Wolszczan (2008b) Niedzielski, A. & Wolszczan, A. 2008b, in Astronomical Society of the Pacific Conference Series, Vol. 398, Extreme Solar Systems, ed. D. Fischer, F. A. Rasio, S. E. Thorsett, & A. Wolszczan, 71
- Niedzielski et al. (2015b) Niedzielski, A., Wolszczan, A., Nowak, G., et al. 2015b, ApJ, 803, 1
- Nowak (2012) Nowak, G. 2012, PhD thesis, Nicolaus Copernicus Univ., Toruń, Poland
- Nowak et al. (2013) Nowak, G., Niedzielski, A., Wolszczan, A., Adamów, M., & Maciejewski, G. 2013, ApJ, 770, 53
- O’Connell (1933) O’Connell, D. J. K. 1933, Harvard College Observatory Bulletin, 893, 19
- Oláh et al. (2018) Oláh, K., Rappaport, S., Borkovits, T., et al. 2018, A&A, 620, A189
- Oshagh et al. (2017) Oshagh, M., Santos, N. C., Figueira, P., et al. 2017, A&A, 606, A107
- Özavcı et al. (2018) Özavcı, I., Şenavcı, H. V., I\textcommabelowsık, E., et al. 2018, MNRAS, 474, 5534
- Payne-Gaposchkin (1954) Payne-Gaposchkin, C. 1954, Annals of Harvard College Observatory, 113, 189
- Pepe et al. (2002a) Pepe, F., Mayor, M., Galland, F., et al. 2002a, A&A, 388, 632
- Pepe et al. (2002b) Pepe, F., Mayor, M., Galland, F., et al. 2002b, A&A, 388, 632
- Perryman & ESA (1997) Perryman, M. A. C. & ESA, eds. 1997, ESA Special Publication, Vol. 1200, The HIPPARCOS and TYCHO catalogues. Astrometric and photometric star catalogues derived from the ESA HIPPARCOS Space Astrometry Mission
- Pojmanski (1997) Pojmanski, G. 1997, Acta Astron., 47, 467
- Pollacco et al. (2006) Pollacco, D. L., Skillen, I., Collier Cameron, A., et al. 2006, PASP, 118, 1407
- Pont et al. (2011) Pont, F., Aigrain, S., & Zucker, S. 2011, MNRAS, 411, 1953
- Press et al. (1992) Press, W. H., Teukolsky, S. A., Vetterling, W. T., & Flannery, B. P. 1992, Numerical recipes in FORTRAN. The art of scientific computing (Cambridge University Press)
- Queloz (1995) Queloz, D. 1995, in IAU Symposium, Vol. 167, New Developments in Array Technology and Applications, ed. A. G. D. Philip, K. Janes, & A. R. Upgren, 221
- Queloz et al. (2009) Queloz, D., Bouchy, F., Moutou, C., et al. 2009, A&A, 506, 303
- Queloz et al. (2001) Queloz, D., Henry, G. W., Sivan, J. P., et al. 2001, A&A, 379, 279
- Raghavan et al. (2010) Raghavan, D., McAlister, H. A., Henry, T. J., et al. 2010, ApJS, 190, 1
- Ramsey et al. (1998) Ramsey, L. W., Adams, M. T., Barnes, T. G., et al. 1998, in SPIE Conference Series, Vol. 3352, SPIE Conference Series, ed. L. M. Stepp, 34–42
- Reffert et al. (2006) Reffert, S., Quirrenbach, A., Mitchell, D. S., et al. 2006, ApJ, 652, 661
- Reichert et al. (2019) Reichert, K., Reffert, S., Stock, S., Trifonov, T., & Quirrenbach, A. 2019, A&A, 625, A22
- Ricker et al. (2015) Ricker, G. R., Winn, J. N., Vanderspek, R., et al. 2015, Journal of Astronomical Telescopes, Instruments, and Systems, 1, 014003
- Robertson et al. (2013) Robertson, P., Endl, M., Cochran, W. D., & Dodson-Robinson, S. E. 2013, ApJ, 764, 3
- Saar & Donahue (1997) Saar, S. H. & Donahue, R. A. 1997, ApJ, 485, 319
- Saio et al. (2015) Saio, H., Wood, P. R., Takayama, M., & Ita, Y. 2015, MNRAS, 452, 3863
- Santerne et al. (2015) Santerne, A., Díaz, R. F., Almenara, J. M., et al. 2015, MNRAS, 451, 2337
- Santos et al. (2002) Santos, N. C., Mayor, M., Naef, D., et al. 2002, A&A, 392, 215
- Santos et al. (2014) Santos, N. C., Mortier, A., Faria, J. P., et al. 2014, A&A, 566, A35
- Santos et al. (2003) Santos, N. C., Udry, S., Mayor, M., et al. 2003, A&A, 406, 373
- Sato et al. (2003) Sato, B., Ando, H., Kambe, E., et al. 2003, ApJ, 597, L157
- Scargle (1982) Scargle, J. D. 1982, ApJ, 263, 835
- Sennhauser & Berdyugina (2011) Sennhauser, C. & Berdyugina, S. V. 2011, A&A, 529, A100
- Shetrone et al. (2007) Shetrone, M., Cornell, M. E., Fowler, J. R., et al. 2007, PASP, 119, 556
- Soszyński (2007) Soszyński, I. 2007, ApJ, 660, 1486
- Soszynski et al. (2007) Soszynski, I., Dziembowski, W. A., Udalski, A., et al. 2007, Acta Astron., 57, 201
- Soszyński & Udalski (2014) Soszyński, I. & Udalski, A. 2014, ApJ, 788, 13
- Soszynski et al. (2004a) Soszynski, I., Udalski, A., Kubiak, M., et al. 2004a, Acta Astron., 54, 129
- Soszynski et al. (2004b) Soszynski, I., Udalski, A., Kubiak, M., et al. 2004b, Acta Astron., 54, 347
- Soszyński et al. (2009) Soszyński, I., Udalski, A., Szymański, M. K., et al. 2009, Acta Astron., 59, 239
- Soszyński et al. (2011) Soszyński, I., Udalski, A., Szymański, M. K., et al. 2011, Acta Astron., 61, 217
- Soszyński et al. (2013) Soszyński, I., Udalski, A., Szymański, M. K., et al. 2013, Acta Astron., 63, 21
- Strassmeier et al. (1999) Strassmeier, K. G., Stȩpień , K., Henry, G. W., & Hall, D. S. 1999, A&A, 343, 175
- Tayar et al. (2019) Tayar, J., Stassun, K. G., & Corsaro, E. 2019, ApJ, 883, 195
- Tody (1993) Tody, D. 1993, in Astronomical Society of the Pacific Conference Series, Vol. 52, Astronomical Data Analysis Software and Systems II, ed. R. J. Hanisch, R. J. V. Brissenden, & J. Barnes, 173
- Tull (1998) Tull, R. G. 1998, in SPIE Conference Series, Vol. 3355, SPIE Conference Series, ed. S. D’Odorico, 387–398
- Turk et al. (2011) Turk, M. J., Smith, B. D., Oishi, J. S., et al. 2011, ApJS, 192, 9
- Veras (2016) Veras, D. 2016, Royal Society Open Science, 3, 150571
- Villaver & Livio (2009) Villaver, E. & Livio, M. 2009, ApJ, 705, L81
- Villaver et al. (2014) Villaver, E., Livio, M., Mustill, A. J., & Siess, L. 2014, ApJ, 794, 3
- Villaver et al. (2017) Villaver, E., Niedzielski, A., Wolszczan, A., et al. 2017, A&A, 606, A38
- Vogt et al. (1987) Vogt, S. S., Penrod, G. D., & Hatzes, A. P. 1987, ApJ, 321, 496
- Walker et al. (1992) Walker, G. A. H., Bohlender, D. A., Walker, A. R., et al. 1992, ApJ, 396, L91
- Walker et al. (1989) Walker, G. A. H., Yang, S., Campbell, B., & Irwin, A. W. 1989, ApJ, 343, L21
- Walt et al. (2011) Walt, S. v. d., Colbert, S. C., & Varoquaux, G. 2011, Computing in Science and Engg., 13, 22
- Winn & Fabrycky (2015) Winn, J. N. & Fabrycky, D. C. 2015, ARA&A, 53, 409
- Wolszczan & Frail (1992) Wolszczan, A. & Frail, D. A. 1992, Nature, 355, 145
- Wood et al. (1999) Wood, P. R., Alcock, C., Allsman, R. A., et al. 1999, in IAU Symposium, Vol. 191, Asymptotic Giant Branch Stars, ed. T. Le Bertre, A. Lebre, & C. Waelkens, 151
- Wood et al. (2004) Wood, P. R., Olivier, E. A., & Kawaler, S. D. 2004, ApJ, 604, 800
- Woźniak et al. (2004) Woźniak, P. R., Vestrand, W. T., Akerlof, C. W., et al. 2004, AJ, 127, 2436
- Wray et al. (2004) Wray, J. J., Eyer, L., & Paczyński, B. 2004, MNRAS, 349, 1059
- Wright & Howard (2009) Wright, J. T. & Howard, A. W. 2009, ApJS, 182, 205
- Yu et al. (2020) Yu, J., Bedding, T. R., Stello, D., et al. 2020, MNRAS, 493, 1388
- Zieliński et al. (2012) Zieliński, P., Niedzielski, A., Wolszczan, A., Adamów, M., & Nowak, G. 2012, A&A, 547, A91