Precision measurements of electric-field-induced frequency displacements of an ultranarrow optical transition in ions in a solid
Abstract
We report a series of measurements of the effect of an electric field on the frequency of the ultranarrow linewidth optical transition of ions in an matrix at cryogenic temperatures. We provide linear Stark coefficients along two dielectric axes and for the two different substitution sites of the ions, with an unprecedented accuracy, and an upper limit for the quadratic Stark shift. The measurements, which indicate that the electric field sensitivity is a factor of seven larger for site 1 relative to site 2 for a particular direction of the electric field are of direct interest both in the context of quantum information processing and laser frequency stabilization with rare-earth doped crystals, in which electric fields can be used to engineer experimental protocols by tuning transition frequencies.
pacs:
42.50.Ct.,76.30.KgOptically addressable ions as dopants in solids provide an interesting framework for a wide range of contemporary applications in physics. In particular, rare-earth ions in a crystalline matrix are popular candidates for a steadily growing number of applications due to their outstanding coherence properties Yano1991 ; Equall1994 ; Thiel2011 ; Goldner2011 ; Rancic2018 . Applications include both classical Berger2016 ; Venet2018 and quantum Nilson2005 ; Bussieres2014 ; Walther2015 ; Maring2017 ; Dibos2018 information processing schemes, quantum optical memories Zhong2017 ; Laplane2017 ; Seri2017 , and laser stabilization techniques Julsgaard2007 ; Thorpe2011 ; Galland2020_OL .
In this work we use the 580 nm optical transition in ions in an host matrix (Eu:YSO). This transition has an ultranarrow linewidth, potentially down to 122 Hz at 1.4 K with 100 G magnetic field Equall1994 . The ions can substitute for ions in two different crystallographic sites, referred to as site 1 and 2, with vacuum wavelengths of 580.04 nm and 580.21 nm, respectively, and we here investigate both sites. We have recently demonstrated that the optical transition frequency of the ions can be modulated by applying mechanical stress on the crystalline matrix Galland2020 ; Zhang2020 which makes the system promising for optomechanics experiments in which a mechanical motion couples to the ion frequency Molmer2016 ; Seidelin2019 . An alternative way of controlling the frequency is based on the Stark effect, in which an external electric field interacts with the electric dipole moment involved in the transition Macfarlane2007 ; Li2016 . In the Eu:YSO system, the Stark coefficients for the optical transition have so far been measured with a limited precision, and only in one of the two different substitution sites Graf1998 ; Macfarlane2014 . Here, the technique of spectral hole burning (see later), combined with the use of an ultranarrow linewidth laser, allows us to obtain not only more accurate values for the already measured site, but also provide measurements for the other much less sensitive site, which thus requires a higher precision in order to assess the corresponding Stark coefficient.
To study the influence of the electrical field (E-field), we use the technique of spectral hole burning, which allows us to work with a large ensemble of ions without being limited by the inhomogeneous broadening of the collective absorption line, which is of the order of 2 GHz in our case for 0.1-at.% europium doping. More precisely, the ground state consists of 3 hyperfine states (figure 1a), with mutual separations in the 30-100 MHz range Yano1991 . Spectral holes are formed by pumping the ions resonantly from the to the state, from where they decay radiatively, mainly to the state Konz2003 , before decaying non-radiatively to the three hyperfine states in the manifold. Optical pumping prevents population build-up in the hyperfine level with which the pump beam is resonant, creating a transparent window in the inhomogeneous profile at this exact frequency. By subsequently scanning the probe laser in the neighborhood of the pump-laser frequency, the shape and frequency of the spectral hole can be recorded. A spectral hole represents approximately ions.
Our experimental setup has recently been described in detail elsewhere Gobron2017 ; Galland2020_OL ; Galland2020 and will be only briefly summarized in the following. We use two diode lasers (referred to as master and slave) at 1160 nm. The master laser is frequency locked to an ultra-stable Fabry-Perot reference optical cavity by the Pound-Drever-Hall technique, allowing for a frequency instability below for time scales of 1-100 s and a few Hz laser linewidth. The slave laser is phase locked to the master laser with a tunable frequency offset. The slave laser possesses the same stability as the master, but its frequency is continuously tunable in a range of several GHz. They are both subsequently frequency doubled to reach 580 nm, with an output intensity of approximately 5 mW. Moreover, an acousto-optic modulator allows us to scan the slave-laser frequency across the spectral structures with a range of approximately 1 MHz. A high stability (in fact, absolute) optical frequency measurement is provided when necessary by comparing the slave laser against a primary frequency reference via an optical frequency comb. Avalanche photodiodes are used to measure the intensity of the slave laser before and after passing through the crystal, thereby deducing the shape and position of the spectral hole. For maximum absorption Konz2003 (both for burning and probing) we propagate the laser beam parallel to the crystallographic -axis, and maintain the laser polarization parallel to the dielectric D1 axis (figure 1b). In this work, the pump and the probe beams are collimated and diaphragmed by an iris of 2 mm diameter (a fourth of the crystal width and height), and kept in the center of the crystal in order to minimize surface effects. The crystal is maintained at 3.2 K in a closed-loop cryostat resting on an active vibration isolation platform. Under these conditions, we obtain spectral holes with a full width at half maximum (FWHM) of about 3 to 5 kHz.
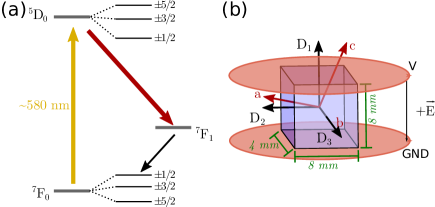
To apply a homogeneous E-field, we use two circular electrodes (31 mm in diameter) above and below the crystal as shown in figure 1b). As the electric permittivity of the crystal is a factor of ten larger than that of vacuum, it is crucial to avoid gaps between electrodes and the crystal. We use a thin ( 0.1 mm) layer of silver lacquer to contact the crystal directly with the electrodes. The distance between the electrodes is consequently the same as the height of the crystal (the electrodes being extended to the surface of the crystal due to the silver lacquer) which is equal to about 8 mm. To study the linear Stark regime, we burn a spectral hole in the absence of an E-field, then apply a voltage ranging from 0 to 28 V, giving rise to an electric field in the range of 0 to 3500 V m-1, and observe the influence on the spectral hole.
The YSO crystal is monoclinic and exhibits a C2h symmetry. The two nonequivalent crystallographic sites of the ions are both of C1 symmetry. In the general case of an application of an E-field with an arbitrary direction, the crystal symmetry gives rise to four possible non-equivalent orientations of the electric dipole moment difference between the ground and excited state (, i=1,2,3,4) for each site, arising from the order of the crystal symmetry group (4) divided by the order of the symmetry group of the crystal site (1), see figure 2a. Thus, in the general case, the presence of an arbitrary electric field will split a spectral hole into 4 components Graf1997 . Because of the centrosymmetric crystal space group, the splitting of the spectral hole will to first order remain symmetric in frequency around zero.
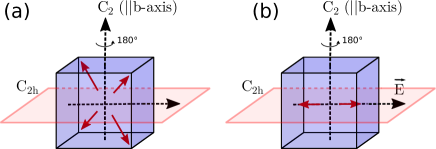
We will determine the Stark effect for an E-field parallel to either the D1 or D2 axis, and thus in both cases, perpendicular to the crystal -axis which coincides with the C2 rotational symmetry axis. As the mirror symmetry plane of the crystal is perpendicular to the C2 rotation axis, the E-field is thus contained within this plane in our case, as illustrated in figure 2b. This means that the component of a given electric dipole moment perpendicular to mirror plane is not influenced by our E-field, and thus the splitting arising from the mirror symmetry vanishes. Therefore, in all our measurements, the spectral hole only splits into two components, arising from the C2 rotation symmetry alone.
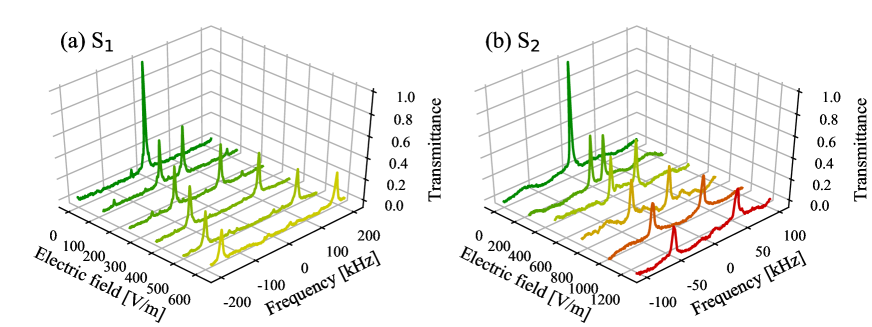
This two-fold splitting into a positive and a negative frequency branch is illustrated for an electric field applied along the D1 direction in figure 3. Here, the transmittance of the crystal is plotted as a function of frequency difference with respect to the hole burning frequency, i.e. , where the initial spectral hole burning occurred, for 6 different values of the applied E-field for the two different crystal sites. The center frequency of each peak is then obtained by a double Lorentzian fit of the transmittance, , where and denote the center frequency of the two branches, is the (common) FWHM of the two Lorentzian, and , , and take into account the offset and normalization of .
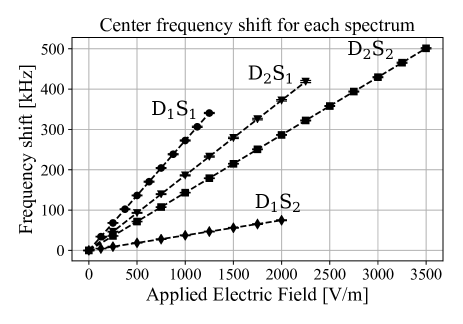
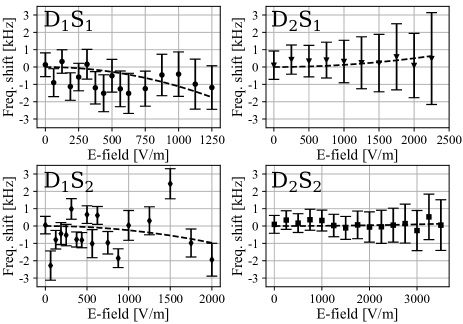
These frequency shifts are then plotted as a function of the E-field in figure 4, for an E-field aligned along either the D1 or D2 direction, and in each case for both crystal sites. Each point in this figure is the average of two separate measurement sequences or more (a data acquisition sequence lasts approximately 30 minutes). For each sequence, the shift for each data point is half the frequency difference between the positive and negative branch peaks centers, i.e. , (thereby ensuring negligible effect of slow frequency drifts of the reference Fabry-Perot cavity, as such drift would shift both peaks by the same amount in the same direction). The errorbars which are shown on the data and are used in the fit algorithm are estimated individually for each curve, as the noise floor (data baseline) varies from scan to scan and adds to the uncertainty on the determination of the central frequency. They correspond to approximately one tenths of the FWHM of the spectral structures in figure 3. In order to obtain the linear Stark coefficients, we initially assume that the effect is purely linear, and fit the data accordingly with a purely linear model using a least squares method. The linear Stark coefficients are given in table 1. Our measurement of the coefficient for site 1 corresponding to an E-field parallel to the D1-axis is consistent with the earlier, less accurate measurement reported in ref. Macfarlane2014 (0.27 kHz m V-1 with no explicit errorbar).
| Site | Axis | Value | Stat. | Syst. |
|---|---|---|---|---|
| 1 | D1 | 271.8 | 0.5 | 1.6 |
| 1 | D2 | 186.1 | 0.4 | 2.4 |
| 2 | D1 | 37.4 | 0.5 | 1.2 |
| 2 | D2 | 143.2 | 0.5 | 0.3 |
The uncertainty on the electric field is composed of three elements: applied voltage, crystal dimensions and inhomogeneity of the electric field arising from an electrode geometrical misalignment and difference in permittivity between vacuum and YSO. The voltage and the crystal dimensions were verified with SI-traceable calibrated instruments, resulting in an error induced by these quantities significantly below the stated uncertainty. We performed numerical simulations with a finite element method software, utilizing the permittivity coefficient of YSO expressed in ref. Carvalho2015 and allowing for up to 1 mm misalignment of the electrodes. These simulations confirm that, averaged over the part of the crystal probed by the laser beam, the relative error on the estimation of the electric field is below , implying negligible effect on our stated uncertainty. The statistical uncertainty on the coefficients is obtained from the linear fit which takes into account the error-bars on each individual frequency measurement, arising from the lorentzian fits of each spectral pattern. The last column in table 1 shows the systematic errors which arise from the uncertainty on the orientation of the dielectric axis relative to the crystal-cut (0.5∘, as set by X-ray orientation and precision machining). Note that during all measurements, we systematically probe the spectral structure without the E-field before and after the measurement sequence, to verify that no drift has occurred due to other independent physical variables during the measurement sequence.
For applications in which the narrow spectral feature is used for high precision laser frequency stabilization, the linear shifts due to small fluctuations of an electric field only broaden the peak symmetrically (an initial symmetric splitting) and thus does not change the frequency of a laser locked to this peak (only the slope of the frequency discriminator is changed, not its central position). What can potentially be more detrimental in such applications is a higher order Stark effects which would introduce a non-symmetric behavior between the positive and negative branches, and thus would result, for small electric field fluctuations, in laser frequency fluctuations. Due to the high precision in our frequency measurements, we can search for a quadratic component at relatively weak fields, despite the non zero linear sensitivity, and set an upper limit of this type of non-linear Stark shift. We note that this kind of quadratic behavior physically corresponds to a small electric polarizability effect, where E-field-induced additional dipole moments in the ground and excited states, proportional to and along the E-field, produce a correction to the permanent , in a direction (set by the E-field) which is identical for the classes of ions having opposite permanent dipole moments.
Contrary to the linear (symmetric) case, it is desirable here to explicitly correct for possible slow frequency drift of the reference cavity, typically of the order of Hz.s-1, resulting in an apparent drift of frequency of the initial spectral hole, i.e. no longer holds throughout the experimental sequence (which lasts longer than stability specification timescale of the cavity). This correction is done by using an optical frequency comb, referenced to primary frequency standard, which is constantly monitoring the probe laser optical frequency. The results are shown, for both directions and sites, in figure 5 in which we have plotted as a function of the applied E-field. We notice the absence of any clear trend corresponding to an asymmetric shift of the peaks in the data. Fitting (least squares method) with a purely quadratic function, , we obtain the coefficients for the quadratic Stark effect expressed in table 2. These quadratic coefficient can be considered compatible with zero given the measurement uncertainties, and, as conservative estimates, we set the upper limits stated in the last column of the table. For site 1, this is coherent with the significantly less stringent limit of 0.2 Hz m2 V-2 previously obtained Graf1998 ; Thorpe2013 .
| Site | Axis | Value | Stat. | Abs. val. upper limit |
|---|---|---|---|---|
| 1 | D1 | |||
| 1 | D2 | |||
| 2 | D1 | |||
| 2 | D2 |
When the peaks from the positive and negative branches separate under the application of an E-field, a final possibility of quadratic effect corresponds to a deviation from the linear behavior, that would be symmetric between the positive and negative branch. This would physically require the field-induced part of the to be aligned with the rather than with the external E-field, but still be proportional to the amplitude of the field. Although this situation is physically more difficult to interpret than the asymmetric quadratic Stark effect discussed above, we still investigate the data for the presence of such behavior. For simplicity, we only consider the positive branch, and examine the residue after subtracting the linear Stark shift determined previously, i.e. . These residues are then fitted with a purely quadratic function, . From the fitting procedure, we obtain quadratic coefficients for the D1-direction of Hz m2 V-2 for site 1 and Hz m2 V-2 for site 2, and for the D2-direction Hz m2 V-2 for site 1 and Hz m2 V-2 for site 2 (with negligible systematic uncertainties). Again, these coefficients are compatible with zero within the measurement uncertainty and they are all below 1 mHz m2 V-2.
The spectral holes prior to applying an E-field typically exhibits FWHM of approximately 3 to 5 kHz. When the E-field is increased, the spectral structures gradually broaden, as observed in fig. 3. A minor part (approximately 10 % by the end of 5 consecutive measurements) of this broadening is due to the probing beam, which slowly pumps ions from the edges of the spectral hole into dark states. In principle, the remaining part could be due to a spatial inhomogeneity in the applied field. Finite-element simulations show, however, that such effect is very small (1% of the linewidth), an assertion corroborated by experimental findings that 1) using a 6 mm diameter probe beam instead of 2 mm does not change the broadening, and 2) highly E-field sensitive cases (eg. D1S1) exhibit similar broadening as less sensitive ones (eg. D1S2). However, a slight misalignemnt of the field (within the stated precision of crystal cutting) producing a component along the -axis may explain most of the broadening (the positive and negative branch broaden symmetrically under such effect). Going to higher E-fields, we have indeed observed a secondary splitting which, extrapolated, accounts for at least 50 % of the residual broadening. However, no matter the reason behind the broadening, the corresponding uncertainty is largely included in our error-bars on the data, and thus in the uncertainty stated for the Stark coefficients.
In this letter, by means of direct probing of ultranarrow spectral structures, we have provided measurements of the linear Stark effect for an optical transition in ions in an matrix by applying a field parallel to the D1 or D2 axis, with an accuracy below the 3 Hz m V-1 level. Surprisingly, for an E-field applied parallel to the D1-direction, the crystal site 1 is a factor of seven more sensitive to the field than site 2. This is useful information for applications using E-fields to electrically tune the transition frequency. Moreover, our measurements have allowed us to provide an upper limit for both an asymmetric and symmetric quadratic Stark coefficient of the order of or below the 1 mHz m2 V-2 level, depending on the site, direction and effect considered, an important information for applications in which the electric field is a source of noise, such as metrology applications, in which the transition is used as a frequency reference. For example, in order to reach a relative frequency stability of using a spectral hole as a frequency reference, an asymmetric quadratic Stark effect ¡1 mHz m2 V-2 translates into a requirement of the E-field instability below V m-1.
The project has been supported by the European Union’s Horizon 2020 research and innovation program under grant agreement No 712721 (NanOQTech). It has also received support from the Ville de Paris Emergence Program, the Région Ile de France DIM SIRTEQ, the LABEX Cluster of Excellence FIRST-TF (ANR-10-LABX-48-01) within the Program “Investissements d’Avenir” operated by the French National Research Agency (ANR), and the EMPIR 15SIB03 OC18 program co-financed by the Participating States and the European Union’s Horizon 2020 research and innovation program. The data that support the findings of this study are available from the corresponding author upon reasonable request.
References
- (1) Ryuzi Yano, Masaharu Mitsunaga and Naoshi Uesugi, Ultralong optical dephasing time in Optics Letters 16, 1884 (1991)
- (2) R. W. Equall, Y. Sun, R. L. Cone, and R. M. Macfarlane, Ultraslow optical dephasing in , Phys. Rev. Lett. 72, 2179 (1994)
- (3) C. W. Thiel, T. Böttger, and R. L. Cone, Rare-earth-doped materials for applications in quantum information storage and signal processing, J. Lumin. 131, 353 (2011)
- (4) P. Goldner, A. Ferrier, and O. Guillot-Noël, Rare Earth-Doped Crystals for Quantum Information Processing, in Handbook on the Physics and Chemistry of Rare Earths, J.-C. G. Bünzli and V. K. Pecharsky, eds. (Elsevier, 2015), Vol. 46, pp. 1-78
- (5) M. Rančić, M. P. Hedges, R. L. Ahlefeldt, M. J. Sellars Coherence time of over a second in a telecom-compatible quantum memory storage material, Nature Physics 14, 50 (2018)
- (6) P. Berger, Y. Attal, M. Schwarz, S. Molin, A. Louchet-Chauvet, T. Chanelière, J.-L. Le Gouët, D. Dolfi, and L. Morvan, Morvan RF Spectrum Analyzer for Pulsed Signals: Ultra-Wide Instantaneous Bandwidth, High Sensitivity, and High Time-Resolution, Journal of Lightwave Technology 34, 20, 4658 (2016)
- (7) C. Venet, M. Bocoum, J.-B. Laudereau, T. Chanelière, F. Ramaz, and A. Louchet-Chauvet, Ultrasound-modulated optical tomography in scattering media: flux filtering based on persistent spectral hole burning in the optical diagnosis window, Optics Letters 43,3993 (2018)
- (8) M. Nilsson and S. Kröll, Solid state quantum memory using complete absorption and re-emission of photons by tailored and externally controlled inhomogeneous absorption profiles, Opt. Commun. 247, 393 (2005)
- (9) F. Bussières, C. Clausen, A. Tiranov, B. Korzh, V. B. Verma, S. W. Nam, F. Marsili, A. Ferrier, P. Goldner, H. Herrmann, C. Silberhorn, W. Sohler, M. Afzelius, and N. Gisin, Quantum teleportation from a telecom-wavelength photon to a solid-state quantum memory, Nat. Photonics 8, 775-778 (2014)
- (10) A. Walther, L. Rippe, Y. Yan, J. Karlsson, D. Serrano, A. N. Nilsson, S. Bengtsson, and S. Kröll, High-fidelity readout scheme for rare-earth solid-state quantum computing, Phys. Rev. A 92, 022319 (2015)
- (11) N. Maring, P. Farrera, K. Kutluer, M. Mazzera, G. Heinze, and H. de Riedmatten, Photonic quantum state transfer between a cold atomic gas and a crystal, Nature 551, 485 (2017)
- (12) A. M. Dibos, M. Raha, C. M. Phenicie, and J.D. Thompson, Atomic Source of Single Photons in the Telecom Band Phys. Rev. Lett. 120, 243601 (2018).
- (13) T. Zhong, J.M. Kindem, J.G. Bartholomew, J. Rochman, I. Craiciu, E. Miyazono, M. Bettinelli, E. Cavalli, V. Verma, S. W. Nam, F. Marsili, M. D. Shaw, A. D. Beyer, and A. Faraon, Nanophotonic rare-earth quantum memory with optically controlled retrieval, Science 357 (6358), 1392 (2017)
- (14) C. Laplane, P. Jobez, J. Etesse, N. Gisin, and M. Afzelius, Multimode and Long-Lived Quantum Correlations Between Photons and Spins in a Crystal, Phys. Rev. Lett. 118, 210501 (2017)
- (15) A. Seri, A. Lenhard, D. Rieländer, M. Gündoǧan, P. M. Ledingham, M. Mazzera, and H. de Riedmatten Quantum Correlations between Single Telecom Photons and a Multimode On-Demand Solid-State Quantum Memory Phys. Rev. X 7, 021028 (2017)
- (16) B. Julsgaard, A. Walther, S. Kröll, and L. Rippe, Understanding laser stabilization using spectral hole burning, Optics Express 15, 11444 (2007)
- (17) M. J. Thorpe, L. Rippe, T. M. Fortier, M. S. Kirchner, and T. Rosenband, Frequency stabilization to via spectral-hole burning, Nature Photonics 5, 688 (2011)
- (18) N. Galland, N. Lučić, S. Zhang, H. Alvarez-Martinez, R. Le Targat, A. Ferrier, P. Goldner, B. Fang, S. Seidelin and Y. Le Coq, Double-heterodyne probing for ultra-stable laser based spectral hole burning in a rare-earth doped crystals, Optics Letters 45, 1930 (2020).
- (19) N. Galland, N. Lučić, B. Fang, S. Zhang, R. Letargat, A. Ferrier, P. Goldner, S. Seidelin and Y. Le Coq Mechanical tunability of an ultranarrow spectral feature via uniaxial stress, Physical Review Applied 13, 044022 (2020)
- (20) S. Zhang, N. Galland, N. Lučić, R. Letargat, A. Ferrier, P. Goldner, B. Fang, Y. Le Coq and S. Seidelin, Inhomogeneous response of an ion ensemble from mechanical stress, Physical Review Research 2, 013306 (2020)
- (21) K. Mølmer, Y. Le Coq, and S. Seidelin, Dispersive coupling between light and a rare-earth-ion-doped mechanical resonator, Phys. Rev. A 94, 053804 (2016)
- (22) S. Seidelin, Y. Le Coq and K. Mølmer, Rapid cooling of a strain-coupled oscillator by an optical phase-shift measurement, Phys. Rev. A 100, 013828 (2019)
- (23) R. M. Macfarlane, Optical Stark spectroscopy of solids, J. Lumin. 125, 156 (2007)
- (24) Qian Li, Yupan Bao, Axel Thuresson, Adam N. Nilsson, Lars Rippe, and Stefan Kröll, Slow-light-based optical frequency shifter, Phys. Rev. A 93, 043832 (2016)
- (25) F. R. Graf Investigations of spectral dynamics in rare earth ion doped crystals using high resolution laser techniques Ph.D. Thesis ETH Zürich (1998)
- (26) R. M. Macfarlane, A. Arcangeli, A. Ferrier, and Ph. Goldner Optical Measurement of the Effect of Electric Fields on the Nuclear Spin Coherence of Rare-Earth Ions in Solids Physical Review Letters 113, 157603 (2014)
- (27) F. Könz, Y. Sun, C. W. Thiel, R. L. Cone, R. W. Equall, R. L. Hutcheson, and R. M. Macfarlane, Temperature and concentration dependence of optical dephasing, spectral-hole lifetime, and anisotropic absorption in , Phys. Rev. B 68, 085109 (2003)
- (28) O. Gobron, K. Jung, N. Galland, K. Predehl, R. Letargat, A. Ferrier, P. Goldner, S. Seidelin and Y. Le Coq, Dispersive heterodyne probing method for laser frequency stabilization based on spectral hole burning in rare-earth doped crystals, Optics Express 25, 15539 (2017)
- (29) N.C. Carvalho, J-M. Le Floch, J. Krupka and M. Tobar, Multi-mode technique for the determination of the biaxial Y2Si05 permittivity tenssor froù 300 to 6K, Applied Physics Letters, 106, 192904 (2015)
- (30) F. R. Graf, A. Renn, U. P. Wild, and M. Mitsunaga, Site interference in Stark-modulated photon echoes, Phys. Rev. B 55, 11225 (1997)
- (31) M. J. Thorpe, D. R. Leibrandt and T. Rosenband, Shifts of optical frequency references based on spectral-hole burning in , New Journal of Physics, 15, 033006 (2013)