Personalization Paradox in Behavior Change Apps: Lessons from a Social Comparison-Based Personalized App for Physical Activity
Abstract.
Social comparison-based features are widely used in social computing apps. However, most existing apps are not grounded in social comparison theories and do not consider individual differences in social comparison preferences and reactions. This paper is among the first to automatically personalize social comparison targets. In the context of an m-health app for physical activity, we use artificial intelligence (AI) techniques of multi-armed bandits. Results from our user study (n=53) indicate that there is some evidence that motivation can be increased using the AI-based personalization of social comparison. The detected effects achieved small-to-moderate effect sizes, illustrating the real-world implications of the intervention for enhancing motivation and physical activity. In addition to design implications for social comparison features in social apps, this paper identified the personalization paradox, the conflict between user modeling and adaptation, as a key design challenge of personalized applications for behavior change. Additionally, we propose research directions to mitigate this Personalization Paradox.
1. Introduction
Personalization technology has been adopted in a wide range of digital applications such as health, training and education, e-commerce, and entertainment (zhu2020Personalization, ; snodgrass2019like, ). By using artificial intelligence (AI) to tailor themselves to individual users’ needs and preferences, personalized systems have shown to improve learnability (furqan2017learnability, ), usability (hook1998evaluating, ), and user enjoyment (shaker2010towards, ).
An active area of personalization is technologies for behavior change, especially for health or learning. In digital health and fitness applications, researchers have used personalization to establish and tailor individualized physical activity goals for improved health benefits (rabbi2015mybehavior, ; yom2017encouraging, ; sockolow2017risk, ; zhou2018evaluating, ). By a recent account, the global market of fitness apps has reached $3.3 Billion in 2019 and is expecting rapid growth in the next few years.111retrieved from https://www.reportlinker.com/p05881751/Fitness-App-Market-Research-Report-by-Function-by-Type-Global-Forecast-to.html on Oct 1, 2020 The potential societal benefits for personalization on these platforms is significant.
This paper focuses on applying personalization to the social features commonly used in fitness apps. Recently, many commercially available fitness apps for physical activity (PA), such as Fitbit, Endomondo, and Strava, use social features to increase user engagement and motivate PA. They allow users to make friends with each other, post their PA experiences (e.g., performance data and exercise route), and participate in communities with common fitness goals. Some of the most widely used social features are ranked leader boards and competitive challenges (conroy2014behavior, ; arigo2020social, ). The key psychological process that underlies these features is social comparison, which is described in social psychology as the fundamental psychological process by which individuals evaluate themselves or their behavior relative to others (festinger1954theory, ).
Despite the wide usage of social comparison-based features, most existing social fitness apps are not grounded in evidence from recent psychology theories of social comparison (arigo2020social, ). In particular, current research shows that individuals differ in the direction in which they prefer to compare themselves (i.e., comparing upward with those who are “better off” versus comparing downward with those who are “worse off”). Furthermore, when comparing to targets of their preferred direction, individuals may react positively or negatively, both in terms of the desired behavior (e.g., PA) and their motivation for it. To date, most (if not all) digital PA interventions do not address these known individual differences (arigo2020social, ). With very few exceptions (mollee2016effectiveness, ; klein2017active2gether, ), little research has been done in personalizing the social comparison targets provided to individual users. We believe that grounding the design of social fitness apps in current evidence from psychology and providing personalized social comparison opportunities can increase the apps’ effectiveness to motivate a wide range of users to be more active.
This paper presents a novel approach to personalizing social comparison automatically. We designed an Artificial Intelligence (AI)-based web app that 1) models individual users’ real-time preference of social comparison direction and their reaction to the comparison and 2) adapts the pool of comparison targets accordingly. For individual users’ reactions to social comparison, we include their behavioral reaction (in terms of their daily step counts) and motivational reaction (their reported motivation to exercise). To evaluate our approach, we conducted a 21-day user study (n=53) to investigate our personalization mechanism and how exposure to personalized social comparison targets may affect users’ PA and motivation to exercise. The study results indicate that our AI-based personalization approach was able to automatically model and manipulate social comparison in the pursuit of PA promotion. The detected effects achieved small-to-moderate effect sizes, illustrating the real-world implications of the intervention for enhancing motivation and PA.
Reflecting on this work, we identified a fundamental conflict in the design of personalization technology: the Personalization Paradox,222The term “personalization paradox” occasionally serves as a shorthand for the “privacy-personalization paradox” (aguirre2015unraveling, ) (personalization creates users’ sense of vulnerability and lower adoption rates), which is different from the use in this paper. which occurs when personalization adapts the digital environment based on its model of a user. In doing so, it also changes the user, and thus the original user model is no longer accurate. This paradoxical relationship between user modeling and adaptation is particularly acute in technologies for behavior change. Based on our study, we offer initial suggestions to mitigate this personalization paradox.
For precision and consistency, we clarify our terminology for the rest of the paper. Personalization algorithms usually consist of two steps: user modeling and adaptation of the digital environment. In the rest of this paper, we will use the term “personalization” to refer to the whole process, and “adaptation” to refer exclusively to the second step.
The main contribution of this paper is threefold:
-
•
First, to the best of our knowledge, this is the first attempt to automatically personalize for social comparison, a widely adopted feature for social m-health apps, and empirically assess its effect on users’ motivation and PA. Compared to related work built on users’ self-report (mollee2016effectiveness, ; klein2017active2gether, ), we used AI to automatically infer users’ preference and reaction. Our approach to model user’s social comparison using the AI technique of multi-armed bandits (MAB) can be applied to other personalization social computing applications.
-
•
Second, our study generated new evidence that can advance the scientific understanding of human social comparison processes. While the established psychology literature treats social comparison as a stable individual difference, our study gathered more fine-grained data on users’ social comparison behavior over 21 days. We discuss how our data may provide new evidence to further psychology research on social comparison as a dynamic process, which may improve how we design social computing, as social comparison is a ubiquitous psychological process we all engage in.
-
•
Third, perhaps most important, reflecting on our process and results, we identify a less-understood challenge in developing personalization systems for behavioral change — the personalization paradox. We extend the original concept by identifying two main causes: the self-reinforcing loop problem and the moving target problem. Our reflection and initial suggestions on the topic can help designers of personalization systems mitigate the personalization paradox.
The rest of the paper is organized as follows. We first review related literature on personalization digital interventions for PA and introduce the theory of social comparison. Next, we describe our personalization m-health app for PA. We then describe the methodology of our user study and discuss our results. Finally, we offer our interpretations of our results and design guidelines.
2. Related Work
This section presents related work in personalization digital intervention for PA, current theory on social comparison, and social comparison-based digital interventions for PA.
2.1. Personalization of Digital Interventions for PA
Among efforts to promote PA, there is a broad base of existing literature on personalized interventions, especially to adapt PA goals for improving goal adherence (parkka2010personalization, ; bleser2015personalized, ; bull1999effects, ; rabbi2015automated, ; arigo2020social, ). Among existing work on PA personalization, an emergent approach is to use artificial intelligence (AI) techniques to automatically personalize digital interventions (paredes2014poptherapy, ; yom2017encouraging, ; forman2019can, ). A benefit of AI-based interventions is the ability to provide real-time tailoring of feedback and adaptation of goals based on continuous data monitoring on an individual basis.
Extant research on health behavior change interventions has found that personalization AI systems are more acceptable to users than generic automated systems due to the relevance of health behavior recommendations delivered (rabbi2015mybehavior, ). Most importantly, the few personalization AI systems designed to enhance PA specifically have been shown to increase PA, reduce calorie intake over time, and help individuals develop more challenging but attainable step goals (rabbi2015mybehavior, ; yom2017encouraging, ; zhou2018evaluating, ).
With the wide adoption of wearable sensor technology and smartphones, much work on personalization in health applications in the HCI literature has focused on designing what information to provide the user at exactly the best time (akker2014tailoring, ). For example, previous systems have personalized the content and timing of activity recommendations based on a wide range of factors, including demographic information (buttussi2008mopet, ), behavioral patterns (lin2012bewell, ), time and location (stahl2008mobile, ; buttussi2008mopet, ), personality (arteaga2010mobile, ), social comparison behaviors (klein2017active2gether, ; king2013harnessing, ), and the user’s social community (lin2012bewell, ; king2013harnessing, ).
Critically, relatively little work has been done to evaluate the effectiveness of AI systems designed to personalize psychological processes, which are the underlying mechanisms of change that may lead to increased PA. Rather, the literature on AI systems to enhance PA has largely focused on establishing and tailoring PA goals. One promising psychological process to target in the context of PA tailoring is social comparison (as described below). Despite the wide adoption of social comparison-based features and the central role they play in digital apps for PA, only a handful of existing work explores how to personalize the social comparison environment (klein2017active2gether, ; king2013harnessing, ). This paper thus extends the literature on personalization in digital interventions for PA by further developing how to design and develop applications to personalize social comparison as a mechanism to enhance PA. In this paper, we do not directly attempt to tailor PA goals, because establishing an AI system’s ability to engage a psychological process that precedes PA is a critical first step that is missing in the current literature.
2.2. Social comparison
Social comparison describes the process by which individuals evaluate themselves or their behavior relative to others (festinger1954theory, ). Comparisons can happen quickly and automatically when an individual is exposed to information about other people (gilbert1995comparisons, ), or they can result from more conscious decision-making processes (e.g., selecting a comparison target from among many choices, as in a group setting (arigo2014social, )). Social comparison processes in intervention groups have been shown to motivate health behavior change in the contexts of weight control and PA promotion (olander2013most, ; leahey2010effect, ). In both commercially available m-health products and research prototypes, social comparison and social support are considered to be the major mechanisms to affect PA (lin2012bewell, ; arigo2020social, ; lewis2015using, ; conroy2014behavior, ). Social comparison-based features such as leader boards and competitive challenges have been used in many m-health systems (lin2012bewell, ; arigo2020social, ). However, as explained below, most existing apps do not account for individual differences and provide all users with the same kind of social comparison. As explained below, this design assumption is not completely aligned with current theories of social comparison.
Research has shown that individuals prefer different social comparison targets (bennenbroek2002social, ). Comparisons to others who seem “better off” than the comparer in a given domain are upward comparisons, and comparisons to others who seem “worse off” are downward comparisons (buunk1995comparison, ). Despite their preferences, individuals’ responses to different social comparison targets vary (van1999big, ; van2000social, ). Upward and downward comparisons can motivate behaviors such as PA if the comparer sees an upward target’s status as achievable for themselves or a downward target’s status as one to be avoided (buunk1997social, ). The opposite is also possible; an upward target’s status may be seen as unreachable, serving only to highlight the comparer’s inferiority, and a downward target’s status may be seen as an indication that one’s own situation is already satisfactory, serving to negate any need for behavior change efforts (arigo2015addressing, ; merchant2017face, ; wills1981downward, ). Furthermore, an individual’s preferences and responses may vary over short periods (arigo2020social, ). For this reason, in part due to this range of possible outcomes, the current approach used by most (if not all) commercially available digital PA interventions does not address these known individual differences and hence is inadequate (arigo2020social, ).
A small number of research prototypes have attempted to personalize social comparison. Mollee and Klein (mollee2016effectiveness, ) used a self-reported social comparison preference to adapt users’ comparison targets, where they found that their approach was more effective than generic exposure. Klein et al.’s (klein2017active2gether, ) Active2Gether system, a personalized m-health intervention, had built-in social comparison at both individual and group levels. Similar to Mollee and Klein (mollee2016effectiveness, ), Active2Gether asked a user’s preferred comparison direction in an intake questionnaire and showed the user six comparison targets in their preferred direction.
Our project extends existing literature by automatically detecting users’ social comparison preferences based on user behavior without only relying on self-report, which may be incomplete with respect to how well preference relates to desired behavior change. Our approach can be complementary to the self-assessment-based work. Additionally, instead of only considering users’ preference of comparison direction as in previous studies (mollee2016effectiveness, ; klein2017active2gether, ), our approach also takes into account users’ social comparison reactions by monitoring changes in their PA and their motivation to exercise.
3. Designing A Social Comparison-Based Personalization Platform
To investigate how to personalize social comparison for PA, we designed a web-based platform in which users can compare themselves, including their daily steps, with other users’ PA-related profiles. The user’s steps are captured by Fitbit and synced automatically with our platform. We use the AI technique of multi-armed bandits to model individual users’ social comparison preferences and adapt the comparison targets shown to them. We selected steps as the indicator for PA because a person’s daily step count is a widely recognizable and intuitive variable, and it is therefore likely to appeal to a large subset of the general population. We did not include other PA-related measures such as the intensity of PA, because the most recent evidence suggests any type of PA for any length of time has benefits (jakicic2019association, ), which is now reflected in the national guidelines for PA (piercy2018physical, , pp.110). Future studies can examine effects on parameters such as sedentary time, moderate-to-vigorous intensity activity, and other biometric measures.
3.1. Interaction with User Profiles
In this work, we used artificially generated user profiles to easily manipulate social comparison conditions. However, the principles of our design can be generalized to real users when used in fitness apps with a social network such as in many commercially available apps and research prototypes (king2013harnessing, ; klein2017active2gether, ). A user’s interaction with the web app consists of the following three steps.
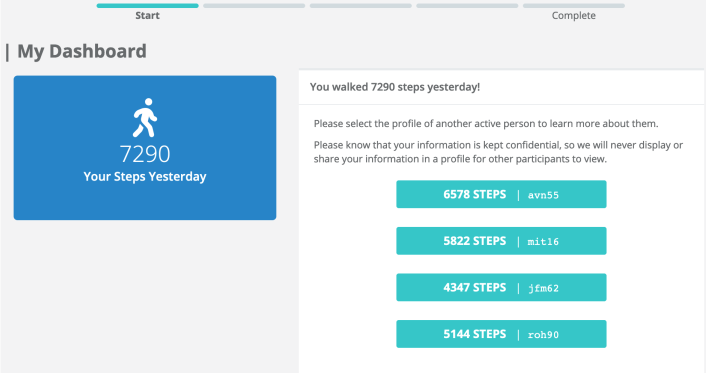
User Profile Selection. Each day when a user logs in, the app displays the user’s daily step from the previous day (automatically retrieved from the user’s Fitbit account) and four new user profiles consisting of those profiles’ respective non-descriptive user names (e.g., “azb30”) and total steps. We purposefully designed this User Profile Selection page with minimal information so that the user could focus on a single dimension for social comparison: the previous day’s total steps. The user will see different user profiles every day, all of which are generated by artificial intelligence (AI) (details in Section 3.2). The user is informed that she can preview all profiles but only review one full user profile each day. This design follows established selection methods in social comparison literature (wood1996social, ; arigo2014social, ; gerber2018social, ). It also intends to provide information about participants’ decision-making about the choice (e.g., how many profiles were selected before the final, full profile was chosen) while minimizing the time burden of daily participation.
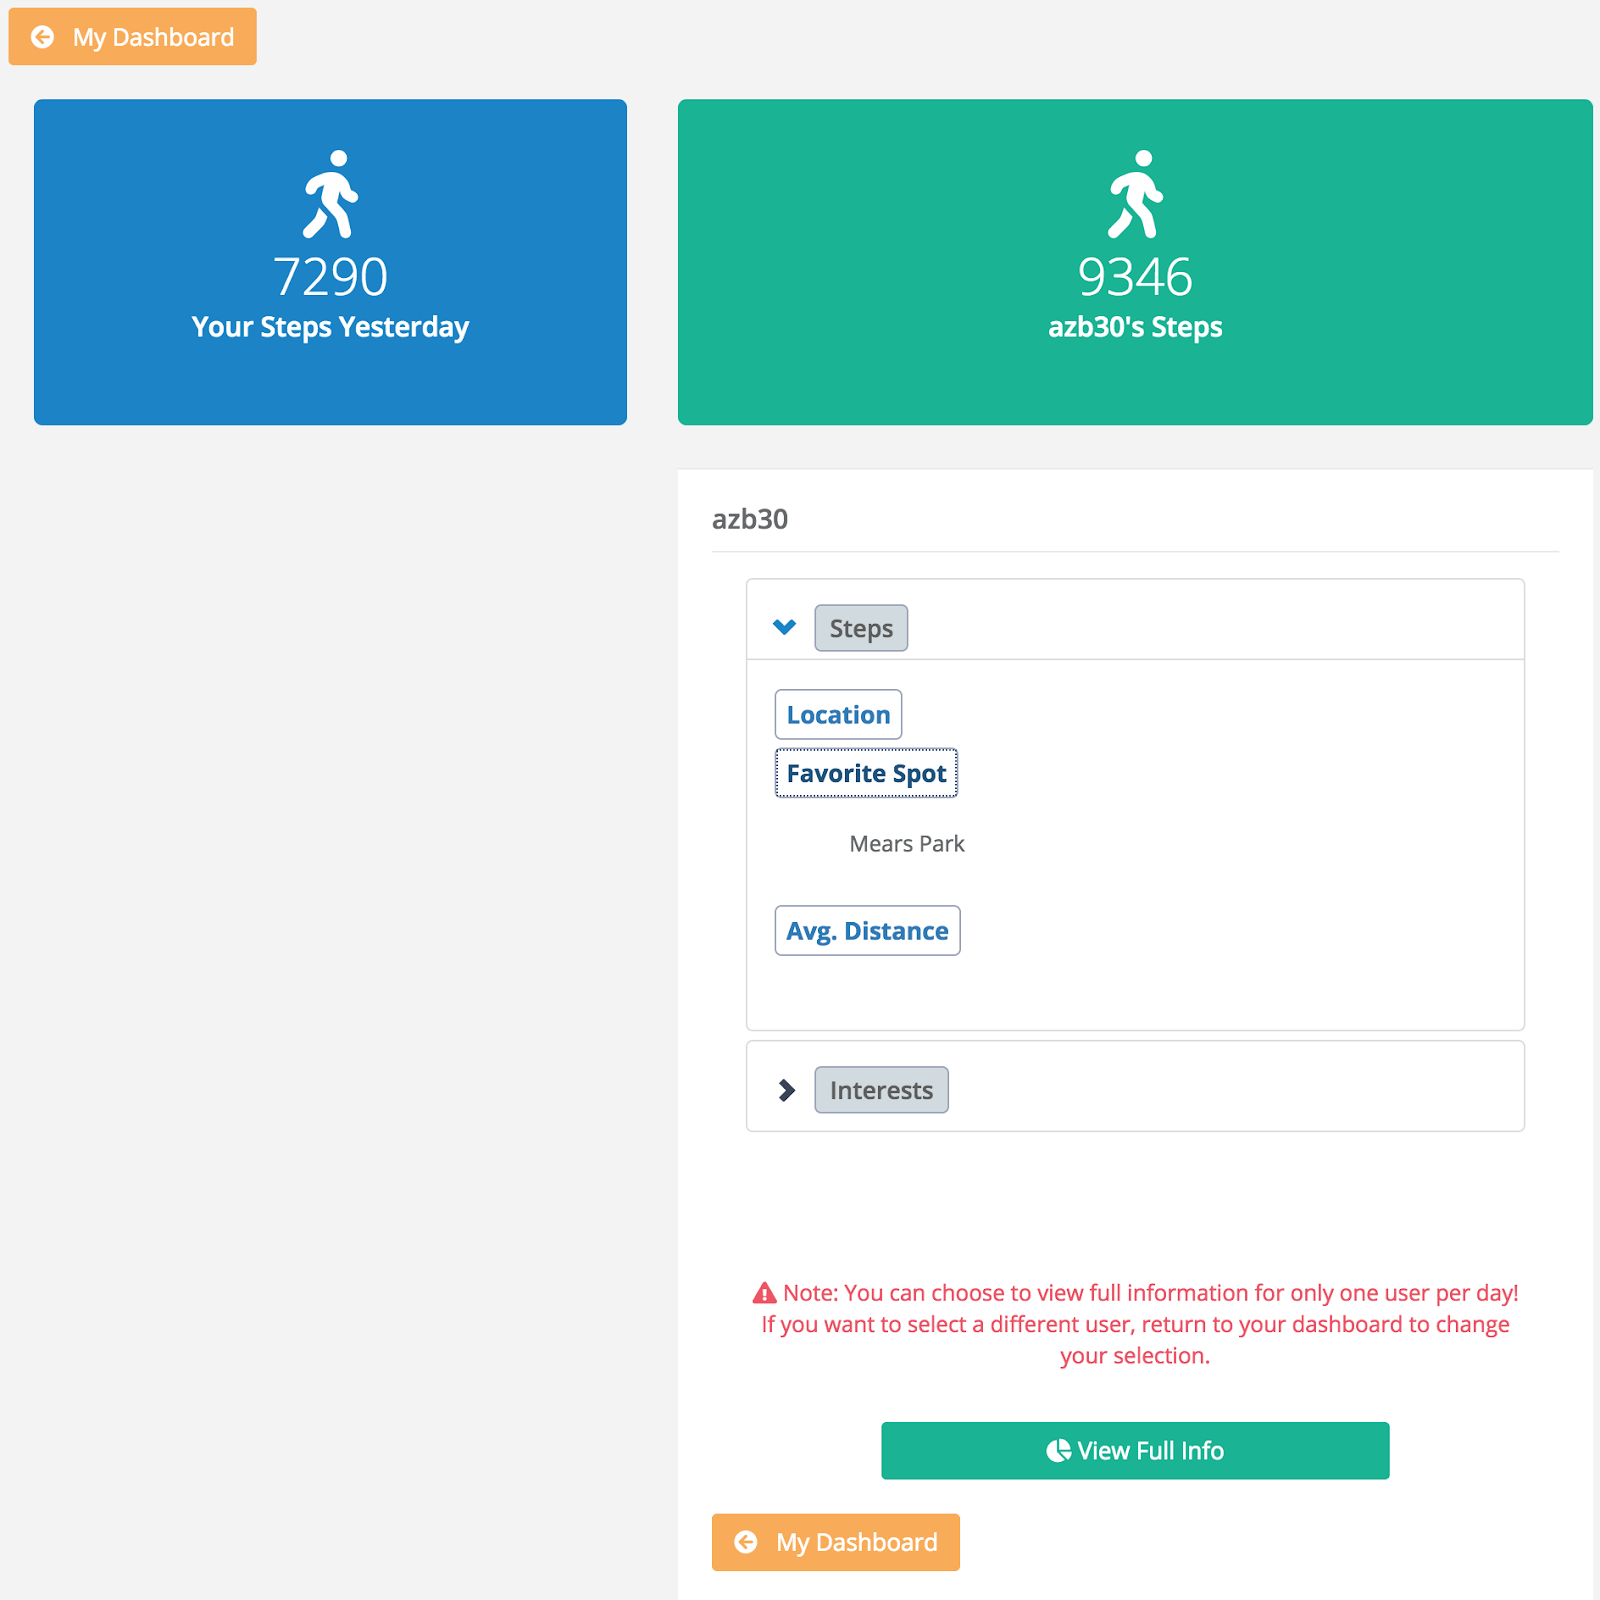
Selection Overview. After selecting a user profile in the previous step, the user will see an overview of the selection (Fig. 2). This page displays two key categories of user information: steps and interests. Notice that the user must click on the drop-down menu of each category to see more information (See the expanded “Steps” menu in Fig. 2). We deliberately require multiple clicks for the user to unlock information to track which information, if any, the user is paying attention to. The user is reminded that she can only view one full user profile a day. The user may return to the previous Selection Overview page for the overview of different profiles.
Full Profile. After the user confirms her selection, she is given more detailed information about the selected user profile. The Full Profile reveals further information such as demographic data (e.g., age, sex, profession), health information (height, weight), exercise preferences (average time spent at the gym, preferred physical activities), and other personal information (hobbies).
A key design decision was to remove design elements that may influence users’ social comparison processes. Notice that we did not rank users based on their daily steps (Fig. 1), which is a design feature used in related work (mollee2016effectiveness, ; klein2017active2gether, ). We also refrained from setting step goals. This is because constructs such as competition, goals, and winning may create incentives for upward comparison and thereby skew users’ innate social comparison preference. We will discuss the implications of this decision below.
3.2. Personalization Mechanism
Our app personalizes users’ social comparison targets by automatically modifying the user profiles presented to them on a daily basis. In particular, our AI 1) models each user’s social comparison preference (i.e., upward or downward) and 2) adapts the steps of the user profiles shown to the user accordingly. Below we describe the personalization mechanism we designed at a high level. We build on the technical foundations described in recent work (gray2020player, ; gray2020cog, ).
We used the AI technique of multi-armed bandits (MABs) (Auer2002, ; kuleshov2000, ; lattimore2018bandit, ) to model users’ social comparison preference and to personalize the user profile options. Multi-armed bandits are useful to model situations in which a system needs to repeatedly choose one among a series of options trying to find the one that gives it the maximum reward. Each time the system selects one option, a reward is observed, and over time, the system learns which of the options achieves the highest expected reward. Various AI techniques have been used for user modeling, such as sequential machine learning (valls2015exploring, ) and supervised learning (kantharaju2019tracing, ). In our case, two factors make MABs particularly suitable. First, we cannot assume that participants in real-world conditions will have consistent behavior; the same person may not choose the same comparison target each time, even given identical profiles. Second, to discover the best selection of social comparison targets (user profiles), showing users other potentially worse options is necessary. This is commonly known as the exploration/exploitation dilemma. Solving this exploration/exploitation dilemma under uncertainty is precisely the problem that MAB strategies were designed to solve (Auer2002, ). MABs lie at the core of other AI techniques such as Reinforcement Learning and Monte Carlo Tree Search. Given the amount of data we anticipated to collect from our study, we chose to use the core implementation of MAB strategies, which can be seen as Reinforcement Learning with a single state.
When a user logs in to our app, the AI chooses one among three options—called an MAB “arm”—to model the user’s social comparison preference: Downward, Mixed, and Upward. Depending on which arm the AI selects, four different user profiles will be shown to the user. In the literature, AI techniques have been developed to modify or generate text-based digital content (zhu2010story, ; zhu2010towards, ). In our system, the user models (e.g., a selected MAB arm) modifies the social comparison targets a user will be exposed to. According to Buunk’s theory (buunk1995comparison, ), social comparison targets may be perceived as only slightly better/worse off than the self, moderately better/worse off, or extremely better/worse off, with variations in between (buunk1995comparison, ). We thus designed the generation of step counts for artificial user profiles relative to the user’s performance accordingly (Table 1). For example, if the Downward arm is selected by the AI, the four profiles shown will all have lower daily step counts than the user, respectively showing 40%, 30%, 20%, and 10% fewer, with a random factor (within 2%) applied for obfuscation, and displayed in random order.
The reward function used by the MAB algorithm to adjust itself is an equal combination of the changes in user’s self-reported motivation for exercise before and after using the app (see Section 4) as well as her total steps during that day. Based on the previous days’ rewards, the MAB algorithm determines which arm will most likely maximize this reward for the current day. In other words, in our work the AI learns which types of social comparison targets, instantiated through user profiles, are more likely to motivate a specific player to engage in PA. It is important to note that our AI does not encode any domain knowledge. For instance, consistent with existing literature on social comparison-based interventions (mollee2016effectiveness, ; klein2017active2gether, ; o2009upward, ; mahler2010effects, ; leahey2007frequency, ), we assume a person prefers either the “upward” or “downward” direction. However, our AI does not know, for example, that the Mixed arm is an intermediate option for when this preference is uncertain, nor does it bias towards any one of the three arms.
It is conventional to consider a person is either an “upward” or “downward” comparer, where existing psychological research assumes that people fare better with one or the other or have stable preferences. Our MAB-based user model follows this practice and performs adaptation based on this assumption. In the meantime, data we collect from this study can help to determine whether there was enough consistency in response to one versus the other to categorize each person and then test that assumption.
| Profile Steps in relation to A Participant’s Steps | ||||
| Arm- | Profile 1 | Profile 2 | Profile 3 | Profile 4 |
| Downward | ||||
| Mixed | ||||
| Upward | ||||
4. Methods
To evaluate our approach of automatic personalization of social comparison, we designed a user study to test the following hypotheses:
-
•
H1: Our MAB-based personalization mechanism is able to detect users’ social comparison preference.
-
•
H2: Participants exposed to personalized social comparison will take more steps per day than those exposed to randomized social comparison.
-
•
H3: Participants exposed to personalized social comparison will report greater increase in PA motivation than those exposed to randomized social comparison.
We recruited from a major university in the Mid-Atlantic area of the U.S. Healthy adults who had access to a Fitbit health tracker or a Fitbit-compatible smart phone were eligible if they reported PA as being somewhat or very important to them. Participants were compensated with extra course credits or gift cards at the end of the study.
4.1. Procedure
At the start of the study, participants provided demographic information and completed the following baseline self-report measures. We used the Iowa-Netherlands Comparison Orientation Measure-23 (INCOM-23) (gibbons1999individual, ) to assess baseline social comparison tendency, which includes a 6-item upward comparison scale (baseline upward score), a 6-item downward comparison scale (baseline downward score), and an 11-item composite scale assessing general tendency towards comparison (baseline composite score). All scales have shown strong psychometric properties in previous work (gibbons1999individual, ). Individuals are asked to rate how much they agree with statements describing their tendencies to make comparisons to others in various social contexts on a Likert scale (1=I strongly disagree, 5=I strongly agree). Items on the INCOM-23 include: “I am not the type of person who compares often with others,” and, “I often compare how I am doing socially (e.g., social skills, popularity) with other people.” This data was used purely for post-analysis and was not used by the AI. Since social comparison is sensitive to social contexts, we followed the convention of related studies and masked the nature of our study by collecting unrelated data (e.g., personality test).
After the baseline questionnaire, participants were asked to use our app and complete a daily survey once per day for 21 days over the course of 28 consecutive days. The daily survey asked the participants to rate their “current motivation to exercise” before and after their exposure to social comparison through selecting a full user profile. Responses were rated on a 5-point Likert scale (1=very low, 5=very high). Participants were randomized to either a control group or an experimental group using a clustered assignment to control for gender (suresh2011overview, ). In the rest of the paper, the days are numbered based on the days when data is recorded, not calendar days.
Between Day 1 to Day 9 (i.e., the baseline period), the AI randomly selects one of the three arms with a uniform distribution (three times each), providing all participants in both groups the same exposure to all social comparison targets. Between Day 10 and Day 21, the control group continued viewing randomly varying profiles. The experimental group was exposed to profiles with step counts that were personalized using the AI mechanism described above. At the end of the study, the participants completed an exit survey that collected data regarding what they found particularly valuable, whether they felt any information was missing, and their general impression.
Of note, while other psychometrically validated measures exist to assess motivation (e.g., the Treatment Self-Regulation Questionnaire (levesque2007validating, )), such measures are designed to assess stable traits rather than time-dependent or momentary states within an individual. Moreover, such measures rely on retrospective recall of an individual’s general tendencies, which is highly prone to bias and error. In order to assess within-person changes over time with high ecological validity (consistent with the behavioral science literature (shiffman2008ecological, )), the above-mentioned method to collect in-the-moment motivation data was selected.
4.2. Data Analysis
We used inferential statistics to analyze our quantitative data. Initial statistic analyses were performed to analyze steps and motivation changes. Because preliminary analyses showed that gender, racial identification, and age were all associated with steps per day, these characteristics were included as covariates. Average steps per day prior to introducing the personalized intervention was also included as a covariate in all analyses of step counts. Effect sizes are expressed as percent stability versus variability (target selection), semi-partial correlation coefficients (motivation for PA), and estimated step count differences between conditions. Differences between MAB assignments and both changes in motivation and daily steps were evaluated using two-level multilevel models with restricted maximum likelihood estimation (SAS 9.4), with days (level 1) nested within individuals (level 2). Days with ¡100 steps recorded were considered Fitbit non-wear days and were excluded from step count analyses (n=21). Stability versus variability in selection (within-person) was evaluated using intraclass correlation coefficients (ICCs) and comparison of ICCs between conditions.
Qualitative feedback in the exit survey was coded by two independent researchers, who used grounded theory to identify themes and independently code the full dataset. They then discussed disagreements and modified their codes until they reached the inter-rater reliability of 100%.
5. Results
The study enrolled 53 participants (23 male and 30 female) who were primarily Caucasian (52.8%; Asian: 24.5%; Multiracial: 9.4%; African American: 7.5%; American Indian/Native Alaskan: 1.9%; other: 3.8%), with a mean age of 22.45 years (SD=7.40). Data from five participants were removed due to the lack of data points (¡ 14 days of completing the daily sessions). Of the remaining 48 participants, 25 (11 male and 14 female; mean age=21.80 years (SD=7.33)) were in the control condition and 23 (10 male and 13 female; mean age=23.74 (SD=8.18)) in the experimental condition.
5.1. H1: The MAB-based personalization mechanism is able to detect users’ social comparison preference.
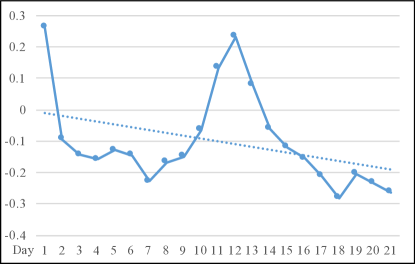
We measured the correlation between our AI’s predictions of individual users’ comparison preference (indicated by which MAB arm was selected by the AI) and the users’ self-report comparison preference (measured by their baseline upward score minus baseline downward score in the INCOM-23 instrument (gibbons1999individual, )). Figure 3 shows the Pearson correlation coefficient (vertical axis) between the two measures throughout the 21 days (horizontal axis) for the experimental group. When calculating the correlation coefficients, pairs of data points for which we had no data (e.g., if the user did not log in that day), were ignored. Given that the AI chooses MAB arms randomly in the first 9 days, we expected the correlation to be very low (close to 0) during this case. This was consistent with Figure 3. After day 9, we expected the correlation to increase towards positive 1, as the AI learned each user’s comparison preference. What we observe, however, is the opposite — the correlation grows negative. This means that the AI learned to give users the opposite of their self-report preference measured by INCOM-23.
To further investigate this result, we looked into the correlation between which comparison targets participants chose and their self-report comparison preference. For this purpose, we used the control group, who were not exposed to the AI intervention, and examined their comparison target choices when they were randomly assigned the Mixed arm (this is the only arm where participants were given the options to compare upward and downward) (Table 1). We calculated the Pearson correlation coefficient between the control groups’ self-report comparison preference (baseline upward score minus baseline downward score) and their daily target selection (-20%, -10%, 10%, or 20%). Our result has shown a close-to-zero Pearson correlation (-0.0554), indicating that INCOM-23 scores do not correlate to this group of participants’ target selection.
We also calcuated the stability of participants’ target selection. In both conditions, the intraclass correlation coefficient (ICC) for target selection before introducing the AI intervention was 0.00, indicating no person-level consistency in selection (100% within-person variability between days, plus error). After the introduction of the AI intervention, however, the ICC rose to 36% in the experimental condition versus 9% in the control condition. Thus, stability in target selection was greater in the experimental condition after the introduction of the AI intervention ( = 8.20, p = 0.02). This means that the AI constrained participants’ selection options to a narrower range than random assignment.
5.2. H2: Participants exposed to personalized social comparison will take more steps per day than those exposed to randomized social comparison.
Average step counts per day by condition and MAB configuration appear in Table 2. A modest average decrease in steps was observed across both conditions when aggregating pre- and post-intervention steps. This trend was consistent with previous research on mobile health interventions that do not contain explicit PA goals, in which novelty effects and increased awareness of one’s PA may influence behavior at baseline, prior to habituation (shin2019beyond, ).
We can see some interesting patterns after the introduction of the AI. For example, when comparing the average step count of participants that were given Arm-Downward between days 1-9 and days 10-21, we see that participants in the control group went from 6869 steps on average to 6234 (a decline of 635). In contrast, the participants in the experimental condition changed from 5987 to 5722 (a decline of only 265). The same trend can be observed for the other arms. For Arm-Mixed, the control group shows a decline of 615 steps, while the experimental group shows an increase of 195 steps. For Arm-Up, the control group decreases in 1000 steps, while the experimental group only dropped 150. Fig. 4 visualizes the changes between average steps in Table 2. The solid lines represent the trend in average steps in the control group observed for Downward/Mixed/Upward respectively, while the dashed lines correspond to those seen in the experimental group. As the plot shows, the introduction of the AI visibly altered the downward trend seen in the control group.
However, between the two conditions, we did not observe any statistical difference in their steps during intervention period. While the interaction of condition and MAB assignment was non-significant, we found an interesting pattern of daily steps between conditions and MAB arm assignment. During intervention period, those who received the MAB upward arm in the experimental condition took an appreciably larger number of steps per day than those who were randomly assigned the same MAB upward arm in control. The pattern reversed with downward arm assignment, where control group participants who received this assignment took more steps per day than those in the experimental group.
| Pre-Intervention (Days 1-9) | During Intervention (Days 10-21) | |||||||
| Arm | Control | Experimental | Control | Experimental | ||||
| n | S | n | S | n | S | n | S | |
| Downward | 73 | 6869 (SE=767) | 69 | 5987 (SE=714) | 91 | 6234 (SE=549) | 100 | 5722 (SE=552) |
| Mixed | 75 | 6345 (SE=765) | 69 | 5717 (SE=714) | 79 | 5730 (SE=571) | 13 | 5912 (SE=588) |
| Upward | 74 | 6643 (SE=767) | 67 | 6238 (SE=717) | 98 | 5643 (SE=548) | 109 | 6088 (SE=492) |
| Total | 222 | 6617 | 205 | 5978 | 268 | 5869 | 222 | 5913 |

5.3. H3: Participants exposed to personalized social comparison will report greater increase in PA motivation than those exposed to randomized social comparison.
Table 3 summarizes the differences in participants’ motivation to exercise between pre- and post-selection. The bottom two lines of the table show the average motivation for the control and experimental group. While the change in motivation in the control group was just 0.0194, the experimental group reported a larger change in motivation of 0.1456. This difference was found to be statistically significant using a t-test ().
However, when we considered the demographic differences, the difference between conditions is less significant. Controlling for gender, racial identification, and age, motivation for PA across the AI-based personalization intervention period increased from pre- to post-selection in the experimental condition (B = 0.08, SE = 0.11). In contrast, motivation decreased symmetrically in the control condition (B = -0.08, SE = 0.12). Across condition and MAB assignments, change in motivation was most positive among participants in the experimental condition when assigned Arm-Mixed (mix of targets). Although the difference in motivation change between conditions did not reach statistical significance (F = 1.85, p = 0.17), it was associated with a small-to-moderate effect size (sr = 0.20) in favor of the experimental condition.
| Least Squares Means | |||
| Condition | MAB Assign. | Motivation | Std. Err. |
| Control | Arm-Downward | 0.0071 | 0.1268 |
| Control | Arm-Mixed | -0.1189 | 0.1315 |
| Control | Arm-Upward | -0.1117 | 0.1258 |
| Experimental | Arm-Downward | 0.1013 | 0.1267 |
| Experimental | Arm-Mixed | 0.3099 | 0.2216 |
| Experimental | Arm-Upward | 0.0395 | 0.1134 |
| Overall Means | |||
| Control | - | 0.0194 | 0.0201 |
| Experimental | - | 0.1456 | 0.0400 |
5.4. Qualitative Results
Post-study survey responses were provided by 40 out of 53 participants. Qualitative feedback was coded into 22 distinct themes that arose related to profile features that participants found to be either “particularly valuable or interesting” or “missing” from the website. Overall, the tone of the qualitative feedback suggested that participants believed the profiles belonged to real people and that they valued the information provided.
When asked to describe features of the profiles that they found most valuable or interesting, participants identified the profiles’ step counts (35%), occupations (35%), and hobbies (25%) to be most interesting to examine. For example, one participant wrote that they were most interested in the profiles’ “occupation and hobbies/interests. It was interesting to put the number of steps into perspective.”
A minority of participants (35%) explicitly acknowledged that they performed social comparison. They had compared themselves to the artificial user profiles regarding users’ interests (10%), exercise routines (10%), and steps (10%). One participant wrote: “I found that looking at… the interests was valuable as well, since it helps you compare yourself to the other people and see how maybe someone similar to you works out.” Still, others (5%) reported having made explicit comparisons to the artificial users’ demographic data and physical characteristics. “It was most helpful to look at people in a similar demographic as me (sex, age, and weight wise).”
When asked to describe features of the profiles that were missing, many (20%) reported that they would have liked to see more detailed information regarding specific exercise routines. For example, one participant wrote: “When it comes to exercise, it would have been interesting to see how different people work out and what they specifically do for fitness.” Others noted they would have liked to know more about physical characteristics (e.g., weight history, 7.5%) and psychological well being (e.g., mood, stress, 12.5%) in the user profile.
6. Discussions
This section provides our interpretation of the results and discusses the design implications of social comparison-based features in fitness apps.
6.1. Automatic Model of Individuals’ Social Comparison Preference
-
•
H1: The MAB-based personalization mechanism is able to detect users’ social comparison preference.
Overall, we observed some evidence that our AI-based personalization mechanism was able to model users’ social comparison preferences. First, following existing literature, we assume that a user’s social comparison preference is either upward or downward. This domain knowledge is not encoded in the AI. As shown in Table 2, there is a significant drop in the number of times the AI chose the Arm-Mixed option in the experimental group, an option that indicates the AI’s uncertainty. This indicates that the AI was able to converge on either Arm-Downward or Arm-Upward and differentiate participants based on their daily data. The stability in participants’ comparison target selection, measured by the intraclass correlation coefficients (ICCs), increased more in the experimental condition than in the control condition. In addition, participants’ target selections increasingly aligned with their MAB assignment. However, this is not conclusive evidence, since this phenomenon may be partially caused by the narrowing effect of the AI algorithm to provide social comparison targets of the same direction.
A main source of challenge to test H1 is related to measuring participants’ self-report social comparison preference using the INCOM-23 instrument. We did not observe correlation between participants’ INCOM-23 scores, their actual target selections, and the AI algorithm’s MAB arm assignment (which is the user model of one’s social comparison preference).
This could be the result of several factors. First, participants may be selecting comparison targets not only based on their steps but also on other factors. Although we purposefully designed the first two selection pages of our app to focus primarily on step information and minimize demographic information (e.g., using non-descriptive user names such as “azb30”), it is possible some participants chose comparison targets also based on the other available information in the Overview Page (exercise location, favorite spots, average distance, or interest). However, our qualitative results indicate that this influence is limited. To the question of which user profile information was the most valuable or interesting, 60% of the participants reported occupations or hobbies compared to 35% who said step counts. However, users can only access the occupation or hobby data after making their final selection of user profiles. Furthermore, although our log files show that 81.13% of the participants selected more than one profile to preview in at least one daily session, only 12.07% of the total sessions involved participants previewing more than one profile. For both conditions, most of these sessions (68.00% for the control group and 76.74% for experimental) happened in the first 9 days, when the app was novel. This suggests that while different demographic information was meaningful to the participants, it did not substantially impact how the participants selected their comparison targets. In the majority of the sessions, the participants chose their comparison targets outright, primarily based on step count information.
Second, an individual’s social comparison tendency may have more variability than existing literature suggests. Only recently has the potential variability of social comparison preference and response received considerable attention (arigo2019methods, ). Given that the preponderance of literature treats social comparison as a stable individual difference, our MAB-based AI model makes the same assumption so that we can make progress on personalization technology and design. In addition, our choice of an MAB-based approach enabled our AI to robustly handle some variability in users’ behavior and pick up the overarching trend. It is possible that our web app was able to pick up the daily variances over the course of the intervention, while the INCOM-23 survey only measured participants’ overall tendencies once at the beginning of the study. It is likely that the INCOM picks up participants’ perceptions of their preferences and behavior in aggregate. Furthermore, this self-report is likely infused with social desirability biases and misrecollection to a degree that actual social comparison behavior is not. In the meantime, we designed our personalization system for repeated exposure (i.e., 9 times/days), rather than assessing preference/response on one occasion as in previous work (mollee2016effectiveness, ). This is a step toward addressing this variability. Our findings indicate that some participants had varying responses and thus contribute new evidence to psychological research on social comparison, the foundation of many social comparison-based features in social applications.
6.2. Personalized Social Comparison and PA Changes
-
•
H2: Participants exposed to personalized social comparison will take more steps per day than those exposed to randomized social comparison.
We observed an overall decrease in the number of steps from days 1-9 to days 10-21, which is not unexpected given the nature of this sample. Individuals who had a casual interest in physical activity were not necessarily strongly motivated to increase their activity levels. In terms of the effect of condition, we observed that participants in the control group had a steep decline in steps from 1-9 to 10-21, while participants in the experimental condition experienced a smaller decline (Figure 4); however, the effect of condition did not reach statistical significance.
If a need for self-enhancement drove a participant’s comparisons, that participant may have chosen targets of comparison that would aid them in “protecting or enhancing [their] self-esteem,” for which downward comparisons are likely more effective (Wood1989, ). We might, therefore, expect effective downward comparisons to result not in higher performance, but rather increased positive affect (arigo2019methods, ). While the present study did not measure participant affect following completion of daily sessions, we did gather a self-reported measure of motivation, which exhibited an increase in the Arm-Downward participants that is more than three times greater than that in the Arm-Upward participants. Future research in this area should consider evaluating momentary affective or emotional responses following social comparison in order to empirically evaluate this question.
-
•
H3: Participants exposed to personalized social comparison will report greater increase in PA motivation than those exposed to randomized social comparison.
With respect to the daily change in motivation, participants’ motivation increased among those in the experimental group and decreased within the control group. While we observed some indications of difference between conditions, after controlling for gender, race, and age, the difference between control and experimental conditions was not statistically significant. However, these differential outcomes by condition, along with the small-to-moderate effect sizes observed, indicate that there was a positive effect of the AI personalization on motivation.
Moreover, the biggest effect was seen in the assignment to Arm-Mixed within the experimental group, for which there were far fewer observations, and in which randomly selected targets were displayed rather than targets tailored to match participants’ social comparison preferences. Improved motivation in Arm-Mixed may have been observed because participants were able to explore a wider array of targets beyond those solely matching their preferences, which could have ignited greater interest in differentiating between targets to find the option most aligned with their preference. This is consistent with previous work showing that individuals exposed to a range of comparison targets explore several different types of targets but spend considerable time reviewing information about a smaller subset (van2000social, ).
Qualitative findings indicate that participants largely found the information contained in the user profiles to be valuable. While participants did not directly report on the impact of their interest in the profiles on their motivation for PA, several participants described features that led them to make social comparisons. Among the participants who explicitly acknowledged that they performed social comparison, they were evenly split between upward and downward comparers according to our MAB user model. This suggests that both types of participants were engaged with their comparison targets provided by the app, which is the requirement for activating the psychological process of social comparison.
In summary, the results of the present study indicate that our AI-based personalization approach was able to automatically model and manipulate social comparison in the pursuit of PA promotion. Although methodological limitations (described below) preclude a definitive conclusion that the intervention successfully motivated PA, the detected effects achieved small-to-moderate effect sizes, illustrating the real-world implications of the intervention for enhancing motivation and daily steps. Moreover, results from our qualitative analyses suggest that participants valued and applied the information provided in the profiles to make social comparisons. These findings suggest that future work, which can incorporate the present methodology into engaging modalities such as online games and social networks, may be able to harness the effects of AI-based personalization to enhance motivation and PA.
6.3. Design Implications
Since social comparison is frequently used in m-health apps for PA and in social media applications, we summarize the following key design lessons we learned in this project.
First, the relatability of social comparison targets is critical. In our UI/UX design, we developed a large number of artificial user profiles and made efforts to ensure all content was realistic and varied across profiles. Our qualitative analysis showed how participants engaged with user profiles they can relate to. Participants found it “more helpful” to compare themselves with people who were “in similar demographic” and see how “… someone similar to you works out.” This suggests that when designing social comparison features, independent from comparison direction, it is beneficial to provide users with comparison targets they can relate to. In addition to targets with similar demographics, another known phenomenon is that users of social m-health apps relate more closely to people with whom they have a positive prior relationship (e.g., friendship and peer relation) (salvy2009effect, ; fitzgerald2012peers, ; caro2018understanding, ).
Second, it is important to balance the system’s need for data collection and usability. Building an accurate real-time user model of social comparison requires collecting relevant data. As users interact with a web app, it can be difficult to track which information on the page they are paying attention to. To solve this, we purposefully designed our UI to require more steps in user interaction. For instance, modern web UI/UX design may streamline all user profile information we provide into a single page; however, doing so will significantly reduce the app’s ability to capture important user behavior that can be used to indicate the user’s attention. Given the special data-gathering requirement of AI-based personalization systems, we recommend designers re-evaluate the balance between usability requirements (e.g., efficiency) and data-gathering based on the specifics of their projects.
Third, perhaps the most important, further research is needed on the personalization paradox (zhu2020Personalization, ). We will discuss this in the following section.
6.4. Personalization Paradox
Jarno Koponen was the first to coin the phrase “personalization paradox.” In a 2015 TechCrunch article,333Retrieved from https://techcrunch.com/2015/06/25/the-future-of-algorithmic-personalization/, Oct 1, 2020. he wrote
“[There] lies a more general paradox at the very heart of personalization. Personalization promises to modify your digital experience based on your personal interests and preferences. Simultaneously, personalization is used to shape you, to influence you and guide your everyday choices and actions. Inaccessible and incomprehensible algorithms make autonomous decisions on your behalf. They reduce the amount of visible choices, thus restricting your personal agency.”
While it is an insightful observation, the discussion around the personalization paradox has so far remained abstract. Reflecting on our work above, we further argue that the personalization paradox is a result of the fundamental conflict between user modeling and adaptation. Below are the two main ways they can be at odds with each other (notice these are related and are not mutually exclusive):
-
(1)
The Self-Reinforcing Loops Problem happens when a personalization system “forces” a user into what its user model categorizes, regardless of whether the model is accurate. This self-reinforcing nature of personalization technology has been documented by other researchers (o2016weapons, ; noble2018algorithms, ; pariser2011filter, ). For instance, imagine the Netflix’s user model inaccurately predicts a specific user’s preference to be only Sci-fi based on her viewing history and thus only recommends Sci-fi content. Since the user can only express her preference through the digital environment controlled by the personalization algorithm, she is more likely to further display Sci-fi preference due to the lack of other choices. In this way, the adaptation reinforces its user model without a chance to adjust the latter.
-
(2)
The Moving Target Problem happens when the user changes with the digital environment she is in. Continuing the above example, let us assume that the user model correctly categorized a user’s preference to Sci-fi when she is in the “neutral” viewing environment with a wide range of different genres. However, when adaptation modifies this context into a Sci-fi-heavy one, the user’s preference may change to, say, documentary. This case is the closest to Kopenen’s description above — by changing the users’ digital environment through adaptation, users’ preferences and behavior become a moving target for modeling. A special case of this problem occurs when the goal of the personalization system is to induce behavior change. In this situation, the system’s explicit goal is to push the user’s preferences or behavior in a particular direction. As a result, user modeling might reflect the user at the start rather than what she has become.
Reflecting on our project, we attempted to minimize the self-reinforcing loops problem by including the Mixed arm in our MAB algorithm and thus allowed users to choose upward or downward profiles. However, this does not completely address the problem. Self-reinforcing loops could occur if the MAB is inaccurate but very confident. In these cases, the user would be given either all Upward or Downward arms, leaving no opportunity for her to express a different preference. A potential solution to address this problem is for the MAB algorithm to force explore (e.g., always use the Mixed arm) every once a while.
Our attempt to minimize the moving target problem was also met with mixed success. It is unclear whether being more physically active impacts one’s comparison tendency (e.g., upward). For instance, when a user increases her PA, will she compare upward more often? Currently, psychology literature does not have a definitive answer. If so, the moving target problem of the changing user in our case may be exacerbated by the targeted behavior change in addition to the adapted digital environment. In order to mitigate this risk, we designed the system to be as neutral as possible; for instance, we intentionally left out the design elements (e.g., competition) which are known to increase engagement and PA but risk pushing users toward upward comparison and penalizing downward comparison. However, this may have significantly reduced the app’s ability to motivate changes in PA. Conversely, if we had decided to incorporate features known to motivate PA effectively, we risk skewing users’ preferences and thus jeopardizing the accuracy of the user model.
To mitigate the personalization paradox, we believe that a project’s first step is for the AI engineers/data scientists and designers/behavioral scientists to have an open conversation about the priorities of the project. In our case, for example, given the lack of work in this area, prioritizing model accuracy was appropriate. Another approach is to further separate the user modeling and adaptation stages of personalization. For example, our system initially remained neutral to collect accurate user data on social comparison tendencies. Once it had a robust model, it could then unlock other design features to explicitly motivate PA. However, more research is needed to see if users’ social comparison tendencies in a neutral environment can be transferred into a different context with new features that may reward upward comparison. As this research matures, we may want to strike a different balance to have stronger behavioral outcomes. As personalization becomes increasingly popular in areas associated with behavior change, such as health and education, further research is needed to balance personalization model accuracy and behavioral change effectiveness.
6.5. Limitations
The present study had a few limitations. First, due to the relatively small sample size, our analyses were underpowered to detect the proposed effects with statistical significance. Results thus must be interpreted with some caution, and further research with larger samples is needed. Second, participants were able to complete sessions on the web application at any time of day during each day of participation. Because their access to the web app was not restricted to a specific, standardized window of time each day, the time of exposure to social comparison targets was not necessarily consistent within or between participants (e.g., mid-morning for one participant vs. late evening for another). As a result, the intervention’s effects on steps may have been spread across days for some individuals, rather than having consistently had impact on the same day, as our analyses assumed. Third, the age range of our participants was relatively narrow, which limits the generalizability of our results to a broader age range. Finally, we made the assumption that users’ social comparison preference is static based on established literature; however, this understanding has started to be challenged in recent work in psychology. Future research is needed to validate this assumption and evaluate whether a dynamic user modeling AI technique would be appropriate.
7. Conclusions and Future Work
In conclusion, we presented our approach to personalize social comparison, the basis of many widely adopted features in both commercially available m-health apps and research prototypes for promoting physical activity. Our work is among the first to investigate how to personalize social comparison automatically for social fitness apps. Results of our user study indicate that our AI-based personalization approach was able to automatically model and manipulate social comparison in the pursuit of PA promotion. The detected effects achieved small-to-moderate effect sizes, illustrating the real-world implications of the intervention for enhancing motivation and daily steps. We also proposed design guidelines for future social comparison-based m-health applications.
As part of our future directions, we plan to evaluate our approach with profiles from real users, especially among users with existing positive social relationships. We also plan to incorporate the present methodology into engaging modalities such as social mobile games to further harness the effects of AI-based social comparison personalization to enhance motivation and physical activity. Last but not least, we intend to investigate how to solve the personalization paradox and make our approach more effective.
8. Acknowledgement
This work is partially supported by the National Science Foundation (NSF) under Grant Number IIS-1816470. The authors would like to thank all past and current members of the project.
References
- (1)
- (2) Elizabeth Aguirre, Dominik Mahr, Dhruv Grewal, Ko de Ruyter, and Martin Wetzels. 2015. Unraveling the personalization paradox: The effect of information collection and trust-building strategies on online advertisement effectiveness. Journal of retailing 91, 1 (2015), 34–49.
- (3) Danielle Arigo, Megan M Brown, Kristen Pasko, and Jerry Suls. 2020. Social Comparison Features in Physical Activity Promotion Apps: Scoping Meta-Review. Journal of Medical Internet Research 22, 3 (2020), e15642.
- (4) Danielle Arigo, Jacqueline A Mogle, Megan M Brown, Kristen Pasko, Laura Travers, Logan Sweeder, and Joshua M Smyth. 2019. Methods to Assess Social Comparison Processes Within Persons in Daily Life: A Scoping Review. Frontiers in Psychology 10 (2019), 2909–2909.
- (5) Danielle Arigo, Leah M Schumacher, Emilie Pinkasavage, and Meghan L Butryn. 2015. Addressing barriers to physical activity among women: A feasibility study using social networking-enabled technology. Digital health 1 (2015), 2055207615583564.
- (6) Danielle Arigo, Jerry M Suls, and Joshua M Smyth. 2014. Social comparisons and chronic illness: research synthesis and clinical implications. Health Psychology Review 8, 2 (2014), 154–214.
- (7) Sonia M Arteaga, Mo Kudeki, Adrienne Woodworth, and Sri Kurniawan. 2010. Mobile system to motivate teenagers’ physical activity. In Proceedings of the 9th international conference on interaction design and children. 1–10.
- (8) Peter Auer, Nicolò Cesa-Bianchi, and Paul Fischer. 2002. Finite-time analysis of the multiarmed bandit problem. Machine Learning 47, 2-3 (May 2002), 235–256.
- (9) Femke TC Bennenbroek, Bram P Buunk, Karen I Van Der Zee, and Brigit Grol. 2002. Social comparison and patient information: what do cancer patients want? Patient Education and Counseling 47, 1 (2002), 5–12.
- (10) Gabriele Bleser, Daniel Steffen, Attila Reiss, Markus Weber, Gustaf Hendeby, and Laetitia Fradet. 2015. Personalized physical activity monitoring using wearable sensors. In Smart health. Springer, 99–124.
- (11) Fiona C Bull, Matthew W Kreuter, and Darcell P Scharff. 1999. Effects of tailored, personalized and general health messages on physical activity. Patient education and counseling 36, 2 (1999), 181–192.
- (12) Fabio Buttussi and Luca Chittaro. 2008. MOPET: A context-aware and user-adaptive wearable system for fitness training. Artificial Intelligence in Medicine 42, 2 (2008), 153–163.
- (13) Bram P Buunk. 1995. Comparison direction and comparison dimension among disabled individuals: Toward a refined conceptualization of social comparison under stress. Personality and Social Psychology Bulletin 21, 4 (1995), 316–330.
- (14) Bram P Buunk and Jan F Ybema. 1997. Social comparisons and occupational stress: The identification-contrast model. Health, coping, and well-being: Perspectives from social comparison theory (1997), 359–388.
- (15) Karina Caro, Yuanyuan Feng, Timothy Day, Evan Freed, Boyd Fox, and Jichen Zhu. 2018. Understanding the effect of existing positive relationships on a social motion-based game for health. In Proceedings of the 12th EAI International Conference on Pervasive Computing Technologies for Healthcare. 77–87.
- (16) David E Conroy, Chih-Hsiang Yang, and Jaclyn P Maher. 2014. Behavior change techniques in top-ranked mobile apps for physical activity. American journal of preventive medicine 46, 6 (2014), 649–652.
- (17) Leon Festinger. 1954. A theory of social comparison processes. Human relations 7, 2 (1954), 117–140.
- (18) Amanda Fitzgerald, Noelle Fitzgerald, and Cian Aherne. 2012. Do peers matter? A review of peer and/or friends’ influence on physical activity among American adolescents. Journal of adolescence 35, 4 (2012), 941–958.
- (19) Evan M Forman, Stephanie G Kerrigan, Meghan L Butryn, Adrienne S Juarascio, Stephanie M Manasse, Santiago Ontañón, Diane H Dallal, Rebecca J Crochiere, and Danielle Moskow. 2019. Can the artificial intelligence technique of reinforcement learning use continuously-monitored digital data to optimize treatment for weight loss? Journal of behavioral medicine 42, 2 (2019), 276–290.
- (20) Anushay Furqan, Chelsea Myers, and Jichen Zhu. 2017. Learnability through adaptive discovery tools in voice user interfaces. In Proceedings of the 2017 CHI Conference Extended Abstracts on Human Factors in Computing Systems. 1617–1623.
- (21) JP Gerber, Ladd Wheeler, and Jerry Suls. 2018. A social comparison theory meta-analysis 60+ years on. Psychological bulletin 144, 2 (2018), 177.
- (22) Frederick X Gibbons and Bram P Buunk. 1999. Individual differences in social comparison: development of a scale of social comparison orientation. Journal of personality and social psychology 76, 1 (1999), 129.
- (23) Daniel T Gilbert, R Brian Giesler, and Kathryn A Morris. 1995. When comparisons arise. Journal of personality and social psychology 69, 2 (1995), 227.
- (24) Robert C Gray, Jichen Zhu, Danielle Arigo, Evan Forman, and Santiago Ontañón. 2020b. Player Modeling via Multi-armed Bandits. In in Proceedings of the 15th International Conference on the Foundations of Digital Games.
- (25) Robert C Gray, Jichen Zhu, and Santiago Ontañón. 2020a. Regression Oracles and Exploration Strategies for Short-Horizon Multi-Armed Bandits. In in Proceedings of the 2020 IEEE Conference on Games (CoG 2020).
- (26) Kristina Höök. 1998. Evaluating the utility and usability of an adaptive hypermedia system. Knowledge-Based Systems 10, 5 (1998), 311–319.
- (27) John M Jakicic, William E Kraus, Kenneth E Powell, Wayne W Campbell, Kathleen F Janz, Richard P Troiano, Kyle Sprow, Andrea Torres, Katrina L Piercy, 2018 Physical Activity Guidelines Advisory Committee, and others. 2019. Association between bout duration of physical activity and health: Systematic review. Medicine and science in sports and exercise 51, 6 (2019), 1213.
- (28) Pavan Kantharaju, Katelyn Alderfer, Jichen Zhu, Bruce Char, Brian Smith, and Santiago Ontanón. 2019. Tracing player knowledge in a parallel programming educational game. In Proceedings of the 15th AAAI Conference on Artificial Intelligence and Interactive Digital Entertainment (AIIDE’19).
- (29) Abby C King, Eric B Hekler, Lauren A Grieco, Sandra J Winter, Jylana L Sheats, Matthew P Buman, Banny Banerjee, Thomas N Robinson, and Jesse Cirimele. 2013. Harnessing different motivational frames via mobile phones to promote daily physical activity and reduce sedentary behavior in aging adults. PloS one 8, 4 (2013).
- (30) Michel CA Klein, Adnan Manzoor, and Julia S Mollee. 2017. Active2Gether: A personalized m-health intervention to encourage physical activity. Sensors 17, 6 (2017), 1436.
- (31) Volodymyr Kuleshov and Doina Precup. 2000. Algorithms for the multi-armed bandit problem. Technical Report. 1–48 pages.
- (32) Tor Lattimore and Csaba Szepesvári. 2018. Bandit algorithms. preprint (2018), 28.
- (33) Tricia M Leahey, Melissa M Crane, Angela Marinilli Pinto, Brad Weinberg, Rajiv Kumar, and Rena R Wing. 2010. Effect of teammates on changes in physical activity in a statewide campaign. Preventive medicine 51, 1 (2010), 45–49.
- (34) Tricia M Leahey, Janis H Crowther, and Kristin D Mickelson. 2007. The frequency, nature, and effects of naturally occurring appearance-focused social comparisons. Behavior Therapy 38, 2 (2007), 132–143.
- (35) Chantal S Levesque, Geoffrey C Williams, Diane Elliot, Michael A Pickering, Bradley Bodenhamer, and Phillip J Finley. 2007. Validating the theoretical structure of the Treatment Self-Regulation Questionnaire (TSRQ) across three different health behaviors. Health education research 22, 5 (2007), 691–702.
- (36) Zakkoyya H Lewis, Elizabeth J Lyons, Jessica M Jarvis, and Jacques Baillargeon. 2015. Using an electronic activity monitor system as an intervention modality: a systematic review. BMC public health 15, 1 (2015), 585.
- (37) Mu Lin, Nicholas D Lane, Mashfiqui Mohammod, Xiaochao Yang, Hong Lu, Giuseppe Cardone, Shahid Ali, Afsaneh Doryab, Ethan Berke, Andrew T Campbell, and others. 2012. BeWell+ multi-dimensional wellbeing monitoring with community-guided user feedback and energy optimization. In Proceedings of the conference on Wireless Health. 1–8.
- (38) Heike IM Mahler, James A Kulik, Meg Gerrard, and Frederick X Gibbons. 2010. Effects of upward and downward social comparison information on the efficacy of an appearance-based sun protection intervention: a randomized, controlled experiment. Journal of Behavioral Medicine 33, 6 (2010), 496–507.
- (39) Gina Merchant, Nadir Weibel, Laura Pina, William G Griswold, James H Fowler, Guadalupe X Ayala, Linda C Gallo, James Hollan, and Kevin Patrick. 2017. Face-to-face and online networks: College students’ experiences in a weight-loss trial. Journal of health communication 22, 1 (2017), 75–83.
- (40) Julia S Mollee and Michel CA Klein. 2016. The effectiveness of upward and downward social comparison of physical activity in an online intervention. In 2016 15th International Conference on Ubiquitous Computing and Communications and 2016 International Symposium on Cyberspace and Security (IUCC-CSS). IEEE, 109–115.
- (41) Safiya Umoja Noble. 2018. Algorithms of oppression: How search engines reinforce racism. nyu Press.
- (42) Ellinor K Olander, Helen Fletcher, Stefanie Williams, Lou Atkinson, Andrew Turner, and David P French. 2013. What are the most effective techniques in changing obese individuals’ physical activity self-efficacy and behaviour: a systematic review and meta-analysis. International Journal of Behavioral Nutrition and Physical Activity 10, 1 (2013), 29.
- (43) Cathy O’neil. 2016. Weapons of math destruction: How big data increases inequality and threatens democracy. Broadway Books.
- (44) Harm op den Akker, Valerie M Jones, and Hermie J Hermens. 2014. Tailoring real-time physical activity coaching systems: a literature survey and model. User modeling and user-adapted interaction 24, 5 (2014), 351–392.
- (45) Kerry S O’Brien, Peter Caputi, Rona Minto, Gregory Peoples, Carlie Hooper, Sally Kell, and Elise Sawley. 2009. Upward and downward physical appearance comparisons: Development of scales and examination of predictive qualities. Body Image 6, 3 (2009), 201–206.
- (46) Pablo Paredes, Ran Gilad-Bachrach, Mary Czerwinski, Asta Roseway, Kael Rowan, and Javier Hernandez. 2014. PopTherapy: Coping with stress through pop-culture. In Proceedings of the 8th International Conference on Pervasive Computing Technologies for Healthcare. ICST (Institute for Computer Sciences, Social-Informatics and …, 109–117.
- (47) Eli Pariser. 2011. The filter bubble: How the new personalized web is changing what we read and how we think. Penguin.
- (48) Juha Pärkkä, Luc Cluitmans, and Miikka Ermes. 2010. Personalization algorithm for real-time activity recognition using PDA, wireless motion bands, and binary decision tree. IEEE Transactions on Information Technology in Biomedicine 14, 5 (2010), 1211–1215.
- (49) Katrina L Piercy, Richard P Troiano, Rachel M Ballard, Susan A Carlson, Janet E Fulton, Deborah A Galuska, Stephanie M George, and Richard D Olson. 2018. The physical activity guidelines for Americans. Jama 320, 19 (2018), 2020–2028.
- (50) Mashfiqui Rabbi, Min Hane Aung, Mi Zhang, and Tanzeem Choudhury. 2015a. MyBehavior: automatic personalized health feedback from user behaviors and preferences using smartphones. In Proceedings of the 2015 ACM International Joint Conference on Pervasive and Ubiquitous Computing. 707–718.
- (51) Mashfiqui Rabbi, Angela Pfammatter, Mi Zhang, Bonnie Spring, and Tanzeem Choudhury. 2015b. Automated personalized feedback for physical activity and dietary behavior change with mobile phones: a randomized controlled trial on adults. JMIR mHealth and uHealth 3, 2 (2015), e42.
- (52) Sarah-Jeanne Salvy, James N Roemmich, Julie C Bowker, Natalie D Romero, Phillip J Stadler, and Leonard H Epstein. 2009. Effect of peers and friends on youth physical activity and motivation to be physically active. Journal of pediatric psychology 34, 2 (2009), 217–225.
- (53) Noor Shaker, Georgios N Yannakakis, and Julian Togelius. 2010. Towards automatic personalized content generation for platform games. (2010).
- (54) Saul Shiffman, Arthur A Stone, and Michael R Hufford. 2008. Ecological momentary assessment. Annu. Rev. Clin. Psychol. 4 (2008), 1–32.
- (55) Grace Shin, Yuanyuan Feng, Mohammad Hossein Jarrahi, and Nicci Gafinowitz. 2019. Beyond novelty effect: a mixed-methods exploration into the motivation for long-term activity tracker use. JAMIA open 2, 1 (2019), 62–72.
- (56) Sam Snodgrass, Omid Mohaddesi, Jack Hart, Guillermo Romera Rodriguez, Christoffer Holmgård, and Casper Harteveld. 2019. Like PEAS in PoDS: the player, environment, agents, system framework for the personalization of digital systems. In Proceedings of the 14th International Conference on the Foundations of Digital Games. 1–15.
- (57) Paulina Sockolow, Seran Schug, Jichen Zhu, TJ Smith, Yalini Senathirajah, and Sandra Bloom. 2017. At-risk adolescents as experts in a new requirements elicitation procedure for the development of a smart phone psychoeducational trauma-informed care application. Informatics for Health and Social Care 42, 1 (2017), 77–96.
- (58) Olov Ståhl, Björn Gambäck, Preben Hansen, Markku Turunen, and Jaakko Hakulinen. 2008. A mobile fitness companion. (2008).
- (59) KP Suresh. 2011. An overview of randomization techniques: an unbiased assessment of outcome in clinical research. Journal of human reproductive sciences 4, 1 (2011), 8.
- (60) Josep Valls-Vargas, Santiago Ontanón, and Jichen Zhu. 2015. Exploring player trace segmentation for dynamic play style prediction. In Eleventh Artificial Intelligence and Interactive Digital Entertainment Conference.
- (61) Karen Van der Zee, Bram Buunk, Robbert Sanderman, Gerrit Botke, and Fons Van den Bergh. 2000. Social comparison and coping with cancer treatment. Personality and Individual differences 28, 1 (2000), 17–34.
- (62) Karen I Van Der Zee, Bram P Buunk, Robbert Sanderman, Gerrit Botke, and Fons Van Den Bergh. 1999. The Big Five and identification–contrast processes in social comparison in adjustment to cancer treatment. European Journal of Personality 13, 4 (1999), 307–326.
- (63) Thomas A Wills. 1981. Downward comparison principles in social psychology. Psychological bulletin 90, 2 (1981), 245.
- (64) Joanne V Wood. 1989. Theory and research concerning social comparisons of personal attributes. Psychol. Bull. 106, 2 (1989), 231.
- (65) Joanne V Wood. 1996. What is social comparison and how should we study it? Personality and Social Psychology Bulletin 22, 5 (1996), 520–537.
- (66) Elad Yom-Tov, Guy Feraru, Mark Kozdoba, Shie Mannor, Moshe Tennenholtz, and Irit Hochberg. 2017. Encouraging physical activity in patients with diabetes: intervention using a reinforcement learning system. Journal of medical Internet research 19, 10 (2017), e338.
- (67) Mo Zhou, Yoshimi Fukuoka, Yonatan Mintz, Ken Goldberg, Philip Kaminsky, Elena Flowers, and Anil Aswani. 2018. Evaluating machine learning–based automated personalized daily step goals delivered through a mobile phone app: Randomized controlled trial. JMIR mHealth and uHealth 6, 1 (2018), e28.
- (68) Jichen Zhu and Santiago Ontanón. 2010a. Story representation in analogy-based story generation in riu. In Proceedings of the 2010 IEEE Conference on Computational Intelligence and Games. IEEE, 435–442.
- (69) Jichen Zhu and Santiago Ontanón. 2010b. Towards Analogy-Based Story Generation.. In ICCC. 75–84.
- (70) Jichen Zhu and Santiago Ontanón. 2020. Player-Centered AI for Automatic Game Personalization: Open Problems. In Proceedings of the Fifteenth International Conference on the Foundations of Digital Games.