Impact of Dark Photon Emission on Massive Star Evolution and Pre-Supernova Neutrino Signal
Abstract
We study the effects of additional cooling due to the emission of a dark matter candidate particle, the dark photon, on the final phases of the evolution of a star and resulting modifications of the pre-supernova neutrino signal. For a substantial portion of the dark photon parameter space the extra cooling speeds up Si burning, which results in a reduced number of neutrinos emitted during the last day before core collapse. This reduction can be described by a systematic acceleration of the relevant timescales and the results can be estimated semi-analytically in good agreement with the numerical simulations. Outside the semi-analytic regime we find more complicated effects. In a narrow parameter range, low-mass dark photons lead to an increase of the number of emitted neutrinos because of additional shell burning episodes that delay core collapse. Furthermore, relatively strong couplings produce a thermonuclear runaway during O burning, which could result in a complete disruption of the star but requires more detailed simulations to determine the outcome. Our results show that pre-supernova neutrino signals are a potential probe of the dark photon parameter space.
1 Introduction
Dark matter, which represents more than 80% (Tanabashi et al., 2018) of the matter density of the universe and whose nature remains one of the biggest mysteries in physics, could be part of a dark sector which weakly interacts with Standard Model (SM) particles. Such scenarios of dark sectors naturally appear in many extensions of the SM where dark matter particles only interact with the SM via a mediator. There is a rich experimental program searching for signatures of such mediators (Essig et al., 2013; Alexander et al., 2016; Aaboud et al., 2019). However, if the coupling to SM particles is too weak, these particles could evade the searches and remain hidden. Astrophysical probes can greatly extend the reach of the search for dark matter candidates, trading the precision associated with the controlled environment of a laboratory for the vast range of densities and temperatures of stars (Raffelt, 1996). In one of the simplest extensions of the SM, the dark sector interacts with ordinary matter through the exchange of light vector bosons that couple to SM conserved currents (Holdom, 1986; Rajpoot, 1989; Nelson & Tetradis, 1989; Batell et al., 2014a). Dark matter is charged under a local U(1) symmetry in which the mediator couples to the SM electric charge , and is described by the spin-one field , called the dark photon, which mixes kinetically with the standard photon . Dark photons are characterized by two independent parameters, their mass and the reduced coupling strength with normal matter . Several general dark matter searches have established experimental bounds on this parameter space (Batell et al., 2014b; Essig et al., 2013).
Complementary constraints are provided by core collapse supernovae (SNe). For instance, parameters that would result in a noticeable reduction of the observed neutrino burst duration from SN 1987A can be excluded (Sung et al., 2019; Chang et al., 2017; Rrapaj & Reddy, 2016; Raffelt, 1990; Choplin et al., 2017). Additional constraints have been derived from observational signatures of our sun and other low-mass stars (An et al., 2013). If beyond SM particles can be produced at relatively low temperatures, they would affect stellar evolution during He-burning and onward. This phase lasts millions of years and is sampled broadly by observations that can be used to derive stringent constraints (Raffelt & Dearborn, 1987). Dark matter particles that are more massive, however, can only be produced at much higher temperatures and therefore only affect the short, advanced stages of the evolution of more massive stars.
This work is a continuation of Rrapaj et al. (2019) to study the potential impact of the dark photon on the final stages of a star. During these stages temperatures in the star become high enough for dark photons to be emitted from electron-positron pair annihilation while the densities are still far below the regime where other processes, e.g., bremsstrahlung, become important. We therefore only include dark photons from pair annihilation in this work and consider values of ranging from to , where is the electron mass. Due to energy-momentum conservation, dark photons with masses below cannot be produced by electron-positron pair annihilation and the temperatures needed for the emission of particles with masses more than are not reached before core collapse. We explore a wide range of coupling strengths , between and , thereby probing a part of the parameter space unconstrained by neutrino observations of SN 1987A (Chang et al., 2017; Hardy & Lasenby, 2017).
If the dark photon is lighter than all other particles in the dark sector it decays back into electron-positron pairs, either still inside the star or later in the interstellar medium. In the latter case, the -ray signature of the subsequent annihilation of positrons can be used to derive constraints (DeRocco et al., 2019). If the dark photons decay inside the star, this may act as an additional heating mechanism leading to further constraints from the observed explosion energies of SNe (Sung et al., 2019). In contrast to these scenarios, we assume that the dark sector contains lighter particles that the dark photon ultimately decays into, as also discussed in Rrapaj et al. (2019). In this case, any energy carried away by the dark photon is leaked into the dark sector, and the emission of the dark matter particles always acts as a cooling mechanism without additional signatures. Under this assumption the constraints discussed by DeRocco et al. (2019) and Sung et al. (2019) do not apply.
As a messenger of the stellar interior, we look at the emission of pre-SN neutrinos and find that, in a large part of our selected dark photon parameter space, the extra cooling leads to a speed-up of the final burning stages and systematically reduces the number of neutrinos emitted during the last day before core collapse. We also show that this reduction can be estimated with good accuracy just based on the baseline stellar model by adjusting the time-integration of the neutrino luminosity. Our results suggest that this effect may be used to constrain the dark photon parameter space if pre-SN neutrinos are detected in the future. In a very small region of the parameter space we also find that the effect of the extra cooling results in a slight increase of the neutrino emission. In addition, for strong couplings unstable and explosive O burning occurs. While the latter case may potentially also provide constraints on the dark photon parameters, improved simulations are required to better determine the final outcome and observational signatures.
Our paper is organized as follows. In §2 we describe the setup for our calculations. In §3 we discuss the details of our fiducial model of the evolution of a star calculated without extra cooling. In §4 we provide an overview of the relevant parameter space and discuss details of the three types of effects that we find. In §5 we briefly outline the possibility of deriving constraints from future observations of pre-SN neutrinos and summarize our results.
2 Calculations
We implement a tabulation of the dark photon emission rates from Rrapaj et al. (2019) in the stellar evolution and hydrodynamics code KEPLER (Weaver et al., 1978; Woosley & Heger, 2007) and calculate the evolution of a star with an initial composition of solar metallicity (Lodders & Palme, 2009). The mass loss prescription is based on Nieuwenhuijzen & de Jager (1990) and the mixing length for convection is equal to the pressure scale height. Semi-convection is treated as described in Woosley & Weaver (1988), limiting the convective diffusion coefficient to of the thermal value (see also Woosley et al. 2002). Overshoot and thermohaline mixing (Kippenhahn et al., 1980) are also included. Neutrino energy loss and the resulting total neutrino luminosity are based on Itoh et al. (1996).
We evolve the models until the onset of core collapse, which we define as the point when the infall velocity exceeds . This limiting value is higher than the value of used in previous studies (Woosley & Heger, 2007; Woosley et al., 2002) because the additional dark matter cooling tends to accelerate contraction.
In order to explore the dark photon parameter space we have calculated more than 470 stellar models and to limit the computational cost we only use an approximate 19-isotope nuclear reaction network to calculate the energy generation rates. At a temperature of 3.5 GK the code switches to solving for the composition in quasi-statistical equilibrium (QSE) (Hix et al., 1998). For even higher temperatures and when O is depleted full nuclear statistical equilibrium (NSE) is assumed. Furthermore, we limit the number of zones in our models to 2000.
3 Fiducial model
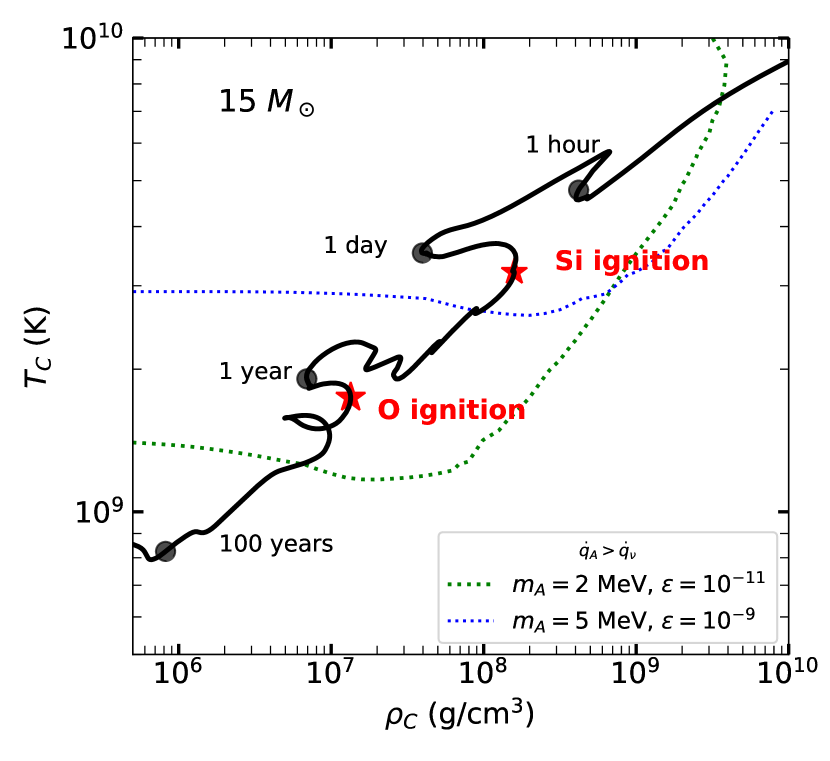
Figure 1 shows the track of the fiducial stellar model without extra cooling in terms of central temperature and density . This track is in good agreement with the results from Woosley & Heger (2007) and also with those from different stellar evolution codes, such as MESA (Paxton et al., 2015). For the parameters that we are studying, dark photon production is not relevant for temperatures below GK. The dotted contours in Figure 1 indicate where energy loss due to dark photon emission equals the neutrino loss, marking the boundary of the temperature and density regime where dark photon loss would dominate. This boundary depends on the values of and . For instance, lighter dark photons with stronger coupling strengths start to dominate at lower temperatures. The details of these contours were discussed by Rrapaj et al. (2019). As illustrated for and in Figure 1, dark photons may already become important right after central C depletion, which occurs around 64 years before core collapse. Therefore, for context, we provide a short description of the evolution after C depletion.
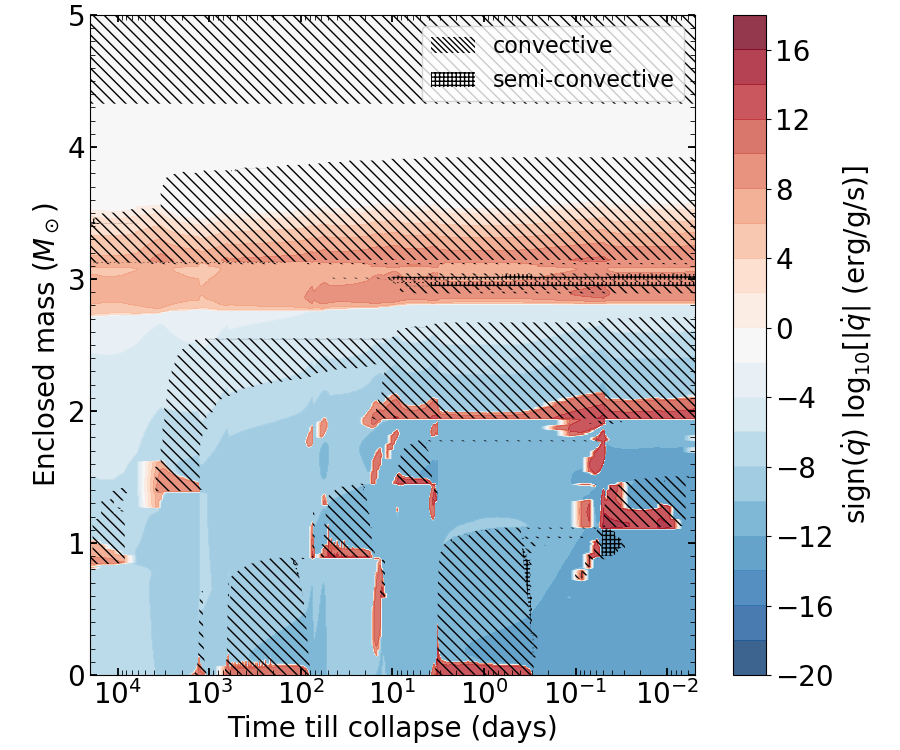
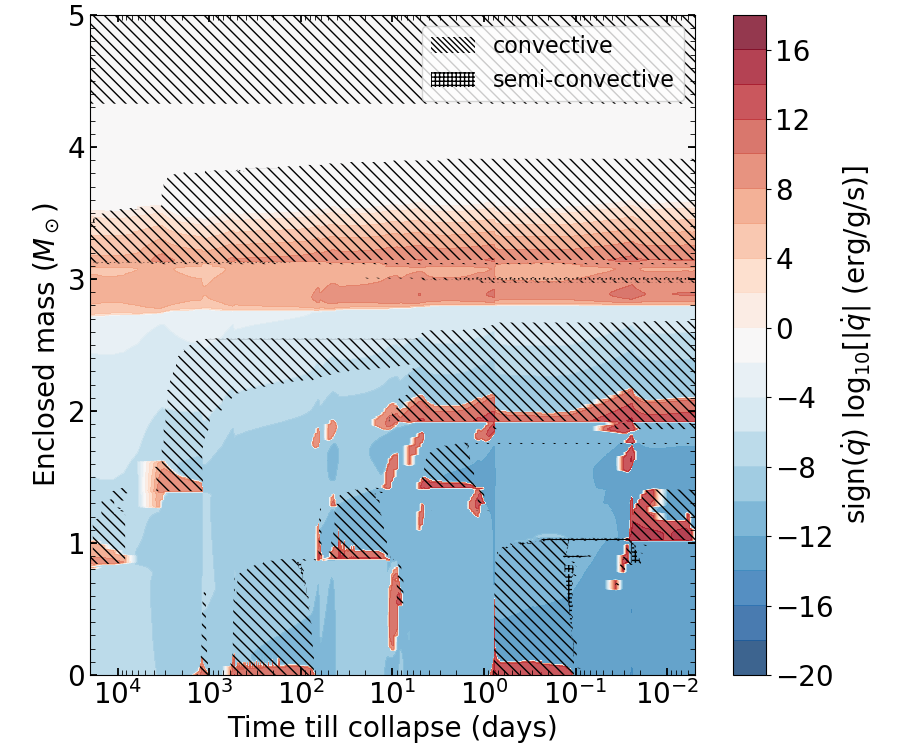
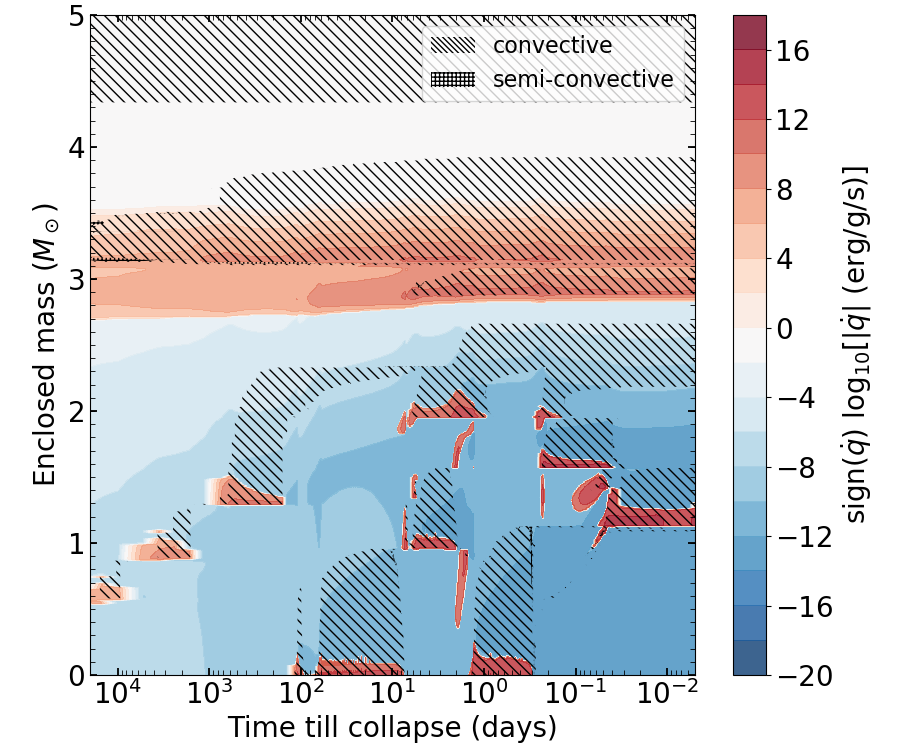
The convective burning phases over the last 60 years are indicated in Figure 2, where hatched areas indicate convection and the color code shows the net energy generation or loss. After C core and shell burning, Ne burning ignites at the center at GK, around 1500 days before collapse under slightly degenerate conditions with a value of the degeneracy parameter , where is the chemical potential of electrons, the temperature and the Boltzmann constant. The partial electron degeneracy leads to an initially rapid rise of the temperature, followed by core expansion at almost constant temperature. Once Ne is depleted, neutrino cooling leads to a decrease in temperature before the core continues to contract and eventually heats up again. This leads to the loop in the - diagram shown in Figure 1. Ne burning is visible as the small hatched peak in Figure 2, which also shows that this episode is very short.
About 650 days before collapse, O burning ignites centrally at GK, which leads to a rapid rise of the central temperature and subsequent expansion. In contrast to the Ne-burning loop, at the end of O burning in the core the temperature does not decrease and the core is stabilized by shell burning. Once the shell burning ceases, neutrino loss reduces while the core contracts. At higher densities, neutrino loss is suppressed and the track resumes its upward climb, while a second O-burning shell is ignited. Between core O depletion and Si ignition, He and C shell burning are still active.
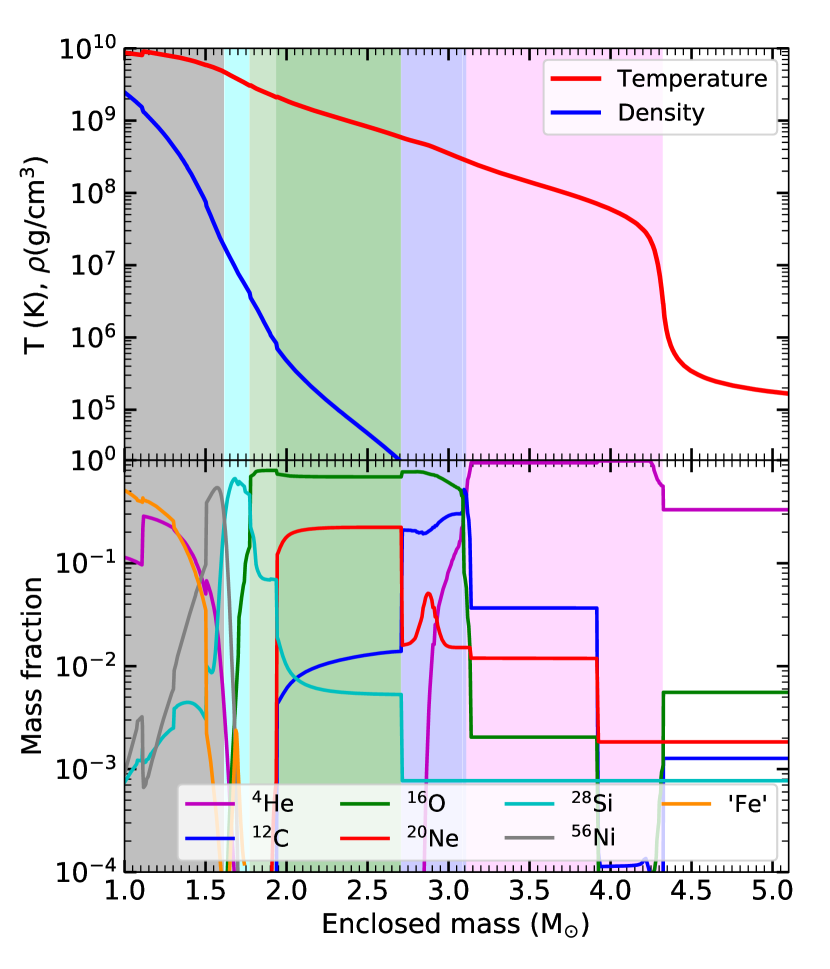
Convective Si burning ignites at the center around 3.5 days before collapse, after the second O-burning shell is extinguished. Around 5.6 hours before collapse, central Si burning finishes and leaves a hot Fe core behind. This initial core grows further by shell burning that ignites about one hour before collapse and continues until the core mass exceeds its effective Chandrasekhar limit and collapses. Figure 3 shows the temperature, density, and mass fraction profiles of the most important isotopes of our fiducial model at core collapse. The He core encompasses 4.26 , the C/O core 3.02 , the O/Ne core up to 2.70 , and the Fe core encompasses 1.60 at a radius of km.
Multi-dimensional hydrodynamics simulations of the last minutes before core collapse (Yadav et al., 2020; Yoshida et al., 2019; Müller et al., 2016) have shown deviations from spherically symmetric models using mixing length theory, but we do not expect our results to be qualitatively affected by these differences.
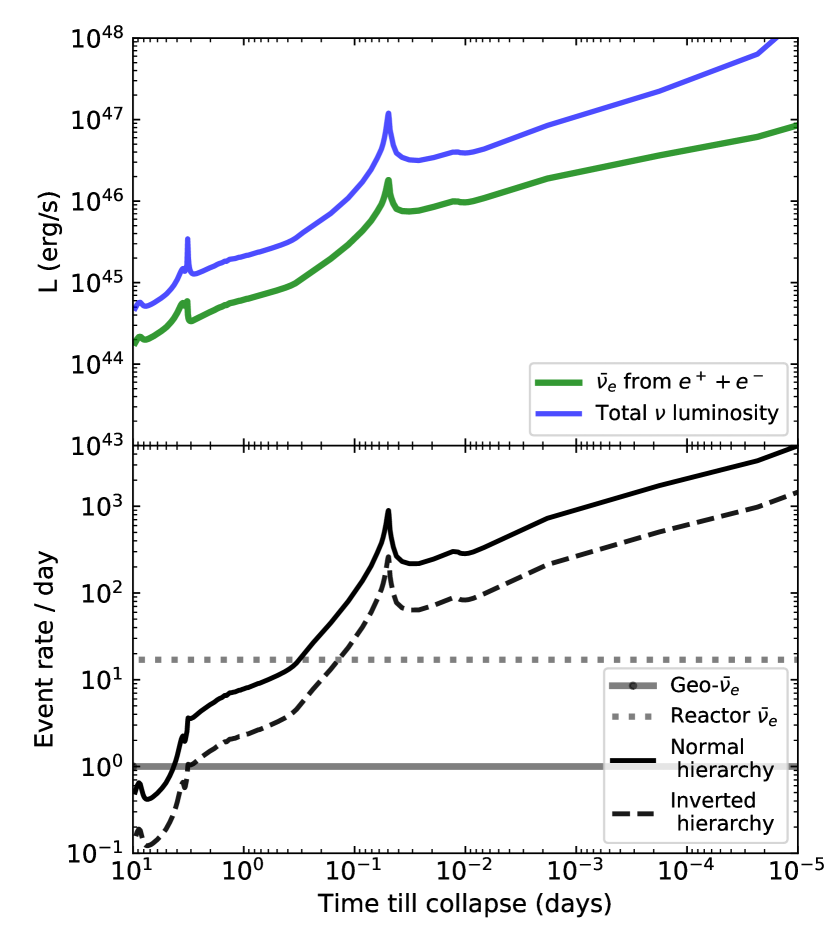
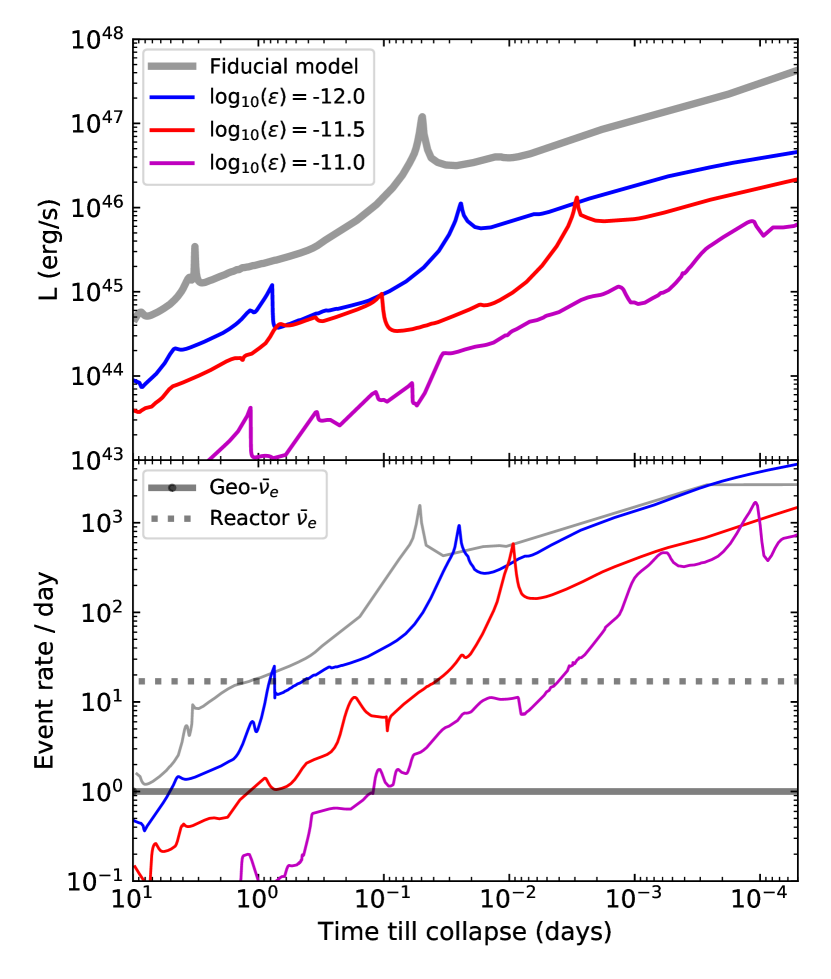
Because the evolution of the stellar core is mostly decoupled from the surface during the final stages, neutrinos are unique messengers that may provide detailed information about the processes and conditions in the core shortly before collapse (e.g., Guo & Qian, 2016; Kato et al., 2020). Current and near-term neutrino detectors are expected to be able to detect the neutrinos from a nearby massive star only within the last day before collapse (e.g., Guo et al., 2019; Kato et al., 2020). The top panel of Figure 4 shows the neutrino luminosity during the last 10 days before core collapse for our fiducial model. In general, the luminosity increases as the star contracts and heats up, following the track in Figure 1. The two peaks visible in Figure 4 are caused by the ignition of nuclear burning that leads to expansion and cooling, temporarily delaying collapse. The peak at around 3.5 days before collapse corresponds to Si ignition at the center and the peak at about one hour before collapse corresponds to the ignition of Si shell burning.
Here we focus on the for two reasons. Firstly, future scintillation detectors are likely to observe the pre-SN , mainly by inverse beta decay (IBD, ). Secondly, towards the end of the life of a massive star are mostly produced by electron-positron pair annihilation. In contrast to the emission of , this thermal process is relatively insensitive to the details of the stellar composition and does not depend on the uncertainties related to electron capture on nuclei. We calculate the spectral neutrino flux from pair annihilation as in Guo & Qian (2016), using temperature, density, and electron fraction profiles as functions of time from our stellar models. The luminosity due to pair annihilation alone is shown in the top panel of Figure 4 in comparison to the total neutrino luminosity. At one day before collapse, constitute almost 30% of the total luminosity. This fraction decreases towards collapse, as from electron captures become increasingly important. At before collapse, however, from pair annihilation still account for of the total neutrino luminosity.
Based on the fluxes from the stellar evolution models, we calculate the expected pre-SN neutrino signal at the Jiangmen Underground Neutrino Observatory (JUNO) following Guo et al. (2019). With the spectral number luminosity of the star, the expected energy-differential event rate at a distance is
| (1) |
where is the detector efficiency and is the number of protons based on 20 kt of active detector material with a proton fraction (An et al., 2016). The IBD cross-section is calculated as in Guo & Qian (2016). For the event rate we integrate Equation (1) over –, which is the optimal energy window for detection. Due to flavor transformations the detection rate depends on the neutrino mass ordering and the expected number of events for the normal hierarchy is about 3.4 times higher than for the inverted hierarchy (e.g., Guo et al., 2019). Figure 4 shows the expected event rates from our fiducial model assuming a distance of . We also show the main sources of background, geo-neutrinos and from nearby reactors. For the inverted hierarchy about 15 events are expected during the last day, which are approximately the same as the background. For the normal hierarchy, however, about 50 events are expected during the last day, which are a factor of more than the background. Therefore, a pre-SN neutrino signal may be detected above the background during the final day before core collapse, especially in the case of the normal mass hierarchy.
4 Results
We have calculated stellar models for a grid of the dark photon parameters and laid out in Figure 5. For we have looked at increments of and for we have taken smaller steps of . For we looked at logarithmic intervals of spanning values from to . For reference, the region of the parameter space that is already excluded by the detection of the neutrinos from SN 1987A (Chang et al., 2017) is indicated as the top gray shaded area in Figure 5. Note also that the region corresponding to is not studied here. The different symbols in Figure 5 indicate the outcomes of the models that we have calculated.
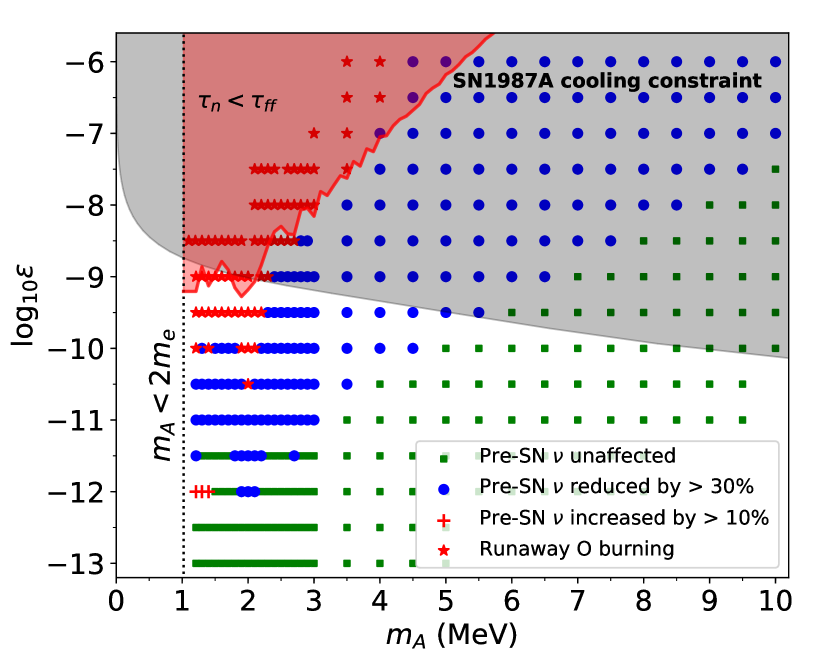
We find three qualitatively different ways in which the extra cooling changes the late phases of stellar evolution and the last-day pre-SN neutrino signal. The green squares in Figure 5 mark models that exhibit only negligible deviations from the fiducial model. In contrast, the blue circles mark cases in which the pre-SN neutrino emission is reduced by more than due to accelerated Si burning. Part of the parameter space with the blue circles is currently unconstrained, suggesting that future observations of pre-SN neutrinos may impose new constraints on the dark photon properties.
Only three models with small dark photon masses, indicated by the red crosses in Figure 5, exhibit a slight increase in the pre-SN neutrino emission. As we will show in §4.2, this result is caused by an additional shell burning episode that delays core collapse. For sufficiently small dark photon masses and intermediate coupling strengths, the dark photon emission predominantly originates not from the stellar center, but from the region of the final the O/Ne shell.
For the parameters in the red shaded region in the upper left corner of Figure 5, the nuclear timescale exceeds the hydrodynamic timescale during O burning and thermonuclear runaway is to be expected, as we will explain in §4.3. We did not perform full calculations to cover this whole region due to the complications associated with this explosive scenario. While the final fate of the corresponding models requires further investigation beyond the scope of this paper, we can speculate that all these cases may even lead to thermonuclear SNe and the disruption of the whole star.
In general, energy loss determines the timescales of the advanced burning stages in massive star evolution (Woosley & Heger, 2007). The balance between energy generation due to nuclear burning and energy loss determines the temperature of hydrostatic burning and thus the rates at which nuclear reactions occur. Furthermore, energy loss determines how fast the stellar core can contract because part of the resulting gain in gravitational binding energy needs to be radiated away. Thus, emission of dark matter particles that increases the energy loss rate generally leads to a speed-up of stellar processes. The consequences of this acceleration, however, depend on where the speed-up occurs and on whether the star can adjust sufficiently fast. Below we give more detailed explanations for the various effects that we observe.
4.1 Reduced neutrino emission
As long as the stellar path to core collapse is guided by energy loss, an additional cooling agent, such as dark photon emission, leads to a speed-up of the evolution. Once the core becomes hot enough, the bulk of the energy loss is taken over by the dark matter particles instead of the neutrinos, and the accelerated evolution leaves less time for neutrino emission.
As an example, Figure 6 shows the convective burning phases for a calculation with the parameters and . Comparison with Figure 2 shows that the stellar structure remains largely the same as in the fiducial model, but the evolution timescales change greatly. The period between the onset of convective Si burning and collapse is only around 0.9 day in Figure 6, compared to 3.5 days in the fiducial model (see Figure 2). That between the end of convective Si burning at the center and collapse is less than 3 hours, compared to 8 hours in the fiducial model. The radial extent of the convective regions, on the other hand, remains almost identical. The slight reduction of the extent of the convective zone due to the more efficient energy loss, along with the shorter time for shell burning due to the faster evolution of the core, results in a slightly smaller final Fe core mass of , compared with for the fiducial model. With the remnant mass estimated by the point where the entropy decreases below baryon (Woosley et al., 2002), dark photon emission slightly reduces the potential neutron star mass from to .
For the above values of and , the overall changes to the stellar structure relative to the fiducial model are minor. In contrast, the integrated number of neutrinos emitted during the last day is already decreased by a factor of two. This result shows that the main effect of the additional cooling is a speed-up of Si burning and core contraction that scales with the energy loss rate. This speed-up of the evolutionary clock reduces the integrated neutrino emission with dark photons also contributing to the energy loss. The effects on the luminosity from pair annihilation and the associated signal are illustrated in Figure 7 for models with and a range of values. In addition to a suppression of the luminosity, some features of the signal are shifted closer to the time of collapse. This shift is clearly visible for the peak associated with Si shell burning, which appears at about one hour before collapse for the fiducial model (see §3), but at only and before collapse for and , respectively. Note that for , the evolution of the luminosity becomes less smooth due to complications discussed in §4.3.
For all dark photon masses covered in our study, we find the same type of reduction of the neutrino emission, and the necessary coupling strength to achieve the same reduction increases with mass. In the following we show that this reduction can be estimated semi-analytically, just based on the fiducial stellar model. Without dark photon cooling, the timescales during the final stages of evolution are determined mostly by the neutrino loss. We expect , where is the total neutrino luminosity from the whole star at time . With the additional dark photon cooling, we expect
| (2) |
where is the dark photon luminosity from the whole star. This change affects the results of any time-integrated quantity in two ways. Firstly, the time measure itself is changed. Secondly, the effective integration limits are changed. The time of core collapse, , marks the final time with a well-defined physical condition. In order to accumulate a fixed time interval , e.g., one day, up to , the starting point needs to be modified such that
| (3) |
With due to dark photon cooling, we have , so samples earlier stages of the evolution.
The above prescription allows us to estimate the energy emitted in from pair annihilation during the last day before collapse as
| (4) |
where is the luminosity due to pair annihilation from the whole star. Note that and are based on the temperature and density profiles of the fiducial model without dark photon emission. This approximation is valid as long as the effects of extra cooling on stellar structure are negligible. In this case, the change of the emission can be estimated semi-analytically without computing new stellar models with the additional energy loss.
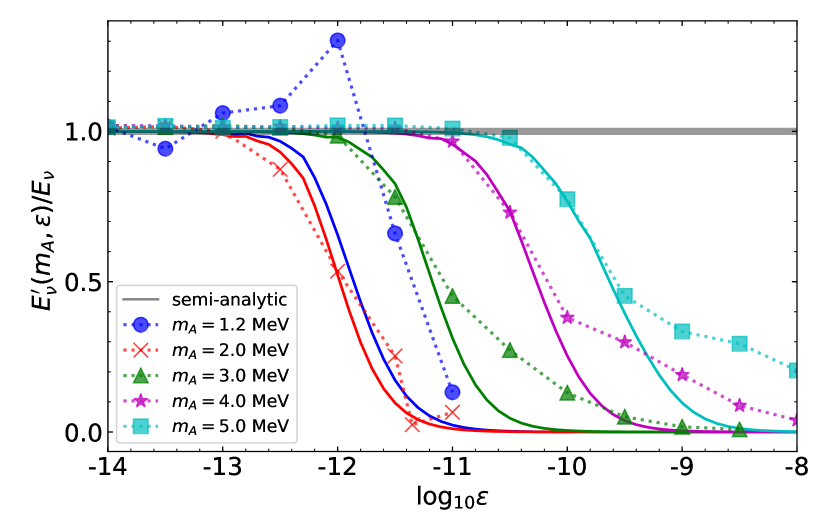
Figure 8 displays the energy emitted in from pair annihilation over the last day before core collapse, normalized to the fiducial model, as a function of the dark photon coupling strength for a range of . The symbols show the results from full stellar evolution calculations and demonstrate that increasing dark photon emission leads to a reduction of the neutrino emission. The solid curves show the estimates based on Eq. (4), which successfully describe the onset of the effects of dark photons as well as the overall trend for many of the calculated models, especially when the reduction of the neutrino emission is . Deviations from the actual calculations are expected when the dark photon cooling starts to change the temperature and density profiles for sufficiently large values of . For a large part of the dark photon parameter space, however, the main effect is the relatively straightforward reduction of the neutrino emission without significant changes to the stellar structure as discussed above. Those cases are indicated by the blue circles in Figure 5 and cover an unconstrained region of the parameter space.
4.2 Increased neutrino emission
As discussed in §4.1, the reduction of the pre-SN neutrino emission results almost entirely from the modification of the timescales of core burning and contraction. Below we show that the deviations from this explanation for low (see Figure 8) are due to the appearance of shell burning phases with a stabilizing effect, which leads to the cases of the increased neutrino emission marked by the red crosses in Figure 5.
For the dark photon parameters under our consideration, only three models with , , and , all with , have an increase of in the pre-SN neutrino emission relative to the fiducial model. The comparison of the neutrino emission with the fiducial model is shown for the case of in Figure 8. The Kippenhahn diagram for this case is shown in Figure 9, which reveals an additional episode of convective O shell burning between an enclosed mass of and . This episode starts at before collapse, following the end of core Si burning, but before the onset of Si shell burning. Such an episode occurs neither in the fiducial model nor in the model with the reduced neutrino emission shown in Figure 6. Heating by this additional O-shell burning phase relieves the pressure on the Si-core and delays the ignition of Si-shell burning and hence core collapse. This delay gives the star more time, thereby increasing the total number of pre-SN neutrinos emitted.
For , the additional O-shell burning phase also occurs for larger values of the dark photon coupling, but it cannot compensate for the effects of the accelerated burning and core contraction. Consequently, the integrated neutrino emission for such cases is still reduced (see Figure 8), although not by as much as estimated from Eq. (4), which does not take into account the additional O-shell burning. We can only find a net increase of the pre-SN neutrino emission for a very narrow range of , which is strong enough to cause an additional burning episode, but weak enough to limit the acceleration of the evolution.
In order to understand the apparent association of the additional burning episodes with the lightest dark photons in our study, we look at the time-integrated energy loss as a function of the enclosed mass inside radius ,
| (5) |
where is either for the neutrino with the energy loss rate or for the dark photon with the energy loss rate , and is the time of C ignition when the energy loss due to neutrinos and dark photons becomes relevant. Figure 10 shows the ratio relative to the value for the central zone based on the fiducial model. Due to the scaling of with , the quantity is independent of . It is, however, quite sensitive to .
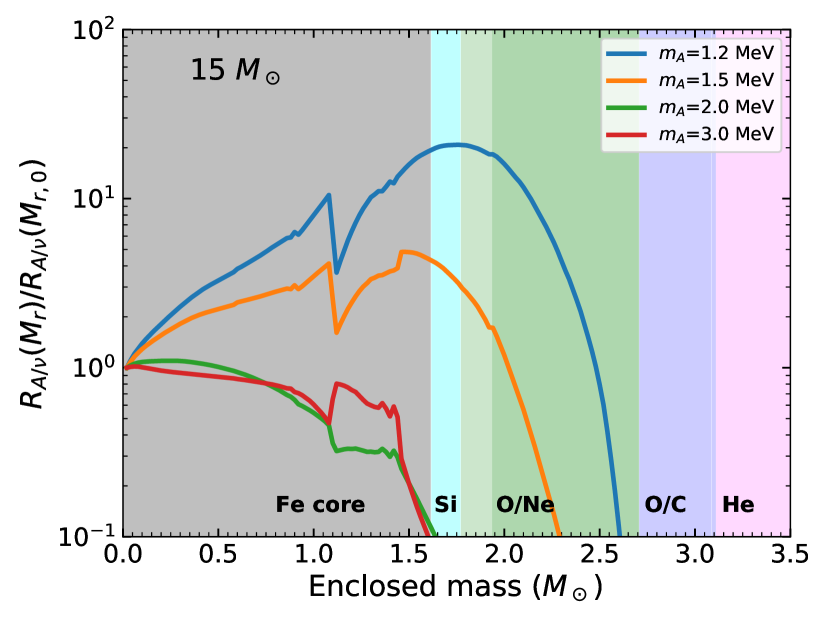
For masses above the emission of dark photons dominates that of neutrinos mostly in the final Fe core because the temperature is generally higher at smaller radii. For masses below , however, the dark photon emission dominates further outside the core. This different behavior for the lower values of can be understood as follows. Because the number of pairs is reduced in degenerate conditions, dark photon production by pair annihilation is suppressed at high densities in the core (see Rrapaj et al. 2019 for details). This suppression does not occur in the region at lower densities outside the core, but the temperature of this region can only facilitate significant emission of the lower-mass dark photons. Therefore, shell burning phases are accelerated and additional burning episodes with stabilizing effects as described above tend to occur for . For heavier dark photons, their production requires energetic pairs that can only be provided by the final core burning stages. Therefore, the assumption that the effect of dark photon cooling is limited to the core burning regions is justified for , but the evolution of the outer regions is noticeably affected for smaller dark photon masses.
The stabilizing effect of additional shell burning phases due to the accelerated evolution outside the core cannot be easily captured by a semi-analytical prescription like the one presented in §4.1. Detailed stellar evolution calculations are essential to the discovery and understanding of this effect.
4.3 Runaway O Burning
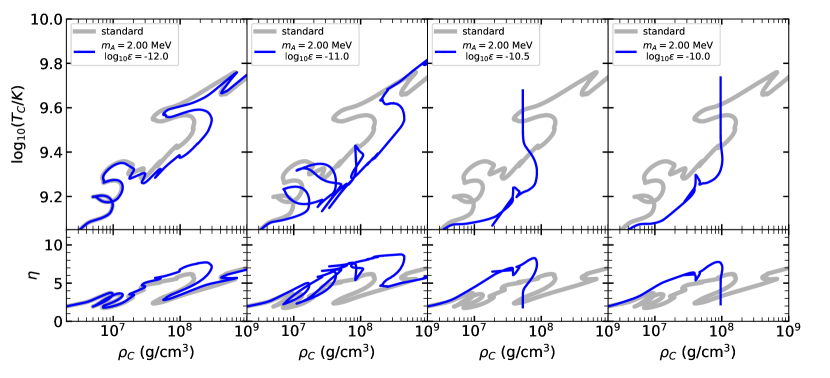
The stellar models with those dark photon parameters indicated by the red stars in Figure 5 exhibit a thermonuclear runaway during O burning. This result may be understood as follows. With the dark photon cooling, the accelerated burning timescales get shorter than the convective and eventually also the hydrodynamic timescales. In addition, the increased electron degeneracy further prevents the star from adjusting its structure in response to the nuclear energy release. Consequently, the central temperature rises rapidly to GK and O is exhausted in a convective region covering less than the innermost of material. Afterwards, O burning propagates outward in a thin shell as a deflagration front. Figure 11 shows the evolutionary tracks of and for and , , , and , respectively, in comparison with the fiducial model. The degeneracy parameter is also shown in the bottom panels of this figure. The onset of the runaway can be seen clearly for the largest two values of : almost vertically increases to when we stopped the calculations due to the required very small time steps.
Compared to the fiducial model, the tracks for in Figure 11 do not show much deviation, but the density tends to be higher for the same temperature, thereby increasing the degeneracy. While the track of vs. for the fiducial model already exhibits a loop, which arises from burning under degenerate conditions (see also Figure 1), the track for shows two such loops and several backward kinks resulting from shell flashes, signifying ignition of shell burning under degenerate conditions. For , O burning becomes unstable and the central temperature explosively increases up to GK. It can be seen from Figure 11 that in this case the core expands somewhat initially, but the decrease of density fails to stop the runaway heating. As increases rapidly, convection also quickly becomes inefficient to distribute the energy released from the nuclear reactions. The detailed evolution in this case is discussed in Appendix A. We find the same type of behavior as in this case for even larger values of . For example, for , the density response to the rise in temperature due to O burning is barely visible in Figure 11, indicating a further acceleration of the runaway process.
While the runaway burning described above results from the interplay of several factors, including the competition of burning timescales with convective and hydrodynamic timescales, as well as partial electron degeneracy, below we present a simple argument for the association of a thermonuclear runaway with large values of and provide a conservative estimate for the dark photon luminosity (per unit mass) at which hydrostatic burning is no longer possible.
In configurations of stable nuclear burning, the energy release from nuclear reactions is compensated by energy losses, leading to a stable consumption of the nuclear fuel. For advanced burning phases without dark photons, the temperature for hydrostatic burning can be estimated by equating the neutrino energy loss and nuclear energy release (Woosley et al., 2002). Assuming
| (6) |
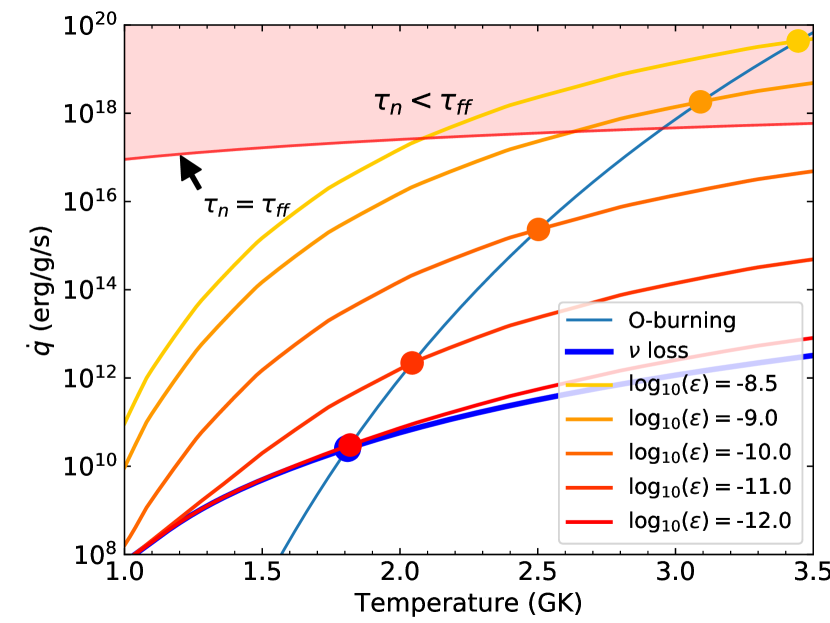
for O burning, the intersection of the O-burning energy generation and the neutrino loss rate gives the typical O-burning temperature of GK (see blue curves in Figure 12).
The additional energy loss due to dark photons changes the temperature for hydrostatic O burning. Due to the very steep temperature dependence of the nuclear reaction rate, a small change of temperature is sufficient to compensate for a large increase of the energy loss. As shown in Figure 12, a factor of increase of the energy loss for and only slightly increases the nominal O-burning temperature to . Nevertheless, this temperature increase is responsible for the speed-up of the evolution discussed in §4.1. Of course, the burning temperature must increase substantially for strong dark photon couplings. For example, it reaches for (see Figure 12).
Complications arise if the timescale of nuclear burning becomes shorter than the hydrodynamic timescale on which stellar structure can adjust to the temperature change. We take the latter timescale to be the free-fall timescale
| (7) |
where the density can be estimated from the temperature assuming Eq. (6). The timescale of nuclear burning can be estimated as
| (8) |
where erg/g (Woosley et al., 2002) is the effective energy release, is the mass fraction of the 16O fuel, and is the specific energy generation rate per unit mass. For O burning, occurs at a critical specific energy generation rate of
| (9) |
The contour for is shown in Figure 12. It intersects the curve for the energy release due to O burning at GK and . At this temperature and the corresponding density from Eq. (6), if the specific dark photon energy loss rate exceeds , i.e.,
| (10) |
a thermonuclear runaway is expected. As shown in Figure 12, this result occurs for and .
The red shaded region in Figure 5 indicates the general parameter space of and for which the condition in Eq. (10) is fulfilled. While the boundary of the region roughly reflects the appearance of the red stars indicating runaway O burning, the stellar models already exhibit such burning for much weaker couplings for MeV. This result may be explained by the complications due to electron degeneracy, which tends to prevent the star from reacting to nuclear energy release, and due to the competition of nuclear burning with convection. Both these complications are ignored in the simple picture assumed for deriving Eq. (10). At O ignition, our fiducial model already exhibits some degree of degeneracy with (see Figure 11). When dark photon cooling is included, the temperature of stable burning increases, which requires the stellar core to contract to a higher density. Because degeneracy rises more steeply with density than the temperature, values up to is reached in the core at O-burning temperatures when O burning becomes unstable. As the adjustment of the core is slowed down, the O burning luminosity exceeds the maximum luminosity that can be transported by convection (see Appendix A), which also favors a local runaway.
The boundary of the red shaded region in Figure 5 reflects the dependence of the specific dark photon energy loss rate on and . It also tends to predict too small threshold values of for runaway burning for higher values of . Specifically, for , , , and that are above the boundary, although O burning leads to a rapid rise in temperature, the dark photon energy loss increases fast enough to avoid a thermonuclear runaway.
5 Discussion and conclusions
We have studied the impact of extra cooling due to beyond SM particles on the evolution of a star. Specifically, we have implemented the dark photon emission from pair annihilation in the stellar evolution code KEPLER, assuming that these particles decay into other dark sector components, thereby representing an additional mechanism of energy loss for the star. We have considered dark photon masses of to 10 MeV and couplings of to , and found that the dark photon can affect the O and Si burning phases. There are three types of potentially observable effects, which are summarized in Figure 5.
For broad ranges of and , the extra cooling allows the star to contract faster and increases the temperature at which nuclear burning proceeds in equilibrium with energy losses. These effects speed up the burning processes and reduce the number of neutrinos emitted during the last day before core collapse. We have developed a semi-analytical approach that describes the reduction of the pre-SN neutrino emission for the relevant ranges of and (see §4.1).
We further find that, due to the density dependence of the emission process, dark photons with are also produced outside the core, which causes additional shell burning episodes, thereby increasing the pre-SN neutrino emission for a very narrow range of parameters (see §4.2).
Because extra cooling increases the nominal nuclear burning temperatures, sufficiently strong dark photon couplings are expected to produce a thermonuclear runaway (see §4.3). We have found many cases of runaway O burning in our models and speculate that thermonuclear SNe may be the outcome in these cases (see Appendix A). Finding the actual outcome and possible observables in these cases, however, requires more refined simulations that can properly follow the propagation of narrow nuclear burning fronts. Were dark photon cooling to cause complete disruption of a star, the relevant parameter space may be constrained by the observed inventory of neutron stars and stellar black holes, which requires most massive stars to undergo core-collapse SNe.
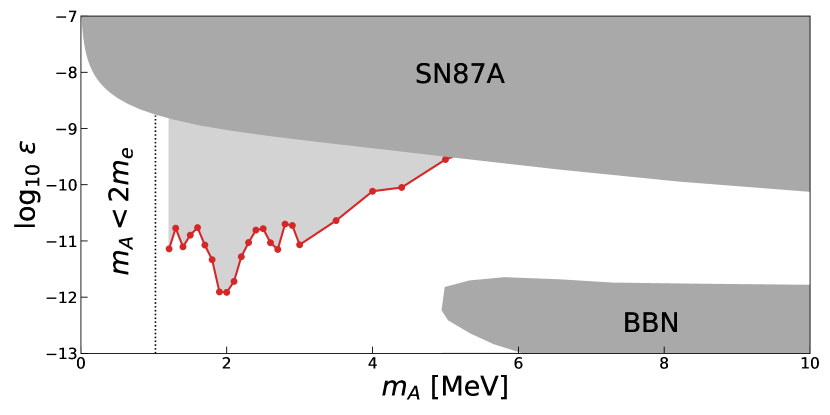
The first type of effect, i.e., the suppression of the pre-SN neutrino emission by dark photon cooling, may be constrained by the detection of such neutrinos. In the most conservative approach, this suppression means that part of the parameter space is only consistent with a non-detection of pre-SN neutrinos. Therefore, any positive detection of a pre-SN neutrino signal from a well-understood progenitor excludes this part of the dark photon parameter space. For illustration, we take our model to explode as a core-collapse SN at a distance of . Assuming the normal neutrino mass hierarchy, we can find the values of () that reduce the pre-SN neutrino emission sufficiently to give an expected number of events less than the background count of about events, in contrast to about 50 events without dark photon cooling. The corresponding parameter space is bounded by the red curve in Figure 13. The detection a number of events significantly above the background level would exclude this part of the parameter space, if the progenitor is similar to the model we have studied here. Note that a small fraction of this parameter space may lead to a thermonuclear runaway, and therefore, could be constrained by the observation of a core-collapse rather than thermonuclear SN.
Pre-SN neutrinos have not been detected yet. Our results, however, indicate that their observation in the future may offer a unique probe of not only the dark photon but also other dark matter particles that are efficiently produced in the temperature regime of – during stellar evolution.
Appendix A A model with Runaway O Burning
In order to understand the phenomenon of runaway O burning, we investigate the model for MeV and in more detail. Figure 14 shows a sequence of snapshots from the evolution of this model. The top row shows the temperature and density profiles, the second row from the top shows the nuclear energy release and combined energy loss due to neutrinos and dark photons, the third row shows the mass fractions of the major isotopes to illustrate the progress of nuclear burning, and the bottom row shows the velocity profile, where positive (outward) velocities are shown as solid curves and negative (infall) velocities are represented by dashed curves. The red shaded regions are convective zones. Time runs from panel (a) on the left to panel (c) on the right, spanning . Panel (a) shows the onset of O burning, which is confined to a convective region reaching up to 1000 km and encompassing about 0.1 of material. At and , the energy release from nuclear reactions exceeds the combined neutrino and dark photon loss. In response to the excess heat, positive velocities develop, indicating the onset of core expansion. Panel (b), however, shows that O burning proceeds much faster than the adjustment of stellar structure. The fuel in the center is almost depleted and the temperature has risen to while the density has only been reduced by about compared to panel (a).
At a temperature above , the luminosity due to O burning exceeds the maximum value that can be transported by convection (Woosley & Heger, 2015)
| (A1) |
where is the convective velocity, is the thermal energy content, and indicates the efficiency of convection to remove the internal energy. With we find , corresponding to an energy generation rate of for the conditions of O burning assuming an initial core mass of . The nuclear energy release in panel (b) exceeds this luminosity already by four orders of magnitude and convection cannot distribute the heat and the fuel throughout the convective region on the burning timescale. Therefore, O is only depleted in the innermost despite that the convective zone reaches out to .
Without efficient convection, the very rapid burning gets confined into a narrow burning front at the bottom of the nominally convective layer, as shown in panel (c) of Figure 14. The change of composition and continuing energy generation also show that Si burning immediately follows because of the high temperature of the central region. In our model, the burning region consists only of a few zones and the fuel in one zone is consumed before the zone above it ignites. The propagation of the burning depends critically on the heat transport and would need to be described by a model for flame propagation. For a very narrow burning front, multi-dimensional effects are important for the propagation of such a deflagration Fryxell & Woosley (1982) and the outcome is highly sensitive to turbulence and mixing at the boundary of the burning front (Jones et al., 2013, 2016). The bottom row of Figure 14 also shows that significant outward velocities develop but remain subsonic. The above situation cannot be adequately simulated by our model due to the lack of resolution and the employed small reaction network and mixing-length treatment of convection. Therefore, our results on the final outcome are speculative.
We have followed the calculation of our model further and find that the shell burning steepens into a supersonic shock once it reaches the steep density gradient at the upper edge of the convective zone around the radius of 2000 km, where Ne burning also provides additional energy. The outward velocity reaches several 1000 km/s, which takes the pressure off the core, eventually facilitating a rapid expansion and cooling. The drops below 0.1 GK and below g/cm3. When the shock reaches the H envelope we find that the kinetic energy of erg exceeds the gravitational binding energy of erg for the star. The shock may thus disrupt the whole star or at least unbind a significant fraction of the H envelope and lead in either case to an optical transient. Even if the core eventually collapses, the runaway O burning would delay the collapse by many hours up to days. Here we caution again that our model is probably inadequate to describe this situation accurately and a better treatment is needed to predict potentially observable signatures.
References
- Aaboud et al. (2019) Aaboud, M., et al. 2019, JHEP, 05, 142, doi: 10.1007/JHEP05(2019)142
- Alexander et al. (2016) Alexander, J., et al. 2016, in Dark Sectors 2016 Workshop: Community Report
- An et al. (2016) An, F., An, G., An, Q., et al. 2016, Journal of Physics G Nuclear Physics, 43, 030401, doi: 10.1088/0954-3899/43/3/030401
- An et al. (2013) An, H., Pospelov, M., & Pradler, J. 2013, Physics Letters B, 725, 190, doi: 10.1016/j.physletb.2013.07.008
- Batell et al. (2014a) Batell, B., deNiverville, P., McKeen, D., Pospelov, M., & Ritz, A. 2014a, Phys. Rev., D90, 115014, doi: 10.1103/PhysRevD.90.115014
- Batell et al. (2014b) Batell, B., Essig, R., & Surujon, Z. 2014b, Phys. Rev. Lett., 113, 171802, doi: 10.1103/PhysRevLett.113.171802
- Chang et al. (2017) Chang, J. H., Essig, R., & McDermott, S. D. 2017, JHEP, 01, 107, doi: 10.1007/JHEP01(2017)107
- Choplin et al. (2017) Choplin, A., Coc, A., Meynet, G., et al. 2017, A&A, 605, A106, doi: 10.1051/0004-6361/201731040
- DeRocco et al. (2019) DeRocco, W., Graham, P. W., Kasen, D., Marques-Tavares, G., & Rajendran, S. 2019, Journal of High Energy Physics, 2019, 171, doi: 10.1007/JHEP02(2019)171
- Essig et al. (2013) Essig, R., Mardon, J., Papucci, M., Volansky, T., & Zhong, Y.-M. 2013, Journal of High Energy Physics, 2013, 167, doi: 10.1007/JHEP11(2013)167
- Fradette et al. (2014) Fradette, A., Pospelov, M., Pradler, J., & Ritz, A. 2014, Phys. Rev. D, 90, 035022, doi: 10.1103/PhysRevD.90.035022
- Fryxell & Woosley (1982) Fryxell, B. A., & Woosley, S. E. 1982, ApJ, 261, 332, doi: 10.1086/160344
- Guo & Qian (2016) Guo, G., & Qian, Y.-Z. 2016, Phys. Rev. D, 94, 043005, doi: 10.1103/PhysRevD.94.043005
- Guo et al. (2019) Guo, G., Qian, Y.-Z., & Heger, A. 2019, Physics Letters B, 796, 126, doi: 10.1016/j.physletb.2019.07.030
- Hardy & Lasenby (2017) Hardy, E., & Lasenby, R. 2017, JHEP, 02, 033, doi: 10.1007/JHEP02(2017)033
- Hix et al. (1998) Hix, W. R., Khokhlov, A. M., Wheeler, J. C., & Thielemann, F.-K. 1998, ApJ, 503, 332, doi: 10.1086/305968
- Holdom (1986) Holdom, B. 1986, Physics Letters B, 166, 196 , doi: http://dx.doi.org/10.1016/0370-2693(86)91377-8
- Itoh et al. (1996) Itoh, N., Hayashi, H., Nishikawa, A., & Kohyama, Y. 1996, ApJ, 102, 411, doi: 10.1086/192264
- Jones et al. (2016) Jones, S., Röpke, F. K., Pakmor, R., et al. 2016, A&A, 593, A72, doi: 10.1051/0004-6361/201628321
- Jones et al. (2013) Jones, S., Hirschi, R., Nomoto, K., et al. 2013, ApJ, 772, 150, doi: 10.1088/0004-637X/772/2/150
- Kato et al. (2020) Kato, C., Ishidoshiro, K., & Yoshida, T. 2020, Annual Review of Nuclear and Particle Science, 70, annurev, doi: 10.1146/annurev-nucl-040620-021320
- Kippenhahn et al. (1980) Kippenhahn, R., Ruschenplatt, G., & Thomas, H. C. 1980, A&A, 91, 175
- Lodders & Palme (2009) Lodders, K., & Palme, H. 2009, Meteoritics and Planetary Science Supplement, 72, 5154
- Müller et al. (2016) Müller, B., Viallet, M., Heger, A., & Janka, H.-T. 2016, ApJ, 833, 124, doi: 10.3847/1538-4357/833/1/124
- Nelson & Tetradis (1989) Nelson, A. E., & Tetradis, N. 1989, Phys. Lett., B221, 80, doi: 10.1016/0370-2693(89)90196-2
- Nieuwenhuijzen & de Jager (1990) Nieuwenhuijzen, H., & de Jager, C. 1990, A&A, 231, 134
- Paxton et al. (2015) Paxton, B., Marchant, P., Schwab, J., et al. 2015, The Astrophysical Journal Supplement Series, 220, 15, doi: 10.1088/0067-0049/220/1/15
- Raffelt (1996) Raffelt, G. 1996, Stars as laboratories for fundamental physics: The astrophysics of neutrinos, axions, and other weakly interacting particles (University of Chicago Press), 1–664
- Raffelt (1990) Raffelt, G. G. 1990, Phys. Rept., 198, 1, doi: 10.1016/0370-1573(90)90054-6
- Raffelt & Dearborn (1987) Raffelt, G. G., & Dearborn, D. S. P. 1987, Phys. Rev. D, 36, 2211, doi: 10.1103/PhysRevD.36.2211
- Rajpoot (1989) Rajpoot, S. 1989, Phys. Rev. D, 40, 2421, doi: 10.1103/PhysRevD.40.2421
- Rrapaj & Reddy (2016) Rrapaj, E., & Reddy, S. 2016, Phys. Rev., C94, 045805, doi: 10.1103/PhysRevC.94.045805
- Rrapaj et al. (2019) Rrapaj, E., Sieverding, A., & Qian, Y.-Z. 2019, Phys. Rev. D, 100, 023009, doi: 10.1103/PhysRevD.100.023009
- Sung et al. (2019) Sung, A., Tu, H., & Wu, M.-R. 2019, Phys. Rev. D, 99, 121305, doi: 10.1103/PhysRevD.99.121305
- Tanabashi et al. (2018) Tanabashi, M., Hagiwara, K., Hikasa, K., et al. 2018, Phys. Rev. D, 98, 030001, doi: 10.1103/PhysRevD.98.030001
- Weaver et al. (1978) Weaver, T. A., Zimmerman, G. B., & Woosley, S. E. 1978, ApJ, 225, 1021
- Woosley & Heger (2007) Woosley, S., & Heger, A. 2007, Physics Reports, 442, 269 , doi: https://doi.org/10.1016/j.physrep.2007.02.009
- Woosley & Heger (2015) Woosley, S. E., & Heger, A. 2015, ApJ, 810, 34, doi: 10.1088/0004-637X/810/1/34
- Woosley et al. (2002) Woosley, S. E., Heger, A., & Weaver, T. A. 2002, Reviews of Modern Physics, 74, 1015, doi: 10.1103/RevModPhys.74.1015
- Woosley & Weaver (1988) Woosley, S. E., & Weaver, T. A. 1988, Phys. Rep., 163, 79, doi: 10.1016/0370-1573(88)90037-3
- Yadav et al. (2020) Yadav, N., Müller, B., Janka, H. T., Melson, T., & Heger, A. 2020, ApJ, 890, 94, doi: 10.3847/1538-4357/ab66bb
- Yoshida et al. (2019) Yoshida, T., Takiwaki, T., Kotake, K., et al. 2019, ApJ, 881, 16, doi: 10.3847/1538-4357/ab2b9d