Spectra and mean multiplicities of in central 40Ar+45Sc collisions at 13, 19, 30, 40, 75 and 150 beam momenta measured by the NA61/SHINE spectrometer at the CERN SPS \PreprintIdNumberCERN-EP-2021-010 \ShineJournalEur. Phys. J. C \ShineAbstractThe physics goal of the strong interaction program of the NA61/SHINE experiment at the CERN Super Proton Synchrotron (SPS) is to study the phase diagram of hadronic matter by a scan of particle production in collisions of nuclei with various sizes at a set of energies covering the SPS energy range. This paper presents differential inclusive spectra of transverse momentum, transverse mass and rapidity of mesons produced in central 40Ar+45Sc collisions at beam momenta of 13, 19, 30, 40, 75 and 150. Energy and system size dependence of parameters of these distributions – mean transverse mass, the inverse slope parameter of transverse mass spectra, width of the rapidity distribution and mean multiplicity – are presented and discussed. Furthermore, the dependence of the ratio of the mean number of produced pions to the mean number of wounded nucleons on the collision energy was derived. The results are compared to predictions of several models.
The NA61/SHINE Collaboration
A. Acharya 9, H. Adhikary 9, K.K. Allison 25, E.V. Andronov 21, T. Antićić 3, V. Babkin 19, M. Baszczyk 13, S. Bhosale 10, A. Blondel 4, M. Bogomilov 2, A. Brandin 20, A. Bravar 23, W. Bryliński 17, J. Brzychczyk 12, M. Buryakov 19, O. Busygina 18, A. Bzdak 13, H. Cherif 6, M. Ćirković 22, M. Csanad 7, J. Cybowska 17, T. Czopowicz 9,17, A. Damyanova 23, N. Davis 10, M. Deliyergiyev 9, M. Deveaux 6, A. Dmitriev 19, W. Dominik 15, P. Dorosz 13, J. Dumarchez 4, R. Engel 5, G.A. Feofilov 21, L. Fields 24, Z. Fodor 7,16, A. Garibov 1, M. Gaździcki 6,9, O. Golosov 20, V. Golovatyuk 19, M. Golubeva 18, K. Grebieszkow 17, F. Guber 18, A. Haesler 23, S.N. Igolkin 21, S. Ilieva 2, A. Ivashkin 18, S.R. Johnson 25, K. Kadija 3, N. Kargin 20, E. Kashirin 20, M. Kiełbowicz 10, V.A. Kireyeu 19, V. Klochkov 6, V.I. Kolesnikov 19, D. Kolev 2, A. Korzenev 23, V.N. Kovalenko 21, S. Kowalski 14, M. Koziel 6, B. Kozłowski 17, A. Krasnoperov 19, W. Kucewicz 13, M. Kuich 15, A. Kurepin 18, D. Larsen 12, A. László 7, T.V. Lazareva 21, M. Lewicki 16, K. Łojek 12, V.V. Lyubushkin 19, M. Maćkowiak-Pawłowska 17, Z. Majka 12, B. Maksiak 11, A.I. Malakhov 19, A. Marcinek 10, A.D. Marino 25, K. Marton 7, H.-J. Mathes 5, T. Matulewicz 15, V. Matveev 19, G.L. Melkumov 19, A.O. Merzlaya 12, B. Messerly 26, Ł. Mik 13, S. Morozov 18,20, Y. Nagai 25, M. Naskręt 16, V. Ozvenchuk 10, V. Paolone 26, O. Petukhov 18, I. Pidhurskyi 6, R. Płaneta 12, P. Podlaski 15, B.A. Popov 19,4, B. Porfy 7, M. Posiadała-Zezula 15, D.S. Prokhorova 21, D. Pszczel 11, S. Puławski 14, J. Puzović 22, M. Ravonel 23, R. Renfordt 6, D. Röhrich 8, E. Rondio 11, M. Roth 5, B.T. Rumberger 25, M. Rumyantsev 19, A. Rustamov 1,6, M. Rybczynski 9, A. Rybicki 10, S. Sadhu 9, A. Sadovsky 18, K. Schmidt 14, I. Selyuzhenkov 20, A.Yu. Seryakov 21, P. Seyboth 9, M. Słodkowski 17, P. Staszel 12, G. Stefanek 9, J. Stepaniak 11, M. Strikhanov 20, H. Ströbele 6, T. Šuša 3, A. Taranenko 20, A. Tefelska 17, D. Tefelski 17, V. Tereshchenko 19, A. Toia 6, R. Tsenov 2, L. Turko 16, R. Ulrich 5, M. Unger 5, D. Uzhva 21, F.F. Valiev 21, D. Veberič 5, V.V. Vechernin 21, A. Wickremasinghe 26,24, K. Wójcik 14, O. Wyszyński 9, A. Zaitsev 19, E.D. Zimmerman 25, and R. Zwaska 24
1 National Nuclear Research Center, Baku, Azerbaijan
2 Faculty of Physics, University of Sofia, Sofia, Bulgaria
3 Ruđer Bošković Institute, Zagreb, Croatia
4 LPNHE, University of Paris VI and VII, Paris, France
5 Karlsruhe Institute of Technology, Karlsruhe, Germany
6 University of Frankfurt, Frankfurt, Germany
7 Wigner Research Centre for Physics of the Hungarian Academy of Sciences, Budapest, Hungary
8 University of Bergen, Bergen, Norway
9 Jan Kochanowski University in Kielce, Poland
10 Institute of Nuclear Physics, Polish Academy of Sciences, Cracow, Poland
11 National Centre for Nuclear Research, Warsaw, Poland
12 Jagiellonian University, Cracow, Poland
13 AGH - University of Science and Technology, Cracow, Poland
14 University of Silesia, Katowice, Poland
15 University of Warsaw, Warsaw, Poland
16 University of Wrocław, Wrocław, Poland
17 Warsaw University of Technology, Warsaw, Poland
18 Institute for Nuclear Research, Moscow, Russia
19 Joint Institute for Nuclear Research, Dubna, Russia
20 National Research Nuclear University (Moscow Engineering Physics Institute), Moscow, Russia
21 St. Petersburg State University, St. Petersburg, Russia
22 University of Belgrade, Belgrade, Serbia
23 University of Geneva, Geneva, Switzerland
24 Fermilab, Batavia, USA
25 University of Colorado, Boulder, USA
26 University of Pittsburgh, Pittsburgh, USA
1 Introduction
This paper presents measurements of the NA61/SHINE experiment on spectra and mean multiplicities of mesons produced in central 40Ar+45Sc collisions at beam momenta of 13, 19, 30, 40, 75 and 150. These studies form part of the strong interactions program of NA61/SHINE [1, 2] investigating the properties of the onset of deconfinement and searching for the possible existence of a critical point in the phase diagram of strongly interacting matter. The program is mainly motivated by the observation of rapid changes of hadron production properties in central Pb+Pb collisions at about 30 by the NA49 experiment [3, 4], namely a sharp peak in the Kaon to pion ratio ("horn"), the start of a plateau in the inverse slope parameter for Kaons ("step"), and a steepening of the increase of pion production per wounded nucleon with increasing collision energy ("kink"). These findings were predicted as signals of the onset of deconfinement [5]. They were recently confirmed by the RHIC beam energy program [6] and the interpretation is supported by the LHC results (see Ref. [7] and references therein).
The goals of the NA61/SHINE strong interaction program are pursued experimentally by a two dimensional scan in collision energy and nuclear mass number of colliding nuclei. This allows to explore systematically the phase diagram of strongly interacting matter [2]. In particular, the analysis of the existing data within the framework of statistical models suggests that by increasing collision energy one increases temperature and decreases baryon chemical potential of strongly interacting matter at freeze-out [8], whereas by increasing nuclear mass number of the colliding nuclei one decreases the temperature [9, 8, 10].
Within this program NA61/SHINE recorded data on p+p, Be+Be, Ar+Sc, Xe+La and Pb+Pb collisions. Further high statistics measurements of Pb+Pb collisions are planned with an upgraded detector starting in 2022 [11]. Results on spectra and multiplicities have already been published from p+p interactions [12, 13] and 7Be+9Be collisions [14, 15]. The latter provide the basic reference of a light isospin zero system for the study of dense matter effects in collisions of heavier nuclei.
In this paper the so-called method is used for determining production since it provides the largest phase space coverage. This procedure utilizes the fact that negatively charged particles are predominantly mesons with a small admixture (of order 10%) of mesons and anti-protons which can be reliably subtracted.
The paper is organized as follows: after this introduction the experiment is briefly described in Sec. 2. The analysis procedure is discussed in Sec. 3. Section 4 presents the results of the analysis. In Sec. 5 the new measurements are compared to model calculations. The relevance of the new results for the study of the onset of deconfinement is discussed in Sec. 6. A summary and outlook in Sec. 7 closes the paper.
The following variables and definitions are used in this paper. The particle rapidity is calculated in the nucleon-nucleon collision center of mass system (cms), , where and are the particle energy and longitudinal momentum, respectively. The transverse component of the momentum is denoted as , and the transverse mass is defined as , where is the particle mass in GeV. The momentum in the laboratory frame is denoted and the collision energy per nucleon pair in the center of mass by .
The Ar+Sc collisions are selected by requiring a low value of the forward energy - the energy emitted into the region populated by projectile spectators. These collisions are referred to as central collisions and a selection of collisions based on the forward energy is called a centrality selection. Although for Ar+Sc collisions the forward energy is not tightly correlated with the impact parameter of the collision, the terms central and centrality are adopted following the convention widely used in heavy-ion physics.
2 NA61/SHINE detector
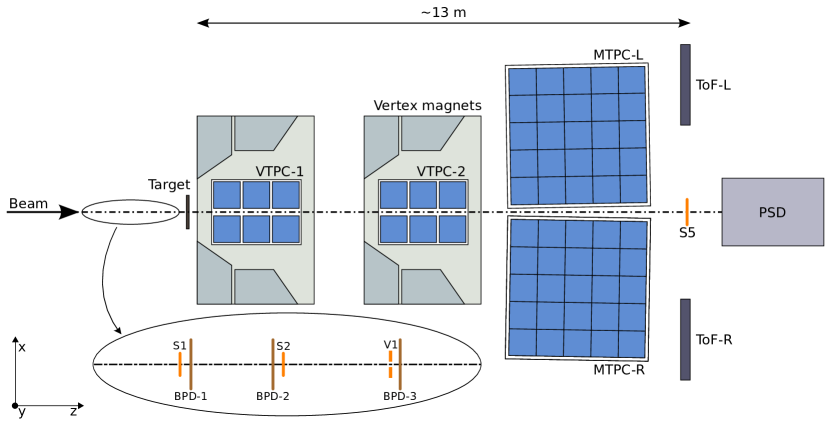
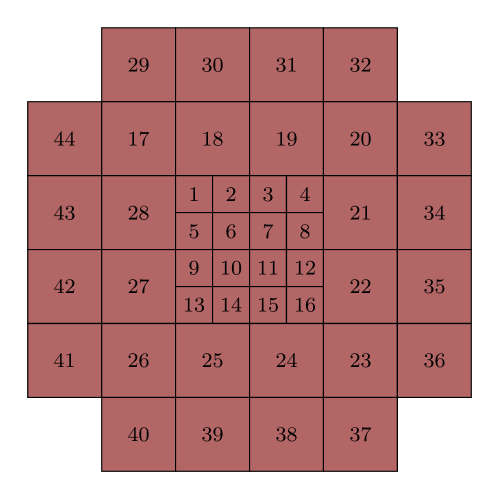
The NA61/SHINE detector (see Fig. 1) is a large-acceptance hadron spectrometer situated in the North Area H2 beam-line of the CERN SPS [1]. The main components of the detection system used in the analysis are four large volume Time Projection Chambers (TPC). Two of them, called Vertex TPCs (VTPC), are located downstream of the target inside superconducting magnets with maximum combined bending power of 9 Tm. The magnetic field was scaled down in proportion to the beam momentum in order to obtain similar phase space acceptance at all energies. The main TPCs (MTPC) and two walls of pixel Time-of-Flight (ToF-L/R) detectors are placed symmetrically on either side of the beamline downstream of the magnets. The TPCs are filled with Ar:CO2 gas mixtures in proportions 90:10 for the VTPCs and 95:5 for the MTPCs. The Projectile Spectator Detector (PSD) is positioned 20.5 m (16.7 m) downstream of the MTPCs at beam momenta of 75 and 150 (13, 19, 30, 40), centered in the transverse plane on the deflected position of the beam. Moreover a brass cylinder of 10 cm (30 – 150) or 5 cm (19A GeV/c) length and 5 cm diameter (degrader) was placed in front of the center of the PSD in order to reduce electronic saturation effects and shower leakage from the downstream side.
Primary beams of fully ionized 40Ar nuclei were extracted from the SPS accelerator at beam momenta of 13, 19, 30, 40, 75 and 150. Two scintillation counters, S1 and S2, provide beam definition, together with a veto counter V1 with a 1 cm diameter hole, which defines the beam before the target. The S1 counter provides also the timing reference (start time for all counters). Beam particles are selected by the trigger system requiring the coincidence T1 = . Individual beam particle trajectories are precisely measured by the three beam position detectors (BPDs) placed upstream of the target [1]. Collimators in the beam line were adjusted to obtain beam rates of /s during the 10 s spill and a cycle time of 32.4 s.
The target was a stack of 2.5 x 2.5 cm2 area and 1 mm thick 45Sc plates of 6 mm total thickness placed 80 cm upstream of VTPC-1. Impurities due to other isotopes and elements were measured to be 0.3 %. Their influence on the pion multiplicity was estimated to be an increase by less than 0.2 % caused by the admixture of heavier elements [16]. No correction was applied for this negligible contamination. Data were taken with target inserted (denoted I) and target removed (denoted R).
Interactions in the target are selected with the trigger system by requiring an incoming 40Ar ion and a signal below that of beam ions from S5, a small 2 cm diameter scintillation counter placed on the beam trajectory behind the MTPCs. This minimum bias trigger is based on the breakup of the beam ion due to interactions in and downstream of the target. In addition, central collisions were selected by requiring an energy signal below a set threshold from the 16 central modules of the PSD which measure mainly the energy carried by projectile spectators. The cut was set to retain only the events with the 30% smallest energies in the PSD. The event trigger condition thus was T2 = T1. The statistics of recorded events are summarized in Table 1.
| () | (GeV) | Recorded event triggers | Number of selected events | Fraction of background events after selection cuts |
|---|---|---|---|---|
| 13 | 5.1 | |||
| 19 | 6.1 | |||
| 30 | 7.6 | |||
| 40 | 8.8 | |||
| 75 | 11.9 | |||
| 150 | 16.8 |
3 Analysis procedure
This section starts with a brief overview of the data analysis procedure and the applied corrections. It also defines to which class of particles the final results correspond. A description of the calibration and the track and vertex reconstruction procedure can be found in Ref. [12].
The analysis procedure consists of the following steps:
-
(i)
application of event and track selection criteria,
-
(ii)
determination of spectra of negatively charged hadrons using the selected events and tracks,
-
(iii)
evaluation of corrections to the spectra based on experimental data and simulations,
-
(iv)
calculation of the corrected spectra and its parameters,
-
(v)
calculation of statistical and systematic uncertainties.
Corrections for the following biases were evaluated and applied when significant:
-
(i)
contribution from off-target interactions,
-
(ii)
procedure of selecting central collisions,
-
(iii)
geometrical acceptance,
-
(iv)
contribution of particles other than primary (see below) negatively charged pions produced in Ar+Sc interactions,
-
(v)
losses of produced negatively charged pions due to their decays and secondary interactions.
Correction (i) was found to be negligible and was therefore not applied. Corrections (ii)-(v) are estimated by simulations. Events were generated with the Epos1.99 model (version CRMC 1.5.3) [17, 18, 19], passed through detector simulation employing the Geant3 package [20] and then reconstructed by the standard NA61/SHINE program chain. Event selection in the simulation was based on the number of projectile spectator nucleons which is available from the Epos1.99 model.
The final results refer to produced in central Ar+Sc interactions by strong interaction processes and in electromagnetic decays of produced hadrons. Such hadrons are referred to as primary hadrons. The definition of central collisions is given in Sec. 3.1.
3.1 Central collisions
A short description of the procedure defining central collisions is given below. For more details see Ref. [21].
Final results presented in this paper refer to the 5% of Ar+Sc collisions with the lowest value of the forward energy (central collisions). The quantity is defined as the total energy in the laboratory system of all particles produced in Ar+Sc collisions via strong and electromagnetic processes in the forward momentum region defined by the acceptance map in Ref. [22]. Final results on central collisions, derived using this procedure, allow a precise comparison with predictions of models without any additional information about the NA61/SHINE setup and used magnetic field. Using this definition the mean number of wounded nucleons was calculated within the Wounded Nucleon Model (WNM) [23] as implemented in Epos.
T2 trigger
150
75A, 40A, 30
19A, 13
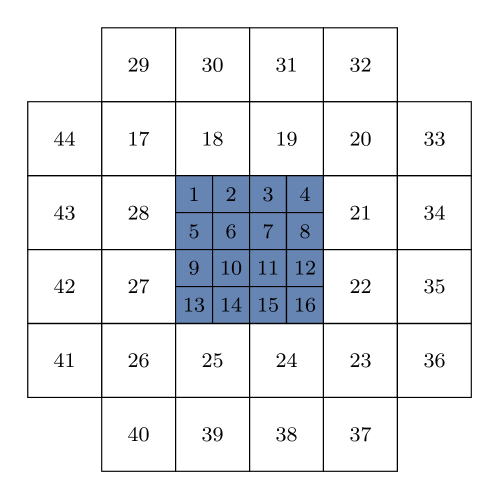
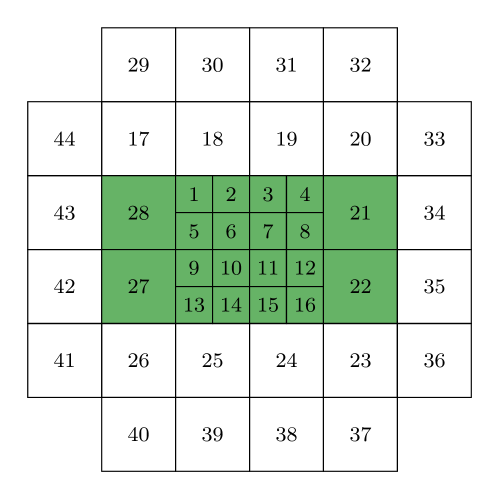
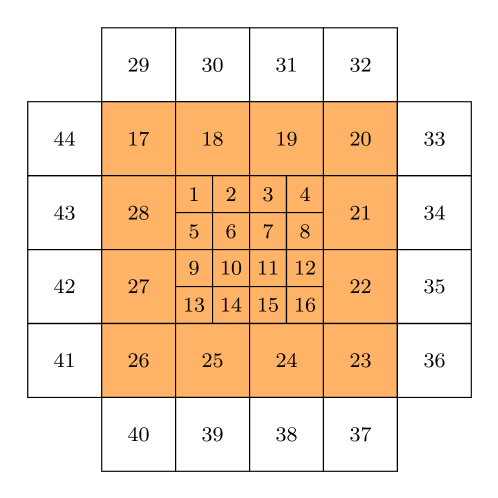
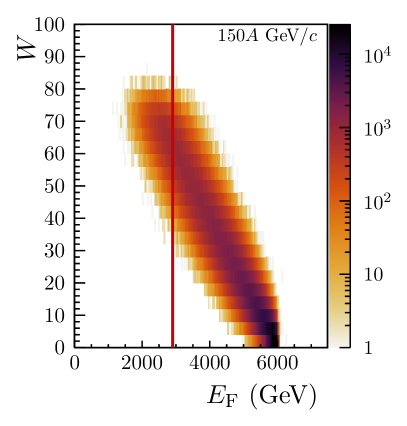
For analysis of the data the event selection was based on the 5% of collisions with the lowest value of the energy measured by a subset of PSD modules (see Fig. 2) in order to optimize the sensitivity to projectile spectators. The acceptance resulting from the definition of the forward energy corresponds closely to the acceptance of this subset of PSD modules.
Online event selection by the hardware trigger (T2) used a threshold on the sum of electronic signals from the 16 central modules of the PSD set to accept 30% of the inelastic interactions. Measured distributions of for minimum-bias and T2 trigger selected events, calculated in the offline analysis, are shown in Fig. 3 at beam momenta of 19 and 150, respectively. The accepted region corresponding to the 5% most central collisions is indicated by shading. The minimum-bias distribution was obtained using the data from the beam trigger T1 with offline selection of events by requiring an event vertex in the target region. A properly normalized spectrum for target removed events was subtracted.
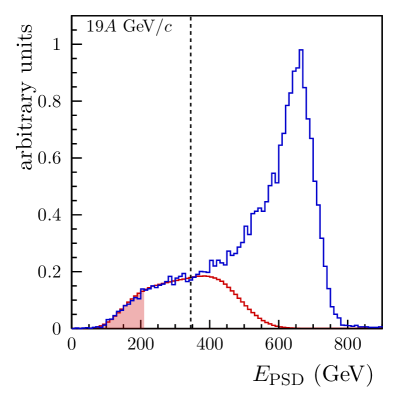
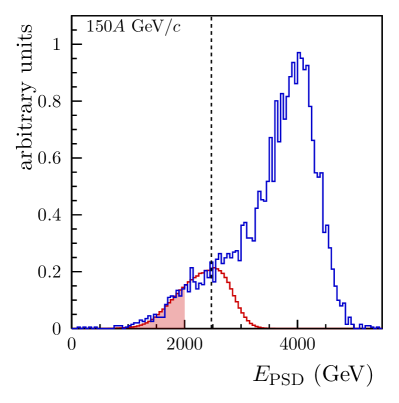
T1 trigger T2 trigger (scaled) ■ 5% centrality Normalization region
The forward energy cannot be measured directly. However, both and can be obtained from simulations using the Epos1.99 (version CRMC 1.5.3) [17, 18, 19] model. A global factor (listed in Table 2) was then calculated as the ratio of mean negatively charged pion multiplicities obtained with the two selection procedures in the 5% most central events. The resulting factors range from 1.002 to 1.005 and correspond to only a small correction compared to the systematic uncertainties of the measured particle multiplicities. A possible dependence of the scaling factor on rapidity and transverse momentum was neglected. The corrections () are negligibly small compared to the systematic uncertainties of the measured particle multiplicities and are therefore not applied in the calculation of yields and neglected in the quoted systematic uncertainties.
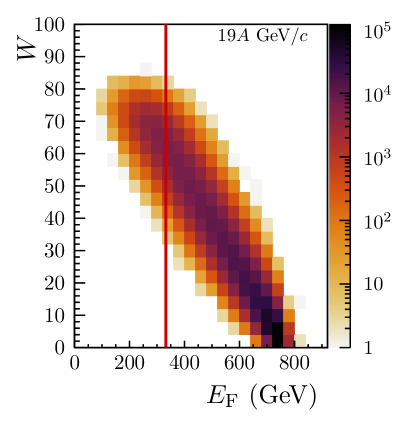
Finally, events generated with the Epos code with its implementation of the Wounded Nucleon Model [19] were used to estimate the average number of wounded nucleons for the 5% of events with the smallest number of spectator nucleons and with the smallest value of . For the latter selection the average impact parameter was obtained as well. Results are listed in Table 2. Example distributions of events in the plane for 19 and 150 beam momenta are shown in Fig. 4. These distributions are quite broad and emphasize the importance of proper simulation of the centrality selection when comparing model calculations with the experimental results. For comparison was also calculated from the GLISSANDO model which uses a different implementation of the Wounded Nucleon Model [24]. The resulting pion multiplicities, also listed in Table 2, differ by about 5%. This uncertainty is not shown in the plots of the results.
| Momentum () | 13 | 19 | 30 | 40 | 75 | 150 | |
|---|---|---|---|---|---|---|---|
| Epos WNM | |||||||
| GLISSANDO | |||||||
| Epos | |||||||
3.2 Event and track selection
3.2.1 Event selection
Central Ar+Sc events were selected using the following criteria:
-
(i)
no offtime beam particle detected within a time window of 4s around the trigger particle,
-
(ii)
beam particle trajectory measured in at least three planes out of four of BPD-1 and BPD-2 and in both planes of BPD-3,
-
(iii)
a well reconstructed interaction vertex with z position (fitted using the beam trajectory and TPC tracks) not farther away than 10 cm from the center of the Sc target (see Fig. 5),
-
(iv)
an upper cut on the energy in order to select the 5 % collisions with the lowest .
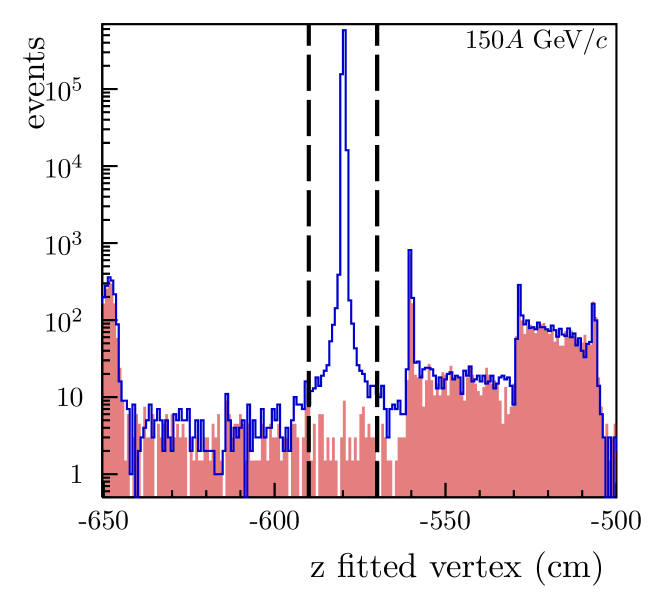
Target inserted ■ Target removed Acceptance region
The reconstructed vertex distribution for target-removed events satisfying the above event cuts is shown in Fig. 5 by the shaded histogram. The latter was normalized to the same integral number of incident beams as used for the target-inserted data. One finds that within the acceptance cut region as indicated by vertical dashed lines in Fig. 5 the fraction of background events is smaller than and was therefore neglected.
The event statistics after applying the selection criteria are summarized in Table 1.
3.2.2 Track selection
In order to select tracks of primary charged hadrons and to reduce the contamination of tracks from secondary interactions and weak decays, the following track selection criteria were applied:
-
(i)
track momentum fit at the interaction vertex should have converged,
-
(ii)
fitted x component of track momentum is negative. This selection minimizes the angle between the track trajectory and the TPC pad direction for the chosen magnetic field direction, reducing uncertainties of the reconstructed cluster position, energy deposition and track parameters,
-
(iii)
total number of reconstructed points on the track should be greater than 30,
-
(iv)
sum of the number of reconstructed points in VTPC-1 and VTPC-2 should be greater than 15,
-
(v)
the distance between the track extrapolated to the interaction plane and the interaction point (impact parameter) should be smaller than 4 cm in the horizontal (bending) plane and 2 cm in the vertical (drift) plane,
-
(vi)
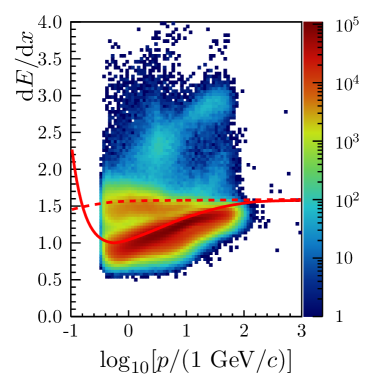
electron tracks were excluded by a cut on the particle energy loss d/dx in the TPCs (see Fig. 6).
e-
The analysis was performed in and bins. The bin sizes were selected taking into account the statistical uncertainties and the resolution of the momentum reconstruction [12]. Corrections as well as statistical and systematic uncertainties were calculated for each bin.
3.3 Corrections
Uncorrected yields of negatively charged hadrons per event after all event and track cuts divided by bin dimensions are shown in Fig. 7. In order to determine the mean multiplicity of primary mesons produced in central Ar+Sc collisions a set of corrections was applied to the extracted raw yields. The main biasing effects are detector acceptance, loss of events due to the cut on reconstructed vertex position, track selection cuts, reconstruction efficiency, contributions of particles from weak decays (feed-down), and contribution of primary hadrons other than negatively charged pions (mostly mesons). Contamination from events occurring outside the target was negligible.

A simulation of the NA61/SHINE detector is used to correct the data for acceptance, reconstruction efficiency, feed-down and contamination from re-interactions of produced particles. Only Ar+Sc interactions in the target material were simulated and reconstructed. The Epos model [17, 18, 19] was selected to generate the primary interactions. A Geant3 based program chain was used to track particles through the spectrometer, generate decays and secondary interactions and simulate the detector response (for more detail see Ref. [12]). Simulated events were then reconstructed using the standard NA61/SHINE reconstruction chain and reconstructed tracks were matched to the simulated particles based on the cluster positions. Hadrons which were not produced in the primary interaction can amount to a significant fraction of the selected track sample. Thus a careful effort was undertaken to evaluate and subtract this contribution.
Since Epos provides only an approximate description of the measurements of particle production in Ar+Sc collisions, a data-based effort was made to improve the estimate of contamination from wrongly accepted as coming from the primary interaction. Yields of misidentified Kaons were estimated from preliminary results of NA61/SHINE (see Ref. [25]) on production and the contribution of from decays of hyperons was estimated from published results of other experiments (see Ref. [26]). The relative effect of such tuning of the yields of negatively charged hadrons was below 5% for majority of the bins and did not exceed 7% for all the beam momenta.
Backward rapidity bins with relative statistical uncertainties exceeding 20% in case of the higher beam momenta (150 and 75) and 30% in case of the lower beam momenta (40, 30, 19 and 13) were not used since they suffer from limited backward rapidity acceptance of the detector.
The correction factor , based on the event and detector simulation was calculated for each and bin as:
| (1) |
where is the mean multiplicity of reconstructed negatively charged particles after the event and track selection criteria and is the mean multiplicity of primary negatively charged pions from the centrality selected Ar+Sc collisions generated by the Epos model.
The corrected multiplicities were then calculated as:
| (2) |
Double differential distributions of per event multiplicities are then given by:
| (3) |
where are the corrected per event multiplicities for in the (, ) bins with size and . The distributions were calculated with an analogous formula.
3.4 Statistical uncertainties
Statistical uncertainties of the yields receive contributions from the finite statistics of both the data and the correction factors derived from the simulations. The contribution from the statistical uncertainty of the data is much larger than that from the correction factors which was therefore neglected. The statistical uncertainty of the data was calculated assuming a Poisson probability distribution for the number of entries in each , bin.
3.5 Systematic uncertainties
Systematic uncertainties presented in this paper were calculated taking into account contributions from the following effects:
-
(i)
Possible biases which were not corrected for. These are:
-
(a)
a possible bias due to the cut applied to reject electron tracks,
-
(b)
a possible bias due to the removal of events with off-time beam particles close in time to the trigger particle.
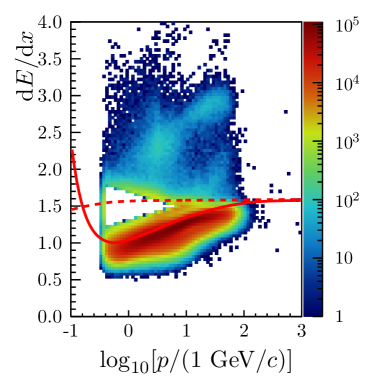
Their magnitude was estimated by varying the values of the corresponding cut. The values of the selected band around the Bethe-Bloch function was changed by units (where 1 corresponds to a minimum ionizing particle, and 0.04 is a typical width of the distribution for ), and the rejection time window was changed to s and s. The systematic uncertainty was estimated as half of the maximum absolute difference between multiplicities when varying the cut values.
-
(a)
-
(ii)
Uncertainty of the correction for the track selection cuts used for data and Monte Carlo data selection were estimated by removing the impact parameter cut and varying the minimum number of required points by . The observed changes suggest the potential bias is around 1%.
-
(iii)
Uncertainty of the correction for contamination of the primary mesons by daughters of decays and re-interactions. It was estimated from simulations using the Epos model where the production rates of parents were adjusted to extrapolations of published data (see Ref. [26]). The systematic uncertainty was estimated as of the correction value.
-
(iv)
Uncertainty of correction for the contamination of particles other than in negatively charged hadrons spectrum. The value of the uncertainty was assumed as 15% of the simulated contribution of , and to the total number of negatively charged hadrons.
Values of are listed in the table 4. The total systematic uncertainty was calculated by adding in quadrature the individual contributions. Note that systematic biases in different bins are correlated, whereas statistical fluctuations are independent.
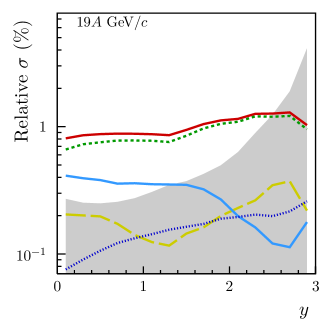
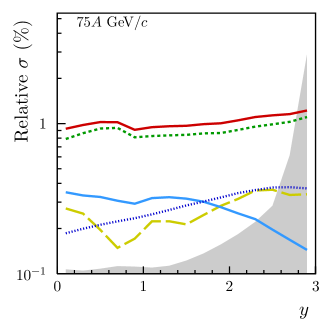
Statistical and systematic uncertainties for all six beam momenta are shown as a function of rapidity in Fig. 8.


■
4 Experimental results
This section presents results on negatively charged pion spectra at 13, 19, 30, 40, 75 and 150 beam momentum in the 5% most central 40Ar+45Sc collisions with statistical and systematic uncertainties. The spectra refer to pions produced by strong interaction processes and in electromagnetic decays of produced hadrons. Comparisons of the new measurements of spectra, their parameters and mean multiplicities of mesons in central Ar+Sc collisions with predictions of the Epos1.99 [17, 18, 19], Urqmd [27, 28] and Hijing [29] models are presented. In the model calculations connected with spectra the selection of the 5% most central collisions was based on the number of projectile spectator nucleons.
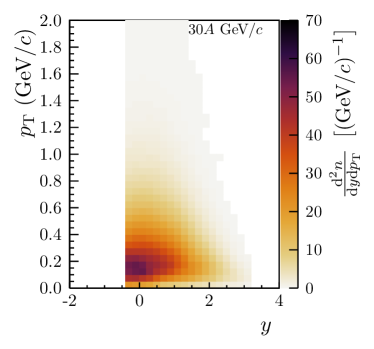
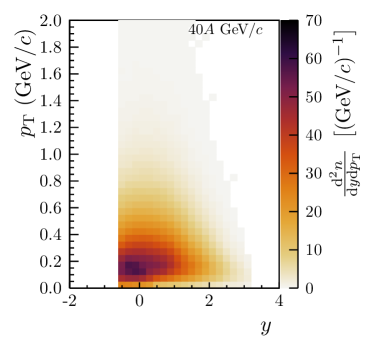
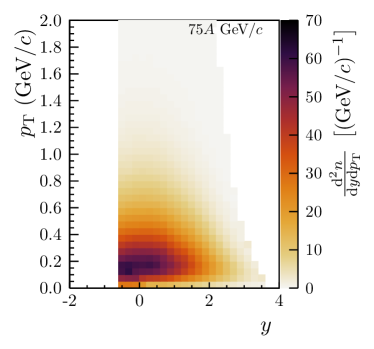
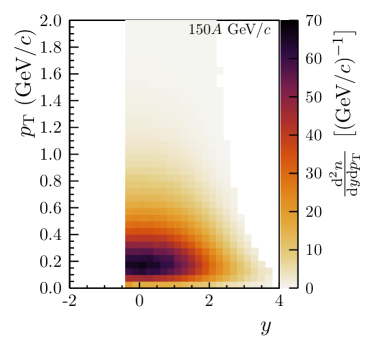
4.1 Double-differential (, ) and (, ) yields
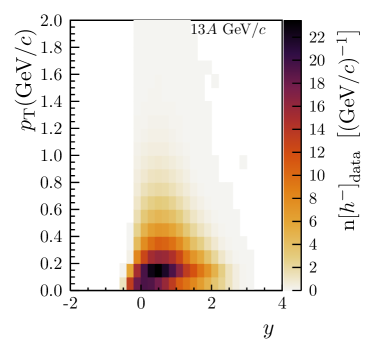
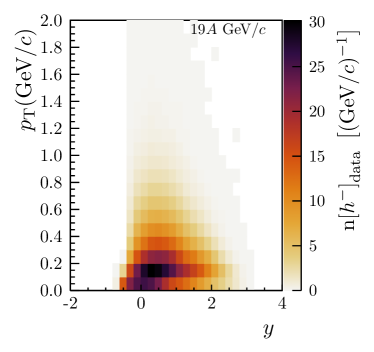
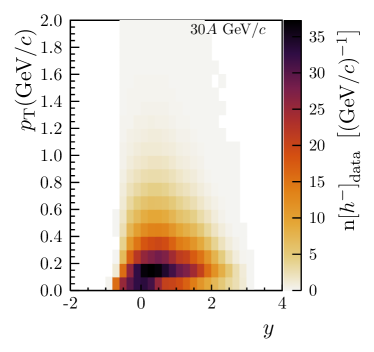
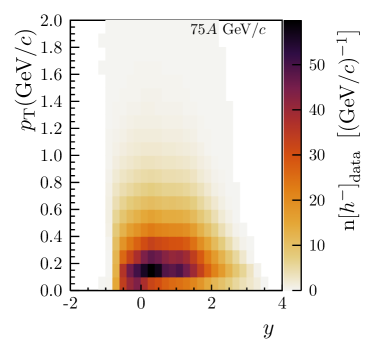
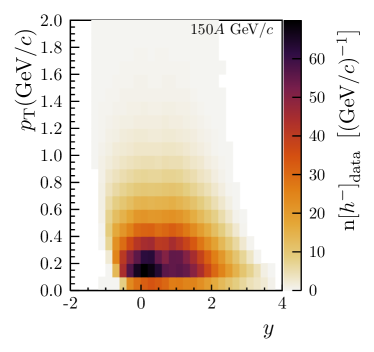
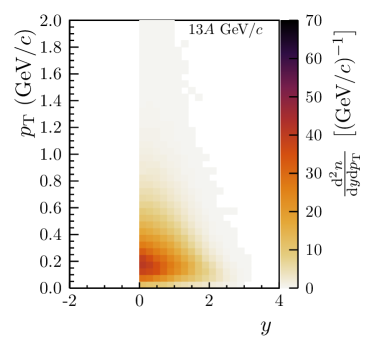
Figure 9 shows fully corrected double-differential distributions of measured in central Ar+Sc collisions and illustrates the wide phase space acceptance of the detector. The distributions were calculated using an analogous procedure. From these results spectra of transverse momentum , transverse mass , rapidity , as well as total multiplicities were derived.

4.2 Transverse momentum distributions
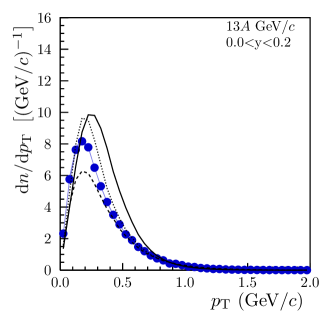
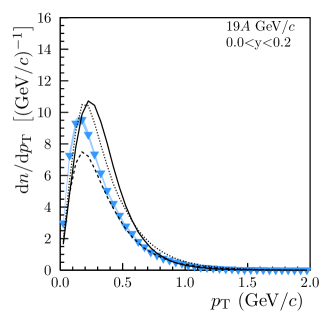
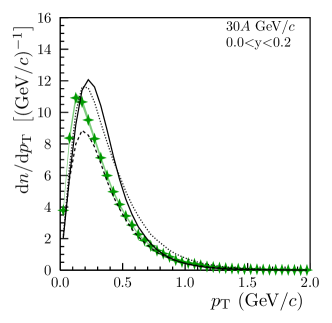
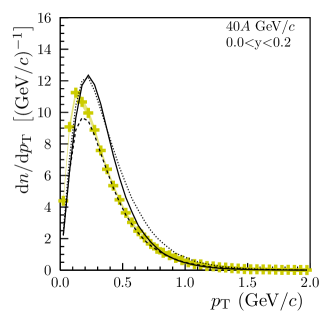

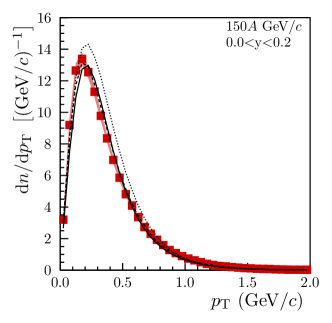
Figure 10 shows measured transverse momentum spectra at mid-rapidity for all six beam momenta. The results are compared with Epos, Urqmd and Hijing model calculations. The spectra differ significantly from the models’ predictions, especially for lower beam momenta, where none of the models can describe the data well. For higher beam momenta Epos and Urqmd describe data with reasonable accuracy.
4.3 Transverse mass distributions
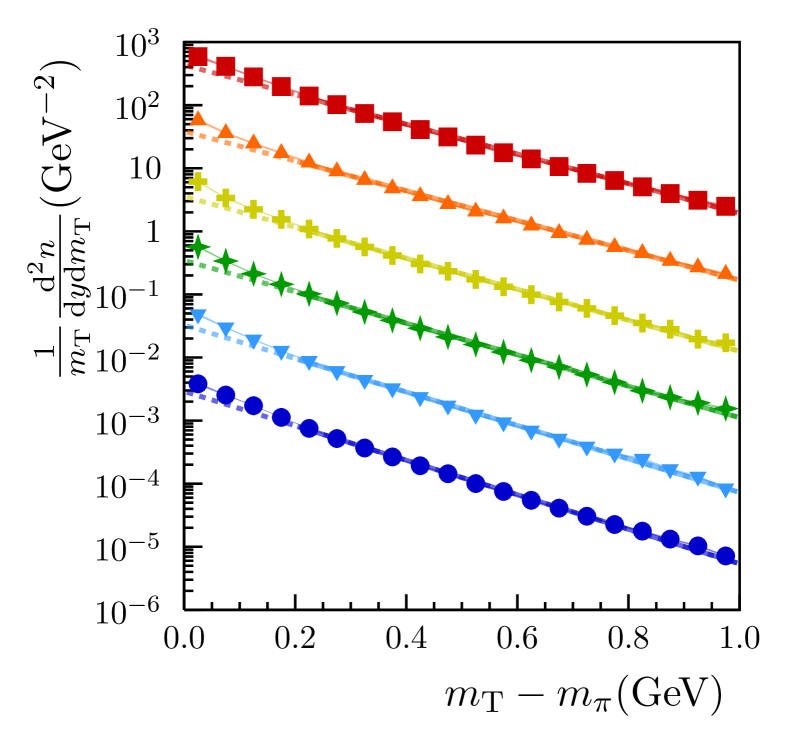
Spectra of transverse mass at mid-rapidity () are shown in Fig. 11. For further comparisons a function
| (4) |
was fitted in the range GeV where no strong contributions from resonance decays and radial flow are expected. The fitted parameters were the normalization and the inverse slope parameter . The results of the fits are indicated by lines in Fig. 11. The deviation of the measurements from the exponential shape for larger values of is indicative of collective transverse flow [9] whereas the excess below the fit range can be explained by the contribution of resonance decay products to the spectrum.
-
■
150
-
▲
75
-
✚
40
-
✦
30
-
▼
19
-
●
13
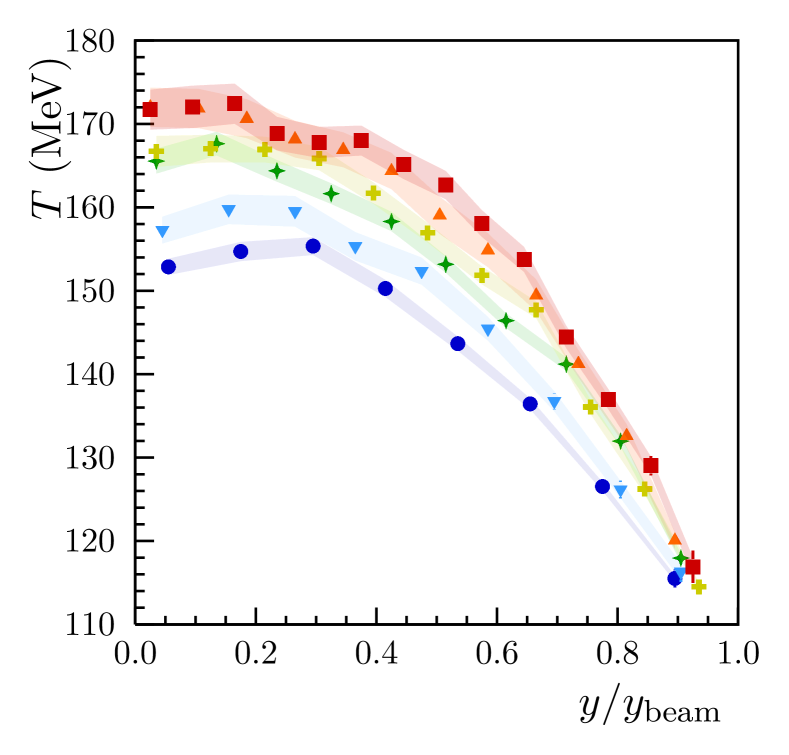
Figure 12 presents the dependence of the inverse slope parameter on the rapidity for the different beam energies. One finds the well known decrease towards larger rapidities. Moreover, an increase of the values of by about 20 MeV is seen from 13 to 150 beam momentum.
-
■
150
-
▲
75
-
✚
40
-
✦
30
-
▼
19
-
●
13
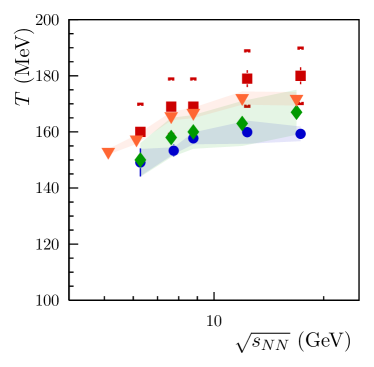
Inverse slope parameters fitted at mid-rapidity () in the range GeV are plotted versus for inelastic p+p, 5% most central Ar+Sc, central Be+Be and central Pb+Pb collisions in Fig. 13 (left). As seen from the plot, the values increase significantly (10 - 15 MeV) for all three reactions. The new Ar+Sc results are close to those for Pb+Pb reactions but about 15 MeV higher than for p+p and Be+Be reactions. Furthermore, Fig. 13 (right) shows that Epos model predictions for Ar+Sc collisions are lower than the NA61/SHINE measurements and stay even below the measurements in inelastic p+p interactions. Predictions of Urqmd exhibit a non-monotonic behavior. They lie lower than measurements at low beam momenta and higher at high beam momenta. Hijing shows a concave behavior and unsatisfactory agreement with measurements.
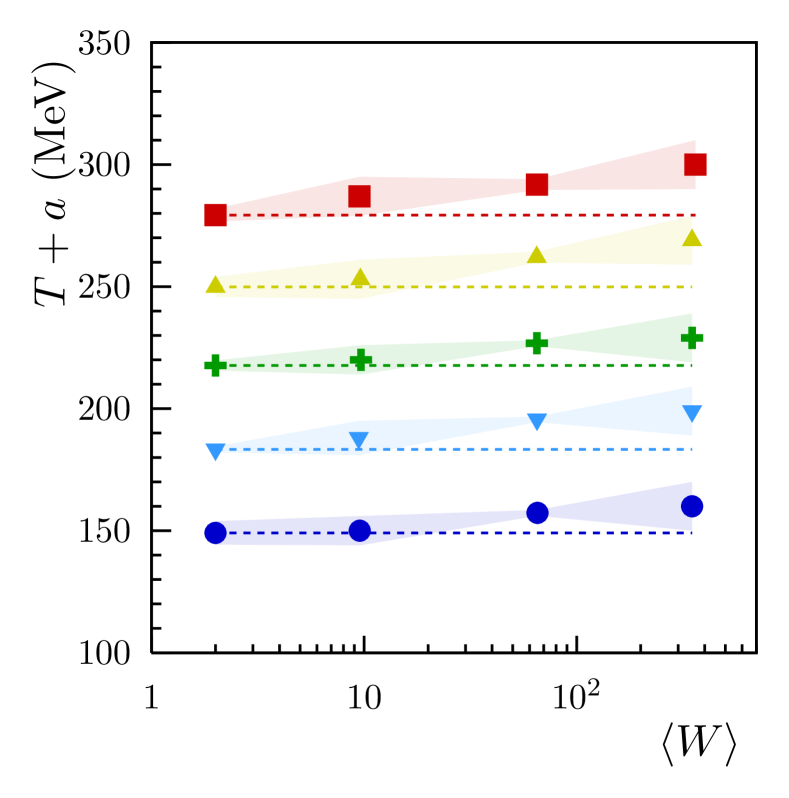
Figure 14 presents the inverse slope parameter plotted versus the number of wounded nucleons which are a measure of the initial volume of the collision system. Although the uncertainties are large, the measurements show a modest monotonic rise with increasing system size for all the beam momenta.
-
■
150, MeV
-
▲
75, MeV
-
✚
40, MeV
-
▼
30, MeV
-
●
19, MeV
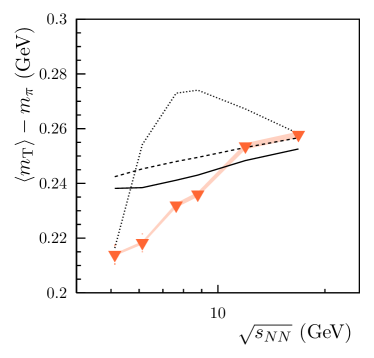
As the distributions are not strictly exponential it may be better to characterize them by their average values . These were calculated by summing the -weighted distributions and adding an extrapolation for the region GeV based on the exponential fits Eq. 4. The results are plotted at mid-rapidity versus the collision energy in Fig. 15. The differences between p+p and central Be+Be, Ar+Sc and central Pb+Pb reactions are compatible within their uncertainties. Ar+Sc, Be+Be and p+p measurements show a rise with increasing collision energy which is more pronounced for Ar+Sc. Due to the large uncertainties for the Pb+Pb data a significant discrimination between rise and constancy is not possible for this reaction. Epos and Urqmd model predictions show a slope that is more similar to p+p interactions and less steep than for Ar+Sc with Urqmd covering two highest collision energies. Hijing shows a concave behavior with extreme points matching the measurements.

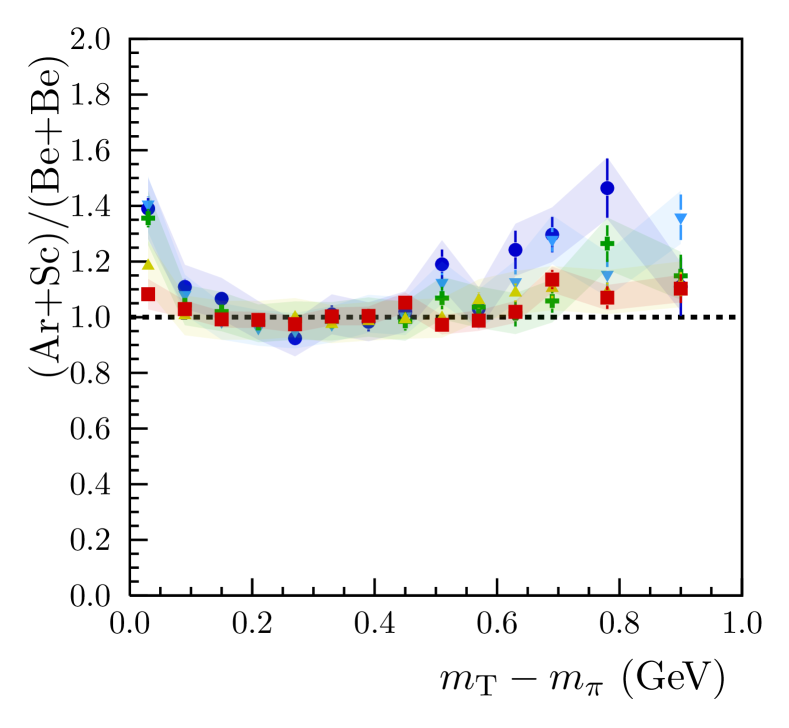
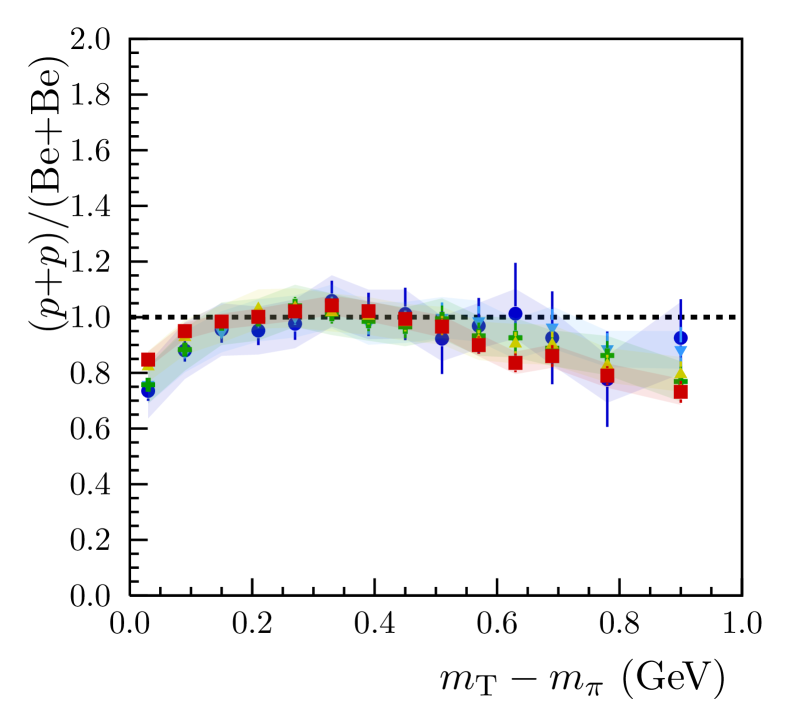
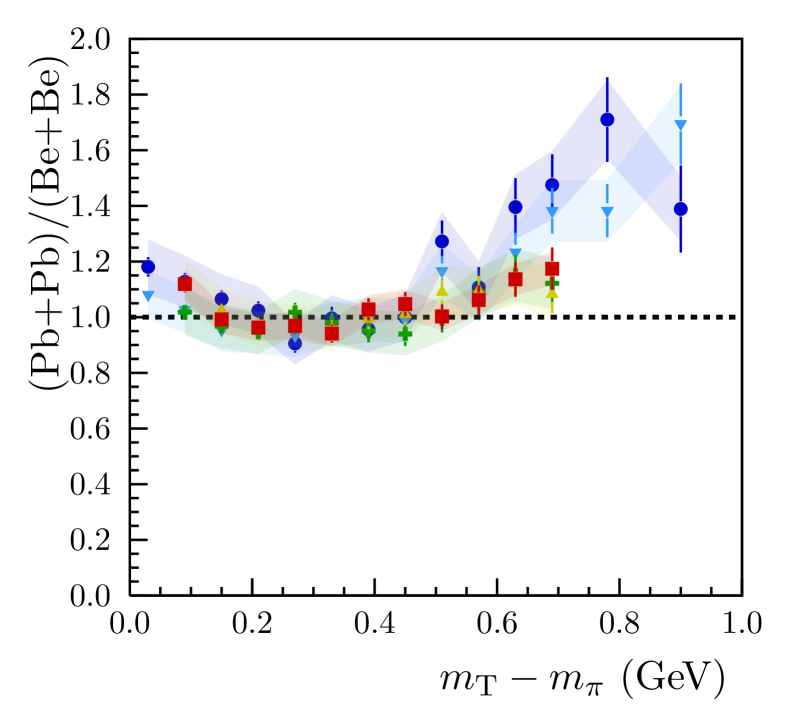
In order to compare the detailed features of the spectra, the ratios of the scaled differential yields from p+p, Ar+Sc and Pb+Pb reactions to isospin symmetric Be+Be reference are plotted in Fig. 16. From the three panels of the figure one may conclude that compared to inelastic p+p collisions nucleus+nucleus interactions show a slightly concave behavior and a significant enhancement at small values of . One clearly observes a hardening of the spectra at high values of and an increased peak at low for Ar+Sc and Pb+Pb collisions, most likely due to radial expansion flow and decays of strongly decaying resonance states, respectively.
-
■
150
-
▲
75
-
✚
40
-
▼
30
-
●
19
4.4 Rapidity distributions and mean multiplicities
The NA61/SHINE experimental apparatus is characterized by large, but limited acceptance. In order to compute the rapidity distribution and mean multiplicity, one needs to extrapolate the measured data to unmeasured regions.
First, the distributions in each rapidity bin were extrapolated from the edge of acceptance to = 2 , using the exponential form
| (5) |
where and are fit parameters. To obtain , the measured data bins are summed and the integral of the extrapolated curve is added:
| (6) |
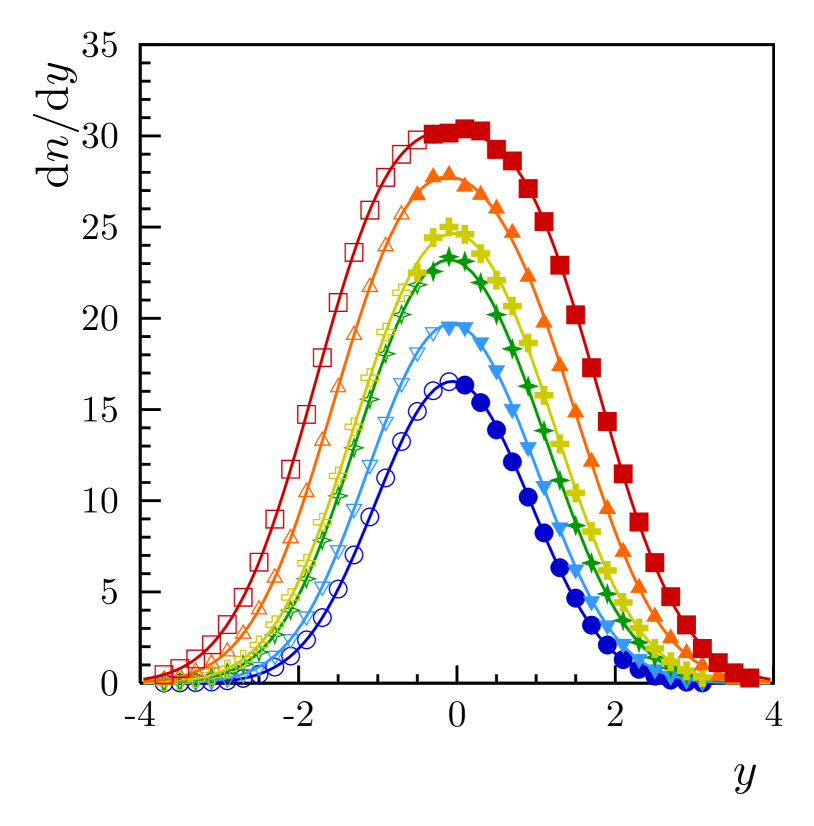
The results are shown by the solid data points in Fig. 17 together with Epos, Urqmd and Hijing model predictions. Figure 18 shows the results for all beam momenta combined into one plot.
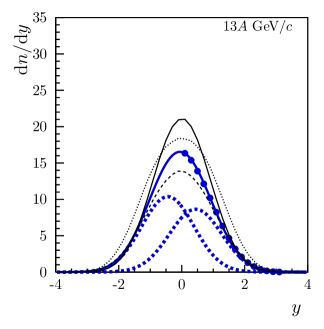
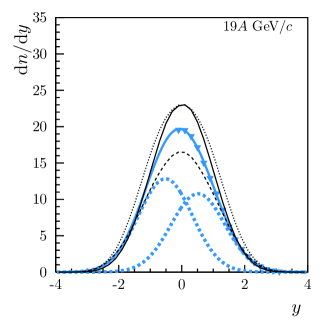

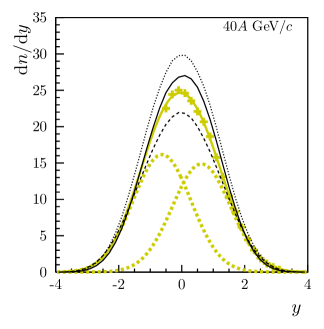
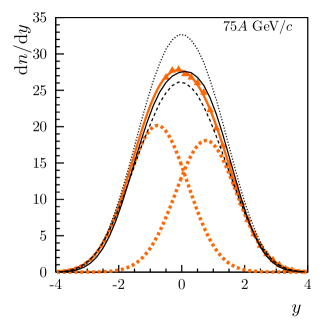
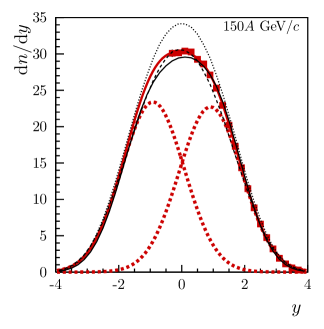
In a second step the rapidity spectra are extrapolated to the missing rapidity acceptance. The event trigger requires small energy emitted into the projectile spectator region but puts no constraints on the target spectators. This together with the different number of nucleons in the Ar and Sc nucleus might cause some forward-backward asymmetry of the rapidity distribution. Therefore, the sum of two symmetrically displaced Gaussians – related to projectile and target contributions – was fitted to the distributions:
| (7) |
where and are absolute and relative amplitudes, is the displacement from center-of-mass rapidity and is the common width. The fitted two Gaussians are plotted as dashed colored curves in Fig. 17. The figure shows that the asymmetry between the amplitudes of the two Gaussians increases with decreasing beam momentum from 0.97 to 0.84 between 150 and 19 beam momentum. This contrasts with the behavior observed for Be+Be collisions [14]. At 13 there is no acceptance for and the value 0.83 had to be determined from extrapolation of results at higher energies. The resulting values of the fitted parameters are presented in Table 3. The r.m.s. widths of the rapidity distributions differ by less than 5% from the widths approximated by a single Gaussian function.
| Momentum () | 13 | 19 | 30 | 40 | 75 | 150 |
|---|---|---|---|---|---|---|
| 0.833 | 0.840 | 0.820 | 0.920 | 0.898 | 0.971 | |
| 0.0024 | 0.0110 | 0.0046 | 0.0038 | 0.0022 | 0.0052 | |
| 0.2062 | 0.2275 | 0.1632 | 0.1284 | 0.1575 | 0.1988 | |
| 0.441 | 0.518 | 0.583 | 0.627 | 0.772 | 0.913 | |
| 0.0293 | 0.0079 | 0.0038 | 0.0030 | 0.0014 | 0.0020 | |
| 0.3402 | 0.2587 | 0.2415 | 0.2201 | 0.2737 | 0.3356 | |
| 0.940 | 0.999 | 1.077 | 1.114 | 1.232 | 1.351 | |
| 0.0156 | 0.0061 | 0.0033 | 0.0028 | 0.0016 | 0.0024 | |
| 0.0891 | 0.0824 | 0.0868 | 0.0944 | 0.1026 | 0.1350 |
-
■
150
-
▲
75
-
✚
40
-
✦
30
-
▼
19
-
●
13
The total mean multiplicity was calculated using the formula:
| (8) |
where to is the interval of measurements for . The results are presented in Table 4. Statistical uncertainties were obtained by propagating the statistical uncertainties of the spectra.
| Momentum () | 13 | 19 | 30 | 40 | 75 | 150 |
|---|---|---|---|---|---|---|
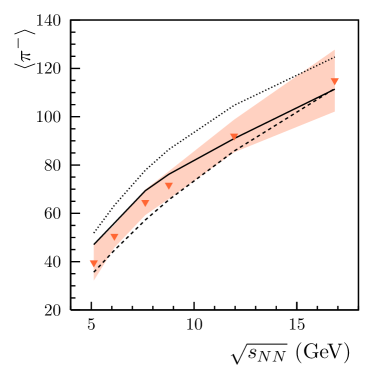
| 39.6 | 50.6 | 64.6 | 71.7 | 92.0 | 114.9 | |
| 0.041 | 0.222 | 0.121 | 0.100 | 0.084 | 0.216 | |
| 7.3 | 4.6 | 5.3 | 5.7 | 6.7 | 12.8 |
The systematic uncertainty connected with the extrapolation procedure was estimated varying the parametrization of the rapidity distribution. In particular, widths and the positions of projectile and target Gaussians were assumed to be independent, i.e. separate parameters , and , were fitted. The uncertainty of each fitting parameter and the mean multiplicity was calculated as a standard deviation from the value calculated for the standard values of all parameters. The definition of was generalized to take into account that the width and the shift of the projectile and target Gaussians can be different and is given by the formula:
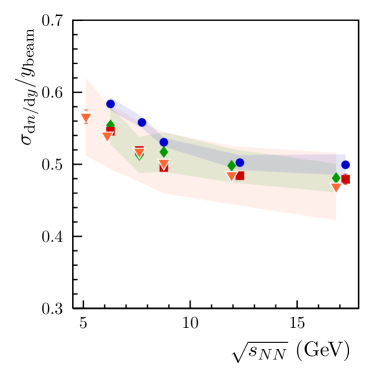
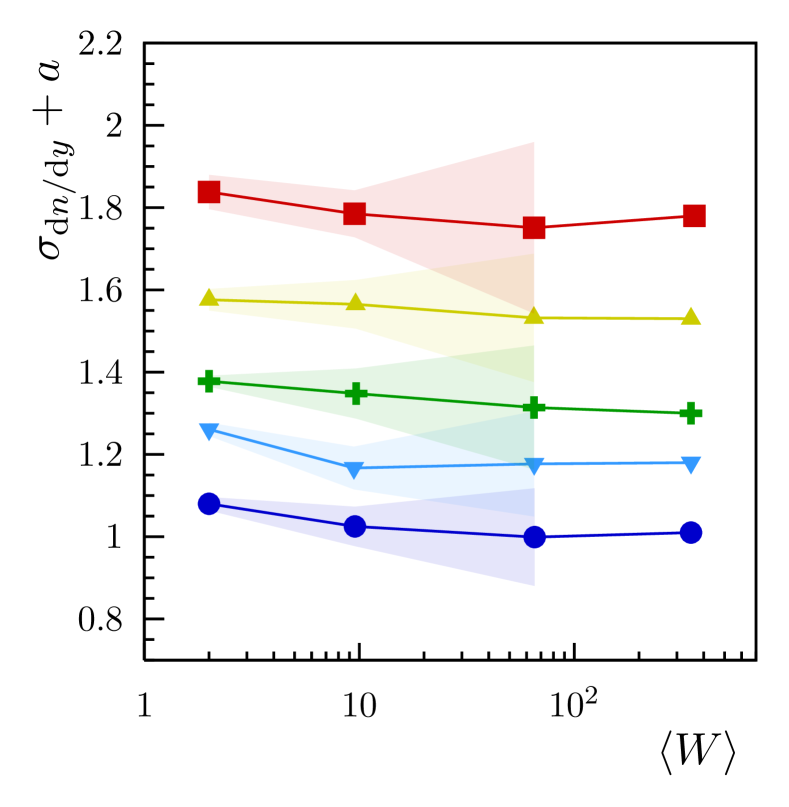
Experimental data on the width of the rapidity distributions of mesons produced in central nucleus-nucleus collisions and inelastic nucleon-nucleon interactions as function of the collision energy are presented in Fig. 19. Since the p+p collision system is not isospin symmetric the isospin average was plotted for comparison. These results are referred to as results for nucleon-nucleon (N+N) collisions [30]. One observes that the width normalized to the beam rapidity decreases slowly with increasing collision energy. When correcting the p+p data for the isospin asymmetry one finds a monotonic decrease of with decreasing number of nucleons in the colliding nuclei. One also observes that the measured values differ little within the SPS energy range. Epos, Urqmd and Hijing model predictions fit into the measurements’ systematic uncertainties band. Figure 20 shows the width of the rapidity distributions plotted versus the mean number of wounded nucleons . The results seem to be independent of from N+N to Pb+Pb collisions for all studied collision energies.

-
■
150,
-
▲
75,
-
✚
40,
-
▼
30,
-
●
19,
4.5 Mean multiplicities
The mean multiplicity of mesons is plotted versus the center-of-mass energy in Fig. 21 for p+p and central Be+Be, Ar+Sc and central Pb+Pb collisions. As shown by the curves, the predictions of the Epos and Urqmd models are within the uncertainties of the measurements. Hijing predictions are systematically higher than the measurements.

The Ar+Sc system is approximately isospin symmetric. The ratio calculated within Epos1.99 was found to change from 0.954 to 0.984 between 13 and 150 beam momentum. Based on these results one calculates mean multiplicity of , , as:
| (9) |
where .
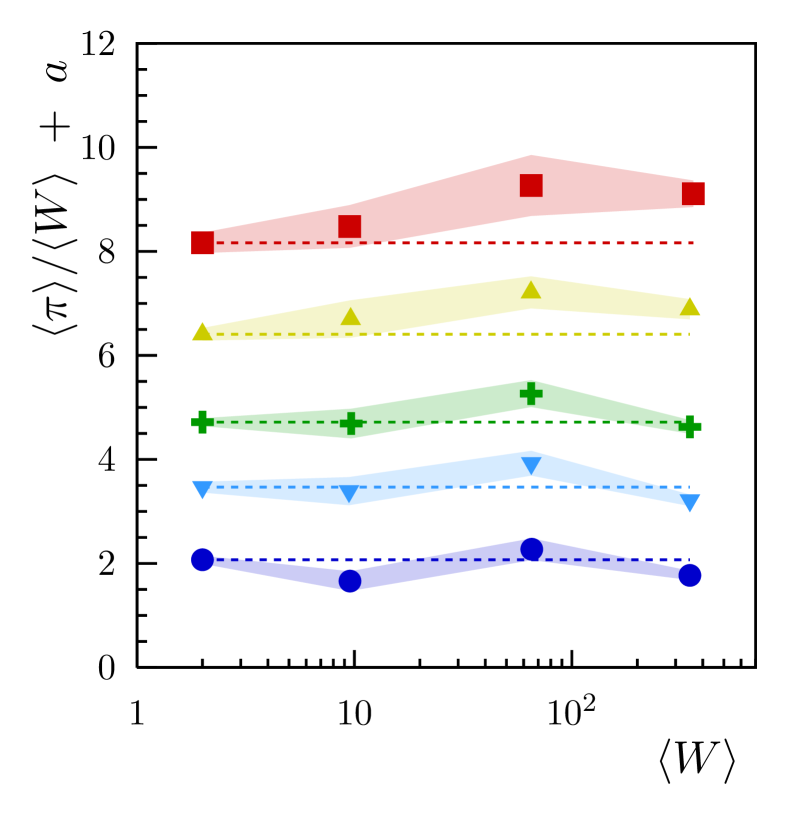
Figure 22 shows the ratios of 111For p+p interactions the figure shows isospin symmetrized values [12] over the mean number of wounded nucleons plotted versus the collision system size. In general the measurements are close to the expectations of the wounded nucleon model which are shown as horizontal dashed lines. A trend of increase for can be seen at higher beam momenta of 75 and 150 in Ar+Sc and Pb+Pb reactions. Such an increase is not evident for lower beam momenta.
-
■
150,
-
▲
75, ,
-
✚
40,
-
▼
30,
-
●
19,
5 Relevance of the results to the onset of deconfinement
The speed of sound in the dense matter produced in the collisions was predicted to show a minimum around the collision energy of the onset of deconfinement. This paper studies this energy dependence for central Ar+Sc collisions.
The Landau hydrodynamical model of high energy collisions [31, 32] predicts rapidity distributions of Gaussian shapes. In fact this prediction is approximately confirmed by the experimental data, see Ref. [33] and references therein. Moreover, the collision energy dependence of the width was derived by Shuryak [34] from the same model under simplifying assumptions and reads:
| (10) |
where denotes the speed of sound, and for an ideal gas of massless particles.
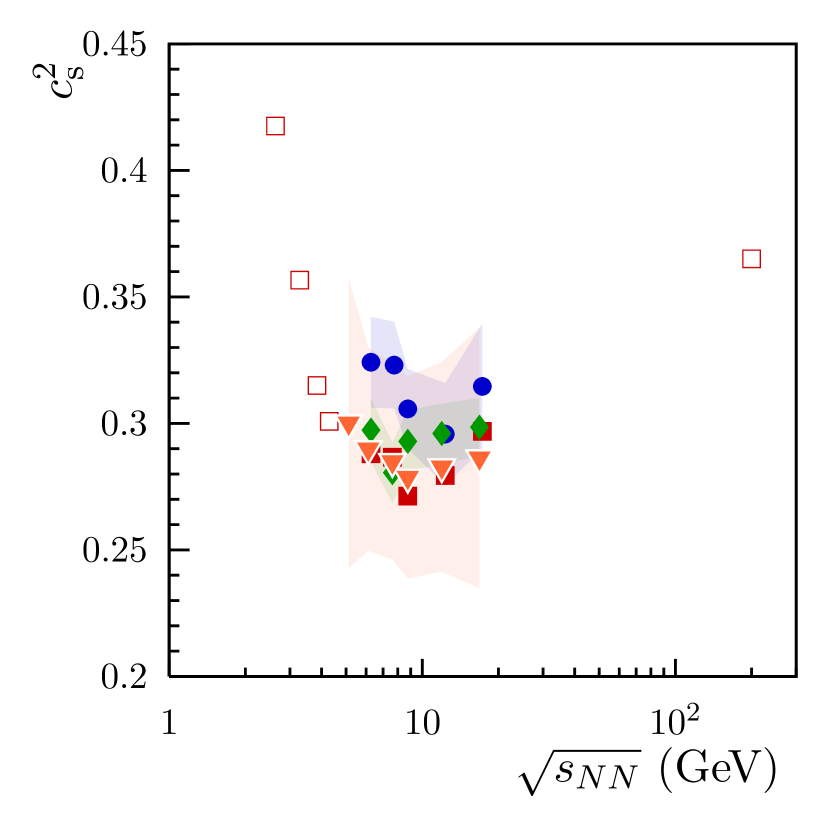
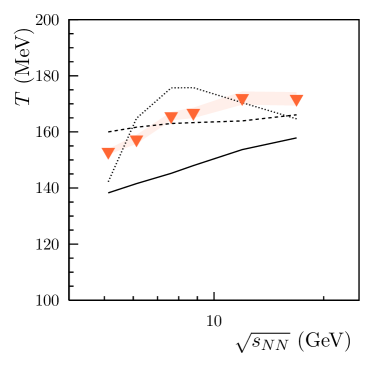
By inverting Eq. 10 one can express in the medium as a function of the measured width of the rapidity distribution. The sound velocities extracted from the data on central Pb+Pb collisions, in combination with results from AGS and RHIC on central Au+Au collisions, cover a wide energy range. Here, the sound velocity exhibits a clear minimum [37, 38] (usually called the softest point) at GeV consistent with the reported onset of deconfinement [3, 4]. The energy dependence of the sound velocities extracted from the new measurement are presented in Fig. 23. The energy range covered by NA61/SHINE for results from central Ar+Sc, Be+Be collisions and inelastic N+N reactions is too limited to allow a significant conclusion about a possible minimum.
Pions are the most copiously produced hadrons () in collisions of nucleons and nuclei at SPS energies. Their multiplicity is closely related to the entropy produced in such interactions [31, 39]. Since the number of degrees of freedom is higher for the quark-gluon plasma than for confined matter, it is expected that the entropy density of the produced final state at given temperature should also be higher in the first case. Therefore, the entropy and information regarding the state of matter formed in the early stage of a collision should be reflected in the number of produced pions normalized to the volume of the system. This intuitive argument was quantified in the Statistical Model of the Early Stage (SMES) [40]. The increase with collision energy of the mean number of produced pions , normalized to the number of wounded nucleons [23] is expected to be linear when plotted against the Fermi energy measure
| (11) |
where is center-of-mass collision energy. The rate of increase depends on the number of degrees of freedom in the system, , as .
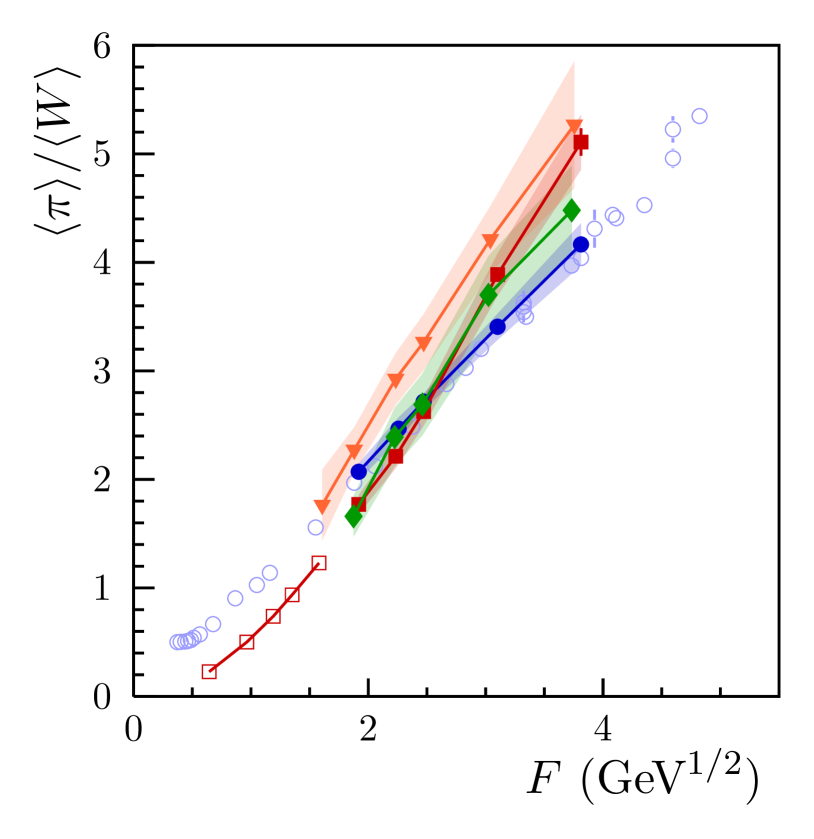
The new NA61/SHINE results are presented in Fig.4. These, together with available measurements from other experiments are presented in Fig. 24222For p+p interactions the figure shows isospin symmetrized values denoted as N+N [12]. The uncertainty connected with the calculation of the number of wounded nucleons was studied using different MC models. This indicated a variation of of up to 6%. This source of uncertainty was not included in the systematic uncertainties plotted in Fig. 24. The world data on N+N and central Pb+Pb (Au+Au) collisions established a well-known picture – the ”kink” plot. The results on N+N interactions increase linearly with , whereas the slope of the Pb+Pb results increase by about 30% in the low SPS beam energy range (at 30). The suppression of pion yield in Pb+Pb collisions at low collision energies was attributed to pion absorption in the evolving fireball [41, 42]. The increase of the ratio can be related to activation of additional quark-gluon degrees of freedom.
The NA61/SHINE results on N+N interactions agree well with the world data. The results on Be+Be collisions are mostly between measurements from N+N and Pb+Pb collisions. The new data on Ar+Sc collisions seem to be systematically higher than the results for N+N, Be+Be and Pb+Pb collisions at the lower energies. They are close to the Pb+Pb results at the highest energies. There appears to be a systematic steepening of the rate of increase of this ratio with energy between light and heavy collision systems. This behavior suggests in the statistical scenario a systematic increase of the effective number of degrees of freedom.
Interestingly for Ar+Sc reactions equals that for inelastic N+N reactions at low SPS energies whereas it is closer to that for Pb+Pb reactions at high SPS energies. Moreover, a suppression of the pion yield per wounded nucleon was observed in central Pb+Pb collisions compared to inelastic N+N reactions at low energies which was attributed to pion absorption in the evolving fireball [41, 42]. This effect is not found for the intermediate size Ar+Sc system in which a smaller less dense fireball is created.
6 Summary and outlook
Spectra and mean multiplicities of produced in the 5% most central Ar+Sc collisions were measured by the NA61/SHINE experiment at the CERN SPS for beam momenta of 13, 19, 30, 40, 75 and 150 using the method. The results represent the first measurements on pion production in an intermediate size collision system at SPS energies.
Energy and system size dependence of parameters of measured distributions – mean transverse mass, the inverse slope parameter of transverse mass spectra, width of the rapidity distribution and mean multiplicity – were presented and discussed.
The inverse slope parameter of the transverse mass distribution increases with increasing system size and collision energy. Width of the rapidity distribution is independent of the system size and increases with collision energy. The mean multiplicity at high energies increases faster with the system size than expected from the Wounded Nucleon Model. The rate of the increase with collision energy is faster in Ar+Sc and Pb+Pb collisions than in N+N interactions. The new measurements were compared to predictions of Epos1.99 [17, 18, 19], Urqmd1.3.1 [27, 28] and Hijing [29] models. None of them provides a consistent description of the new NA61/SHINE measurements in Ar+Sc collisions.
The new results on central Ar+Sc collisions were discussed in the context of the signatures of the onset of deconfinement. The velocity of sound extracted form the width of rapidity distribution is consistent with results for central Pb+Pb collisions as well as Be+Be and N+N interactions. Measurements in a broader energy range are needed to conclude on a possible minimum of the sound velocity in Ar+Sc collisions. The ratio of mean pion multiplicity to the number of wounded nucleons and its collision energy dependence at the highest SPS energies are close to the ones for central Pb+Pb collisions and higher than the corresponding results for N+N and Be+Be interactions. This behavior suggests an increase of the effective number of degrees of freedom already in central Ar+Sc collisions at the top SPS energies.
7 Acknowledgments
We would like to thank the CERN EP, BE, HSE and EN Departments for the strong support of NA61/SHINE.
This work was supported by the Hungarian Scientific Research Fund (grant NKFIH 123842/123959), the Polish Ministry of Science and Higher Education (grants 667/N-CERN/2010/0, NN 202 48 4339 and NN 202 23 1837), the National Science Centre Poland(grants 2014/14/E/ST2/00018, 2014/15/B/ST2 / 02537 and 2015/18/M/ST2/00125, 2015/19/N/ST2 /01689, 2016/23/B/ST2/00692, DIR/WK/ 2016/2017/ 10-1, 2017/ 25/N/ ST2/ 02575, 2018/30/A/ST2/00226, 2018/31/G/ST2/03910, 2019/32/T/ST2/00432), the Russian Science Foundation, grant 16-12-10176 and 17-72-20045, the Russian Academy of Science and the Russian Foundation for Basic Research (grants 08-02-00018, 09-02-00664 and 12-02-91503-CERN), the Russian Foundation for Basic Research (RFBR) funding within the research project no. 18-02-40086, the National Research Nuclear University MEPhI in the framework of the Russian Academic Excellence Project (contract No. 02.a03.21.0005, 27.08.2013), the Ministry of Science and Higher Education of the Russian Federation, Project "Fundamental properties of elementary particles and cosmology" No 0723-2020-0041, the European Union’s Horizon 2020 research and innovation programme under grant agreement No. 871072, the Ministry of Education, Culture, Sports, Science and Technology, Japan, Grant-in-Aid for Scientific Research (grants 18071005, 19034011, 19740162, 20740160 and 20039012), the German Research Foundation (grant GA 1480/8-1), the Bulgarian Nuclear Regulatory Agency and the Joint Institute for Nuclear Research, Dubna (bilateral contract No. 4799-1-18/20), Bulgarian National Science Fund (grant DN08/11), Ministry of Education and Science of the Republic of Serbia (grant OI171002), Swiss Nationalfonds Foundation (grant 200020117913/1), ETH Research Grant TH-01 07-3 and the Fermi National Accelerator Laboratory (Fermilab), a U.S. Department of Energy, Office of Science, HEP User Facility managed by Fermi Research Alliance, LLC (FRA), acting under Contract No. DE-AC02-07CH11359 and the IN2P3-CNRS (France).
References
- [1] N. Abgrall et al. NA61/SHINE facility at the CERN SPS: beams and detector system. JINST, 9:P06005, 2014.
- [2] N. Antoniou et al. Study of hadron production in hadron nucleus and nucleus nucleus collisions at the CERN SPS, 2006. CERN-SPSC-2006-034.
- [3] S. Afanasiev et al. Energy dependence of pion and kaon production in central Pb + Pb collisions. Phys. Rev., C66:054902, 2002.
- [4] C. Alt et al. Pion and kaon production in central Pb + Pb collisions at 20-A and 30-A-GeV: Evidence for the onset of deconfinement. Phys. Rev., C77:024903, 2008.
- [5] Marek Gazdzicki and Mark I. Gorenstein. On the early stage of nucleus-nucleus collisions. Acta Phys.Polon., B30:2705, 1999.
- [6] L. Adamczyk et al. [STAR Collaboration]. Bulk Properties of the Medium Produced in Relativistic Heavy-Ion Collisions from the Beam Energy Scan Program. Phys.Rev., C96:044904, 2017.
- [7] Anar Rustamov. The Horn, Kink and Step, Dale: from few GeV to few TeV. Central Eur.J.Phys., 10:1267–1270, 2012.
- [8] F. Becattini, J. Manninen, and M. Gazdzicki. Energy and system size dependence of chemical freeze-out in relativistic nuclear collisions. Phys.Rev., C73:044905, 2006.
- [9] C. Alt et al. Bose-Einstein correlations of pi-pi- pairs in central Pb+Pb collisions at A-20, A-30, A-40, A-80, and A-158 GeV. Phys. Rev. C, 77:064908, 2008.
- [10] V. Vovchenko, V.V. Begun, and M.I. Gorenstein. Hadron multiplicities and chemical freeze-out conditions in proton-proton and nucleus-nucleus collisions. Phys. Rev. C, 93(6):064906, 2016.
- [11] A Aduszkiewicz. Beam momentum scan with Pb+Pb collisions. Technical Report CERN-SPSC-2015-038. SPSC-P-330-ADD-8, CERN, Geneva, Oct 2015.
- [12] N. Abgrall et al. Measurement of negatively charged pion spectra in inelastic p+p interactions at = 20, 31, 40, 80 and 158 GeV/c. Eur.Phys.J., C74:2794, 2014.
- [13] A. Aduszkiewicz et al. Measurements of , K± , p and spectra in proton-proton interactions at 20, 31, 40, 80 and 158 with the NA61/SHINE spectrometer at the CERN SPS. Eur. Phys. J., C77(10):671, 2017.
- [14] A. Acharya et al. Measurements of production in 7Be+9Be collisions at beam momenta from 19 to 150GeV/ in the NA61/SHINE experiment at the CERN SPS. Eur. Phys. J. C, 80(10):961, 2020.
- [15] A. Acharya et al. Measurements of , , and spectra in 7Be+9Be collisions at beam momenta from 19 to 150 GeV/ with the NA61/SHINE spectrometer at the CERN SPS. Eur. Phys. J., 10 2020.
- [16] D. Banas, A. Kubala-Kukus, M. Rybczynski, I. Stabrawa, and G. Stefanek. Influence of target material impurities on physical results in relativistic heavy-ion collisions. Eur. Phys. J. Plus, 134(1):44, 2019.
- [17] Klaus Werner, Fu-Ming Liu, and Tanguy Pierog. Parton ladder splitting and the rapidity dependence of transverse momentum spectra in deuteron-gold collisions at RHIC. Phys. Rev., C74:044902, 2006.
- [18] T. Pierog and K. Werner. EPOS Model and Ultra High Energy Cosmic Rays. Nucl.Phys.Proc.Suppl., 196:102–105, 2009.
- [19] T. Pierog, 2018. private communication.
- [20] Carminati F. Brun R. Geant detector description and simulation tool, cern program library long writeup w5013, 1993. http://wwwasdoc.web.cern.ch/wwwasdoc/geant/geantall.html.
- [21] A. Acharya et al. Measurements of production in 7Be+9Be collisions at beam momenta from 19 to 150 in the NA61/SHINE experiment at the CERN SPS. Eur. Phys. J., C, 2020.
- [22] A. Seryakov. PSD acceptance maps for event selection. https://edms.cern.ch/document/1867336/1, 2017. CERN EDMS.
- [23] A. Bialas, M. Bleszynski, and W. Czyz. Multiplicity Distributions in Nucleus-Nucleus Collisions at High-Energies. Nucl. Phys., B111:461, 1976.
- [24] W. Broniowski, M. Rybczynski, and P. Bozek. GLISSANDO: Glauber initial-state simulation and more.. Comput.Phys.Commun., 180:69, 2009.
- [25] M Gazdzicki. Status report from the NA61/SHINE experiment at the CERN SPS. Technical Report CERN-SPSC-2019-041. SPSC-SR-261, CERN, Geneva, Oct 2019.
- [26] Michal Naskręt. Thesis: Energy dependence of negatively charged pion production in nucleus-nucleus collisions. PhD thesis, University of Wroclaw, Poland, 2021.
- [27] S.A. Bass et al. Microscopic models for ultrarelativistic heavy ion collisions. Prog.Part.Nucl.Phys., 41:255–369, 1998.
- [28] M. Bleicher et al. Relativistic hadron hadron collisions in the ultrarelativistic quantum molecular dynamics model. J.Phys., G25:1859–1896, 1999.
- [29] Xin-Nian Wang and Miklos Gyulassy. Hijing: A monte carlo model for multiple jet production in , , and collisions. Phys. Rev. D, 44:3501–3516, Dec 1991.
- [30] M. Gazdzicki and D. Roehrich. Pion multiplicity in nuclear collisions. Z.Phys., C65:215, 1995.
- [31] L.D. Landau. On the multiparticle production in high-energy collisions. Izv. Akad. Nauk Ser. Fiz., 17:51–64, 1953.
- [32] S.Z. Belenkij and L.D. Landau. Hydrodynamic theory of multiple production of particles. Nuovo Cim. Suppl., 3S10:15, 1956.
- [33] C. Blume. Energy dependence of hadronic observables. J. Phys. G, 31:S57–S68, 2005.
- [34] Edward V. Shuryak. Multiparticle production in high energy particle collisions. Yad.Fiz., 16:395–405, 1972.
- [35] J.L. Klay et al. Charged pion production in 2 to 8 agev central au+au collisions. Phys. Rev., C68:054905, 2003.
- [36] I.G. Bearden et al. Charged meson rapidity distributions in central Au+Au collisions at s(NN)**(1/2) = 200-GeV. Phys. Rev. Lett., 94:162301, 2005.
- [37] Marcus Bleicher. Evidence for the onset of deconfinement from longitudinal momentum distributions? Observation of the softest point of the equation of state. 9 2005.
- [38] Hannah Petersen and Marcus Bleicher. Longitudinal flow and onset of deconfinement. PoS, CPOD2006:025, 2006.
- [39] L. Van Hove. Multiplicity Dependence of p(T) Spectrum as a Possible Signal for a Phase Transition in Hadronic Collisions. Phys. Lett. B, 118:138, 1982.
- [40] Marek Gazdzicki, Mark Gorenstein, and Peter Seyboth. Onset of deconfinement in nucleus-nucleus collisions: Review for pedestrians and experts. Acta Phys.Polon., B42:307–351, 2011.
- [41] R. Stock. Particle Production in High-Energy Nucleus Nucleus Collisions. Phys. Rept., 135:259–315, 1986.
- [42] M. Gazdzicki and D. Roehrich. Pion multiplicity in nuclear collisions. Z. Phys. C, 65:215–223, 1995.