PSR B0656+14: the unified outlook from the infrared to X-rays
Abstract
We report detection of PSR B065614 with the Gran Telescopio Canarias in narrow optical , , , and and near-infrared bands. The pulsar detection in the band extends its spectrum to 2.2 m and confirms its flux increase towards the infrared. We also present a thorough analysis of the optical spectrum obtained by us with the VLT. For a consistency check, we revised the pulsar near-infrared and narrow-band photometry obtained with the HST. We find no narrow spectral lines in the optical spectrum. We compile available near-infrared-optical-UV and archival 0.3-20 keV X-ray data and perform a self-consistent analysis of the rotation phase-integrated spectrum of the pulsar using unified spectral models. The spectrum is best fitted by the four-component model including two blackbodies, describing the thermal emission from the neutron star surface and its hot polar cap, the broken power-law, originating from the pulsar magnetosphere, and an absorption line near 0.5 keV detected previously. The fit provides better constraints on the model parameters than using only a single spectral domain. The derived surface temperature is K. The intrinsic radius (7.8-9.9 km) of the emitting region is smaller than a typical neutron star radius (13 km) and suggests a nonuniform temperature distribution over the star surface. In contrast, the derived radius of the hot polar cap is about twice as large as the ‘canonical’ one. The spectrum of the nonthermal emission steepens from the optical to X-rays and has a break near 0.1 keV. The X-ray data suggest the presence of another absorption line near 0.3 keV.
keywords:
pulsars: general - pulsars, individual: PSR B0656+14 - stars: neutron1 Introduction
More than fifty years after the discovery of the first neutron stars (NSs) as radio pulsars, their emission mechanisms still remain poorly understood, and multiwavelength observations are crucial for any progress in this field. Pulsars produce emission across the entire electromagnetic spectrum, being mostly observed as powerful radio, X-ray and -ray emitters. In contrast, their detection in the optical and/or near-infrared (near-IR) is still a rare event. The studies of most handful of them show that the optical emission consists of the thermal spectral component from the surface of the NS and the nonthermal component from its magnetosphere. Contribution of the components depends on the pulsar age. In turn, the near-IR emission is believed to have a purely magnetosphere nature.
The first optical and near-IR identifications of NSs have been reported shortly after the discovery of radio pulsars (Cocke et al. 1969) and to date number about 25 firm detections (see, e.g., Mignani (2011) for review). However, despite the rapidly increasing amount of known pulsars111http://www.atnf.csiro.au/people/pulsar/psrcat/, Manchester et al. (2005), no significant progress has been made in the field during the last decade. Great expectations were set on the discoveries of the Fermi Large Area Telescope, which was launched in 2008 and has detected more than 200 -ray pulsars. Most of them appeared to be nearby and energetic, making them promising targets for optical and near-IR studies and boosting searches with the Hubble Space Telescope (HST) and the largest ground-based telescopes. However, among numerous optical and near-IR observations of -ray pulsars, only three possible identifications were proposed (Zyuzin et al. 2016, Mignani et al. 2016, Rangelov et al. 2017). Nevertheless, deep upper limits on the optical fluxes of other pulsars provided informative constraints on their emission properties and multiwavelength spectra (see, e.g., Zharikov & Mignani (2013), Mignani et al. (2018) and references therein).
Most of the identified NS optical counterparts are very faint () and can be detected only via broad-band photometric observations. Optical spectroscopy has been obtained only for the youngest and brightest Crab pulsar (1000 yr., ) (Nasuti et al. 1996, Sollerman et al. 2000, Beskin & Neustroev 2001), PSR B054069 (2000 yr., ) (Hill et al. 1997, Serafimovich et al. 2004) and the third optically brightest Vela pulsar (10000 yr., ) (Mignani et al. 2007). The spectroscopic observations of older and fainter pulsars were first obtained by Martin et al. (1998). They reported observations of the Geminga pulsar ( yr., ) using the Keck telescope. The preliminary optical spectroscopy for another middle-aged PSR B0656+14 (105 yr., ) was reported by Zharikov et al. (2007). In addition, spectroscopic observations of the isolated radio-silent neutron star (INS) RX J1856.5-3754 ( yr, ) were performed with the Very Large Telescope (VLT) by van Kerkwijk & Kulkarni (2001). The young Crab, Vela, and middle-aged Geminga pulsars demonstrate an almost a flat spectrum in the optical and near-IR (Sandberg & Sollerman 2009, Shibanov et al. 2006, Zyuzin et al. 2013). In contrast, young B054069 (Mignani et al. 2019) and the middle-aged B0656+14 (Shibanov et al. 2006) exhibit a flux increase towards the near-IR. Moreover, the optical-IR data of B0656+14 suggests the presence of a spectral break between the two ranges. Thorough studies in the near-IR are crucial to broaden the distribution and reveal the presence of similar features in other objects, which is important for understanding the physics of emitting particles in pulsar magnetospheres.
| Observed | Derived | ||||||||||
|---|---|---|---|---|---|---|---|---|---|---|---|
| ms | cm-3 pc | deg | deg | mas yr-1 | mas yr-1 | pc | Myr | G | erg | ||
| 384.87 | 5.50 | 13.977 | 201.1 | 8.3 | 0.11 | ||||||
| - spin period; - derivative of the spin period; - the dispersion measure; - Galactic coordinate; , - proper motion; |
| - distance; - the pulsar age; - magnetic field strength; - spin-down luminosity |
Owing to its relative brightness and proximity, the middle-aged PSR B0656+14 is one of those isolated NSs most intensively studied in different wavelengths. It was first discovered as a radio pulsar by Manchester et al. (1978). The average pulse flux densities of the pulsar, 6.5(6), 3.8(6), 4.8(1.4) and 3.7(8) mJy at 0.4, 0.6, 0.9 and 1.4 GHz, respectively, result in a power-law (PL) spectrum with the index (Lorimer et al. 1995). The PSR B0656+14 pulse profile is almost completely linearly polarised with a shallow asymmetric swing of the position angle (Gould & Lyne 1998). Kuzmin & Ershov (2006) suggested and Weltevrede et al. (2006) and Tao et al. (2012) confirmed that PSR B0656+14 belongs to the group of pulsars that emit giant pulses with the peak flux density of the strongest pulse by a factor of 630 higher than of the average pulse. The pulsar dispersion measure is 13.977 pc cm-3. Brisken et al. (2003) measured the parallax mas with the Very Long Baseline Array yielding a distance of 288 pc. PSR B0656+14 is located near the centre of the Monogem ring (Nousek et al. 1981), a yr expanding supernova remnant (SNR) likely produced in the same supernova explosion as the pulsar (Thorsett et al. 2003). The basic parameters of PSR B0656+14 inferred from the radio observations are given in Table 1.
The pulsar has been detected and intensively studied in X-rays with the space observatories Einstein (Cordova et al. 1989), ROSAT (Finley et al. 1992, Anderson et al. 1993, Possenti et al. 1996), ASCA (Greiveldinger et al. 1996), BeppoSAX (Mineo et al. 2002), XMM-Newton (Zavlin & Pavlov 2004, De Luca et al. 2005), Chandra (Marshall & Schulz 2002, Pavlov et al. 2002, Lloyd et al. 2003, Bîrzan et al. 2016) and NuSTAR (Arumugasamy et al. 2018). It has also been observed with SRG/eROSITA during the verification stage at the end of 2019222http://www.mpe.mpg.de/7362694/presskit-erosita-firstlight. The observed flux in the 0.2-3.0 keV band is about ergs cm-2 s-1. The observed X-ray spectrum consists of at least two distinct components, thermal and non-thermal. It appeared to be best fitted by an absorbed blackbody (BB) model with a relatively low temperature T K combined with the additional BB with a higher temperature of K and the PL describing the hard X-ray tail (De Luca et al. 2005). The non-thermal PL component of the pulsar magnetosphere origin contributes only 1% of the total luminosity in the 0.1-10 keV range. The low temperature BB component represents the thermal emission from the bulk of the surface of the NS, while the hot BB component is from its small polar caps heated by relativistic particles from the magnetosphere of the pulsar. A historical summary of the X-ray spectral fits including the EUVE Deep Survey (DS) data (Edelstein et al. 2000) is presented in Fig. 1 and Table 2. The temperature of the bulk surface of the pulsar provided by the cold BB component despite of a noticeable uncertainty is consistent with prediction of cooling scenarios of NSs (Beznogov & Yakovlev 2015). However, the 2BB+PL model gives a strong scatter in the absorbing column density N cm-2. The X-ray observations also showed a complex behavior of the source pulsed fraction: it decreases with energy from about 20% at 0.1-0.3keV down to about 7-11% at around 1 keV and increases again to 35-44% at 1 KeV (Pavlov et al. 2002, Lloyd et al. 2003, De Luca et al. 2005). Recently, Arumugasamy et al. (2018) reported the spectral analysis of new data obtained with XMM-Newton and NuSTAR. They found that the 2BBPL model is not consistent with the new data due to large fit-residuals in the 0.3–0.7 keV range. However, the residuals can be naturally explained by the presence of an absorption line in the spectrum of the pulsar. The latter has been confirmed at a higher confidence by the recent SRG/eROSITA data (Schwope et al. 2019). Using NS atmosphere models, such as NSA (Zavlin et al. 1996) and NSMAXG (Ho 2014), does not lead to acceptable fits either.
| Satellite | Range | Models | Temperature/spec. index | NH | Reference |
|---|---|---|---|---|---|
| keV | (1)-soft; (2)-hard | K / | cm-2 | ||
| Einstein | 0.15 — 4.0 keV | single BB(1); | T1= 3.0—6.0 | Cordova et al. (1989) | |
| 0.15 — 4.0 keV | PL | ||||
| ROSAT | 0.1 — 2.4 keV | single BB(1) | T1= 8.6—9.4 | (0.8-1.2) | Finley et al. (1992) |
| 0.1 — 2.4 keV | PL | (0.8-1.2) | |||
| 0.1 — 2.4 keV | He Atm. | T1= 2.5—3.5 | (1.6- 2.4) | ||
| 0.1 — 2.4 keV | H Atm. | T1= 5.0—5.7 | (0.3-1.7) | Anderson et al. (1993) | |
| 0.1 — 2.4 keV | BB(1)+BB(2) | T1= 8.6—9.6 | (0.6-0.8) | Possenti et al. (1996) | |
| T2= 15—23 | |||||
| 0.1 — 2.4 keV | BB(1)+PL | T1= 9.95—1.07 | (1.5-2.3) | Possenti et al. (1996) | |
| ASCA | 0.5 — 10.0 keV | BB(1)+BB(2)+PL | T1= 6.4—8.3 | (1.5-2.3) | Greiveldinger et al. (1996) |
| T2= 13—17 | |||||
| BeppoSAX | 0.1 — 10.0 keV | BB(1)+BB(2)+PL | T1= 6.3—7.4 | (2.3-4.5) | Mineo et al. (2002) |
| T2= 13—15 | |||||
| Chandra | 0.1 — 2.0 keV | BB(1)+BB(2) | T1= 7.7—8.3 | (1.5-1.9) | Marshall & Schulz (2002) |
| T2= 13—19 | |||||
| Chandra | 0.3 — 8.0 keV | BB(1)+BB(2)+PL | T1= 6.1—7.2 | (3.7-5.2) | Bîrzan et al. (2016) |
| T2= 12.1—13.6 | wabs | ||||
| XMM-Newton | 0.1 — 10.0 keV | BB(1)+BB(2)+PL | T1= 6.4—6.6 | (4.1-4.5) | De Luca et al. (2005) |
| T2= 12.2—12.8 | |||||
| EUVE ROSAT | 0.1 — 2.4 keV | BB(1)+BB(2) | T1= 2.6—5.8 | (1.2-3.6) | Edelstein et al. (2000) |
| T2= 10.6—12.8 | |||||
| EUVE ROSAT | 0.1 — 2.4 keV | BB(1)+BB(2) | T1= 4.7—7.4 | (1.1-1.8) | Edelstein et al. (2000) |
| + Optical | T2= 11—18 | ||||
| Chandra Optical | 0.3 — 6 keV | H Atm. + PL | T= 4.8—6.2 | (1.0-1.2) | Lloyd et al. (2003) |
| T∞=4.5—5 | |||||
| = -0.5 | |||||
| XMM NuStar | 0.3 — 7.0KeV | BB(1)+BB(2)+PL+Line | T= 6.8—7.9 | (2.1-3.7) | Arumugasamy et al. (2018) |
| = -0.7(1) | (A18) |
| Comments: BB(1) is the blackbody from the NS surface; BB(2) – blackbody from its hot spot; PL – power law component; He Atm – He atmosphere |
| model; H Atm - H-atmosphere model. |
| Date | Band | Exposure | AM | Seeing | Observing |
| / | N [sec] | (Z) | [arcsec] | conditions | |
| 2009-10-17 | 6 250.0 | 1.18 | 0.7 | Photom. | |
| 2009-10-17 | 9 200.0 | 1.10 | 0.7 | Photom. | |
| 2011-10-28 | 2 600.0 | 1.03 | 0.7 | Photom. | |
| 2011-10-28 | 2 300.0 | 1.04 | 0.7 | Photom. | |
| 2011-10-29 | 6 325.0 | 1.04 | 0.7 | Photom. | |
| 2011-10-29 | 6 325.0 | 1.04 | 0.7 | Photom. | |
| 2011-11-21 | 13 325.0 | 1.03 | 0.7 | Photom. | |
| 2011-12-27 | 2 300.0 | 1.05 | 0.9 | Photom. | |
| 2011-12-27 | 2 300.0 | 1.10 | 0.9 | Photom. | |
| 2011-12-27 | 12 300.0 | 1.12 | 0.9 | Photom. | |
| 2012-01-23 | 18 325.0 | 1.12 | 0.7 | Photom. | |
| 2016-10-22 | 168 10 | 1.21 | 0.8–1.6 | Photom. | |
| 2016-10-30 | 154 30 | 1.05 | 0.8–1.2 | Clear | |
| 2016-10-31 | 112 20 | 1.04 | 0.5–0.8 | Clear | |
| 2016-11-01 | 112 20 | 1.04 | 0.5–0.7 | Clear | |
| 2016-11-01 | 42 30 | 1.08 | 0.5–0.6 | Clear | |
| 2016-11-08 | 112 30 | 1.04 | 0.6–1.1 | Clear | |
| 2016-11-08 | 135 10 | 1.15 | 0.6–1.1 | Clear |
| Standards: |
| OSIRIS: He3 (, , ); |
| OSIRIS: G191-B2B, Feige34, He3 (); |
| CIRCE: AS05, AS16, AS39 |
Ramanamurthy et al. (1996) reported detection of PSR B0656+14 in -rays with the EGRET telescope aboard the Compton Gamma Ray Observatory. They found that the phase-averaged high-energy -ray pulsed emission from the pulsar has a single power-law (PL) spectrum with the photon index and the integral flux photons cm-2 s-1 above 100 MeV. This was confirmed by the Fermi Large Area Telescope (LAT) (Abdo et al. 2013). The pulsar was detected with a pulsed flux of photons cm-2 s-1 and a photon index of for the PL and for the PLEC333Power law Super Exponential Cutoff model (Abdo et al. 2013) spectral models, respectively, corresponding to the energy flux 2.7(1) ergs cm-2 s-1 in the 100 MeV to 100 GeV range (Abdollahi et al. 2020).
The optical counterpart of PSR B0656+14 (V25) was discovered by Caraveo et al. (1994) and confirmed by Pavlov et al. (1996), Kurt et al. (1997) and Shearer et al. (1997). Later, Kurt et al. (1998) reported the first photometric observations of the PSR B0656+14 optical counterpart, which showed that the pulsar optical radiation has a non-thermal origin. The optical investigations were extended using the HST and the largest ground-based telescopes, such as the VLT. They afforded an opportunity to perform time-resolved photometry, to compile the detailed UV-optical-IR spectral energy distribution and to measure the phase-averaged and phase-resolved linear polarisation (Mignani et al. 2000, Koptsevich et al. 2001, Kern et al. 2003, Shibanov et al. 2005, Shibanov et al. 2006, Zharikov et al. 2007, Durant et al. 2011, Mignani et al. 2015).
The total galactic interstellar colour excess towards PSR B0656+14 obtained using the COBE and IRAS data is 0.09 (Schlegel et al. 1998). Based on analyses of hydrogen column densities from the radio and X-ray observations, Shibanov et al. (2006) concluded that the most likely value of the colour excess in the pulsar direction is = 0.03. The new 3D interstellar dust reddening model444http://argonaut.skymaps.info: it is based on analyses of Pan-STARRS 1 and 2MASS stellar photometry (Green et al. 2015, 2018), gives a total of 0.06 and, together with the pulsar parallax distance of 0.288 kpc, yields the colour excess towards PSR B0656+14 of = 0.01. Therefore, in the following analyses, we consider the interstellar absorption in the pulsar direction . The low total galactic absorption and the small colour excess of the pulsar flux allow us to apply the dependence N cm-2 (Liszt 2014) to estimate the hydrogen column density towards the pulsar of N cm-2. Another estimation of hydrogen column density towards the pulsar is based on the empirical relation between the hydrogen column density and optical extinction obtained by Foight et al. (2016) using the Chandra SNR archive. They found the empirical relation NH = 2.870.12 10 which gives N 2.81020 cm-2 to the pulsar using the standard reddening law. This NH constraint shown by the dash-hatched region in Fig.1 can be used in spectral analyses of the multi-wavelength data from the near-IR through X-rays. First attempts of such analysis for PSR B0656+14 were undertaken by Edelstein et al. (2000) and Lloyd et al. (2003) using a very limited set of data available at that time. This approach was shown to be potentially useful for obtaining tighter constraints on the pulsar parameters as compared to those inferred from separate spectral ranges. Given a considerable amount of new near-IR-optical-UV and X-ray data obtained since that time, it is useful to repeat such analysis using a modern approach.
In this paper we focus on such multi-wavelength data analysis for this pulsar. We include our new optical narrow-band and near-IR band photometric observations obtained with the Gran Telescopio Canarias (GTC). We also present a detailed analysis of our VLT spectroscopic medium resolution observations of the pulsar whose preliminary results were only shortly reported in Zharikov et al. (2007). For a consistent comparison with the VLT spectral and GTC photometric data we revised the pulsar narrow-band optical and broad-band near-IR data obtained with the HST and presented by Durant et al. (2011). We show that hints of the optical absorption/emission features in the spectrum of the pulsar reported by these authors are insignificant. We extracted X-ray data from different missions from archives, including the recently obtained but not yet published XMM-Neuton data, that double the number of the pulsar source counts in soft X-rays. We re-reduced the data with modern versions of the respective tools, and used them to search for a common spectral solution across the IR-Optical-UV-X-ray domains. The details of new GTC observations and data analysis are described in Section 2, clarification of the HST near-IR photometric results using the GTC data is presented in Section 3, analyses of the VLT spectroscopy and reanalysis of the HST optical narrow-band photometric data are given in Sections 4 and 5. The X-ray data are described in Section 6. The results and discussion are presented in Sections 7,8 and conclusions in Section 9.
2 The GTC data
2.1 Optical narrow-band imaging
The narrow-band photometric observations of PSR B0656+14 were obtained using the Optical System for Imaging and low-intermediate Resolution Integrated Spectroscopy (OSIRIS555see http://www.gtc.iac.es/instruments/osiris/ for details) in the , , and narrow bands666The band pivot wavelengths and widths in nm units are the first and second numbers in filter ID names. during several runs in 2009-2012777Proposals GTC4-09BCATMEX and GTC1-11BIACMEX, PI S. Zharikov. The instrument contains two CCDs with a plate scale of 0.254 arcsec/pixel (22 binning) and a total field of view (FoV) of 78 78. The log of observations is given in Table 3.
Standard data reduction, including bias subtraction, flat-fielding and cosmic-ray removal, was applied to the raw data using eso-midas routines888https://www.eso.org/sci/software/esomidas//. Some of the resulting images appeared to have detector defects in the pulsar location, and for this reason were rejected. The total integration time for the resulting summed images was 2.1, 2.4, 3.6 and 15.775 ks for the , , and bands, respectively. The images were astrometrically calibrated using the iraf ccmap task and a set of eight reference stars in the vicinity of the pulsar from the GAIA catalog (Gaia Collaboration et al. 2016, 2018). The rms error of the calibrations was 005 in both directions. Selections of another sets of nearby GAIA stars did not affect this result significantly. For the photometric calibration, spectrophotometric standard stars He3, G191-B2B and Feige34 (Oke 1974, Stone 1977, Massey et al. 1988, Oke 1990) were observed each observing night in the corresponding bands (see Table 3) and respective magnitude zero-points were obtained.
The resulting images are presented in Fig. 2. The pulsar optical counterpart is clearly detected on the combined images in all the four bands. Its instrumental magnitudes were measured in the aperture with a diameter of 4 CCD pixels (10) centred at the pulsar position. They were then corrected for the PSF of bright stars and transformed into the resulting pulsar magnitudes. The photometric results are presented in Table 4 and Fig. 7.
| Band | . Fluxobs | |
|---|---|---|
| [Hz] | [Jy] | |
| 14.659 | 0.368(32) | |
| 14.599 | 0.467(42) | |
| 14.573 | 0.356(39) | |
| 14.522 | 0.366(61) | |
| 14.393 | 0.469(130) | |
| 14.259 | 0.639(170) | |
| 14.139 | 1.059(300) |
2.2 Near-IR broad-band imaging
The observations of the pulsar field were carried out in the , , and bands with the Canarias InfraRed Camera Experiment (CIRCE, Garner et al. (2014)) during several runs in 2016 October and November999Proposal GTC3-16BIACMEX, PI S. Zharikov (see Table 3). CIRCE was operated as a visitor instrument equipped with a 20482048 engineering grade H2RG detector, which provides a resolution of 0.1 arcsec pixel-1 and a FoV of 3434. To properly subtract the rapidly-varying near-IR sky background and reduce the effects of the poor detector cosmetic, we used a self-defined dithering pattern consisting of seven positions. The individual exposures in the and bands were obtained using the detector Correlated Double Sampling (CDS) mode and were repeated two and three times at each dither position, respectively. The band observations were performed in the detector Fowler sampling mode, and the individual images were obtained twice at each dither position. The total integration time for the , , and bands was 9.24, 4.48 and 3.03 ks.
The CIRCE data were reduced using custom codes written in idl. All the images were dark subtracted (in particular to account for electronic offsets) and flatfielded, where the masterflat was produced as differential flat from a series of bright flats and faint flats. For sky-subtraction, for each image the adjacent image with the closer count-level was used. After performing the primary reduction several bad pixel masks were applied to every individual exposure. This allowed us to fix numerous non-functional pixels, two dead amplifiers and other detector defects. Before combining the individual sky-subtracted images, they were aligned by measuring the centroid of one star in the FoV in all images. A simple mean combination was used to produce the final image. The resulting combined images are shown in Fig. 3. Their astrometric solutions were obtained using a set of seven reference stars in the pulsar vicinity from the GAIA catalogue. The formal rms error of the astrometric calibration was in both directions. A set of other stars does not significantly improve the solution.
Inspection of the resulting images showed that the pulsar can be detected at a fair confidence level in the band and only marginally in the and bands. The latter is based on the position coincidence of the pulsar and detected counts. To demonstrate this we overlaid the image in the band by contours on the band image (Fig. 3, top-left). The more reliable detection of the pulsar in the H band is explained by better seeing conditions during the observations in this band (see Table 3). A small 02 dispersion in the pulsar counterpart position in different near-IR bands is visible. However, it is a typical situation for objects found near the detection limit (S/N10) (see, for example, Figure 2 in Zharikov & Mignani (2013)). We also note that the position of the pulsar in the H band perfectly agrees with the expected pulsar radio position calculated for the epoch of the near-IR observations using its proper motion measured in the radio by Brisken et al. (2003). Contours in the bottom-right panel of Fig. 3 demonstrate the proper motion shift with the epoch observed in the optical-near-IR.
The conditions during the GTC/CIRCE observations were clear with slightly (0.1 mag) variable transparency. The photometric calibration was performed based on the standards from the photometric standard fields AS05, AS16 and AS39 from Hunt et al. (1998) observed the same nights as the target. In addition, we used the Two-Micron All-Sky Survey (2MASS) stars (Skrutskie et al. 2006) with a magnitude of 14.5 and photometric errors 0.05 mag that fall in the CIRCE FoV. We accounted for the atmospheric extinction using the coefficients 0.09, 0.07 and 0.08 for the , , and bands, respectively, provided by the GTC team. As a result, we obtained the photometric zero-points , and .
We measured the pulsar instrumental magnitudes in the aperture with a diameter of 6 CCD pixels (06) centred at the pulsar position computed for the epoch of the near-IR observations. They were corrected for the PSF of bright stars selected in the CIRCE FoV and transformed into the 2MASS magnitudes using the obtained zero-points. The magnitudes were then transformed into fluxes using the calibrations from Cohen et al. (2003). The photometric results are presented in Table 4 and Fig. 7.
3 Clarification of the HST/NICMOS near-IR photometry
The HST/NICMOS photometry of PSR B0656+14 in the , and bands was first reported by Koptsevich et al. (2001) with the respective fluxes 0.336(30), 0.575(30) and 0.779(97) Jy. Durant et al. (2011) have performed independent measurements based on the same data and obtained the fluxes =0.385(30) Jy, =0.551(30) Jy and =0.660(25) Jy. We verified these results using the original data from the HST archive and PHOTFNU parameters extracted from the file headers and obtained from the STScI webpage101010www.stsci.edu/hst/nicmos/perfomance/photometry/prencs_keywords.html. Our measurement of =0.563(30) Jy is in a good consistency with the respective -band flux reported by Koptsevich et al. (2001). The flux in the band equals to 0.340(30) Jy for PHOTFNU=1.84724e-6 (CAMERA2) from the NICMOS webpage and 0.393(30) Jy for PHOTFNU=2.3133694e-6 from the image header. The first value corresponds to the measurement of Koptsevich et al. (2001) and the second one corresponds to that of Durant et al. (2011). We used a sum of all images to estimate the flux in the band. It is important to note that a few cosmic rays were detected close the pulsar position in some images and they significantly complicated the pulsar flux measurements. We verified each image for the presence of cosmic rays at or close to the pulsar position and removed them by interpolating the average background pixel flux in the pulsar vicinity. Our resulting estimation of the pulsar flux in this band, =0.668(120) Jy, is in agreement with the Durant et al. (2011) measurements, however we note that they underestimated the flux errors. A slight shift (1 pixel) of the photometric aperture centre leads to a significant (%20) variation of the measured flux.
As was shown above, the mentioned NICMOS calibration uncertainty can lead to the pulsar flux uncertainty above of statistical errors. To verify the calibration, it is instructive to consider a bright 2MASS reference star located near the pulsar. To do that, Durant et al. (2011) remeasured the fluxes of the object N7 (2MASS J06594760+1414253, see Fig. 2) from Koptsevich et al. (2001) and found them to be about 10% higher than those reported by Koptsevich et al. (2001) and about 20% lower than the 2MASS measurements (=16.37(14), =15.56(16), =15.13(16)). In our CIRCE data this object was detected with a high S/N ratio and its magnitudes and colour indices in the 2MASS system are =16.54(4), =15.83(4), =15.62(4), = 0.72(5) and = 0.20(4). The high precision optical photometry of the object N7 was presented by Kurt et al. (1998) and Koptsevich et al. (2001): =22.00(3), =20.31(2), =19.13(2), =17.74(2), = 1.69(4), = 1.18(3), = 1.38(3)). The corresponding total Galactic extinction values in the PSR B0656+14 direction are =0.32, =0.24, = 0.19, =0.14, =0.06, =0.04 and =0.03 (Schlafly & Finkbeiner 2011). We repeated the HST/NICMOS photometry of the N7 object using the individual frames where the object does not fall on the detector edge. The PHOTFNU parameters were extracted from the image headers. The measured object fluxes are =320.20(30) Jy, =451.32(30) Jy and =351(2) Jy.
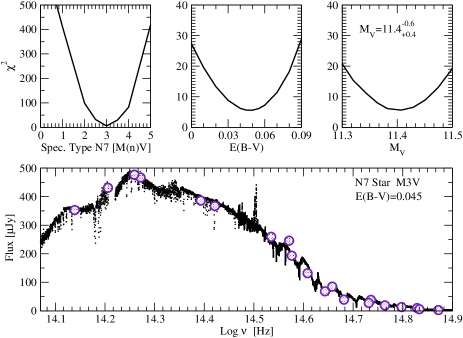
Taking into account the object magnitudes, colour indices and the total Galactic extinction, we found that the object N7 is likely a M0 — M5 type dwarf star located at a distance of about 750300 pc (Hawley et al. 2002, Koen et al. 2002). The GAIA parallax111111https://www.cosmos.esa.int/web/gaia/data-access of the N7 star is 1.88(38) mas which corresponds to a distance of pc. The corresponding interstellar extinction for this distance from Green et al. (2015, 2018) yields a colour excess of = 0.02(2). To check what fluxes can be expected from the star in the HST/NICMOS filters, we calculated them using the M0V-M5V type star IR spectral templates from Rayner et al. (2009). They were extended to the optical range using data from the empirical template library of the Sloan Digital Sky Survey stellar spectra (Kesseli et al. 2017) using an overlapping region. The best agreement between the observed and calculated colour indices was found for the M3V type star spectra (, ), which are consistent within uncertainties with our GTC/CIRCE photometry of the N7 star (see Fig. 4). Using only data gives reduced chi-square per degree of freedom . The optical BTA photometry data (see Section 5.2), after being included in the fit, insignificantly increases the reduced chi-square that is more probably related to band-pass characteristics in the optical range or the star individuality. The narrow band HST/ACS/WFC photometry of the N7 star is also in agreement with the N7 star spectral type (the HST/ACS/WFC data of the N7 star are presented in Fig. 4).
The best fit shows a full consistency (1%) between the measured and calculated fluxes in the band and a slight discrepancy of 10% and 12% for the respective measurements121212The magnitudes were obtained by convolution of the NICMOS filters transmission curves with the template spectrum and NICMOS zero-points. in the and bands: =353.0 Jy, =447.0 Jy and =394.0 Jy. We assume that the flux difference should be taken into account and that the NICMOS fluxes obtained using PHOTFNU from the image header must be corrected accordingly. After applying this correction we obtain the observed pulsar fluxes =0.432(30) Jy, =0.568(30) Jy and =0.748(120) Jy (Fig. 7).
| Date | Number | AM | Exposure |
|---|---|---|---|
| (UT) | of exposures | [s] | |
| 2004-11-12 | 2 | 1.30 | 1400 |
| 2004-11-14 | 4 | 1.30 | 1400 |
| 2004-11-15 | 2 | 1.30 | 1400 |
| 2004-11-16 | 2 | 1.29 | 1400 |
| 2004-11-17 | 2 | 1.29 | 1400 |
| 2004-12-17 | 4 | 1.36 | 1400 |
| 2005-02-07 | 2 | 1.33 | 1400 |
| Exp. | PHOTFLAM | Flux | Flux | Flux | Flux(2) | Flux(3) | Flux(4) | Fluxave | Ap. | CTE | Fluxobs | Fluxobs | |
|---|---|---|---|---|---|---|---|---|---|---|---|---|---|
| Time | (2009) | 5 | 5 | 5 | 5 | corr. | corr. | obs | derredded | ||||
| (sec) | (Hz) | (cps) | (cps) | (cps) | (cps) | (cps) | (cps) | (cps) | % | % | (Jy) | (Jy) | |
| 1399.8∘ | 14.872(11)∗ | 1.743e-18 | 0.191 | 0.255 | 0.316 | 0.282 | 0.307 | 0.348 | 0.312(26) | 11.7 | 5.6 | 0.347 | 0.387(34) |
| 1020.0∘ | 14.834(11)∗ | 9.520e-19 | 0.293 | 0.475 | 0.629 | 0.427 | 0.569 | 0.69 | 0.56(10) | 9.6 | 3.6 | 0.393 | 0.433(83) |
| 830.0∘ | 14.798(12)∗ | 7.162e-19 | 0.410 | 0.472 | 0.542 | 0.594 | 0.565 | 0.596 | 0.585(14) | 9.1 | 4.0 | 0.362 | 0.396(10) |
| 885.0∘ | 14.764(13)∗ | 5.776e-19 | 0.412 | 0.461 | 0.481 | 0.591 | 0.550 | 0.532 | 0.557(24) | 8.7 | 3.7 | 0.323 | 0.350(15) |
| 1020.0∘ | 14.732(12)⋆ | 5.857e-19 | 0.438 | 0.483 | 0.608 | 0.599 | 0.568 | 0.664 | 0.610(40) | 8.4 | 3.0 | 0.413 | 0.443(29) |
| 1020.0∘ | 14.682(11)⋆ | 3.779e-19 | 0.500 | 0.586 | 0.610 | 0.701 | 0.694 | 0.672 | 0.688(11) | 8.5 | 2.5 | 0.376 | 0.402(6) |
| 810.0∙ | 14.643(12)⋆ | 2.895e-19 | 0.635 | 0.732 | 0.684 | 0.891 | 0.864 | 0.751 | 0.835(61) | 8.3 | 2.5 | 0.417 | 0.442(32) |
| 810.0∙ | 14.608(13)⋆ | 2.551e-19 | 0.499 | 0.700 | 0.819 | 0.790 | 0.884 | 0.916 | 0.863(53) | 8.5 | 2.5 | 0.447 | 0.470(29) |
| 747.0∙ | 14.576(14)† | 2.427e-19 | 0.466 | 0.620 | 0.697 | 0.761 | 0.788 | 0.785 | 0.777(11) | 8.8 | 3.2 | 0.448 | 0.468(6) |
| 1330.8∙ | 14.535(14)† | 2.970e-19 | 0.325 | 0.366 | 0.402 | 0.623 | 0.500 | 0.476 | 0.533(64) | 9.7 | 2.9 | 0.457 | 0.474(57) |
| 2842.0∙ | 14.500(17)† | 5.474e-19 | 0.089 | 0.098 | 0.133 | 0.204 | 0.153 | 0.174 | 0.177(21) | 19.8 | 3.2 | 0.360 | 0.372(43) |
| E(B-V) = 0.03 is selected for flux dereddening; observational epochs: ∘2005-12-08; ∙2005-12-03; Ramp filter names: ∗FR459M; ⋆FR647M; †FR914M |
| - logarithm of frequency corresponding to the filter central wavelength. |
| Flux(N) is the flux obtained from N pix. aperture by correction to 05 aperture. |
| Fluxave = |
| Ap. corr. is the correction for the PSF from the 05 aperture to the nominal ‘infinite’ aperture of 55. |
| CFE is the charge transfer efficiency. |
| The final errors include errors of measurements and uncertainties of the interstellar absorption. |
4 VLT/FORS2 spectroscopy
The spectrum of PSR B0656+14 was obtained in 2004 November–December and 2005 February during several observational runs131313ESO program 074.D-0512A, PI R. Mennickent using the VLT/UT1 telescope in a service mode (see Table 5). The FORS2 instrument was used in a long slit spectroscopic setup with the GRIS_300V grating and the filter, which cover the wavelength interval of about 4300-9600 Å and provide a medium spectral resolution of 3.35 Å pixel-1. The slit width was 10 and its position angle was selected in such a way so it covered several nearby stars for the accurate astrometric referencing and wavelength/flux calibration (see. Fig. 5). Eighteen 1400 s science spectroscopic exposures were taken with a total exposure time of 25.2 ks at a mean seeing of 06. Standard reference frames (biases, darks, flatfields, lamps) were obtained in each observational run, while the slit and slitless observations of the spectrophotometric standards (Feige110, LTT3218 and LTT1788) for the flux calibration were carried out in separate runs during the same nights. A combination of the eso-midas and iraf packages was used for standard CCD data reduction, cosmic-ray track removing, spectra extraction and the subsequent data analysis.
PSR B0656+14 is a faint target with 24.6, which is at the limit of the VLT spectroscopic capability. Nevertheless, excellent seeing conditions allowed us to resolve its spectrum even on individual exposures, albeit with a low S/N ratio. The individual exposures were co-added. The spectrum was then extracted with a 3 pixel wide extraction slit (0.2 arcsec pixel-1) centred on the pulsar. The backgrounds were extracted with 6 pixel wide slits centred above and below the centre of the pulsar spectrum. The correction factor for the PSF and sensitivity function were obtained from the Feige110 standard observations. The S/N of the resulting spectrum was about 4 (per pixel) in the 4450-5500 Å range and declined to near/above 8000 Å, due to higher sky backgrounds and a drop in sensitivity towards longer wavelengths. We binned the spectral flux in 20 pixel bins (67Å) to get S/N near/above 15 and 4, respectively, making the flux accuracy to be comparable with that of available photometric data. The resulting optical VLT spectrum of PSR B0656+14 is presented in the top panel of Fig. 7. It is in a good agreement with the photometric data points. In general, it can be described by a single PL, , with a spectral index . We found no evidence of any significant narrow (emission or absorption) spectral features. An apparently large spectral variation in the flux density at Hz is due to the low S/N in this range. Broad weak features could exist in a range of Hz, however, their significance cannot be claimed confidently.
5 HST optical narrow-band photometry and UV data; Subaru and BTA broad-band optical photometry
5.1 HST/ACS/WFC narrow-band photometry
The HST/ACS/WFC observations of the pulsar field were obtained on 2005 December 3 and 12 using the , and filters with 11 central wavelength positions. We extracted the data from the HST archive and re-reduced them to consistently compare with the narrow-band GTC photometry and the VLT spectroscopy. This analysis is important as based on these data Durant et al. (2011) reported on the presence of absorption/emission features in the spectrum of the pulsar, while we find no such features in our VLT spectrum. The log of the HST observations and results of our photometry are given in Table 6.
We repeated the flux measurements of the pulsar in all available ACS/WFC bandpasses. For aperture photometry, the circular apertures with radii of 2, 3, and 4 pixels were used (1 pixel = 005). The aperture centre was chosen by fitting the pulsar profile with a Gaussian in each band (see Fig 6). The background was measured using the annulus with respective inner and outer radii and pixels for all apertures. Following the HST/ACS/WFC user manual141414https://hst-docs.stsci.edu/display/ACSDHB/5.1+Photometry, the source fluxes measured in count-rates (cps) for each aperture were corrected to an aperture of 05 using photometry of bright unsaturated nearby star-like objects in the ACS FoV. These corrected fluxes for different initial apertures showed a considerable scattering demonstrating correction uncertainties, which were comparable to statistical count-rate uncertainties. They were then averaged and the final flux errors were derived accounting for the statistical and aperture correction uncertainties. After that, we performed corrections for the PSF from the 05 aperture to the nominal ‘infinite’ aperture of 55 and for the charge transfer efficiency (CTE) using the correction factors from Sirianni et al. (2005) and Chiaberge et al. (2009). The fluxes in count-rates were transformed into Jy using PHOTFLAN key-words from image headers. The factors, key-words, and the log of our measurements are given in Table 6. Generally, our results are in agreement with those reported by Durant et al. (2011). Nevertheless, we reduced the scattering of deviations from the power-law fit of the optical spectrum that was visible in previous flux measurements. In addition, we found that the fluxes in the band at =4028.805Å ( Hz) and 4400.793Å ( Hz) were slightly overestimated due to the contribution of an extended background structure, likely to be a cosmic-ray track, located at the pulsar position. The revised photometric results are shown in Fig. 7. As seen, they are consistent with the VLT spectroscopy and do not show any significant spectral feature.
5.2 HST UV, BTA and Subaru optical data
The HST UV data on the pulsar were obtained by Shibanov et al. (2005) and Durant et al. (2011) using the STIS NUV-MAMA and COS-FUV instruments, respectively. These data were found to be self-consistent (Durant et al. 2011; see fig.4 therein). We also included in our analysis the published results of the broad-band optical photometry of the pulsar obtained with the Subaru (Shibanov et al. 2006), and BTA (Koptsevich et al. 2001) telescopes. These data were obtained by some authors of this study and have been revised and checked independently several times in previous publications. Magnitudes of secondary photometric standards in the pulsar field from Kurt et al. (1998), used for calibration of different sets of optical data, agree with those presented in the Pan-STARRS (Chambers et al. 2016) and SDSS (Blanton et al. 2017) catalogues. Therefore, we included in our analysis all these data on the pulsar in their original form. They are also presented in Fig. 7.
6 X-ray data
To perform multi-wavelength analysis of the pulsar spectrum from the near-IR-optical through X-rays, we selected the best-quality published X-ray data sets obtained with XMM-Newton, and NuSTAR observatories in a photon energy range of 0.15–20 keV (for references see Table 2). We re-reduced the archival X-ray data and extracted time integrated pulsar spectra for fitting them by various models simultaneously with the long wavelength data. Below we briefly describe each of the sets.
The XMM-Newton observations were carried out on 2015 September 19 (observation ID 0762890101) and 2019 October 14 (observation ID 0853000201) with total exposure times ks and ks, respectively. The latter data set has not been published yet, but it adds a considerable number of source counts to those of the first set, thus allowing one to improve the spectral analysis results. In the observations, the EPIC-MOS cameras were operated in the Timing Mode with the THIN filter setting, and the EPIC-pn camera was operated in the Small Window Mode with the THIN filter. The sas v.17.0.0 software was used to process the data. In our analysis, we used only the data from the pn camera. We selected single and double pixel events (PATTERN 4). Considering light curves we removed periods of background flares. After that, the science useful pn exposures became 84 ks and 71 ks for the first and second sets, respectively. We applied the circular apertures with radii of 375 and 150 for energy ranges of 0.15 – 1.4 and 1.4 – 7 keV and extracted the pulsar spectra using evselect tool. The apertures were chosen to increase signal-to-noise of the pulsar spectra (see, e.g. Arumugasamy et al. (2018)). Background was taken from a region free from any sources. We then used sas tasks rmfgen and arfgen to generate the redistribution matrix and ancillary response files for the source and background. We analysed the spectra in the 0.3–7 keV range, which is the nominal range for the pn. In addition, we checked pn spectra in the 0.15–7 keV range, despite the fact that the 0.15–0.3 keV range is not well calibrated151515https://xmm-tools.cosmos.esa.int/external/ xmm_user_support/documentation/uhb/epicintbkgd.html or http://xmm2.esac.esa.int/docs/documents/CAL-TN-0018.pdf.
The NuSTAR telescope observed the pulsar in 2015 with FPMA and FPMB detectors (observation ID 40101004002). We retrieved the NuSTAR data from the archive and reduced them in a similar way as Arumugasamy et al. (2018). NuSTAR spectra of the pulsar were analysed in the 3–20 keV range.
| Model | G2BB + PL | G2BB + PL | G2BB + BKPL | G2BB + BKPL | 2G2BB + BKPL |
|---|---|---|---|---|---|
| spectral | X-rays | nIR-opt-UV | nIR-opt-UV | nIR-opt-UV | nIR-opt-UV |
| range | in 0.320 keV | and X-rays in | and X-rays in | and X-rays in | and X-rays in |
| 0.320 keV | 0.320 keV | 0.1520 keV | 0.1520 keV | ||
| fit ID | N1 | N1o | N2 | N3 | N4 |
| Parameter | |||||
| ( cm-2) | |||||
| (keV) | |||||
| (keV) | |||||
| (keV) | - | - | - | - | |
| (keV) | - | - | - | - | |
| - | - | - | - | ||
| BB1norm ( | |||||
| (km) | |||||
| (eV) | |||||
| BB2norm | |||||
| (km) | |||||
| (eV) | |||||
| – | |||||
| PLnorm | |||||
| Ebreak | – | – | |||
| -307 | -390 | -380 | -445 | -394 | |
| n | 548 | 620 | 620 | 672 | 672 |
| k | 12 | 12 | 14 | 14 | 17 |
| BIC | 690 | 857 | 850 | 981 | 899 |
-
•
is the Gaussian absorption line central energy, and are its width and strength, respectively. BB is the blackbody normalisation constant, where is the distance to the source is in units of 10 kpc (it is fixed at 288 pc), is the radius in km of the BB emitting area, is the BB temperature. is photon index of the PL component and PLnorm is a its normalisation in units of photons keV-1 cm-2 s-1 at 1 keV, Ebreak is the energy of the PL spectral break. The errors are given at 90% credible interval. and are numbers of data points and varied parameters, respectively. is the maximum log-likelihood value and BIC = kln(n)-2ln(L) + is Bayesian information criterion.
7 Multiwavelength spectral analysis
7.1 Spectral fitting setup
We used the xspec v.12.9.0 (Arnaud 1996) tool for fitting all the data from the near-IR to hard X-rays by theoretical models describing thermal and nonthermal emission of the pulsar. The near-IR–UV data were incorporated into XSPEC using the ftflx2xsp tool (Blackburn 1995). XMM-Newton X-ray spectra were grouped only in the energy range of 1.4 – 7 keV to ensure signal-to-noise of 4 per energy bin and used in our fit simultaneously. The floating cross-normalisation was thawed for each data set while it was fixed at 1 for the XMM- Newton data.
For the X-ray photoelectric absorption, we used the xspec model tbabs with abundances wilm (Wilms et al. 2000) and cross-sections bcmc (Balucinska-Church & McCammon 1992). To account for the interstellar extinction in the optical–UV, we used the XSPEC model redden utilizing the extinction law from Cardelli et al. (1989). Its only parameter, the optical colour excess , was linked to the X-ray absorbing column density using the relation from Foight et al. (2016), 1021 cm-2. The optical transmission redden is set to unity shortward of the Lyman limit, i.e. it does not affect the X-ray data. This is incorrect physically but does allow the model to be used in a combination with the X-ray photoelectric absorption model, which in turn does not directly affect the optical-UV data.
We implemented the fitting by a Markov chain Monte-Carlo (MCMC) sampling procedure assuming a uniform prior distribution for model parameters. We employed the affine-invariant MCMC sampler developed by Goodman & Weare (2010) and implemented in a python package emcee by Foreman-Mackey et al. (2013). About 100 walkers and 15000 steps were typically enough to ensure fit convergences. Using the sampled posterior distribution, we obtained best-fit estimates and credible intervals of the model parameters.
7.2 Spectral fitting results
Following recent X-ray studies (see Sect. 1), we first applied the absorbed G2BBPL spectral model. It includes 2 BB components describing thermal emission from the bulk of the surface of the cooling NS (BB1) and its hot polar caps (BB2), the PL component from the magnetosphere of the pulsar and the Gaussian absorption line (G;xspec model gabs) to account for the X-ray spectral feature reported by Arumugasamy et al. (2018). Using the X-ray data alone we checked that the model provides an acceptable fit to the data in a range of 0.3–20 keV with parameters (Table 7, the fit ID N1) generally consistent with those obtained by these authors using only the first XMM-Newton data set in the 0.3-7 keV range. Adding the second XMM-Newton set and the NuStar data results only in a marginal increase of the spectral index of the PL component ( vs ) and the absorbing column density ( cm-2 vs cm-2) and a decrease of the radius of the pulsar ‘hot spot’ ( m vs m).
Then, we compared the long wavelength extrapolation of the fit N1 with the observed optical-UV data. This is presented in the lower panel of Fig. 7 where absorbed BB1 and PL contributions and their sum are shown by low, middle and upper dashed lines. The hot BB2 component has a negligible contribution in this range and is not shown. As seen, the extrapolation overshoots the near-IR-optical data by a factor of five. Overshooting the UV data, where the thermal component starts to dominate, is less significant but noticeable (about 1). Thus the model with parameters which fit well the X-ray spectrum alone cannot describe the data in the near-IR-optical range.
Therefore, as a next step, we fitted the X-ray and near-IR-optical-UV data simultaneously using the same model. The output of the fit is presented in the Table 7 (the fit ID N1o). For the near-IR-optical-UV domain, its results are demonstrated in the lower panel of Fig. 7 where the absorbed BB1 and PL spectral components and their sum are shown by solid lines. The unfolded absorbed best fit model with all its components together with the whole set of the multiwavelength data are presented the in top panel of Fig. 8. According to the fit residuals (the low sub-panel of this plot), the model describes well the data in the whole observing range. Parameters of the thermal components are consistent with those obtained using the X-ray data alone (N1 fit). However, their uncertainties, as well as the uncertainty of , are much smaller. A significant difference between the two cases demonstrates only the PL component, whose spectrum becomes less steeper when we include the long wavelength data. The photon index of the nonthermal component obtained from the fit N1o is consistent with the spectral index derived from the PL fit of the optical spectrum alone dereddened with the provided by the N1o fit. On the other hand, this component also describes apparently well the nonthermal spectral tail seen in hard X-rays. Although the fit N1o is formally acceptable, implying a single PL for the optical and X-ray data, the large difference between the extrapolation of the fit N1 and the optical-IR data mentioned above indicates that the PL component possibly has a spectral break.
To investigate whether such a break exists in the PSR B065614 spectrum and to estimate its parameters, we tried the G2BBBKPL model, where the BKPL is the broken PL component. The rest of the components are the same as in the previous model. The fit, below referred as N2, describes the multiwavelength data almost equally well as the N1o fit (Table 7 and the bottom panel of Fig. 8). However, using Bayesian information criteria (BIC; Claeskens & Hjort 2008), we inferred that N2 has a smaller BIC than N1o, making the former more preferable for the same data sets (see Table 7). Specifically, the obtained implies substantial evidence against N1o. In addition, we evaluated the Bayesian evidence (also shown in Table 7) and calculated the Bayesfactor (Goodman 1999a, b) for N2 over N1o, . Assuming equal prior odds for the two models, the posterior odds ratio for the models with the broken power law over the single power law is . This implies that the G2BB+BKPL model is much more probable than the G2BB+PL one, which strongly favours the presence of the spectral break in the nonthermal spectral component of the pulsar. Namely, its spectrum becomes steeper above the break, located at the photon energy between 0.005 – 0.6 keV, with the slope described by . The parameters of both thermal components, and remain practically the same as for the fit N1o. Ultimately, the G2BBBKPL model combining thermal emission from the bulk of the surface of the cooling NS, its hot polar caps, and the BKPL emission component of the magnetosphere origin appears to represent the most robust description of the current time-integrated multiwavelength spectrum of the pulsar.
For completeness, we also included the 0.15 – 0.3 keV part of the XMM-Newton/EPIC-pn spectrum of the pulsar so far ignored in the analyses due to possible calibration issues partially related to substantial internal background increase of the pn instrument below 0.3 keV (see Sect. 6). Applying the G2BB+BKPL model to fit the extended data set (the fit ID N3) shows characteristic fit residuals in this part of the spectrum indicating a possible presence of a second absorption line (see top panel of Figure 9). Indeed, fitting with the 2G2BB+BKPL model, which includes two Gaussian absorption lines, excludes the residuals (bottom panel of Figure 9) and allows us to derive the line parameters (the fit ID N4 in Table 7). It is interesting, that the energy of the second line centre derived from the fit, keV, is remarkably close to a half of the central energy keV of the first line, implying that they could represent cyclotron absorption lines created in the magnetised plasma of the pulsar. The Bayesian evidence and information criteria and BIC of the fit N3 are significantly larger and smaller, respectively, than those in the case the single Gaussian line model (the fit N3), formally strongly favoring the presence of the second line. We also note that the interstellar absorption and radius of the cold thermal component become slightly smaller when we include the extended X-ray data set. However, all these issues, including the presence of the second line should be considered with caution. A reliable solution of the EPIC-pn low energy calibration problems and independent detection of the second line with eROSITA are required to confirm them.
8 Discussion
Our first spectroscopic, narrow-band optical, and broad-band near-IR observations of PSR B0656+14 with the VLT and the GTC together with the re-analysed archival data obtained with the HST and the optical-UV data published since its first identification in the optical about 26 years ago by Caraveo et al. (1994) represent the most reliable and up-to-date complete information on the spectral energy distribution (SED) of the pulsar emission in the near-IR-optical-UV range. The near-IR-optical part of the SED can be described by a single PL with the spectral index (see Fig.7, top) thus confirming its pulsar magnetosphere origin. The obtained data exclude the presence of any strong narrow spectral lines. There are some hints of weak broad spectral features between 4500Å and 7500Å but their presence can be confirmed only by observations with a higher S/N. Our first observation of the pulsar in the Ks band might allude to the presence of the IR excess over the PL optical SED (see Fig. 7). However, its current significance is only about 1. The available Spitzer data do not allow us to confirm it due to the strong contamination of the pulsar flux by a distant background galaxy located north-west of the pulsar in its nearest vicinity (see Fig. 3, bottom). High spatial resolution near- and mid-IR observations with large ground-based telescopes equipped by AO systems or with the JWST space telescope are necessary to resolve the pulsar from the galaxy. That would be intriguing, as a firm flux increase towards the IR was confirmed so far only for the young PSR B054069 (Mignani et al. 2012).
After including two archival data sets obtained with XMM-Newton and observations with NuSTAR into our X-ray spectral analysis, we confirmed the conclusion of Arumugasamy et al. (2018) based on the single XMM-Newton data set on the presence of the absorption line near keV in the time-integrated X-ray spectrum of the pulsar whose X-ray emission in continuum is best described by two blackbody and power-law spectral components. On the other hand, analysing simultaneously the near-IR-optical-UV SED and X-ray data, we conclude that the nonthermal emission component cannot be described by a single power-law in the whole observed range. A flatter near-IR-optical spectrum with photon index =1.44 steepens significantly to =1.74 with increasing photon energy towards X-rays suggesting the spectral break between the two ranges. According to our multiwavelength spectral fits the break is presumably located near keV. The presence of spectral breaks in the PL component between the optical and X-rays is typical for most pulsars detected in both spectral ranges (e.g., Shibanov et al. 2006, Zharikov et al. 2008, Kirichenko et al. 2014; and references therein) while no multi-wavelength fits have been performed for other pulsars yet.
Including the near-IR-UV SED into the spectral fits together with the X-ray data allows us also to significantly better and self-consistently constrain the parameters of the thermal and nonthermal emission components of the pulsar and the interstellar absorption towards it in the optical and X-rays than it is possible using the data only in separate spectral ranges. For instance, the temperature as measured by a distant observer of the thermal component from the bulk of the surface of the NS, eV ( K) is derived from the multiwavelength fit with the accuracy of 1 eV at the 90% credibility level. The latter is a factor of four better than it was obtained by Arumugasamy et al. (2018) using the X-ray data alone. Accounting for the gravitational redshift161616 , this yields the NS surface temperature of K at and km. High quality measurements of the effective surface temperatures of isolated cooling NSs are important for comparison with theoretical cooling curves of NSs and obtaining information on still poorly known properties of super-dense matter in their interiors (e.g., Yakovlev & Pethick 2004). Among about fifty NSs whose surface temperatures were estimated mainly based on the X-ray data (Potekhin et al. 2020a) only for a few stars the temperatures are measured with a high accuracy comparable to that obtained here for PSR B065614. Significantly larger temperature errors, at least by a factor of ten, for the rest NSs complicates the data comparison with the theory. As shown here, multiwavelength data can help to considerably decrease the uncertainties and facilitate the progress in this direction.
Based on the most robust G2BB+BKPL model the bolometric thermal luminosity of the bulk of the NS surface is erg s-1 accounting for the temperature, radius and distance uncertainties. The effective BB radius of the emitting area of the cool thermal component BB1 in the G2BB+BKPL model, km, is translated to the circumferential radius171717 of km, accounting for the gravitational light bending near the surface of the NS with and km. In case if we accept that the emitting region of the BB1 component corresponds to the whole NS surface, the radius of the pulsar becomes unrealistically small, only km for , and slightly larger for the smaller pulsar mass.
The fact that the circumferential radius of PSR B0656+14 is smaller than the most plausible NS radius km for a neutron star mass of 1.4M☉ (e.g., Lattimer & Prakash 2016, Han & Prakash 2020) shows that the temperature distribution over the NS surface is likely to be non-uniform with a gradient from the magnetic pole to equator, and its surface emission cannot be described by a simple BB model with a single temperature. Such models were considered by Shibanov et al. (1995) and Possenti et al. (1996) to explain 20% pulsed emission fraction in soft X-rays. It is also in accord with the analysis of pulsations of the soft blackbody component and phase resolved X-ray spectroscopy performed by Arumugasamy et al. (2018) showing that can vary with the pulsar rotation phase from 6 km to 22 km in anti-phase to the temperature. Therefore, the radius derived by us from the phase integrated spectra is only an effective radius of radiation from the NS and does not directly correspond to the real physical size of the object.
BB models provide acceptable fits to the thermal components of the spectra of PSR B0656+14 , in contrast to NS atmosphere models. This indicates that the observed UV and soft X-ray radiation come from a bare condensed surface of the NS. Indeed, van Adelsberg et al. (2005) showed that the bare condensed surface of a NS produces a spectrum close to a diluted blackbody. Therefore, application of the bare surface model assuming a plausible distribution of the temperature over the surface of the NS and accounting for the pulsar viewing geometry would be the next physically reasonable step in the interpretation of the current and future multiwavelength data of PSR B0656+14 . This can provide the most robust constraints on the thermal emission parameters of the NS based on the analyses of the phase resolved spectra and light curves of the pulsar in different spectral bands. and can be also constrained this way as has been recently demonstrated for the isolated millisecond PSR J00300451 using NICER data (Miller et al. 2019, Riley et al. 2019).
On the other hand, the effective BB radius of the emitting area of the hot thermal component BB2 of about 740 m, is converted to the intrinsic radius of 630 m under the same assumptions. This is about twice as large as the ‘canonical’ polar cap radius of PSR B0656+14 , 360 m. Therefore, using the BB model with a single temperature for this component should be also considered with caution as the simulations predict non-uniform temperature distribution around the polar cap (Harding & Muslimov 2002) with a temperature decreasing towards the outer boundary of the heated region. Multi-wavelength phase resolved spectroscopy and more realistic spectral and light curve models accounting for non-uniform temperature distributions over the entire surface of the NS and its polar caps are needed to further tune the parameters of the pulsar (see previous paragraph).
Other interesting conclusions follow from the assumption that the second X-ray absorption feature near 0.3 keV is real. This and the earlier reported feature at 0.55 keV can represent consequent harmonics of cyclotron absorption in the spectrum of PSR B0656+14. The difference between energies of the lines keV is the cyclotron energy, which allows us to estimate the magnetic field in the region where they could be created: , where is the magnetic field in G units, z is the gravitational redshift , and are the charge and mass of the plasma particle involved into the absorption, and is the electron mass. Assuming electron cyclotron lines (), , and for the proton lines (), . Both values are about twice smaller than those obtained by Arumugasamy et al. (2018) assuming that the 0.55 keV feature is the first cyclotron harmonic. The canonical dipole magnetic field of PSR B0656+14 at the magnetic equator of the NS estimated from the pulsar spin-down, , lies between these estimates. This means that the lines are either created in the pulsar magnetosphere or the magnetic field at the NS surface is about 5–10 times stronger and differs from the dipole configuration. The latter situation was observed for several pulsars: PSR J0030+0451 (Bilous et al. 2019, Miller et al. 2019, Riley et al. 2019); PSR J0108-1431 (Arumugasamy & Mitra 2019); PSR J0437-4715 (Lockhart et al. 2019).
9 Summary
Using GTC/OSIRIS and GTC/CIRCE instruments we detected the pulsar B065614 in the narrow , , , optical bands and in the near-IR bands. The displacement of the pulsar counterpart in the data obtained in the last twenty years corresponds to the proper motion that was expected from the Very Long Baseline Array radio observations (Brisken et al. 2003). The narrow-band radiation fluxes of the pulsar are consistent with those measured earlier in broad optical bands. Our data extends, for the first time, the optical-near-IR SED of the pulsar to the 2.2 m range. We also present a detailed analysis of the first spectral optical observations of the pulsar obtained by us with the VLT. Using the nearest to the pulsar bright field star detected with a high with the GTC and HST as a secondary photometric standard, we clarified the near-IR fluxes of the pulsar obtained with the HST in the , and broad bands. For the consistency check, we also carefully reanalysed the HST optical photometric data obtained with the narrow-band ramp filters , and . Combining new results with the broad-band optical data obtained earlier with the BTA, Subaru and HST telescopes, we find that the observed optical-near-IR SED of the pulsar provided by the spectral and photometric data is well described by a nearly flat power-law with the spectral index . We do not see any significant narrow spectral features exceeding 2 of standard deviations of the continuum in the pulsar SED. A marginal flux excess over the power-law fit in the and bands is visible suggesting the pulsar flux increase towards the IR, as was indicated by Shibanov et al. (2005) and Durant et al. (2011). Higher quality spectral and photometric data are necessary to confidently confirm the IR excess.
Using the nIR-optical SED, the published UV data obtained with the HST, and the best archival X-ray data from XMM-Newton and NuStar, we performed the self-consistent multi-wavelength spectral analysis of the rotation phase integrated spectrum of the pulsar from the near-IR through hard X-rays until 20 keV. We find that the best spectral fit is provided by the absorbed combined model consisting of the cool black-body emission from the bulk of the surface of the NS, the hot black-body emission from its hot magnetic polar caps, the broken power-law emission of the pulsar magnetosphere origin and the absorption line located near 0.55 keV revealed by Arumugasamy et al. (2018). The temperature of the thermal component from the bulk of the surface of the NS as measured by a distant observer, eV ( K), is derived from the multi-wavelength fit with the accuracy of 1 eV at the 90% credibility level. The latter is a factor of four better than that obtained using the X-ray data alone. For comparison of this result with NS cooling scenarios see Potekhin et al. (2020b).
The respective circumferential radius of emission region of km is smaller than a typical radius of an NS, km, which suggests nonuniform temperature distribution over the star surface. This is in accord with the results of the rotational phase resolved X-ray spectroscopy by Arumugasamy et al. (2018). The magnetosphere nonthermal spectral component of the pulsar steepens from the optical to X-rays and shows the spectral break likely located near 0.1 keV. Including the poorly calibrated XMM-Newton data below 0.3 keV in our spectral analysis reveals a possible presence of the second absorption line in the spectrum of the pulsar near 0.3 keV. Assuming that this line and the 0.55 keV line are formed by cyclotron absorption of the thermal emission from the NS surface, this could be used for direct measurements of the pulsar magnetic field. However, the presence of the 0.3 keV line has to be confirmed by better calibration and eROSITA observations.
Our multi-wavelength spectral analysis provides much better constraints on the pulsar parameters than that based on in a single spectral domain. For instance, it gives much more precise and robust location of the pulsar in the – plane shown in Fig.1 as compared to previous studies. Black-body fits of the thermal spectral components indicate that this NS is probably covered by a bare condensed matter. Application of the bare NS emission model assuming a plausible distribution of the temperature over the NS surface and accounting for the pulsar viewing geometry would be the next physically reasonable step in the interpretation of the current and future multiwavelength data of PSR B0656+14 . This can provide the most robust constraints on the thermal emission parameters of the NS based on the analyses of the phase resolved spectra and light curves in different spectral bands. This will also enable one to measure and and thus put strong constraints on the EoS of super-high density matter in interiors of NSs. The constraints on the pulsar parameters obtained here can be used as initial conditions for such studies.
Data Availability
The data underlying this article will be shared on reasonable request to the corresponding author.
Acknowledgements
We are grateful to the anonymous referee for the valuable comments which helped to improve this paper. The manuscript is based on observations made with the Gran Telescopio Canarias (GTC), installed in the Spanish Observatorio del Roque de los Muchachos of the Instituto de Astrofísica de Canarias, in the island of La Palma. Development of CIRCE was supported by the University of Florida and the National Science Foundation (grant AST-0352664), in collaboration with IUCAA. IRAF is distributed by the National Optical Astronomy Observatory, which is operated by the Association of Universities for Research in Astronomy (AURA) under a cooperative agreement with the National Science Foundation. This research has made use of the USNOFS Image and Catalogue Archive operated by the United States Naval Observatory, Flagstaff Station (http://www.nofs.navy.mil/data/fchpix/). This publication makes use of data products from the Two Micron All Sky Survey, which is a joint project of the University of Massachusetts and the Infrared Processing and Analysis Center/California Institute of Technology, funded by the National Aeronautics and Space Administration and the National Science Foundation. Some/all of the data presented in this paper were obtained from the Mikulski Archive for Space Telescopes (MAST). STScI is operated by the Association of Universities for Research in Astronomy, Inc., under NASA contract NAS5-26555. DAZ thanks Pirinem School of Theoretical Physics for hospitality. R.E.M. gratefully acknowledges support by FONDECYT 1190621, and the Chilean Centro de Excelencia en Astrofísica y Tecnologías Afines (CATA) BASAL grant AFB-170002. SZ acknowledges PAPIIT grant IN102120.
References
- Abdo et al. (2013) Abdo A. A., et al., 2013, ApJS, 208, 17
- Abdollahi et al. (2020) Abdollahi S., et al., 2020, ApJS, 247, 33
- Anderson et al. (1993) Anderson S. B., Cordova F. A., Pavlov G. G., Robinson C. R., Thompson Jr. R. J., 1993, ApJ, 414, 867
- Arnaud (1996) Arnaud K. A., 1996, in Jacoby G. H., Barnes J., eds, Astronomical Society of the Pacific Conference Series Vol. 101, Astronomical Data Analysis Software and Systems V. p. 17
- Arumugasamy & Mitra (2019) Arumugasamy P., Mitra D., 2019, MNRAS, 489, 4589
- Arumugasamy et al. (2018) Arumugasamy P., Kargaltsev O., Posselt B., Pavlov G. G., Hare J., 2018, ApJ, 869, 97
- Balucinska-Church & McCammon (1992) Balucinska-Church M., McCammon D., 1992, ApJ, 400, 699
- Beskin & Neustroev (2001) Beskin G. M., Neustroev V. V., 2001, A&A, 374, 584
- Beznogov & Yakovlev (2015) Beznogov M. V., Yakovlev D. G., 2015, MNRAS, 447, 1598
- Bilous et al. (2019) Bilous A. V., et al., 2019, ApJ, 887, L23
- Bîrzan et al. (2016) Bîrzan L., Pavlov G. G., Kargaltsev O., 2016, ApJ, 817, 129
- Blackburn (1995) Blackburn J. K., 1995, FTOOLS: A FITS Data Processing and Analysis Software Package. p. 367
- Blanton et al. (2017) Blanton M. R., et al., 2017, AJ, 154, 28
- Brisken et al. (2003) Brisken W. F., Thorsett S. E., Golden A., Goss W. M., 2003, ApJ, 593, L89
- Caraveo et al. (1994) Caraveo P. A., Bignami G. F., Mereghetti S., 1994, ApJ, 422, L87
- Cardelli et al. (1989) Cardelli J. A., Clayton G. C., Mathis J. S., 1989, ApJ, 345, 245
- Chambers et al. (2016) Chambers K. C., et al., 2016, arXiv e-prints, p. arXiv:1612.05560
- Chiaberge et al. (2009) Chiaberge M., Lim P. L., Kozhurina-Platais V., Sirianni M., Mack J., 2009, Technical report, Updated CTE photometric correction for WFC and HRC
- Claeskens & Hjort (2008) Claeskens G., Hjort N. L., 2008, Model Selection and Model Averaging. Cambridge Series in Statistical and Probabilistic Mathematics, Cambridge University Press, doi:10.1017/CBO9780511790485
- Cocke et al. (1969) Cocke W. J., Disney M. J., Taylor D. J., 1969, Nature, 221, 525
- Cohen et al. (2003) Cohen M., Wheaton W. A., Megeath S. T., 2003, AJ, 126, 1090
- Cordova et al. (1989) Cordova F. A., Middleditch J., Hjellming R. M., Mason K. O., 1989, ApJ, 345, 451
- De Luca et al. (2005) De Luca A., Caraveo P. A., Mereghetti S., Negroni M., Bignami G. F., 2005, ApJ, 623, 1051
- Durant et al. (2011) Durant M., Kargaltsev O., Pavlov G. G., 2011, ApJ, 743, 38
- Edelstein et al. (2000) Edelstein J., Seon K.-I., Golden A., Min K.-W., 2000, ApJ, 539, 902
- Finley et al. (1992) Finley J. P., Ogelman H., Kiziloglu U., 1992, ApJ, 394, L21
- Foight et al. (2016) Foight D. R., Güver T., Özel F., Slane P. O., 2016, ApJ, 826, 66
- Foreman-Mackey et al. (2013) Foreman-Mackey D., Hogg D. W., Lang D., Goodman J., 2013, PASP, 125, 306
- Gaia Collaboration et al. (2016) Gaia Collaboration et al., 2016, A&A, 595, A1
- Gaia Collaboration et al. (2018) Gaia Collaboration et al., 2018, A&A, 616, A1
- Garner et al. (2014) Garner A., et al., 2014, in Ramsay S. K., McLean I. S., Takami H., eds, Proc. SPIE Conf. Ser. Vol. 9147, Ground-Based and Airborne Instrumentation for Astronomy V. SPIE, Bellingham, p. 91474A.
- Goodman (1999a) Goodman S. N., 1999a, Ann Intern Med., 130, 995
- Goodman (1999b) Goodman S. N., 1999b, Ann Intern Med., 130, 1005
- Goodman & Weare (2010) Goodman J., Weare J., 2010, COMM APP MATH COM SC, 5, 65
- Gould & Lyne (1998) Gould D. M., Lyne A. G., 1998, MNRAS, 301, 235
- Green et al. (2015) Green G. M., et al., 2015, ApJ, 810, 25
- Green et al. (2018) Green G. M., et al., 2018, preprint, (arXiv:1801.03555)
- Greiveldinger et al. (1996) Greiveldinger C., et al., 1996, ApJ, 465, L35
- Han & Prakash (2020) Han S., Prakash M., 2020, ApJ, 899, 164
- Harding & Muslimov (2002) Harding A. K., Muslimov A. G., 2002, ApJ, 568, 862
- Hawley et al. (2002) Hawley S. L., et al., 2002, AJ, 123, 3409
- Hill et al. (1997) Hill R. J., Dolan J. F., Bless R. C., Boyd P. T., Percival J. W., Taylor M. J., van Citters G. W., 1997, ApJ, 486, L99
- Ho (2014) Ho W. C. G., 2014, in Petit P., Jardine M., Spruit H. C., eds, IAU Symposium Vol. 302, Magnetic Fields throughout Stellar Evolution. pp 435–438 (arXiv:1311.5583), doi:10.1017/S1743921314002683
- Hunt et al. (1998) Hunt L. K., Mannucci F., Testi L., Migliorini S., Stanga R. M., Baffa C., Lisi F., Vanzi L., 1998, AJ, 115, 2594
- Kern et al. (2003) Kern B., Martin C., Mazin B., Halpern J. P., 2003, ApJ, 597, 1049
- Kesseli et al. (2017) Kesseli A. Y., West A. A., Veyette M., Harrison B., Feldman D., Bochanski J. J., 2017, ApJS, 230, 16
- Kirichenko et al. (2014) Kirichenko A., Danilenko A., Shibanov Y., Shternin P., Zharikov S., Zyuzin D., 2014, A&A, 564, A81
- Koen et al. (2002) Koen C., Kilkenny D., van Wyk F., Cooper D., Marang F., 2002, MNRAS, 334, 20
- Koptsevich et al. (2001) Koptsevich A. B., Pavlov G. G., Zharikov S. V., Sokolov V. V., Shibanov Y. A., Kurt V. G., 2001, A&A, 370, 1004
- Kurt et al. (1997) Kurt V. G., Komberg B. V., Sokolov V. V., Zharykov S. V., 1997, Ap&SS, 252, 451
- Kurt et al. (1998) Kurt V. G., Sokolov V. V., Zharikov S. V., Pavlov G. G., Komberg B. V., 1998, A&A, 333, 547
- Kuzmin & Ershov (2006) Kuzmin A. D., Ershov A. A., 2006, Astronomy Letters, 32, 583
- Lattimer & Prakash (2016) Lattimer J. M., Prakash M., 2016, Phys. Rep., 621, 127
- Liszt (2014) Liszt H., 2014, ApJ, 780, 10
- Lloyd et al. (2003) Lloyd D. A., Perna R., Slane P., Nicastro F., Hernquist L., 2003, ArXiv Astrophysics e-prints, astro-ph/0306235,
- Lockhart et al. (2019) Lockhart W., Gralla S. E., Özel F., Psaltis D., 2019, MNRAS, 490, 1774
- Lorimer et al. (1995) Lorimer D. R., Yates J. A., Lyne A. G., Gould D. M., 1995, MNRAS, 273, 411
- Manchester et al. (1978) Manchester R. N., Lyne A. G., Taylor J. H., Durdin J. M., Large M. I., Little A. G., 1978, MNRAS, 185, 409
- Manchester et al. (2005) Manchester R. N., Hobbs G. B., Teoh A., Hobbs M., 2005, AJ, 129, 1993
- Marshall & Schulz (2002) Marshall H. L., Schulz N. S., 2002, ApJ, 574, 377
- Martin et al. (1998) Martin C., Halpern J. P., Schiminovich D., 1998, ApJ, 494, L211
- Massey et al. (1988) Massey P., Strobel K., Barnes J. V., Anderson E., 1988, ApJ, 328, 315
- Mignani (2011) Mignani R. P., 2011, Advances in Space Research, 47, 1281
- Mignani et al. (2000) Mignani R. P., De Luca A., Caraveo P. A., 2000, ApJ, 543, 318
- Mignani et al. (2007) Mignani R. P., Zharikov S., Caraveo P. A., 2007, A&A, 473, 891
- Mignani et al. (2012) Mignani R. P., De Luca A., Hummel W., Zajczyk A., Rudak B., Kanbach G., Słowikowska A., 2012, A&A, 544, A100
- Mignani et al. (2015) Mignani R. P., Moran P., Shearer A., Testa V., Słowikowska A., Rudak B., Krzeszowski K., Kanbach G., 2015, A&A, 583, A105
- Mignani et al. (2016) Mignani R. P., et al., 2016, ApJ, 825, 151
- Mignani et al. (2018) Mignani R. P., Testa V., Rea N., Marelli M., Salvetti D., Torres D. F., De Oña Wilhelmi E., 2018, MNRAS,
- Mignani et al. (2019) Mignani R. P., et al., 2019, ApJ, 871, 246
- Miller et al. (2019) Miller M. C., et al., 2019, ApJ, 887, L24
- Mineo et al. (2002) Mineo T., Massaro E., Cusumano G., Becker W., 2002, A&A, 392, 181
- Nasuti et al. (1996) Nasuti F. P., Mignani R., Caraveo P. A., Bignami G. F., 1996, A&A, 314, 849
- Nousek et al. (1981) Nousek J. A., Cowie L. L., Hu E., Lindblad C. J., Garmire G. P., 1981, ApJ, 248, 152
- Oke (1974) Oke J. B., 1974, ApJS, 27, 21
- Oke (1990) Oke J. B., 1990, AJ, 99, 1621
- Pavlov et al. (1996) Pavlov G. G., Stringfellow G. S., Cordova F. A., 1996, ApJ, 467, 370
- Pavlov et al. (2002) Pavlov G. G., Zavlin V. E., Sanwal D., 2002, in Becker W., Lesch H., Trümper J., eds, Neutron Stars, Pulsars, and Supernova Remnants. p. 273 (arXiv:astro-ph/0206024)
- Possenti et al. (1996) Possenti A., Mereghetti S., Colpi M., 1996, A&A, 313, 565
- Potekhin et al. (2020a) Potekhin A. Y., Zyuzin D. A., Yakovlev D. G., Beznogov M. V., Shibanov Y. A., 2020a, MNRAS, 496, 5052
- Potekhin et al. (2020b) Potekhin A. Y., Zyuzin D. A., Yakovlev D. G., Beznogov M. V., Shibanov Y. A., 2020b, MNRAS, 496, 5052
- Ramanamurthy et al. (1996) Ramanamurthy P. V., Fichtel C. E., Kniffen D. A., Sreekumar P., Thompson D. J., 1996, ApJ, 458, 755
- Rangelov et al. (2017) Rangelov B., Pavlov G. G., Kargaltsev O., Reisenegger A., Guillot S., van Kerkwijk M. H., Reyes C., 2017, ApJ, 835, 264
- Rayner et al. (2009) Rayner J. T., Cushing M. C., Vacca W. D., 2009, ApJS, 185, 289
- Riley et al. (2019) Riley T. E., et al., 2019, ApJ, 887, L21
- Sandberg & Sollerman (2009) Sandberg A., Sollerman J., 2009, A&A, 504, 525
- Schlafly & Finkbeiner (2011) Schlafly E. F., Finkbeiner D. P., 2011, ApJ, 737, 103
- Schlegel et al. (1998) Schlegel D. J., Finkbeiner D. P., Davis M., 1998, ApJ, 500, 525
- Schwope et al. (2019) Schwope A., G. L., Traulsen I., Maitra I., M. R., eSASS team 2019, Report, The eROSITA observation of the isolated neutron star pulsar B0656+14. MPE/IK
- Serafimovich et al. (2004) Serafimovich N. I., Shibanov Y. A., Lundqvist P., Sollerman J., 2004, A&A, 425, 1041
- Shearer et al. (1997) Shearer A., et al., 1997, ApJ, 487, L181
- Shibanov et al. (1995) Shibanov Y. A., Pavlov G. G., Zavlin V. E., Qin L., Tsuruta S., 1995, in Böhringer H., Morfill G. E., Trümper J. E., eds, Vol. 759, Seventeeth Texas Symposium on Relativistic Astrophysics and Cosmology. p. 291, doi:10.1111/j.1749-6632.1995.tb17547.x
- Shibanov et al. (2005) Shibanov Y. A., Sollerman J., Lundqvist P., Gull T., Lindler D., 2005, A&A, 440, 693
- Shibanov et al. (2006) Shibanov Y. A., et al., 2006, A&A, 448, 313
- Sirianni et al. (2005) Sirianni M., et al., 2005, PASP, 117, 1049
- Skrutskie et al. (2006) Skrutskie M. F., et al., 2006, AJ, 131, 1163
- Sollerman et al. (2000) Sollerman J., Lundqvist P., Lindler D., Chevalier R. A., Fransson C., Gull T. R., Pun C. S. J., Sonneborn G., 2000, ApJ, 537, 861
- Stone (1977) Stone R. P. S., 1977, ApJ, 218, 767
- Tao et al. (2012) Tao G.-C., Esamdin A., Hu H.-D., Qian M.-F., Li J., Wang N., 2012, Research in Astronomy and Astrophysics, 12, 1649
- Taylor et al. (1993) Taylor J. H., Manchester R. N., Lyne A. G., 1993, ApJS, 88, 529
- Thorsett et al. (2003) Thorsett S. E., Benjamin R. A., Brisken W. F., Golden A., Goss W. M., 2003, ApJ, 592, L71
- Weltevrede et al. (2006) Weltevrede P., Stappers B. W., Rankin J. M., Wright G. A. E., 2006, ApJ, 645, L149
- Wilms et al. (2000) Wilms J., Allen A., McCray R., 2000, ApJ, 542, 914
- Yakovlev & Pethick (2004) Yakovlev D. G., Pethick C. J., 2004, ARA&A, 42, 169
- Zavlin & Pavlov (2004) Zavlin V. E., Pavlov G. G., 2004, Mem. Soc. Astron. Italiana, 75, 458
- Zavlin et al. (1996) Zavlin V. E., Pavlov G. G., Shibanov Y. A., 1996, A&A, 315, 141
- Zharikov & Mignani (2013) Zharikov S., Mignani R. P., 2013, MNRAS, 435, 2227
- Zharikov et al. (2007) Zharikov S., Mennickent R. E., Shibanov Y., Komarova V., 2007, Ap&SS, 308, 545
- Zharikov et al. (2008) Zharikov S. V., Shibanov Y. A., Zyuzin D. A., Mennickent R. E., Komarova V. N., 2008, A&A, 492, 805
- Zyuzin et al. (2013) Zyuzin D., Shibanov Y., Danilenko A., Mennickent R. E., Zharikov S., 2013, ApJ, 775, 101
- Zyuzin et al. (2016) Zyuzin D., Zharikov S., Shibanov Y., Danilenko A., Mennickent R. E., Kirichenko A., 2016, MNRAS, 455, 1746
- van Adelsberg et al. (2005) van Adelsberg M., Lai D., Potekhin A. Y., Arras P., 2005, ApJ, 628, 902
- van Kerkwijk & Kulkarni (2001) van Kerkwijk M. H., Kulkarni S. R., 2001, A&A, 378, 986