The X-ray pulsar XTE J1858+034 observed with NuSTAR and Fermi/GBM:
spectral and timing characterization plus a cyclotron line
Abstract
Accreting X-ray pulsars (XRPs) undergo luminous X-ray outbursts during which the spectral and timing behavior of the neutron star can be studied in detail. We analyze a NuSTAR observation of the XRP XTE J1858+034 during its outburst in 2019. The spectrum is fit with a phenomenological, a semi-empirical and a physical spectral model. A candidate cyclotron line is found at keV, implying a magnetic field of G at the site of emission. This is also supported by the physical best-fit model. We propose an orbital period of about 81 days based on the visual inspection of the X-ray outbursts recurrence time. Based on Fermi Gamma-ray Burst Monitor data, the standard disk accretion-torque theory allowed us to infer a distance of kpc. Pulse profiles are single-peaked and show a pulsed fraction that is strongly energy-dependent at least up to 40 keV.
1 Introduction
Accreting X-ray pulsars (XRPs) are binary systems consisting of a neutron star (NS) that accretes matter originating from a donor companion star via stellar wind or Roche-lobe overflow. XTE J1858+034 is an XRP discovered with the Rossi X-ray Timing Explorer (RXTE) in 1998 by Remillard et al. (1998) and Takeshima et al. (1998). Those observations also detected X-ray pulsations with a period of s. X-ray emission from this source has been detected only in a few short outbursts (Nakajima et al., 2019, and references therein), thus preventing to obtain an orbital solution or an in-depth characterization of the system. A Cyclotron Resonant Scattering Feature (CRSF) also was not observed from this source so far. When observed, the energy of the fundamental CRSF probes the magnetic field strength at the site of spectral emission, keV, where is the magnetic field in units of G, and is the gravitational redshift (see Staubert et al. 2019 for a recent review). However, Paul & Rao (1998) estimated a magnetic field strength of G (with the distance value in units of kpc), based on the observation of quasi-periodical oscillations in this system.
Reig et al. (2004, 2005) proposed a Be-type star for the optical counterpart, of which neither the spectral subtype nor the distance was found. This star was the only one within the hard X-ray error circle from INTEGRAL observations (Molkov et al., 2004) showing H emission and was thus proposed as counterpart although it lay outside the error circle of the JEM-X soft X-ray instrument. At an angular offset of from the nominal X-ray source position, Gaia found an optical candidate counterpart (Bailer-Jones et al., 2018), mentioned in Malacaria et al. (2020) as possible counterpart, but likely unassociated given the large offset. In addition, the Gaia counterpart is at an angular offset of from, and thus clearly not associated with, the optical counterpart proposed by Reig et al. (2005). This question is discussed in more detail in the accompanying paper by Tsygankov et al. (in press), who identify a counterpart based on Chandra and ground telescope observations, with a probable distance of 7–14 kpc.
Recently, the source has undergone a new outburst episode (Nakajima et al., 2019), and was observed with NuSTAR. Here we study its spectral and timing characteristics and finally form a consistent general overview for the X-ray behaviour of XTE J1858+034, including a distance estimate based on accretion-torque theory. The analysis presented here is complemented by the work in the accompanying paper by Tsygankov et al. (in press).
2 Data reduction
NuSTAR (Harrison et al., 2013) was launched in 2012. It is currently the only X-ray mission with a telescope able to focus hard X-rays above 10 keV. NuSTAR consists of two identical co-aligned telescopes that focus X-ray photons onto two independent Focal Plane Modules, FPMA and FPMB. At the focus of each telescope module are four () solid-state cadmium zinc telluride (CdZnTe) imaging detectors. These provide wide-band (3–79 keV) energy coverage with a FWHM of and a spectral resolution of 400 eV at 10 keV.
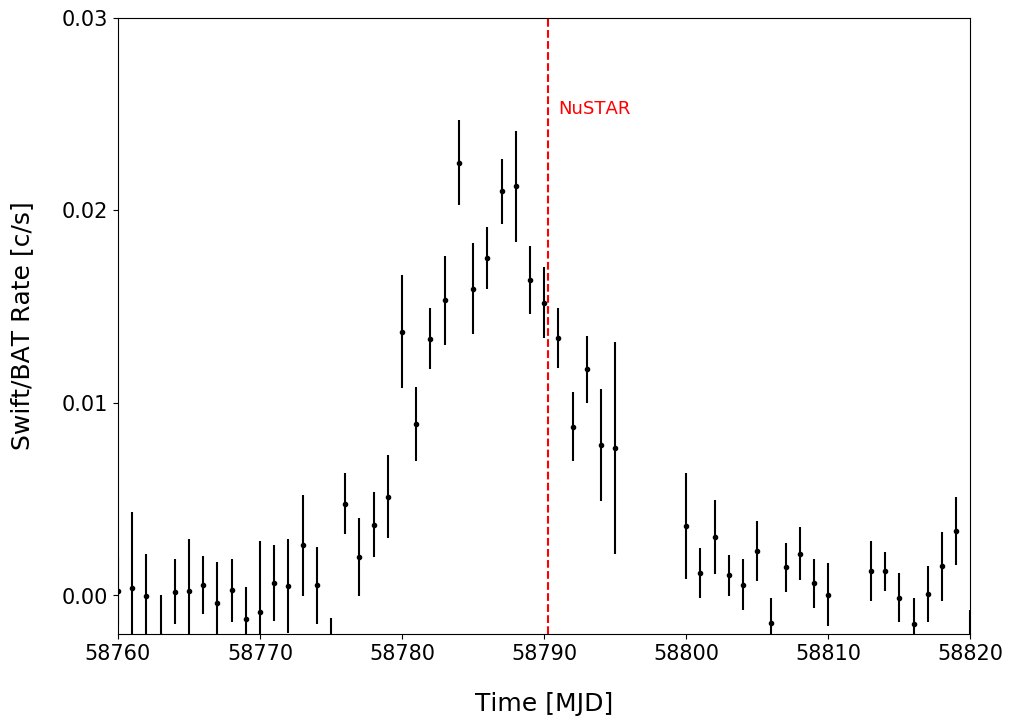
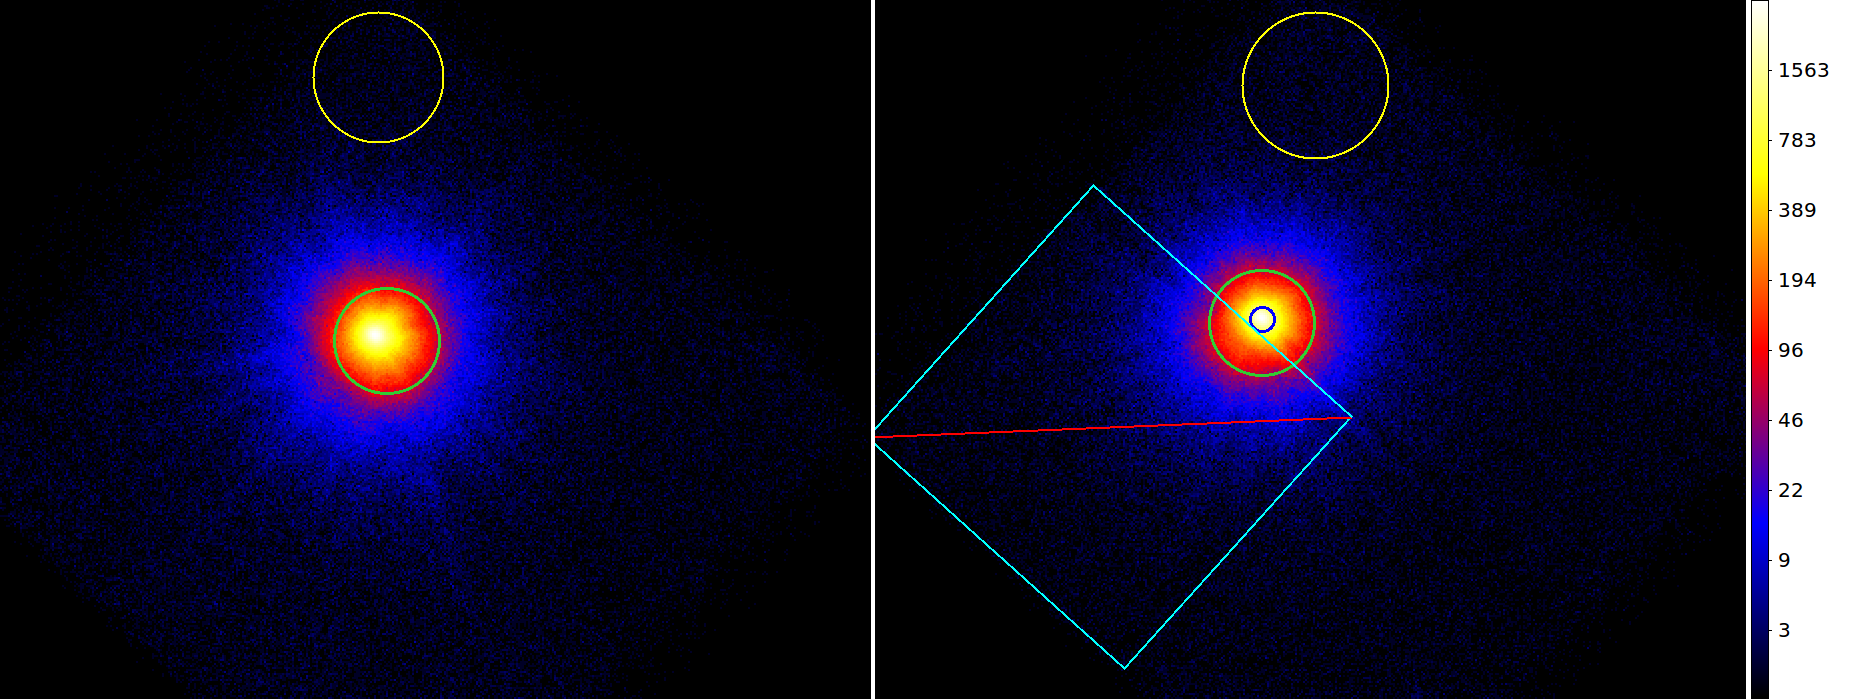
NuSTAR observed XTE J1858+034 on 2019 November 3 (ObsID 90501348002, MJD 58790), during an outburst (see Fig. 1). The total exposure time was about 44 ks. NuSTAR data were reduced with NUSTARDAS v1.9.5 provided by the HEASOFT v6.27.2 and using the CALDB 20200526 (Madsen et al., 2020). Cleaned events were obtained following the standard NuSTAR guidelines. The resulting images are shown in Fig. 2. Source spectra were extracted through the NUPRODUCTS routine. The source extraction region was a radius circular region centered on the source, while the background was extracted from a source-free region on the same detector with radii of and for FPMA and FPMB, respectively. We also verified that shifting the extraction regions in order to account for the offset between the images from the two modules does not significantly affect the results. However, in FPMB part of the source events fall on the chip gap between detectors 0 and 3, resulting in unaccounted loss of effective area. Moreover, NuSTAR detectors suffer from absorption due to a CdZnTe dead layer and a Pt coating at the top of the detectors, an effect that is calibrated through observations of the Crab in stray light mode (Madsen et al., 2017). However, the absorption curve can be degenerate with other effective area effects, and for detector 3 this has caused part of the detector-related absorption to be included in the vignetting curve, thus resulting in spectral differences in the low energy spectrum when compared to detector 0 (priv. comm. with the NuSTAR Science Operations Team). All these factors led us to exclude the entire detector 3 from the FPMB source extraction region. We obtained the FPMB ARF from a radius circular region centered on the source, which ensures that the detector absorption of detector 3 did not get included. Similarly, to avoid accidentally including the RMF from detector 3 during RMF generation the RMF for detector 0 was obtained directly from the CALDB (nuBcutdet0_20100101v001).
Spectral data were analyzed using XSPEC v12.11.0l (Arnaud, 1996). NuSTAR data were used in the range keV (keV for FPMB to further enhance consistency between spectra in the lowest channels), above which the background dominates. Spectra were rebinned to have at least counts per bin.
3 Results
3.1 Spectral analysis
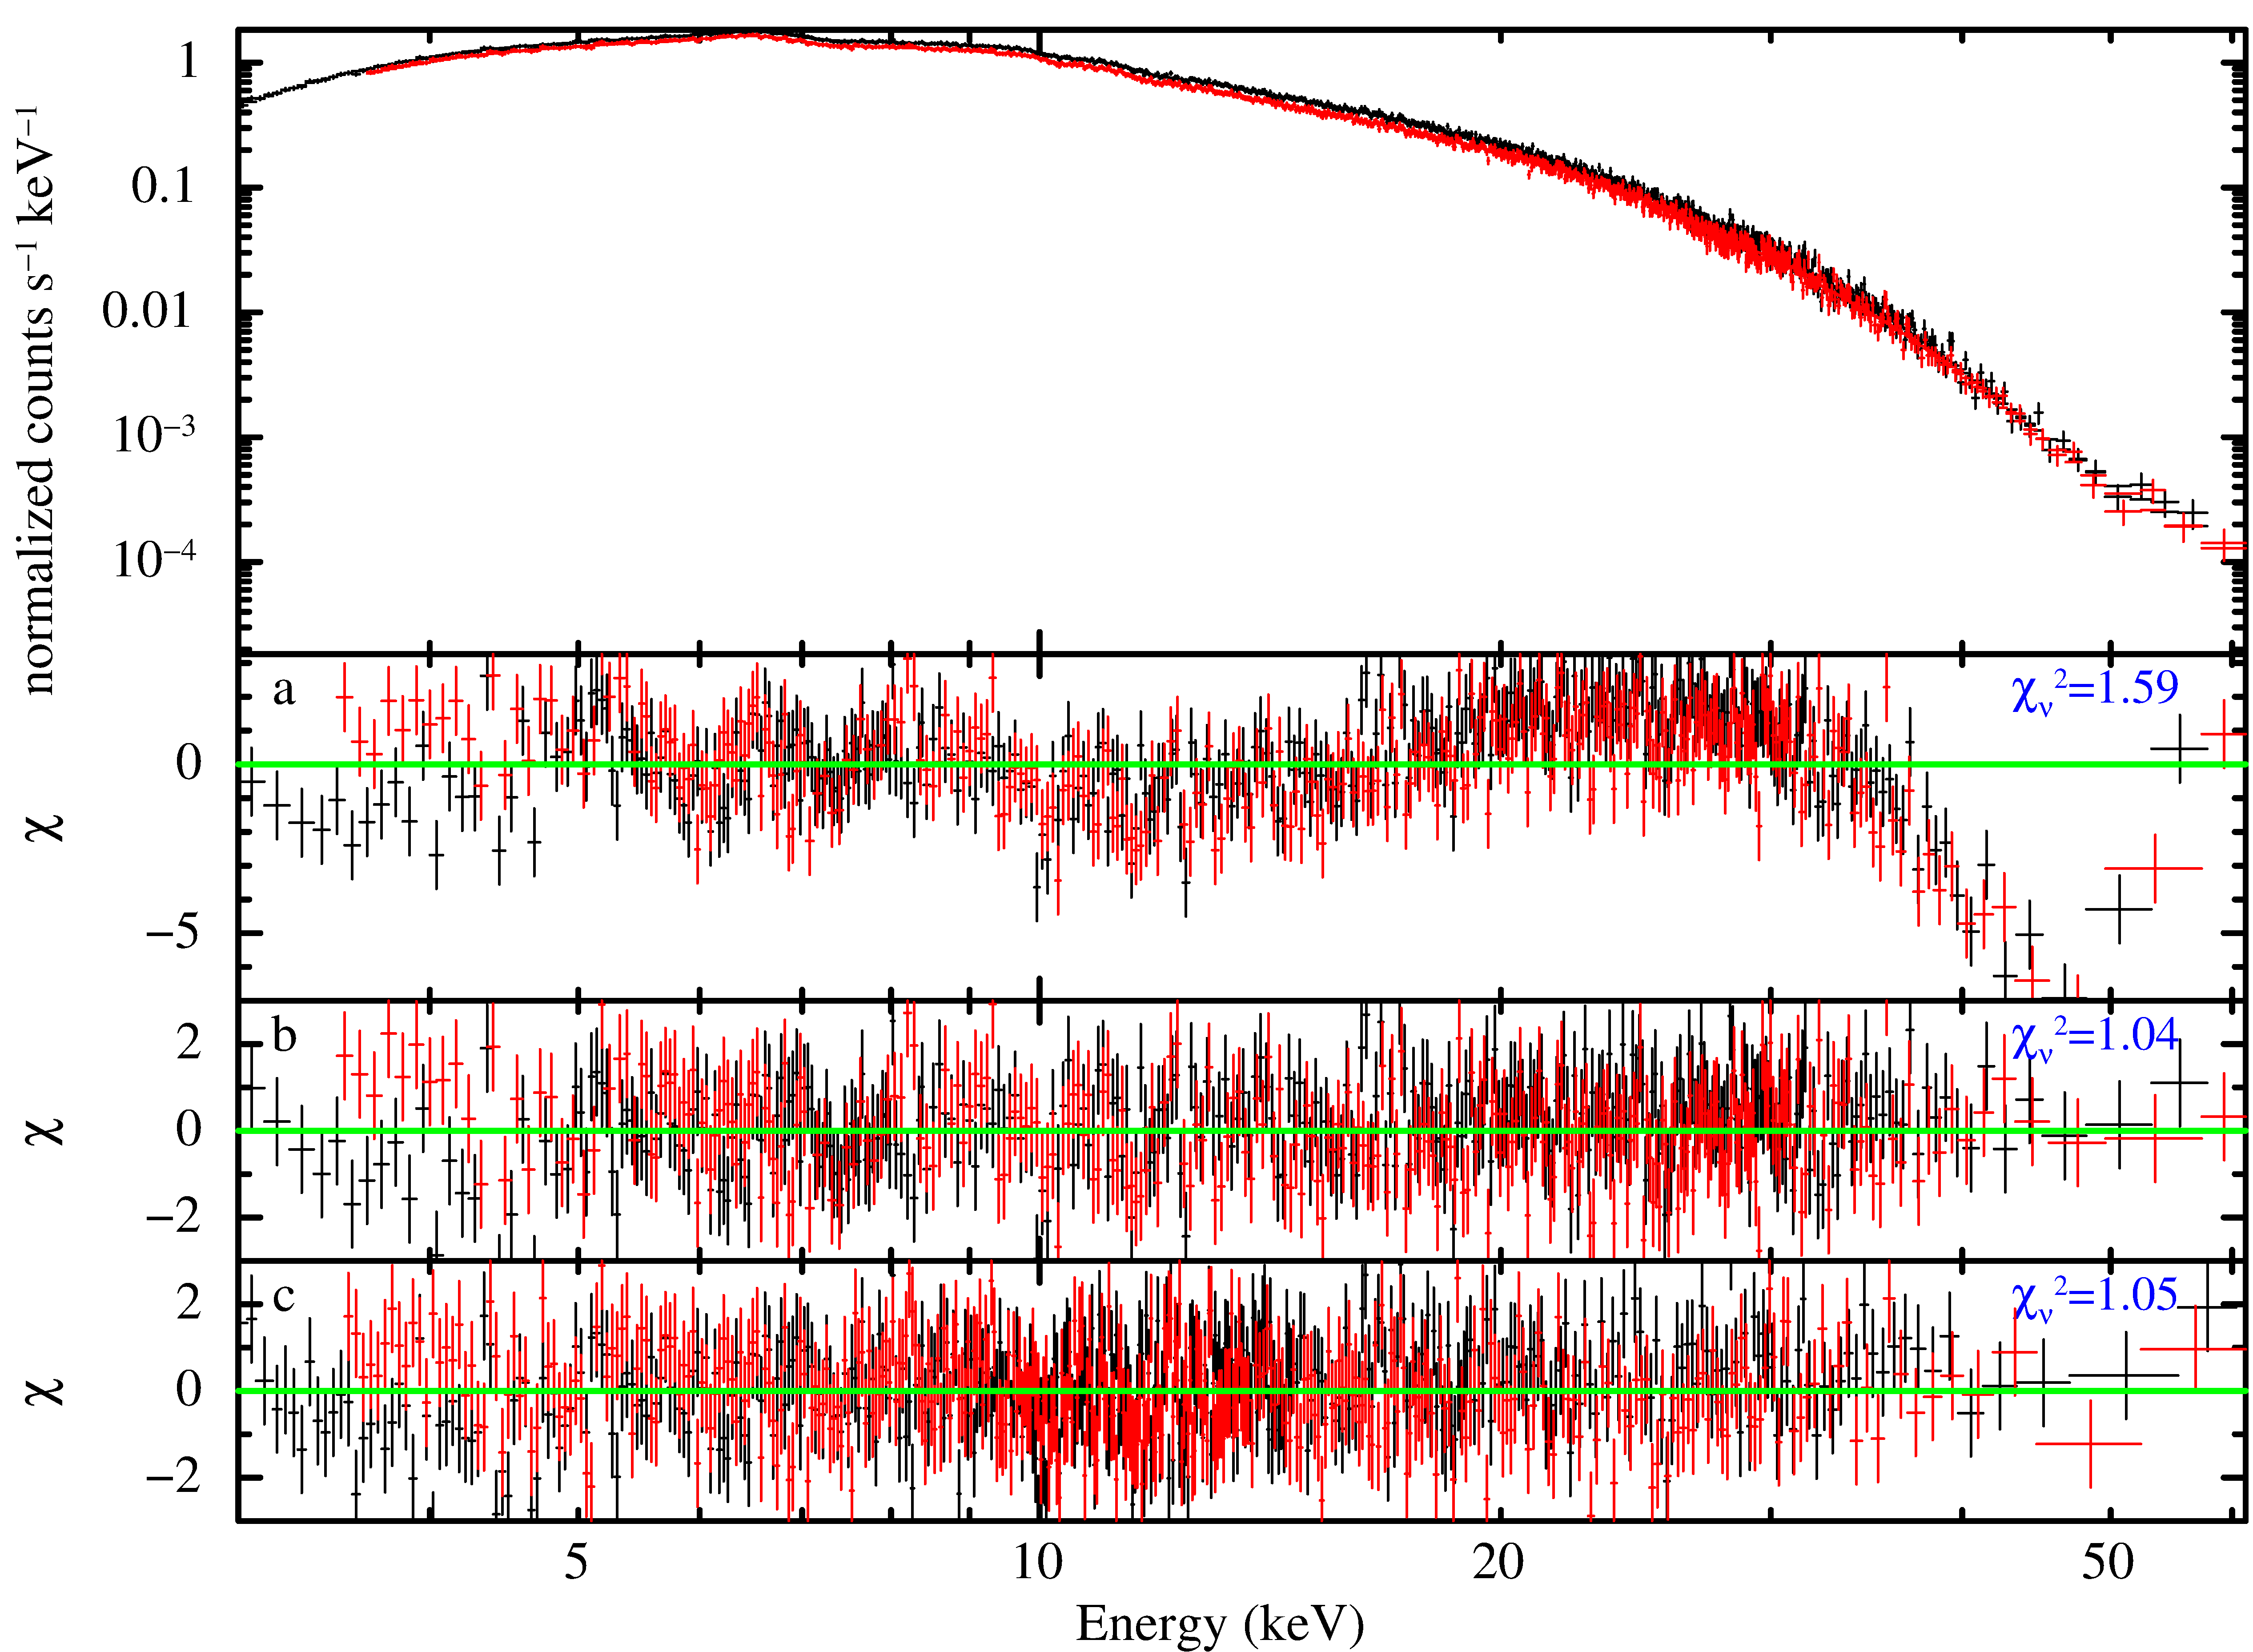
XTE J1858+034 as observed by NuSTAR in November 2019 clearly shows a hard spectrum. FPMA and FPMB spectra have been fitted simultaneously, allowing for a cross-normalization factor. Although the cross-normalization factor between FPMA and FPMB is usually of the order of a few percent (Madsen et al., 2015), the limited ARF extraction region adopted in our analysis for FPMB (see Sect. 2) is expected to reduce the cross-normalization value significantly. For the spectral fit, standard phenomenological and semi-empirical continuum models have been employed, namely two variants of the cutoff power-law model (cutoffpl and highecut*pow in XSPEC) and a Comptonization model of soft photons in a hot plasma (compTT in XSPEC, Titarchuk 1994), respectively. To obtain an acceptable fit, the cutoffpl and highecut*pow models need an additional component in the lower energy band, which has been modeled as a blackbody emission as found in other accreting XRPs (see, e.g., La Palombara & Mereghetti 2006). However, the blackbody temperature is high with respect to other XRPs, indicating that the phenomenological model is likely inadequate. Moreover, we also tested a purely-physical model of thermal and bulk Comptonization of the seed photons produced by cyclotron cooling (Ferrigno et al., 2009, bwcycl in XSPEC). For a fixed value of mass and radius of the accreting NS, the bwcycl model has six free parameters, namely the accretion rate , the magnetic field strength , the accretion column radius , the electron temperature , the photon diffusion parameter and the Comptonization parameter . This model was successfully used to fit the broad-band energy spectrum of a number of bright (erg s-1) accreting XRPs (see, e.g., Epili et al. 2017; D’Aì et al. 2017; Wolff et al. 2016).
For all tested models, the photoelectric absorption component and elemental abundances were set according to Wilms et al. 2000 (tbabs in XSPEC) to account for photoelectric absorption by neutral interstellar matter (or column density ), and assuming model-relative (wilm) solar abundances. Given that the Galactic in the direction of the source is about cm-2 (HI4PI Collaboration et al., 2016), all models show important local absorption values. All tested models also were equipped with a Gaussian emission line at 6.4 keV to account for the Fe K fluorescence emission.
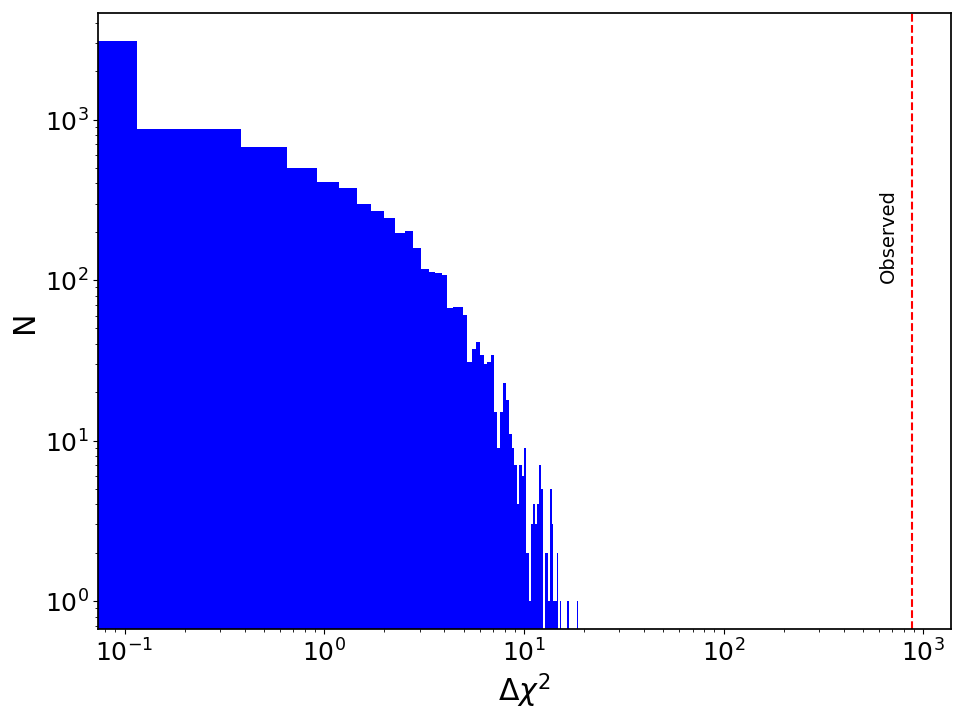
All fit continuum models show absorption-like residuals in the range keV. These residuals can be modeled with a Gaussian absorption line (see Fig. 3). The improvement in the best-fit statistics is maximum in the compTT model, i.e. . Other models show an improvement of , with the lowest derived from the highecut*pow model. The significance of the line in the compTT model has been assessed through Monte Carlo simulations. For this task, the XSPEC simftest routine was adopted, which allows to simulate a chosen number of spectra based on the actual data and test the resulting between each instance fit when the additional model component (the Gaussian absorption line in our case) is included. Following Bhalerao et al. (2015); Bodaghee et al. (2016), the column density parameter was fixed to its best-fit value, and the energy and width of the Gaussian absorption line were left free to vary within their confidence region in order to improve the speed and convergence of the fits. Simulations results are reported in Fig. 4 for a iterations process and confirm the significance of the absorption feature at c.l. Following Marcu-Cheatham et al. (2015), we also investigated the impact of a variable background normalization on the absorption feature parameters. Using the XSPEC tool recorn, it was found that the absorption line parameters do not change significantly if the normalization of the background spectrum is increased up to a higher level, thus strengthening the interpretation of the absorption feature as real and not due to artifacts. The feature was also observed in phase-resolved spectra presented in the accompanying paper by Tsygankov et al. (in press). Interpreting the feature at keV as a CRSF, and assuming a gravitational redshift of (for NS mass and radius of 1.4 and 10 km, respectively), a magnetic field strength of BG is obtained.
Following the bwcycl model instructions111https://heasarc.gsfc.nasa.gov/xanadu/xspec/manual/node148.html., it is convenient to freeze some of the model parameters in order to improve the computational speed and help the fit converge to the best-fit parameters. Once the best-fit was found, the column density also was fixed to its best-fit value to help the fit converge and to obtain parameters errors. Mass and radius of the NS were fixed to their canonical values of M⊙ and km, respectively. However, it is preferable to also fix the values of the NS magnetic field, its distance and its mass accretion rate (as derived by the observed luminosity). For XTE J1858+034, there are no previous conclusive estimations of the magnetic field, while a measurement of the distance is necessary for the latter two parameters. As mentioned in Sect. 1, the closest Gaia counterpart to the nominal X-ray position found by Molkov et al. (2004) was unlikely associated with the X-ray source or with the optical counterpart proposed by Reig et al. (2005). This was ascertained by Tsygankov et al. (in press), who shown that either of those possible counterparts is consistent with the much better constrained X-ray source location available through new Chandra observations. However, the distance to the X-ray system had not been estimated before their work, which in any case did not constrain it very much. Therefore, we opted for a different approach to obtain a more stringent value of the distance, based on the spin-up () measured by Fermi-GBM.
| cutoffpl | CompTT | |
| CFPMB | ||
|---|---|---|
| N [cm-2] | ||
| kT[keV] | – | |
| normbb | – | |
| E[keV] | ||
| [keV] | ||
| normKα () | ||
| – | ||
| HighECut [keV] | – | |
| normΓ∗ | – | |
| T0 [keV] | – | |
| kTCompTT [keV] | – | |
| [keV] | – | |
| normCompTT | – | |
| E[keV] | ||
| [keV] | ||
| Strength | ||
| Flux† | ||
| /d.o.f. |
To this aim, the publicly available spin-frequency values from GBM were used222https://gammaray.nsstc.nasa.gov/gbm/science/pulsars/lightcurves/xtej1858.html. The spin-up was measured during an interval of about 6 days around MJD 58786. The resulting spin-up value is s yr-1 (see also Malacaria et al. 2020, and references therein). Since the orbital parameters of this system are unknown, we tested the contribution of orbital modulation to the observed spin-up. First, although Doroshenko et al. (2008) report a possible orbital period for this source of about 380 days, we notice that its significance is low, while a visual inspection of the Swift/BAT (Krimm et al., 2013) data333https://swift.gsfc.nasa.gov/results/transients/weak/XTEJ1858p034/ for this source revealed an outbursts recurrence of days (see Fig. 5), here assumed as the orbital period. Moreover, for a K- or M-type optical companion star (Tsygankov et al., in press), we adopted a value of the mass function , where and are the mass of the companion and that of the NS, respectively, is the binary system inclination. This corresponds to a value of the semi-major projected axis, l-s. Also, the data required only a small value of the eccentricity, assumed here as . Finally, an epoch of MJD was chosen at the beginning of the first of the recurring outbursts. An argument of periapse of was found to best-fit the GBM frequency values assuming no accretion torque. This orbit assumed, the maximum orbital contribution to the spin-up was found to be only about .
| BWCYCa | BWCYCb | BWCYCc | |
| CFPMB | |||
|---|---|---|---|
| N [cm-2] | |||
| E[keV] | |||
| [keV] | |||
| normKα () | |||
| B [G] | (fixed) | (fixed) | |
| [g/s] | (fixed) | (fixed) | |
| Te [keV] | |||
| r0 [m] | |||
| d [kpc] | (fixed) | (fixed) | (fixed) |
| E[keV] | |||
| [keV] | |||
| Strengthgabs | |||
| Flux† | |||
| /d.o.f. |
Assuming a magnetic field strength of G and adopting the NuSTAR measured flux of erg cms-1 (see Table 1 and 2), the standard accretion-disk torque theory (Ghosh & Lamb, 1979) can be used to infer the distance of the source according to the equation:
| (1) |
where is the NS mass in units of 1.4 M⊙, is the NS radius in units of cm, is the moment of inertia in units of g cm2, is the magnetic moment in units of G cm3, is the dimensionless torque, is the spin period in seconds and is the bolometric luminosity in units of erg s-1. For a measured s yr-1, Eq. 1 allows to infer a distance of kpc (estimated uncertainty at c.l.). This distance value is also independently confirmed by the analysis of the optical companion star as reported in the accompanying paper by Tsygankov et al. (in press), and it was used to characterize different configurations of the bwcyc model. The corresponding mass accretion rate g s-1 was adopted altogether, derived assuming a luminosity , with efficiency (Sibgatullin & Sunyaev, 2000). The different configurations of the tested model are reported in Table 2 include a set with the magnetic field strength as a free parameter (BWCYCa), one with the magnetic field strength fixed to G (BWCYCb), and one with a free and a fixed magnetic field strength (BWCYCc).
3.2 Timing analysis
For the timing analysis, the nuproducts task was used to obtain light curves out of calibrated and cleaned events. These light curves were corrected for livetime, exposure and vignetting effects, and were extracted in the following energy bands: , , , , and keV.
All light curves were barycentered using the barycorr tool and the NuSTAR clock correction file nuCclock20100101v103. The light curve in the keV energy band was binned to s and used to search for pulsations around the known s periodicity with the epoch folding method (Leahy, 1987). The procedure results in a measured period of s. Pulsations are significant at %. The uncertainty was estimated by simulating 500 light curves based on real data and altered with Poisson noise.
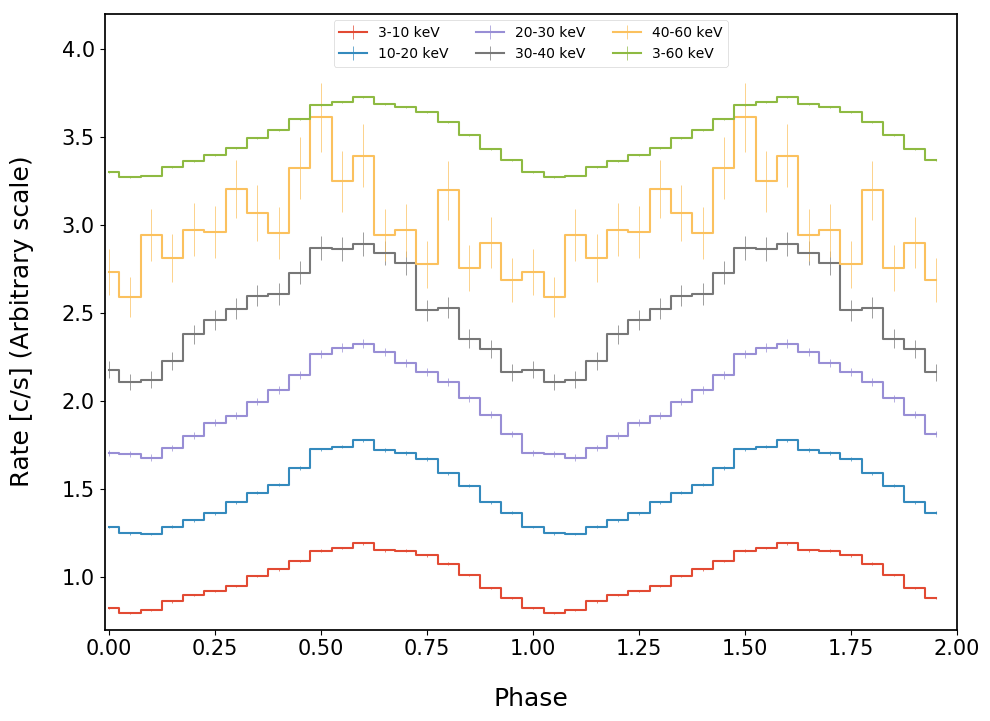
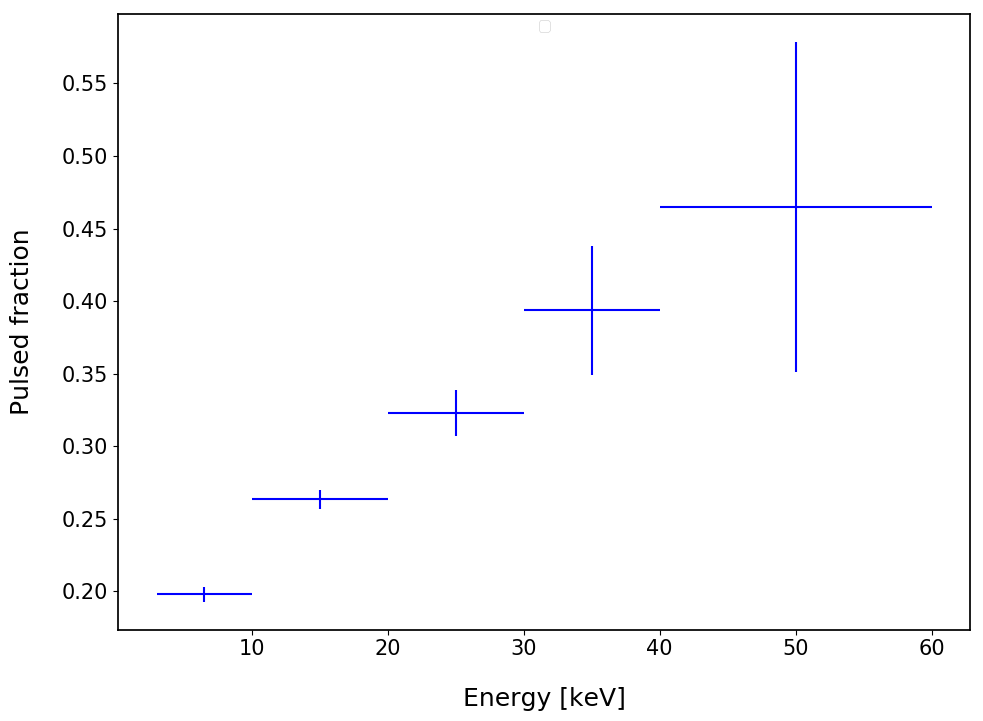
Light curves in different energy bands were folded to the best-fit spin period to obtain pulse profiles with a resolution of 20 phase bins (see Fig. 6). In turn, these were used to explore the pulsed fraction variation as a function of the energy (see Fig. 7). The pulsed fraction here is defined as , where are the maximum and minimum pulse profile count rate, respectively.
4 Discussion
4.1 Thermal Comptonization and a candidate cyclotron line
The hard spectrum of XTE J1858+034 resembles that of other accreting X-ray pulsars observed both at low and high luminosity and well fit by a CompTT model (Mukerjee et al., 2020, and references therein). The observation of CompTT spectra in accreting X-ray pulsars is usually interpreted as the result of thermal Comptonization processes in which the thermal energy of the accreting gas is transferred to the seed photons originating from the NS hotspots (Becker & Wolff, 2007). An increasing number of these sources also show that an additional CompTT component emerges in the high-energy range of the spectrum at low-luminosity stages (Tsygankov et al., 2019a, b). Although the formation of such component is not clear yet, it is likely due to a combination of cyclotron emission and following thermal Comptonized emission from a thin overheated layer of the NS atmosphere (see Tsygankov et al. 2019b, and references therein). In this context, X Persei is a remarkable case since it has been shown that the cyclotron line in its spectrum can be mimicked by the convolution of the two CompTT spectral components around the energy where the flux from the low- and high-energy components is comparable (Doroshenko et al., 2012). However, among the sources whose spectrum is formed by two CompTT components, X Persei is the one with the highest electron temperature of the hard-energy CompTT component, keV. If the absorption feature at keV in XTE J1858+034 is in fact resulting from the blend of two CompTT components, the high-energy CompTT would peak around keV. This would make XTE J1858+034 the most extreme among the X-ray pulsars that show such spectral shape. However, such a spectral shape has so far only been observed in low-luminosity X-ray pulsars, while our analysis (see Sect. 3.1) show that the source is located at a relatively large distance of kpc, thus implying a high-luminosity source (also supported by the analysis of Tsygankov et al., in press). A second Gaussian or CompTT component that peaked above keV was also tested in place of the absorption feature, but could not be successfully fit (), although possibly due to the lack of statistics above keV.
4.2 Thermal and bulk Comptonization
With the newly inferred source distance value of kpc, the derived flux of erg cms-1 implies a luminosity of erg s-1. Adopting this distance value, all different sets of the bwcyc model are statistically equivalent and all parameters show acceptable values. For the BWCYCa configuration, the returned magnetic field strength of G is consistent within with that inferred from the candidate CRSF. Notably, the BWCYCb model with fixed values of the distance, magnetic field strength and accretion rate also fits the data and returns acceptable values of the best-fit parameters. The BWCYCc fit returns the smallest (but still acceptable) value, and a mass accretion rate that is almost coincident with that inferred from the X-ray (isotropic) luminosity.
In any case, when interpreting the results from the bwcyc model, it is important to keep in mind that, as reported in Ferrigno et al. (2009), the BWcyc model may need adjustments in the spectral parameters with respect to the original prescriptions. For example, the best-fit magnetic field value may differ from that inferred by the CRSF if the spectrum is formed at a NS site that is spatially different than the CRSF forming region. Likewise, the best-fit mass accretion rate can be different from that inferred by the X-ray luminosity due to an uncertain efficiency conversion factor () and anisotropic emission.
4.3 Timing results
Pulse profiles of XTE J1858+034 as observed byNuSTAR show a single-peak structure and a shape that is only weakly energy-dependent (see Fig. 6). This is typically observed at low mass accretion rates (see, e.g. Malacaria et al. 2015), and qualitatively interpreted as the beaming pattern resulting from a pencil-beam emission. However, single-peaked pulse profiles are also observed at high accretion rates, like in the case of Pulsating Ultra-Luminous X-ray sources (PULXs), e.g. Swift J0243.6+6124, where single-peak pulse profiles persist at high luminosity and only switch to more complex profiles at super-Eddington luminosity (Wilson-Hodge et al., 2018).
The pulsed fraction shows a considerable energy-dependence, and almost doubles from in the keV to about in the keV energy band, above which the lack of statistics prevent us from drawing firm conclusions.
5 Conclusions
We analyzed the NuSTAR observation of the 2019 outburst of the XRB XTE J1858+034. The source, relatively poorly studied, has now been characterized in multiple ways. A candidate cyclotron line is found in its spectrum at keV. This implies a magnetic field strength of G, consistent with the value obtained from the physical fitting model of thermal and bulk Comptonization bwcyc in its best-fit configurations. We propose an orbital period of about 81 days based on the visual inspection of the X-ray outbursts recurrence time. Arguments are given to review the previously proposed optical counterpart and its distance value in favor of a distance of kpc obtained from standard accretion-torque theory.
References
- Arnaud (1996) Arnaud, K. A. 1996, in Astronomical Society of the Pacific Conference Series, Vol. 101, Astronomical Data Analysis Software and Systems V, ed. G. H. Jacoby & J. Barnes, 17
- Bailer-Jones et al. (2018) Bailer-Jones, C. A. L., Rybizki, J., Fouesneau, M., Mantelet, G., & Andrae, R. 2018, AJ, 156, 58
- Becker & Wolff (2007) Becker, P. A., & Wolff, M. T. 2007, ApJ, 654, 435
- Bhalerao et al. (2015) Bhalerao, V., Romano, P., Tomsick, J., et al. 2015, MNRAS, 447, 2274
- Bodaghee et al. (2016) Bodaghee, A., Tomsick, J. A., Fornasini, F. M., et al. 2016, ApJ, 823, 146
- D’Aì et al. (2017) D’Aì, A., Cusumano, G., Del Santo, M., La Parola, V., & Segreto, A. 2017, MNRAS, 470, 2457
- Doroshenko et al. (2012) Doroshenko, V., Santangelo, A., Kreykenbohm, I., & Doroshenko, R. 2012, A&A, 540, L1
- Doroshenko et al. (2008) Doroshenko, V. A., Doroshenko, R. F., Postnov, K. A., Cherepashchuk, A. M., & Tsygankov, S. S. 2008, Astronomy Reports, 52, 138
- Epili et al. (2017) Epili, P., Naik, S., Jaisawal, G. K., & Gupta, S. 2017, MNRAS, 472, 3455
- Ferrigno et al. (2009) Ferrigno, C., Becker, P. A., Segreto, A., Mineo, T., & Santangelo, A. 2009, A&A, 498, 825
- Ghosh & Lamb (1979) Ghosh, P., & Lamb, F. K. 1979, ApJ, 234, 296
- Harrison et al. (2013) Harrison, F. A., Craig, W. W., Christensen, F. E., et al. 2013, ApJ, 770, 103
- HI4PI Collaboration et al. (2016) HI4PI Collaboration, Ben Bekhti, N., Flöer, L., et al. 2016, A&A, 594, A116
- Krimm et al. (2013) Krimm, H. A., Holland, S. T., Corbet, R. H. D., et al. 2013, ApJS, 209, 14
- La Palombara & Mereghetti (2006) La Palombara, N., & Mereghetti, S. 2006, A&A, 455, 283
- Leahy (1987) Leahy, D. A. 1987, A&A, 180, 275
- Madsen et al. (2017) Madsen, K. K., Forster, K., Grefenstette, B. W., Harrison, F. A., & Stern, D. 2017, The Astrophysical Journal, 841, 56
- Madsen et al. (2020) Madsen, K. K., Grefenstette, B. W., Pike, S., et al. 2020, arXiv e-prints, arXiv:2005.00569
- Madsen et al. (2015) Madsen, K. K., Harrison, F. A., Markwardt, C. B., et al. 2015, ApJS, 220, 8
- Malacaria et al. (2020) Malacaria, C., Jenke, P., Roberts, O. J., et al. 2020, ApJ, 896, 90
- Malacaria et al. (2015) Malacaria, C., Klochkov, D., Santangelo, A., & Staubert, R. 2015, A&A, 581, A121
- Marcu-Cheatham et al. (2015) Marcu-Cheatham, D. M., Pottschmidt, K., Kühnel, M., et al. 2015, ApJ, 815, 44
- Molkov et al. (2004) Molkov, S. V., Cherepashchuk, A. M., Revnivtsev, M. G., et al. 2004, ATel, 274, 0
- Mukerjee et al. (2020) Mukerjee, K., Antia, H. M., & Katoch, T. 2020, arXiv e-prints, arXiv:2005.14044
- Nakajima et al. (2019) Nakajima, M., Negoro, H., Kurogi, K., et al. 2019, The Astronomer’s Telegram, 13217, 1
- Paul & Rao (1998) Paul, B., & Rao, A. R. 1998, A&A, 337, 815
- Reig et al. (2004) Reig, P., Kougentakis, T., & Papamastorakis, G. 2004, ATel, 308, 0
- Reig et al. (2005) Reig, P., Negueruela, I., Papamastorakis, G., Manousakis, A., & Kougentakis, T. 2005, A&A, 440, 637
- Remillard et al. (1998) Remillard, R., Levine, A., Takeshima, T., et al. 1998, IAU Circ., 6826, 0
- Sibgatullin & Sunyaev (2000) Sibgatullin, N. R., & Sunyaev, R. A. 2000, Astronomy Letters, 26, 699
- Staubert et al. (2019) Staubert, R., Trümper, J., Kendziorra, E., et al. 2019, A&A, 622, A61
- Takeshima et al. (1998) Takeshima, T., Corbet, R. H. D., Marshall, F. E., Swank, J., & Chakrabarty, D. 1998, IAU Circ., 6826, 0
- Titarchuk (1994) Titarchuk, L. 1994, ApJ, 434, 570
- Tsygankov et al. (2019a) Tsygankov, S. S., Doroshenko, V., Mushtukov, A. e. A., et al. 2019a, MNRAS, 487, L30
- Tsygankov et al. (2019b) Tsygankov, S. S., Rouco Escorial, A., Suleimanov, V. F., et al. 2019b, MNRAS, 483, L144
- Wilms et al. (2000) Wilms, J., Allen, A., & McCray, R. 2000, ApJ, 542, 914
- Wilson-Hodge et al. (2018) Wilson-Hodge, C. A., Malacaria, C., Jenke, P. A., et al. 2018, ApJ, 863, 9
- Wolff et al. (2016) Wolff, M. T., Becker, P. A., Gottlieb, A. M., et al. 2016, ApJ, 831, 194