Droplet ejection by electrowetting actuation
Abstract
Fast contact-line motion of a droplet spreading on a solid substrate under the electrowetting effect generates strong capillary waves on the droplet’s surface. The capillary waves may be strong enough to induce ejection of a satellite droplet from the primary one. In this study, we show that the size of the satellite droplet and the ejection time are not only dependent on the contact-line velocity, which directly relates to the applied voltage enabling the electrowetting effect, but also affected by the ejection dynamics. We derive a theoretical model of the criteria for droplet ejection and experimentally verify the proposed criteria for wide ranges of viscosity, droplet size and the applied voltage.
Fast motion of contact line during spreading of liquid droplets on solid substrates may result in ejection of satellite droplets Ding et al. (2012). Such droplet ejection is a fascinating physical phenomenon involving numerous fundamental problems such as spreading dynamics Cox (1986), capillary waves Keller and Miksis (1983); Billingham (1999), pinch-off singularity Day et al. (1998), coalescence Zhang et al. (2015, 2009); Thoroddsen2000 ; Shim2017 , or deformation and breakup dynamics of double emulsion droplets Chen2013 ; Chen2015 . Understanding the dynamics and the criteria at which ejection happens also provides important remarks for improving industrial processes including formation of aerosol droplets Gordillo and Rodríguez-Rodríguez (2019), polymer’s emulsions, industrial sprays Villermaux (2007), or controlling droplet jumping in digital microfluidics Merdasi (2019); Lee (2012); Cavalli (2016); Hong (2015) and electronics cooling Foulkes (2020).
The ejection of satellite droplets during spreading directly ties to the capillary wave on the surface of the primary droplet Ding et al. (2012). In normal droplet wetting phenomena where the spreading motion of a droplet is driven by capillarity at the contact line, capillary waves on the droplet surface is directly generated from the fast motion of the contact line. Thus, the ejection of satellite droplets is only possible for high wettability surfaces, i.e., those with small static contact angles, to induce sufficient spreading velocity Ding et al. (2012). This limits the capacity of using normal wetting phenomena to systematically study satellite droplet ejection during wetting. Due to this limitation, ejection dynamics of satellite droplets during spreading, as well as the required conditions for ejection, have been largely unexplored. Droplet spreading driven by electrowetting Vo et al. (2018), on the other hand, does not suffer this limitation. The velocity of the contact line of the electrowetting-actuated droplet is forcefully controlled by the electrowetting effect Vo and Tran (2021). As a result, by using the electrowetting effect to control droplet spreading, it is possible to trigger droplet ejection for varying surface wettability, liquid viscosities, and droplet radius, an advantage that allows us to systematically investigate ejection phenomena of satellite droplets.
In this Letter, we systematically examine the dynamic of satellite droplet ejection during wetting process of droplets on solid substrates in which the spreading velocity is forcefully controlled by the electrowetting effect. By varying the drop’s size, viscosity, and the applied voltage to adjust the electrowetting effect’s intensity, we study the contact line’s critical velocity beyond which ejection of the satellite droplets is possible. We also develop a predictive model for the condition of satellite droplet ejection and verify it experimentally.
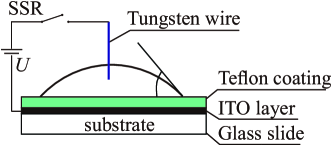
We prepare test substrates to induce electrowetting effect using indium-tin-oxide (ITO) glass slides covered by an amorphous fluoropolymer (Teflon AF-1601, DuPont) layer. The ITO layer has thickness of 200 nm and sheet resistance 20 . Teflon AF-1601, provided by the manufacturer (DuPont) as a 6% solution in Fluorinert® FC-40, was spincoated onto the ITO substrate at the speed 1000 round-per-minute for 30 seconds using a spin coater (Polos Spin150i, APT Automation). After spincoating, the coated substrate was immediately transferred to a hot plate for heating process to remove the solvent. The heating process includes two consecutive steps: 1) at C for minutes, and 2) at C for minutes Datta et al. (2003). The thickness of the Teflon layer is , measured using a surface profiler (Talyscan 150, Taylor Hobson). The Teflon coating has surface roughness of nm and negligible variations in thickness, examined by atomic force microscopy (Bioscope Catalyst, Bruker)Vo and Tran (2019).
A droplet is then gently deposited on a test substrate in every experiment. To form an electrowetting circuit, we dip a m diameter tungsten wire into the droplet and connect it to the positive terminal of a direct current (DC) power supply (IT6723G, ITECH), while the ITO layer to the negative one (see Fig. 1). We use a solid-state relay (SSR) to control the application of voltage to the electrowetting circuit. The applied voltage is in a form of a pulse having amplitude and pulse’s width . The amplitude is varied in the range V, while is kept fixed at ms, a sufficiently long period to ensure that droplets reach new equilibrium in every actuation.
The working liquids used to generate droplets are solutions of glycerol, DI water, and 0.125 M sodium chloride. We vary the viscosity of the liquid from to by changing the glycerol mass concentrations from 0% to 67% Vo et al. (2018). The viscosity of the liquid was measured using a rheometer (Discovery HR-2, TA Instrument). The radius of the droplets is varied in the range . In every experiment, we immerse the droplet and the substrate in silicone oil having viscosity and mass density (Clearco Products Inc.). The interfacial tension between the working liquid and the oil, measured by the pendant drop method, varies from to for the tested glycerol solutions Vo et al. (2018). The temperature of the oil pool is kept at in all experiments. We note that all droplets in our experiment have radii smaller than the capillary length mm, where is the gravitational acceleration, and is the mass density of the liquid. The contact angle of the droplet on the substrate when no voltage is applied is .
We use a high speed camera (Photron, SAX2), typically running at frames-per-second, to capture the behaviours of actuated droplets. The data presented in this Letter are obtained by repeating experiment with the same conditions at least three times, and the standard deviations of these repetitions are used for uncertainty estimation.
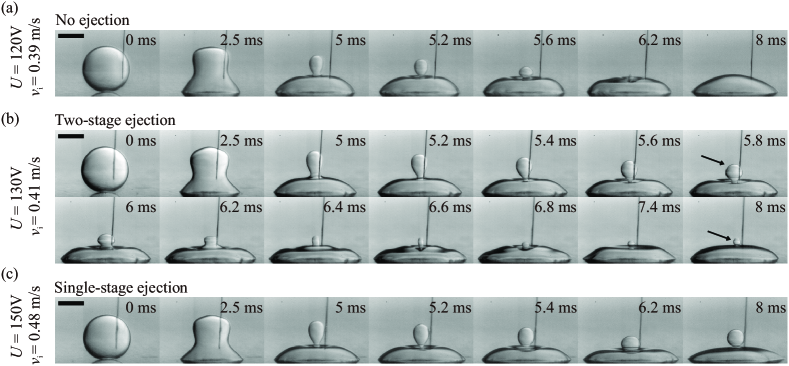
In Fig. 2, we show snapshots presenting the spreading and satellite-droplet ejecting dynamics of electrowetting-actuated droplets with several values of the applied voltage . We observe that, when is applied, fast spreading motion of the contact line caused by electrowetting effect forces the lower part of the droplet to rapidly expand and generates capillary waves propagating along the droplet-oil interface toward the apex of the droplet. When all the waves from the circular contact line hit the apex of the droplet at a same time, they create a column of liquid on top of the droplet which subsequently evolves to a balloon shape (see Fig. 2, snapshots at 5 ms). This process is similar to the formation of pancake shape (Liu et al., 2014) or pyramidal shape (Richard et al., 2002; Renardy et al., 2003) of liquid when a droplet impacts onto a solid substrate. Increasing the applied voltage leading in greater the contact-line spreading velocity and stronger the capillary waves on the droplet’s surface results in different behaviours of the liquid balloon and subsequently different satellite-droplet ejection dynamics. For voltage V, or equivalently, , where is the initial value of the contact-line velocity directly controlled by the applied voltage Vo and Tran (2021), the liquid balloon is pulled back and totally merged into the lower part of the droplet; no ejection of satellite droplets occurs (Fig. 2a). At V or , the merging process of the balloon and the lower part of the droplet creates sufficiently strong capillary waves on the balloon surface and eventually generates a small satellite droplet on top of the balloon (see Fig. 2b). This process is similar to the ejection of droplets during coalescence of unequal size drops (Zhang and Thoroddsen, 2008; Zhang et al., 2009), of bubbles and droplets (Zhang et al., 2015; Li et al., 2014), or coalescence cascade of a liquid drop Thoroddsen2000 ; Shim2017 . However, due to the high damping of our experimental system, we did not observe any subsequent coalescence or ejection of smaller droplets. We categorise this type of droplet ejection as two-stage ejection.
At the upper extreme, i.e., V or , the capillary waves on the primary droplet are sufficiently strong to cause pinch-off of the balloon shape and eject a much larger satellite droplet (see Fig. 2c). We categorise this type of ejection as single-stage ejection, a similar process to the so-called first-stage pinch-off of droplets during fast spreading reported by Ding et al Ding et al. (2012).
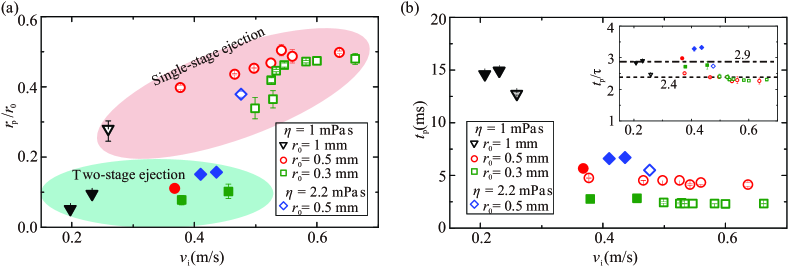
Size of ejected droplets and ejection time: The size of the ejected droplets and the ejection time depend on the types of droplet ejections, i.e., single-stage or two-stage. In Fig. 3a, we show the normalised radius of ejected droplets, , versus the initial contact-line velocity for several values of droplet radius and viscosity . We observe that the data are well separated depending on the type of droplet ejection: single-stage ejection possibly results in , whereas two-stage ejection possibly results in . For both types of ejection, increases with . However, in the single-stage ejection, increases at a higher rate compared to that in the two-stage ejection. In Fig. 3b, we show the ejection time versus . We observe that is independent of for fixed other parameters, i.e., , and type of ejection. There is a measurable increase in ejection time when the viscosity is increased from mPa s to mPa s. We note that it is, however, not possible to eject satellite droplets for viscosity larger than mPa s. Therefore, we are not able to examine the dependence of on for a larger range of viscosity. In the inset of Fig. 3b, we show the dependence of on , where , revealing that for a fixed value of viscosity (mPa s), for one-stage ejection (open markers), significantly different from that for the two-stage ejection (, solid markers). The difference in the ejection time between two types of ejection is accounted for the merging process in the two-stage ejection (see Fig. 2).
Criteria for two-state ejection: Similar to the case that droplet ejected during coalescence of unequal size droplets (Zhang et al., 2009), the two-stage ejection is driven by the Laplace pressure difference between the upper part, i.e., the liquid balloon (Fig. 2b), and the lower part of the droplet. Larger difference between the two curvatures creates stronger downward flows rushing through the neck connecting the upper and lower parts. Subsequently, this creates stronger capillary waves on the droplet’s surface. As a result, the ejection of the satellite droplets depends on the size difference between the two parts of the droplet. If we denote the ratio between the radii of the primary droplet and its upper part, the value of enabling droplet ejection in our experiment ranges between and for Ohnesorge number varying from to , consistent with the observation for the pinch-off criteria of unequal size droplets coalescence Zhang et al. (2009). In our experiment, the two-stage ejection occurs in a small range of sandwiched between no-ejection and the single-stage ejection. For example, with water droplet having mm, we observe no-ejection for , two-stage ejection for , and single-stage ejection for . As a result, two-stage ejection can be viewed as an intermediate regime between no-ejection and single-stage ejection when increasing .
Criteria for single-state ejection: In the single-stage ejection, the capillary waves on the droplet’s surface determining the ejection dynamics is directly driven by the fast motion of the contact line with the initial velocity , and decays over time by viscous damping with the coefficient Vo and Tran (2021), where is the contact line friction coefficient Vo and Tran (2018); Vo et al. (2018). The necessary condition for the ejection to happen is capillary-wave generation at the droplet-oil interface, which is previously reported as and Vo and Tran (2021). Here, is the Weber-like dimensionless number presenting the ratio of inertia caused by the contact line velocity to the capillarity Vo and Tran (2021); Keller and Miksis (1983); Billingham (1999).
We now seek for the sufficient condition to eject the satellite from the primary droplet, i.e., pinching off at the neck connecting the satellite droplet and the lower liquid body (Fig. 2). At the moment pinch-off happens, the downward velocity of the lower liquid body at the neck must be higher than that of the satellite droplet. On the one hand, as fluid motion in the upper neck toward the lower one is driven by the difference in Laplace pressure between the satellite droplet and the lower body, the downward velocity of the satellite droplet is . On the other hand, the downward velocity of the liquid body below the neck is determined by the phase velocity of the capillary waves at the same position. In our case, the phase velocity is estimated as , where is the wavelength, the wave frequency attenuated by the viscous effect, and the wave number Vo and Tran (2021). As a result, the sufficient condition for the transition from no-ejection to single-stage ejection is , which can be conveniently written in the dimensionless form
| (1) |
Here, is a constant of order unity arisen from the dimensional analysis.
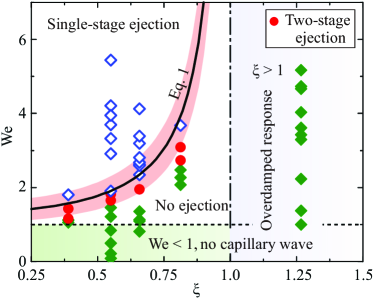
In Fig. 4, we show the map of various observed behaviours, most notably the ejection and no-ejection behaviours and their transition depending on two parameters and . The two lines and form a coordinate defining the quadrant in which ejection is possible, i.e., the second quadrant of the coordinate where and . The region having two-stage ejections (red circles) is clearly sandwiched between those with no-ejection and single-stage ejections. The transition to single-stage ejection is well captured by Eq. 1 (solid curve). We note that since there is no available theoretical formula for the values of , we use the experimental data of in Fig. 3a to test our theory, i.e., Eq. 1 is plotted using the experimental value of and . The shaded area around the solid curves in Fig. 4 shows the transition between no-ejection to ejection regions caused by the variation in the experimental values of from to . The good agreement between Eq. 1 and the experimental data confirms our prediction of the condition for satellite-droplet ejection by fast spreading due to electrowetting.
Relation between the applied voltage and the ejection criteria: With the conditions and , i.e., capillary waves occur on the surface of the electrowetting-actuated droplets, one can relate to by balancing the electrowetting-induced driving force at the contact line and the droplet’s inertia Vo and Tran (2021): . Here, is entirely determined by the system’s parameters and is the voltage at which capillary waves occur on the droplet’s surface. We note that it is also possible to determine theoretically using capillary waves generation condition Vo and Tran (2021). In principle, the relation between and together with Eq. 1 provide a complete theoretical conditions for satellite droplet ejection by electrowetting actuation.
In conclusion, we have ultilized the electrowetting effect to induce strong capillary waves on droplet-oil interfaces and investigated the resulting ejection of satellite droplets. Our results show that the radius of ejected droplets and the ejection time weakly depend on the wave magnitude, but vary substantially with the ejection type: a single-stage ejection usually generates larger satellite droplets in shorter time compared to a two-stage counterpart. We also experimentally determine the conditions enabling droplet ejection and proposed a model capturing such conditions using the Weber-like number and the damping coefficient . An excellent agreement between the theoretical model and the experimental data not only offers a better understanding in fundamental problems such as pinch-off of elongated droplets (Day et al., 1998; Burton and Taborek, 2007) or rupture of liquid sheets (Kitavtsev et al., 2018), but also is useful for practical applications such as digital microfluidics and ink-jet printing.
This study is supported by Nanyang Technological University and the Agency for Science, Technology and Research (A*STAR) under its Pharos Funding Scheme (Grant No. 1523700102).
I Data Availability
The data that supports the findings of this study are available within the article.
References
- Ding et al. (2012) H. Ding, E. Q. Li, F. H. Zhang, Y. Sui, P. D. M. Spelt, and S. T. Thoroddsen, J. Fluid Mech. 697, 92 (2012).
- Cox (1986) R. G. Cox, J. Fluid Mech. 168, 169 (1986).
- Keller and Miksis (1983) J. B. Keller and M. J. Miksis, SIAM J. Appl. Math. 43, 268 (1983).
- Billingham (1999) J. Billingham, J. Fluid Mech. 397, 45 (1999).
- Day et al. (1998) R. F. Day, E. J. Hinch, and J. R. Lister, Phys. Rev. Lett. 80, 704 (1998).
- Zhang et al. (2015) F. H. Zhang, M. J. Thoraval, S. T. Thoroddsen, and P. Taborek, J. Fluid Mech. 782, 209 (2015).
- Zhang et al. (2009) F. H. Zhang, E. Q. Li, and S. T. Thoroddsen, Phys. Rev. Lett. 102, 104502 (2009).
- (8) S. T. Thoroddsen, and K. Takehara, Phys. Fluids 12, 1265 (2000).
- (9) S. Shim, and H. A. Stone, Phys. Rev. Fluids 2, 044001 (2017).
- (10) Y. Chen, X. Liu, and M. Shi, Appl. Phys. Lett. 102, 051609 (2013).
- (11) Y. Chen, X. Liu, and M. Shi, Appl. Phys. Lett. 102, 141601 (2015).
- Gordillo and Rodríguez-Rodríguez (2019) J. M. Gordillo and J. Rodríguez-Rodríguez, J. Fluid Mech. 867, 556 (2019).
- Villermaux (2007) E. Villermaux, Annu. Rev. Fluid Mech. 39, 419 (2007).
- Merdasi (2019) A. Merdasi, M. A. Daeian, A. Moosavi, and M. B. Shafii, Extreme Mech. Lett. 32, 100538 (2019).
- Lee (2012) S. J. Lee, S. Lee, and K. H. Kang, Appl. Phys. Lett. 100, 081604 (2012).
- Cavalli (2016) A. Cavalli, D. J. Preston, E. Tio, D. W. Martin, N. Miljkovic, E. N. Wang, F. Blanchette, and J. W. M. Bush, Phys. Fluids 28, 022101 (2016).
- Hong (2015) J. Hong, and S. J. Lee, Lap. Chip. 15, 900 (2015).
- Foulkes (2020) T. Foulkes, J. Oh, P. Sokalski, L. Li, S. Sett, J. Sotelo, Y. Yan, R. Pilawa-Podgurski, A. Castaneda, M. Steinlauf, and N. Miljkovic1, Appl. Phys. Lett. 116, 203701 (2020).
- Vo et al. (2018) Q. Vo, H. Su, and T. Tran, Sci. Rep. 8, 836 (2018).
- Vo and Tran (2021) Q. Vo and T. Tran, (2021), arXiv:2101.02821 .
- Datta et al. (2003) A. Datta, I.-Y. Eom, A. Dhar, P. Kuban, R. Manor, I. Ahmad, S. Gangopadhyay, T. Dallas, M. Holtz, H. Temkin, and P. K. Dasgupta, IEEE Sens. J. 3, 788-795 (2003) .
- Liu et al. (2014) Y. Liu, L. Moevius, X. Xu, T. Qian, J. M. Yeomans, and Z. Wang, Nat. Phys. 10, 515 (2014) .
- Richard et al. (2002) D. Richard, C. Clanet, and D. Quéré, Nature 417, 811 (2002).
- Renardy et al. (2003) Y. Renardy, S. Popinet, L. Duchemin, M. Renardy, S. Zaleski, C. Josserand, M. A. Drumright-Clarke, D. Richard, C. Clanet, and D. Quéré, J. Fluid Mech. 484, 69 (2003).
- Zhang and Thoroddsen (2008) F. H. Zhang and S. T. Thoroddsen, Phys. Fluids 20, 022104 (2008) .
- Li et al. (2014) E. Q. Li, S. A. Al-Otaibi, I. U. Vakarelski, and S. T. Thoroddsen, J. Fluid Mech. 744, R1 (2014).
- Vo and Tran (2018) Q. Vo and T. Tran, Phys. Rev. E 97, 063101 (2018).
- Hong and Lee (2015) J. Hong and S. J. Lee, Lab Chip 15, 900 (2015).
- Vo and Tran (2019) Q. Vo and T. Tran, Phys. Rev. Lett. 123, 024502 (2019).
- Burton and Taborek (2007) J. C. Burton and P. Taborek, Phys. Rev. Lett. 98, 224502 (2007).
- Kitavtsev et al. (2018) G. Kitavtsev, M. A. Fontelos, and J. Eggers, J. Fluid Mech. 840, 555 (2018) .