Composite Bulges – II. Classical Bulges and Nuclear Discs in Barred Galaxies: The Contrasting Cases of NGC 4608 and NGC 4643
Abstract
We present detailed morphological, photometric, and stellar-kinematic analyses of the central regions of two massive, early-type barred galaxies with nearly identical large-scale morphologies. Both have large, strong bars with prominent inner photometric excesses that we associate with boxy/peanut-shaped (B/P) bulges; the latter constitute % of the galaxy light. Inside its B/P bulge, NGC 4608 has a compact, almost circular structure (half-light radius pc, Sérsic ) we identify as a classical bulge, amounting to 12.1% of the total light, along with a nuclear star cluster ( pc). NGC 4643, in contrast, has a nuclear disc with an unusual broken-exponential surface-brightness profile (13.2% of the light), and a very small spheroidal component ( pc, ; 0.5% of the light). IFU stellar kinematics support this picture, with NGC 4608’s classical bulge slowly rotating and dominated by high velocity dispersion, while NGC 4643’s nuclear disc shows a drop to lower dispersion, rapid rotation, - anticorrelation, and elevated . Both galaxies show at least some evidence for - correlation in the bar (outside the respective classical bulge and nuclear disc), in agreement with model predictions. Standard 2-component (bulge/disc) decompositions yield –0.7 (and bulge ) for both galaxies. This overestimates the true “spheroid” components by factors of four (NGC 4608) and over 100 (NGC 4643), illustrating the perils of naive bulge-disc decompositions applied to massive barred galaxies.
keywords:
galaxies: structure – galaxies: bulges – galaxies: spiral1 Introduction
Disc galaxies have traditionally been said to have two main stellar components: a flattened, rotationally supported disc and (optionally) a rounder, kinematically hot bulge. The latter – often characterized as akin to a small elliptical galaxy embedded within the disc – is thought to be especially prominent in the earliest spirals and in lenticular/S0 galaxies. Older studies have suggested that the bulge constitutes –60% of the total stellar light in such systems (e.g., Simien & de Vaucouleurs, 1986), a result shared by some recent decompositions of large, SDSS-based samples (e.g., Oohama et al., 2009; Kim et al., 2016).
Bulges are important for understanding galaxy evolution for a number of reasons. First, their formation is supposed to involve early mergers – with the possibility of further growth via minor mergers – so their presence and size provide potential clues about the early stages of galaxy formation (e.g., Brooks & Christensen, 2016, and references therein). In addition, a number of studies have shown that star formation anticorrelates with the presence of bulges, which suggests that the presence or growth of bulges is a possible prerequisite for the cessation of star formation, or even a possible cause of it, a phenomenon sometimes termed “morphological quenching” (e.g., Martig et al., 2009; Martig et al., 2013; Bluck et al., 2014; Lang et al., 2014; Eales et al., 2020). Finally, there are the well-known correlations between bulge characteristics – particularly central velocity dispersions or bulge luminosity/mass – and supermassive black hole (SMBH) masses (e.g., Kormendy & Ho, 2013; Saglia et al., 2016, and references therein). In this context, the idea that bulges are in effect smaller, lower-mass elliptical galaxies embedded within larger discs seems to match up quite well with the idea of SMBH-galaxy correlations that extend from massive elliptical galaxies down to the small bulges of disc galaxies.
However, our understanding of how bulges form, grow, and correlate with other galaxy properties has been complicated in the last couple of decades by the realization that bulges are not all alike, and that not all bulges are necessarily similar to small elliptical galaxies. This began with the discovery that some bulges were unusually flattened or dominated by rotation, or marked by the presence of clearly disclike phenomena such as spiral arms or nuclear bars – almost as if they were more like small discs embedded within the main disc (see Kormendy & Kennicutt, 2004, and references therein).
A second development was the demonstration that some bulges in edge-on galaxies had characteristics – boxy or peanut shapes, cylindrical stellar rotation, associated in-plane gas and stellar kinematics indicative of bars – indicating that even though they were clearly not disclike structures, they were the vertically thickened inner parts of bars (e.g., Kuijken & Merrifield, 1995; Merrifield & Kuijken, 1999; Bureau & Freeman, 1999; Lütticke et al., 2000; Chung & Bureau, 2004; Bureau et al., 2006). Such structures are usually referred to as “boxy/peanut-shaped” (B/P) bulges; although they are thicker than discs, in origin, structure, and kinematics they are emphatically different from the traditional idea of a bulge. More recent imaging studies have shown that these structures can be identified in galaxies with intermediate or low inclinations as well, appearing in the form of “box + spurs” or “barlens” morphologies inside bars (Erwin & Debattista, 2013; Laurikainen et al., 2014; Athanassoula et al., 2015; Herrera-Endoqui et al., 2017; Li et al., 2017; Laurikainen & Salo, 2017; Erwin & Debattista, 2017; Kruk et al., 2019); their frequency is a strong function of galaxy stellar mass, becoming almost ubiquitous in the most massive barred galaxies (Erwin & Debattista, 2017; Li et al., 2017).
All such “non-classical” bulges have tended to be lumped together under the term “pseudobulges”, with the complementary term “classical bulges” denoting the more traditional kinematically hot, elliptical-like spheroids. Although there continues to be a tendency to interpret these developments as meaning that the central regions of disc galaxies are dichotomous – that they can have either a classical bulge or some (single) kind of pseudobulge – there has also been a growing awareness that “bulges” may sometimes be made up of multiple, coexisting stellar components. This was first clearly articulated from a theoretical perspective by Athanassoula (2005), who suggested that the centers of discs could harbor potentially any combination of classical bulges, “disc-like” bulges, and the B/P bulges of bars. Recent observational work has clearly shown individual examples of galaxies with bulges that are made up of at least two distinct components, either from a morphological perspective based on profiles or image decompositions (e.g., Laurikainen et al., 2014; Athanassoula et al., 2015; Läsker et al., 2016), or from combinations of decompositions and analyses of the stellar kinematics (e.g., Méndez-Abreu et al., 2014; Erwin et al., 2015).
Evidence for multiple types of bulges has been found for the Milky Way itself: recent work has established that the dominant bulge in the Milky Way is the B/P bulge of its bar (e.g., Shen et al., 2010; Bland-Hawthorn & Gerhard, 2016; Debattista et al., 2017b), with good evidence for a low-mass nuclear disc (e.g., Launhardt et al., 2002; Schönrich et al., 2015; Nogueras-Lara et al., 2019; Gallego-Cano et al., 2020; Sormani et al., 2020) – but also little evidence for any significant classical bulge (e.g., Bland-Hawthorn & Gerhard, 2016). In addition, careful analysis of M31 shows that its bulge consists of two components: a dominant B/P bulge belonging to its bar and a sub-dominant classical bulge, with the former having about twice the stellar mass of the latter (Athanassoula & Beaton, 2006; Opitsch et al., 2018; Blaña Díaz et al., 2017; Blaña Díaz et al., 2018).

The question of what “bulges” in disc galaxies actually are is now a critical one. In particular, we would like to know how often disc galaxies have spheroidal, kinematically hot classical bulges, how often they have nuclear discs or discy pseudobulges, and how often they have B/P bulges. We would also like to know how often, and in which ways, these different structures can coexist in the same galaxy, and what fraction of a galaxy’s stars can be found in the different inner components.
Identifying, enumerating, and understanding these distinct forms of bulges is important, because they have very different formation mechanisms, and potentially different effects on their host galaxies. As noted above, classical bulges are supposed to be the result of violent, gas-rich mergers very early in galaxy’s history. Discy pseudobulges (nuclear discs) are thought to form from bar-driven gas inflow and subsequent star formation, and are thus the result of internal (“secular”) processes that are unrelated to mergers, and which require the prior formation of a bar (e.g., Kormendy & Kennicutt, 2004; Wozniak & Michel-Dansac, 2009; Cole et al., 2014; Baba & Kawata, 2020). B/P bulges also require the formation of a bar, since they form out of (and remain part of) the bar; they are also the result of internal processes, albeit ones rather different from gas inflow (e.g., Combes & Sanders, 1981; Combes et al., 1990; Raha et al., 1991; Quillen, 2002; Martinez-Valpuesta & Shlosman, 2004; Debattista et al., 2005, 2006; Quillen et al., 2014; Sellwood & Gerhard, 2020). All of this is clearly relevant to more general bulge–host-galaxy correlations and processes. For example, it is easy to see how classical bulges might correlate with SMBHs, while a connection with nuclear-disc formation is less obvious, and the formation of B/P bulges would at first glance seem quite unrelated to SMBH growth.111Fragkoudi et al. (2016) do suggest that bars with B/P bulges could be less efficient (than bars without B/P bulges) at promoting gas inflow to the central kpc, leading to lower nuclear fueling rates.
To address these issues, we have undertaken a multi-wavelength imaging and spectroscopic observing campaign – the Composite Bulges Survey (Erwin et al., 2020, hereafter “Paper I”) – aimed at identifying and characterizing all the different components that may reside in the centers of massive disc galaxies, from bars – and their boxy/peanut-shaped inner components – down to nuclear discs (and nuclear rings and nuclear bars) and even to nuclear star clusters (NSCs; Neumayer et al., 2020). This study is based around a mass- and volume-limited sample of approximately fifty nearby, early- and intermediate-type (S0–Sbc) disc galaxies, each observed in the optical and near-IR with the Hubble Space Telescope (HST), and with planned observations of all galaxies using the MUSE integral field spectrograph.
In this paper we present a detailed study of inner structures of two galaxies from this sample. This paper both serves as a model for analysis of the rest of our sample (using both high-resolution near-infrared imaging and 2D stellar kinematics), and enables a comparison of how our detailed approach contrasts with the simpler approaches frequently used in galaxy decompositions, especially for large samples. The galaxies we study here are early-type disc galaxies with similar masses and morphologies, seen at very similar orientations: NGC 4608 (SB0, ) and NGC 4643 (SB0/a, ); see Figure 1 for large-scale optical views of both.222See Section 3 for the source of their classifications and stellar masses. Both galaxies have inclinations –40° and are strongly barred, with the bar oriented close to the minor axis of its parent galaxy. In a general morphological sense, they are close to being twins, and there is evidence that both galaxies’ bars contain B/P bulges, making them even more similar.333Evidence for B/P bulges can be found in Laurikainen et al. (2014), Athanassoula et al. (2015), Laurikainen & Salo (2017), and Section 4.4. And yet, as we will show, their inner regions are quite different: one galaxy (NGC 4608) hosts a classical bulge (and probably a nuclear star cluster) inside its B/P bulge, while the other (NGC 4643) has a massive nuclear disc444Previously suggested by Erwin & Sparke (2003) and Erwin (2004). with an unusual broken-exponential surface-brightness profile. Inside this nuclear disc is a smaller spheroidal structure that is probably too large to be a nuclear star cluster, but is about an order of magnitude smaller and less massive than the first galaxy’s classical bulge.
Section 2 of this paper discusses the parent sample and the data sources for the two galaxies, while Section 3 summarizes their general characteristics. Section 4 is devoted to our detailed, 2D decompositions of near-IR images of both galaxies, while Section 5 uses published and archival 2D stellar-kinematic data to test and validate the morphological results of the preceding decompositions. Section 6 includes discussion of the nuclear disc in NGC 4643 and the implications of our analysis for simplistic, two-component decompositions of large galaxy samples; Section 7 summarizes our findings.
2 Parent Sample and Data Sources
A fuller description of our sample and observing strategy is presented in Paper I; here, we provide a brief overview.
The Composite Bulges Survey is designed to probe the morphology and stellar kinematics and populations of the bulge regions (e.g., the inner 1–2 kpc) of massive disc galaxies. It is based on a volume- and mass-limited sample with an upper limit on distances of 20 Mpc, so that with HST imaging we can resolve down to pc or better in the near-IR (assuming a PSF FWHM in the F160W band).
The sample is defined so as to include all S0–Sbc galaxies in de Vaucouleurs et al. (1993, RC3) with Galactic latitude , distances Mpc, stellar masses , and inclinations between and . Since we plan to augment our dataset with archival and future spectroscopy from the Very Large Telescope (VLT), we limited the positions on the sky to . The result was a total of 54 galaxies spanning a range of environments from the local field to the Virgo Cluster. One galaxy (NGC 5363) was subsequently identified as a probable elliptical rather than an S0, so we are left with a total of 53 disc galaxies.
2.1 HST Data from the Composite Bulges Survey
The primary dataset is a consistent set of optical and near-IR images obtained with HST, using the Wide Field Camera 3 (WFC3) in both its UVIS and IR modes (Cycle 25, Proposal ID 15133). Since we are first and foremost interested in the underlying stellar structure, with as little confusion due to dust as possible, the main emphasis of the proposal was on full-field WFC3-IR imaging using the F160W filter, with a total integration time of 600s divided into four dithered exposures. For the sake of efficiency in readout time and data storage, the optical imaging was restricted to the C1K1C aperture, which is a -pixel subset of the full WFC3-UVIS array; we obtained four dithered exposures in each of the F475W and F814W filters, for total integration times of 700s in F475W and 500s in F814W.555See Paper I for notes on slight variations in this scheme for six of the galaxies, which did not apply to the galaxies studied in this paper. This enabled us to obtain all exposures for a given galaxy within a single HST orbit.
Individual exposures in each band were combined using the Python-based Drizzlepac code. After some experimentation, we adopted output image scales of 0.03″ pixel-1 for the optical images and 0.06″ pixel-1 for the F160W images, with pixfrac = 0.7. Since the galaxies are larger than the WFC3-IR field of view, it is impossible to accurately estimate the sky background from the HST images; accordingly, we turned sky subtraction off during the processing. (We account for the sky background as part of our modeling process; see Section 4.)
For purposes of photometric calibration, we started with the standard calibration to the Vega-magnitude (VEGAMAG) F160W system in the F160W filter. We converted these to 2MASS -band equivalents following the suggestion of Riess (2011), which uses the 2MASS colours. For red galaxies like NGC 4608 and NGC 4643, the correction works out to .
2.2 Other Imaging Data
For large-scale decompositions, we make use of Spitzer IRAC1 (3.6µm) images of NGC 4608 and NGC 4643. The image for NGC 4643 comes from the Spitzer Survey of Stellar Structure in Galaxies (S4G; Sheth et al., 2010), with the latter’s final mosaic pixel scale of 0.75 ″/pixel. NGC 4608 was not part of S4G so we use the archive-generated mosaic image (Program ID 10043, PI Kartik Sheth), with the default archive mosaic pixel scale of 0.6 ″/pixel.666The observation of NGC 4608 is part of an extension to S4G meant to fill in the missing elliptical and S0 galaxies (Sheth et al., 2013; Knapen et al., 2014). For both galaxies, we estimated the residual sky background as the mean of the median values of –100 -pixel boxes located well away from the galaxies and from bright stars.
2.3 Integral Field Unit Spectroscopic Data: SAURON and MUSE
Two-dimensional stellar-kinematic information, obtained with the SAURON instrument, is available for the central regions of both galaxies from ATLAS3D (Cappellari et al., 2011; Krajnović et al., 2011). SAURON (Bacon et al., 2001) is an integral field spectrograph composed of 0.94″ lenslets with a field of view, which spans the inner kpc of each galaxy. We used the stellar-kinematics tables (containing the Gauss-Hermite , , and parameters) from the main ATLAS3D web site777http://www-astro.physics.ox.ac.uk/atlas3d/tables . The instrumental resolution is , which is comfortably below the central velocity dispersions of both galaxies (130 for NGC 4608 and 147 for NGC 4643, according to HyperLEDA).
We additionally made use of SAURON observations from Seidel et al. (2015) for NGC 4643. These consist of seven separate pointings which together cover the whole of the bar region () rather than just the single-pointing ATLAS3D observation, which only covers the innermost region.
NGC 4643 has been observed with the VLT’s MUSE instrument as part of the TIMER project (Gadotti et al., 2019). MUSE (Bacon et al., 2010) is an integral field spectrograph using image slicers to sample a field of view (in the Wide Field Mode) at 0.2″ per spaxel (spatial pixel). The spectrograph covers a wavelength range of 4800–9300 Å, with a resolution that ranges from to 3590 over that same range and a spectral sampling of 1.25 Å/pixel.
Preliminary MUSE stellar and gas kinematics, along with a stellar-population analysis, have been presented for NGC 4643 in Gadotti et al. (2019, 2020) and Bittner et al. (2020), which we refer to later. We also performed our own stellar-kinematic analysis of the publicly available datacube (ESO Phase 3 reduced datacube, part of the “DEEP MUSE” datastream). We inspected the datacube for possible sky-subtraction errors, but did not find any; in any case, our interest is in the bright central region of NGC 4643, dominated by the galaxy light. To do this, we used the penalized, pixel-fitting pPXF code (Cappellari & Emsellem, 2004; Cappellari, 2017) to derive stellar kinematics in the usual form of a parameterized line-of-sight velocity distribution (LOSVD) – mean stellar velocity , velocity dispersion , and the Gauss-Hermite and parameters – using the MILES stellar-template library (Sánchez-Blázquez et al., 2006; Falcón-Barroso et al., 2011). We first performed a fit to the combined spectrum of the full datacube in order to identify a subset of template spectra with non-zero weights. Using the latter as a restricted template library, we then fit spectra (using the wavelength range 4800–7400 Å) from all the individual spaxels, masking out narrow regions around emission lines. This differed somewhat from the analysis of Gadotti et al. (2019, 2020), who used Voronoi-binned spectra, fitted wavelength ranges of 4750–5500 Å (Gadotti et al., 2019) or 4800–8950 Å (Gadotti et al., 2020), and the E-MILES model library of SSP template spectra (Vazdekis et al., 2015), but our results are almost identical to theirs.
We also performed a kinematic analysis using our own non-parametric pixel-fitting code (Mehrgan et al. 2019, J. Thomas et al. 2020, in preparation), in part to verify that the results were not dependent on the particulars of which code was used; further details of this analysis will be presented elsewhere.
3 An Overview of NGC 4608 and NGC 4643
NGC 4608 and NGC 4643 are both massive, strongly barred, early-type disc galaxies. The former is located in the Virgo Cluster at a distance of Mpc (surface-brightness-fluctuation distance; Cantiello et al., 2018); the latter is in the nearby field (approximately 2.4 Mpc away from NGC 4608), with a redshift-based distance estimate of Mpc.888Assuming kpc-1 and a Virgocentric-infall-corrected redshift of 1392 from HyperLEDA, along with an assumed uncertainty of 15%. These distances give scales of 83.9 pc/″ for NGC 4608 and 93.6 pc/″ for NGC 4643.
NGC 4608 is classified in RC3 as SB0 and NGC 4643 as SB0/a; very faint, wispy spiral arms account for the latter classification (e.g., Erwin & Sparke, 2003). They are very similar in overall orientation as well, with inclinations of 36° and 38°, respectively; in both cases their bars are positioned almost perfectly along each galaxy’s minor axis. The position angles of their discs are 100° and 53° for NGC 4608 and NGC 4643, respectively. (Disc orientations are based on the isophote shapes of their outer discs and are taken from Erwin 2005 and Erwin et al. 2008.)
Their stellar masses are also similar. For both galaxies, we estimated -band ratios from their global colours, using the relation of Roediger & Courteau (2015). The colours are based on the SDSS Model and magnitudes from Data Release 6, while the -band magnitudes are from the 2MASS Extended Source Catalog (all values retrieved from NED, corrected for Galactic extinction using the Schlafly & Finkbeiner 2011 values). This gives us for NGC 4608 and 10.789 for NGC 4643, so the latter galaxy is about 2.5 times more massive than the former.
They thus present themselves (aside from the factor of two difference in stellar mass) as very much alike, as noted by, e.g., the Carnegie Atlas (Sandage & Bedke, 1994): “NGC 4643 is nearly identical to NGC 4608 … The description there applies to NGC 4643 as well.”
The bars and inner (“bulge”) regions appear at first glance to be very similar as well. Both bars show strong, narrow isophotes which transition from being sharply pointed (“discy”) to having rectangular (“boxy”) ends as one moves out in radius. The inner isophotes are significantly rounder, which encourages the idea (mostly erroneous, as we will argue) that we are seeing dominant classical bulges in the centers of both galaxies.
Nonetheless, there are hints of differences when the inner isophotes are examined more carefully. In particular, the isophotes of NGC 4643 switch from the bar orientation (PA ) to a mildly elliptical shape nearly perpendicular to the bar – and closely aligned with that of the outer disc: PA for . While this is in principle consistent with an oblate classical bulge, previous analysis, including unsharp masking, of ground-based images has found evidence for a nuclear disc with a possible stellar nuclear ring in this region (Erwin & Sparke, 2003; Erwin, 2004). Gadotti et al. (2019) have used MUSE data (see Section 5.2) to show that the stellar kinematics in this region is dominated by rotation, arguing for the presence of a nuclear disc.
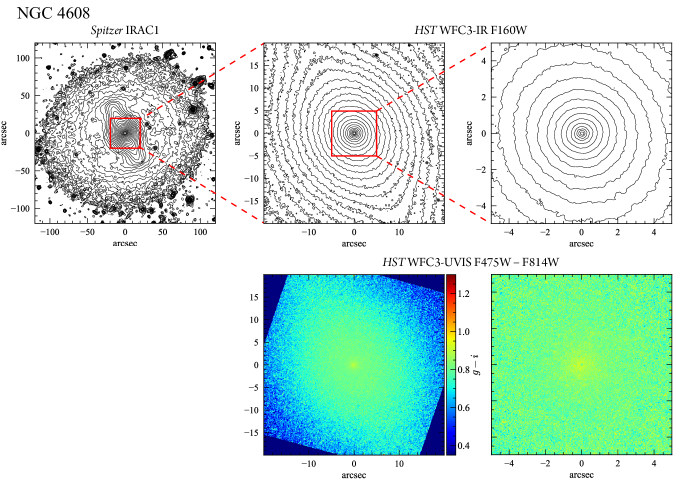
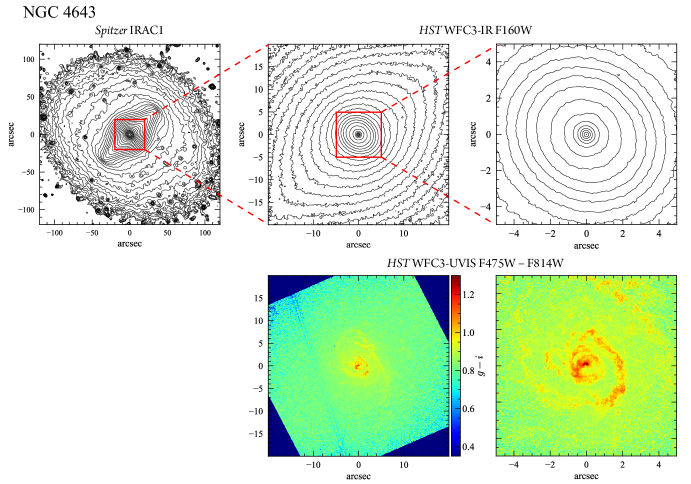
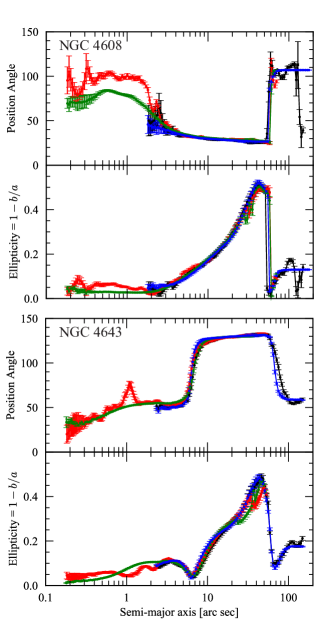
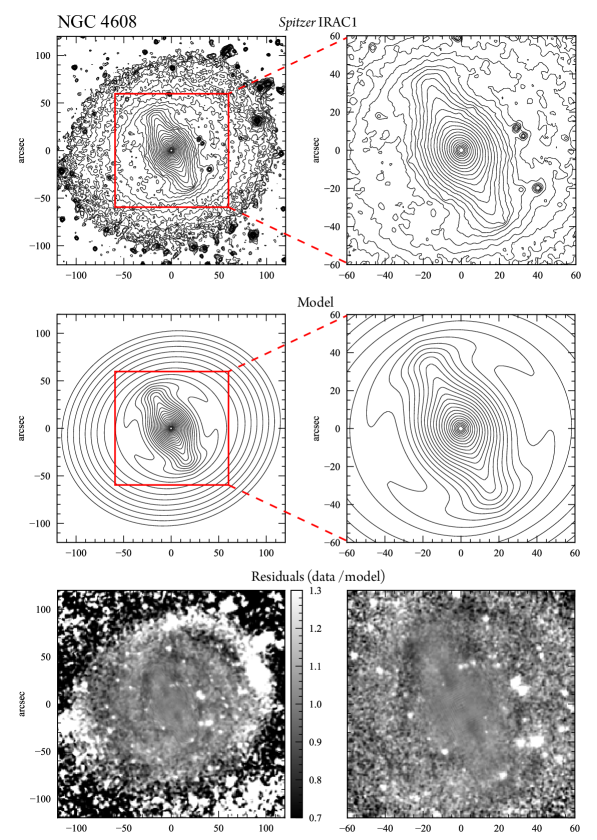
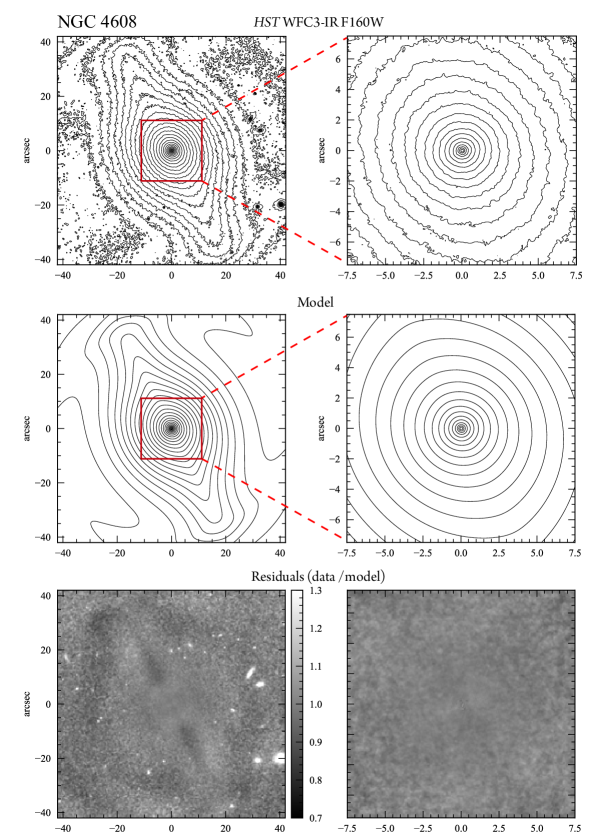
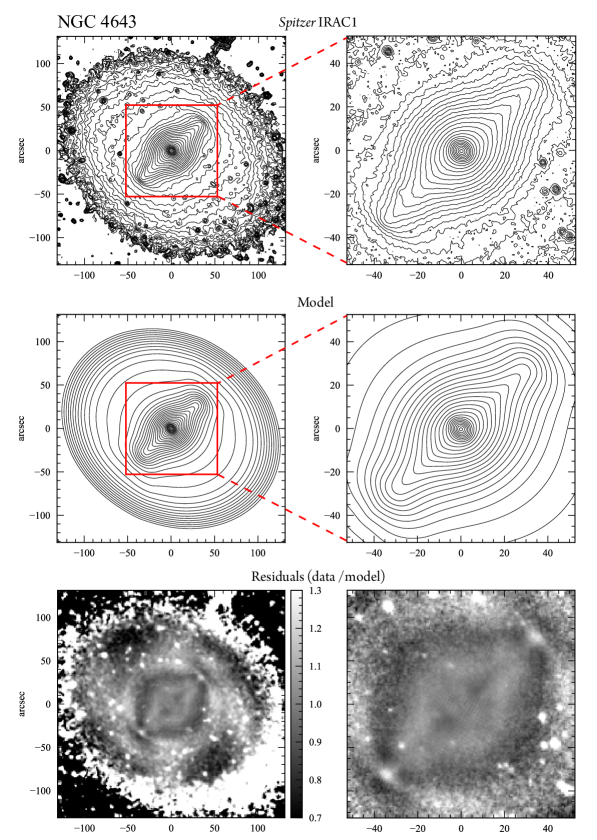
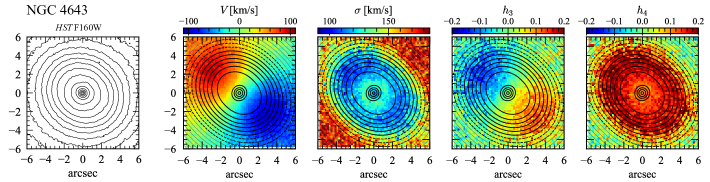
Figures 2 and 3 show large-scale (IRAC1) and close-up views (F160W) of the near-IR isophotes for both galaxies, along with HST colourmaps using the F475W and F814W WFC3-UVIS images. Figure 4 shows the position angle and ellipticity of ellipses fitted to the IRAC1 and F160W isophotes using the iraf ellipse package. The colourmaps show that NGC 4608 has no evidence for dust or recent star formation, just a slight inward reddening trend. NGC 4643, on the other hand, shows spiral dust lanes in the inner . The latter are not strong enough to cause significant distortions in the F160W image, though they may be responsible for the small variations in ellipticity and position angle at visible in the ellipse fits for this galaxy.
4 Morphological Decompositions
4.1 General Outline
Our general goal is to dissect each galaxy into astrophysically distinct stellar components, which might have different dynamics and/or formation mechanisms. We do this by modeling each image as the sum of multiple 2D image functions, with the functions chosen to represent plausible galaxy components (discs, bars, rings, nuclear star clusters, etc.). We put particular emphasis on the accurate modeling of the inner regions (roughly, the inner 1–2 kpc), in order to identify distinct “bulge” components and sub-components.
We combine modeling of low-resolution, whole-galaxy images from Spitzer with the high-resolution, small-field-of-view WFC3-IR F160W images from our HST observations. This emphasis on near-IR images stems from our interest in the stellar structure, undistorted (as much as possible) by dust extinction. Although NGC 4608 appears to be dust-free (e.g., Figure 2), NGC 4643 has some dust lanes in the inner kpc. These are not strong enough to noticeably distort the F160W image, but would make fitting the optical images problematic (Figure 3). We note that we are implicitly assuming no strong colour gradients involving the F160W and IRAC1 bands, so that we can treat them as describing the same stellar structure.
Our fits for each galaxy are done in a two-stage process. First, we focus on fitting the large-scale, sky-subtracted IRAC1 image using disc- and bar-related components; the innermost components (e.g., bulge, nuclear disc, nuclear star cluster) are treated approximately, since the IRAC1 images lack the spatial resolution to properly sample these parts of the galaxy. When an acceptable fit has been achieved, we switch to fitting the F160W image, where we can refine and better constrain the innermost components of the model. The F160W modeling begins with the best-fitting model and parameter values from the IRAC1 fits, translating size and orientation parameters appropriately. Since the galaxies are much larger than the F160W field of view, we fix the outermost component (the main disc) to the best-fit values from the IRAC1 fits, with the exception of intensity parameters (i.e., for the BrokenExponential component we use for the main disc in both galaxies), which are left as free parameters of the F160W fit. We also included a constant-background (“FlatSky”) term to account for the sky background in the F160W image (since the galaxies are larger than the WFC3-IR field of view, the background cannot be determined directly).
For each galaxy, we start with very simple models, such as bulge + disc (i.e., an elliptical Sérsic component + an elliptical Exponential component). We inspect the residuals to find where they are particularly bad (data much brighter than model or vice-versa) and to look for possible shapes suggestive of missing components. We then gradually add additional components to the model, using basic morphological analysis and prior studies as a guide. For example, since both NGC 4608 and NGC 4643 are strongly barred, including bar components in the models is a logical step. Since NGC 4643 has previously been identified as having a possible nuclear stellar ring (e.g., Erwin, 2004) and/or a nuclear disc (e.g., Gadotti et al., 2019), we also test both of these as possible additional components. The specific sequence of models for NGC 4608 is discussed in Section 4.5; the process for NGC 4643 is described in Section 4.6.1.
The “goodness” of these successive fits is evaluated in a relative fashion: by comparing how well a new model reduces systematic, patterned residuals produced by previous models; by judging how well a new model reproduces certain features in the isophotes; and by looking for significant improvement in the Akaike Information Criterion (AIC, Akaike 1974). The AIC is useful because, unlike the reduced , it can be used to compare different models fit to the same data. Most discussions of model comparison argue that indicate a clearly better fit for the model with the lower AIC value. However, from our experience in fitting models to galaxy images, we find that most additions to a model, even relatively trivial ones, can usually produce large negative values of , and we only consider improvements of to be truly useful.
Fits were done with the Imfit package (Erwin, 2015)999https://www.mpe.mpg.de/~erwin/code/imfit, using standard minimization and the (default) Levenberg-Marquardt minimizer; we used the data values to estimate the per-pixel uncertainties under the usual Gaussian approximation of Poisson statistics. For the IRAC1 images, pixel values were converted back to ADUs, with an assumed A/D gain of 3.7 used in the fit to convert ADUs to detected photons. For the F160W images, our reduction generated final images with detected photons (“electrons”) as the final pixel value, so no further processing was necessary. Because the images include foreground stars, background galaxies, and occasional image defects, we prepared masks based on running SExtractor (Bertin & Arnouts, 1996) to identify individual sources, with detected sources transformed into circles (for stars) or ellipses (for background galaxies) with radii or semi-major axes equal to small multiples of the SExtractor A_IMAGE parameter.
All fits include convolution with the appropriate PSF image. For the IRAC1 images, we used the official in-flight Pixel-Response-Function images101010https://irsa.ipac.caltech.edu/data/SPITZER/docs/irac/calibrationfiles/psfprf/, downsampled to the appropriate pixel from the PRF scale of 0.24″/pixel. We used the PRF image at column,row = 129,129 as an approximation to the central location of the galaxy in the image; since our final modeling of the central regions of each galaxy is based on the HST images, more accuracy than this for the IRAC1 PSF is not needed. For the F160W images, we generated appropriate PSF images using the grizli software,111111https://github.com/gbrammer/grizli which inserts the “empirical PSF” images of Anderson (2016)121212http://www.stsci.edu/~jayander/STDPSFs/WFC3IR/ into the four individual F160W exposures and then runs them through the same drizzling process we use to prepare our final F160W images, extracting the final PSF image from the combined, drizzled image (Mowla et al., 2019).
4.2 Determining Best-Fit Models: The Example of NGC 4608
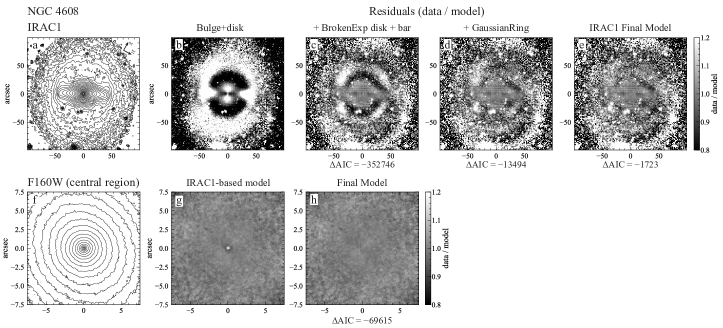
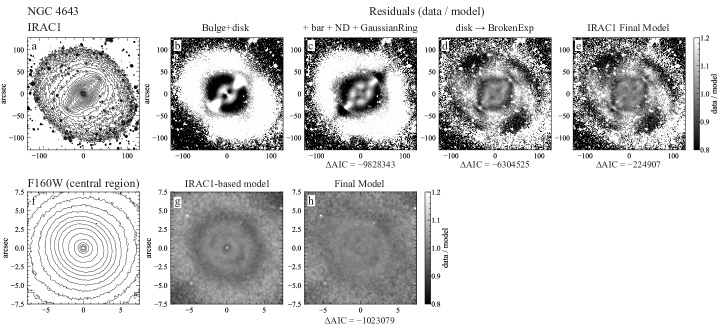
As an example of our successive modeling approach, consider Figure 5, which shows residuals from fitting successively more complex models to the IRAC1 and F160W images of NGC 4608.
The top row of the figure shows the results of our fits to the IRAC1 image. Panel b shows a simplistic reference (“bulge+disc”) decomposition, where we use only an Exponential (disc) and a Sérsic (bulge) component. The residuals indicate this is a terrible fit, both due to the lack of a bar component and because the disc is not a simple exponential. Panel c shows the next stage, where we add our new, two-component bar model (Appendix B) and change the disc component from a simple exponential to a broken-exponential. This is a dramatic improvement, with much-reduced residuals and a much lower AIC (). In the next stage (panel c to panel d), we use the strong, ringlike residual surrounding the bar in panel c, along with the clear evidence from the isophotes (and previous classifications of this galaxy) for an inner ring, to motivate adding a GaussianRing component to the model. As panel d shows, this clearly reduces the ringlike residual and the deficits immediately inside the ring, though the residuals in the center and the disc outside the ring are unchanged; the improvement in AIC () is significant, but less than the previous stage. Finally, in panel e we show what happens when we replace the uniform GaussianRing component with one that has an azimuthally varying surface brightness (the GaussianRingAz component, described in Appendix C). This is formally a meaningful improvement (), though the residuals appear almost unchanged (except for the partial spiral residuals immediately north and south of the east and west ends of the bar, respectively). Comparison of the isophotes of the data and model images (e.g., upper and middle panels of Figure 6) shows that this change does make the model match the data better in the inner-ring region (e.g., the fact that the inner ring visibly decays as the angle with respect to the bar major axis increases). Nonetheless, at this stage we seem to be reaching the limits of significant improvements for modeling the IRAC1 image.
We then shift to modeling the F160W image, starting with the final IRAC1 model. Since most of the main disc is outside the field of view of the F160W image, we re-use the BrokenExponential component by holding its parameters fixed to their best-fit values from the IRAC1 fit, with the exception of the central surface brightness, which was left as a free parameter. We also include a uniform-background component (Imfit’s FlatSky component) to account for the (unknown) sky background in the F160W image. The resulting fit is generally excellent, except for clear nuclear excess in data (panel g; also suggested by nuclear excess in higher-resolution WFC3-UVIS optical images). The addition of a compact Gaussian to represent a possible nuclear star cluster clearly improves the fit and removes the nuclear excess from the residuals (panel h). Since the central isophotes are essentially circular, and since this component is only partially resolved, we fix its shape to be circular.
4.3 Estimating Parameter Uncertainties
Determining the uncertainty of fitted parameters for fits such as these is problematic. Although Imfit provides nominal error estimates when run with the (default) Levenberg-Marquardt minimization algorithm, we elected to use the bootstrap-resampling option, which produced slightly more generous (and probably accurate) results, including asymmetric uncertainties; these are reported in our best-fit parameter tables (Tables 1 and 2). Bootstrap resampling also allows for plotting uncertainty distributions between parameters, which allows the identification of correlated uncertainties. Samples of such correlations are presented in Appendix D.
As inspection of the tables will show, these error estimates are in general extremely small – typically %. This is probably because the data we work with is very high , and the error estimates assume that the model is a correct representation of the data, with the uncertainty coming only from random, per-pixel errors (e.g, from Poisson processes and Gaussian readout noise). As an example of how misleading this can be, consider the simple bulge/disc (Sérsic + exponential) decomposition of the IRAC1 image of NGC 4608 (panel b of Figure 5). The best-fit position-angle and ellipticity of the disc component are and , respectively – while the best-fit values for the (BrokenExponential) disc in our final IRAC1 model are and . Clearly, the formal errors of the fit do not adequately represent uncertainties in what we might consider general, model-independent properties of the galaxy or its main subcomponents. (A similar point was made by Gao & Ho 2017 regarding the dependence of “bulge” properties on the inclusion or exclusion of other components in their 2D models of galaxies.)
We investigated the possible influence of uncertainties in the sky background subtraction by fitting versions of the IRAC1 images that had been perturbed with the - sky uncertainties (the latter determined by 1000 rounds of bootstrap resampling applied to the sky-level determination method). These produced variations in the fitted parameters roughly equivalent to, or smaller than, the bootstrap-based uncertainties.
4.4 Some Particulars: Broken-Exponential Discs and a Two-Component Bar Model
Preliminary fitting experiments with the IRAC1 images indicated that the best results were obtained when we treated the main disc as having a broken-exponential radial surface-brightness profile (e.g., Erwin et al., 2008; Erwin, 2015), where an inner, shallow exponential zone breaks to a steeper outer exponential profile. This is handled with the BrokenExponential component in Imfit, which combines elliptical isophotes with a broken-exponential radial profile. We note that in Erwin et al. (2008) neither galaxy shows a clear “Type II” profile (though NGC 4608 does in fact have a weak Type II.i profile). However, those profile classifications were based on the azimuthally averaged profile outside the bar region, while our interest here is in 2D modeling of the entire galaxy, including the bar and its interior. The necessity for a broken-exponential (i.e., Type II) profile for 2D fits to images of NGC 4608 was previously pointed out by Gadotti (2008).
Laurikainen et al. (2014) suggested, based on 2D fits to a ground-based -band image, that NGC 4643 possessed a “barlens”, which is their term for the B/P bulge seen at low inclinations. They fit the bar with a “thin bar” component (a 2D projection of a Ferrers ellipsoid) and an exponential-like component for the B/P bulge, along with an extra sub-exponential (Sérsic ) component for the “bulge”. For NGC 4608, Laurikainen et al. (2005) noted “a large oval inside the bar, and apparently a small spherical bulge” in their -band image. Athanassoula et al. (2015) modeled the same image using a separate “barlens” component for the B/P bulge and a projected Ferrers ellipsoid for the outer, thin part of the bar. Both galaxies are listed as “good examples” of a thin bar plus a barlens in Laurikainen & Salo (2017). We note that both galaxies are also massive enough for the presence of B/P bulges to be statistically likely: using the logistic-regression analysis of Erwin & Debattista (2017), which models the probability that a barred galaxy has a B/P bulge as a function of the galaxy’s stellar mass, the probabilities are 0.52 for NGC 4608 and 0.85 for NGC 4643.
Given this evidence, we work from the assumption that the bars of these two galaxies do have B/P bulges, and that the latter are best considered as components with rounder isophotes and steeper surface-brightness profiles, added to the more elongated, shallow-surface-brightness-profile components of the outer (vertically thin) part of the bar.
Our general logic is thus similar to that of Laurikainen et al. (2014) and Athanassoula et al. (2015), with the bar represented as the sum of two components. (A very similar approach was followed by Neumann et al. 2019 for some of their barred galaxies.) We differ from them in using a new component for the outer part of the bar, designed to better represent (than is possible with Sérsic or Ferrers functions) the broken-exponential major-axis profile and the transition from discy to boxy isophotes near the end of the bar. This new component (“FlatBar”), is described in Appendix B.
Unlike Athanassoula et al. (2015), we put more emphasis on modeling the main disc of the galaxy as well, in order to better constrain the modeling of the bar region; this includes (as noted above) treating the main discs of both galaxies as having broken-exponential surface-brightness profiles; it also means using a separate component to model the prominent inner ring surrounding the bar in NGC 4608. This allows us to fit most or all of the parameters freely, in contrast to having to fix such parameters as the bar length and the B/P bulge ellipticity by hand, as Athanassoula et al. did.
4.5 Fitting NGC 4608: Summary
(See Section 4.2 and Figure 5 for how we proceeded in constructing and successively refining our best-fit model for this galaxy.)
Our final model for NGC 4608 uses the combination of Imfit’s BrokenExponential component and the new GaussianRingAz component (Appendix C) for the disc and the inner ring surrounding the bar; the new FlatBar component for the outer part of the bar and a mildly elliptical Sersic_GenEllipse component for the inner, B/P part of the bar; a central round Sérsic component; and a compact, circular Gaussian. Table 1 summarizes the best-fitting parameter values, while Table 3 shows the luminosities and relative fluxes of the different components, and Figures 6 and 7 compare this model with the IRAC1 and F160W data. In addition, the upper half of Figure 4 compares the ellipticity and position-angle profiles of the best-fit model with those of the data. This shows generally excellent agreement, except possibly for the inner , where the model isophotes are slightly too round and differ in PA by .
The main/outer disc (the combination of the BrokenExponential and GaussianRingAz components) accounts for 45% of the total light; most of this is in the BrokenExponential, with the ring component being only 3.3%. The inner part of the BrokenExponential is effectively constant (the fits converge to the upper limit we set on the parameter value); this changes to an exponential scale length of (2.16 kpc) beyond the break radius (, 5.58 kpc). This outer scale length is very similar to the value of 29″ reported by Erwin et al. (2008) for the disc outside the bar, based on an azimuthally averaged -band profile from an SDSS image.
The bar is represented by the combination of an inner Sérsic component (with very weakly boxy isophote shapes) for the B/P bulge and a FlatBar component for the outer part of the bar; the latter has major-axis inner and outer scale lengths of 50.8″ and 3.7″, respectively, and a break radius of , which is very similar to the maximum-ellipticity length of reported for the bar by Erwin (2005). The B/P-bulge part of the bar has an essentially exponential surface-brightness profile (); it is slightly misaligned with respect to the FlatBar component (PA , with the B/P bulge oriented slightly closer to the galaxy major axis); this is consistent with the effects of projection operating on a bar close to, but not perfectly aligned with, the galaxy minor axis (see Erwin & Debattista 2013 for a discussion of how projection effects produce misalignments between the projected B/P bulge and the “spurs” of the outer part of the bar). Together, the two components are 43% of the total galaxy light, only slightly less than the main disc; the B/P bulge by itself is 29% of the light.
The inner, round (ellipticity ) Sérsic component has and pc. Given that it is significantly rounder than the disc (ellipticity ), we view this component as a candidate classical bulge; it amounts to % of the total galaxy light. The Gaussian component inside this is a plausible nuclear star cluster, especially considering its compact size ( pc); its luminosity is only % of the total galaxy light. This combination of size and stellar mass () makes it reasonably typical for a nuclear star cluster (e.g., Fig. 7 in Neumayer et al., 2020).
We note that including this last (NSC) component has a moderate effect on the derived parameters of the round, inner Sérsic component (which we identify as a potential classical bulge). Without the NSC component, the latter has and (347 pc), both of which are about –15% larger than their values when the NSC component is included. There are minor changes to the B/P bulge component, at the level of % for and .
| Component | Parameter | Value | Units |
|---|---|---|---|
| Gaussian | PA | — | ° |
| (NSC) | |||
| SB | |||
| ″ | |||
| pc | |||
| Sersic | PA | ° | |
| (bulge) | |||
| SB | |||
| ″ | |||
| pc | |||
| Sersic_GenEll | PA | ° | |
| (bar: BP bulge) | |||
| SB | |||
| ″ | |||
| pc | |||
| FlatBar | PA | ° | |
| (bar: outer) | |||
| PAm | |||
| SB | |||
| ″ | |||
| pc | |||
| ″ | |||
| pc | |||
| ″ | |||
| pc | |||
| ″-1 | |||
| GaussianRingAz | PA | ° | |
| (inner ring) | |||
| SB | |||
| ″ | |||
| pc | |||
| ″ | |||
| pc | |||
| BrokenExp | PA | ° | |
| (main disc) | |||
| SB | |||
| ″ | |||
| pc | |||
| ″ | |||
| pc | |||
| ″ | |||
| pc | |||
| ″-1 |
Summary of the final 2D decomposition of NGC 4608. Column 1: Imfit component names. Column 2: Parameter names. Column 3: Best-fit parameter value; note that for size parameters, we include sizes in arcsec and also in pc. Errors are nominal 68% confidence intervals from bootstrap resampling, and should be considered underestimates; errors for linear sizes do not include uncertainties in the distance. Column 4: Units of the parameter (“SB” = -band mag arcsec-2). For all parameters except the final BrokenExponential (“main disc”), values come from fitting the HST WFC3-IR F160W image; for the latter, values come from fitting the Spitzer IRAC1 image. Surface-brightness values are for . Notes: 1 = at limit of parameter-value boundaries; uncertainty undefined.
4.6 Fitting NGC 4643
4.6.1 Determining the Best-Fit Model
In Figure 8 we show progressively more complex fits to the images of NGC 4643. Panel b shows a basic bulge+disc decomposition, which – as we saw for NGC 4608 – is completely inadequate. Panel c shows a more complicated fit with our two-component bar model (using, for simplicity, an Exponential for the B/P bulge rather than a Sérsic function) and a first attempt at a nuclear disc model, consisting of an elliptical exponential and a GaussianRing component (the latter for the putative nuclear ring). This is a significantly better fit (e.g, ), but the residuals are still strong and systematic.
Panel d shows what is almost the same model, except that we have replaced the outer Exponential with a BrokenExponential component. This brings a dramatic improvement in the residuals (and a further ), which illustrates the importance of getting the main disc component right. (Note that the fit in the bar region has improved as well.) Finally, panel e shows what happens when we replace the B/P-bulge exponential component with one having a Sérsic profile. This is an improved fit, with the best-fitting Sérsic index for the B/P-bulge component .
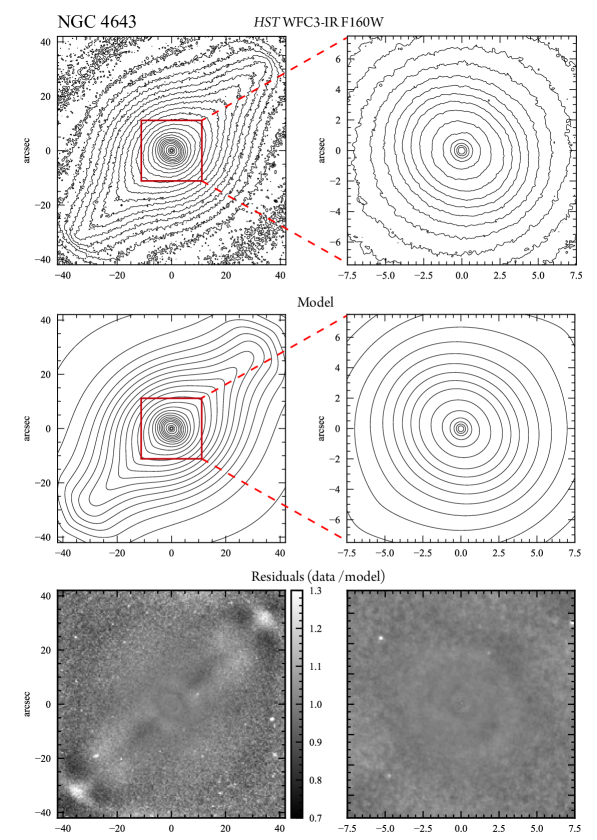
In panel g we show this “best” model from the IRAC1 image fits (panel e) fit to the F160W image. The residuals are generally small, but there are some troublesome systematics in the inner , with alternating radial deficits and excesses. In addition, we found that the GaussianRing component in this fit converged to a very small radius () and a very broad width (). This disagrees with the apparent size of the ring () and indicates that the Exponential + GaussianRing model for the center of this galaxy is not a good match to the data. Careful inspection of the F160W image (panel f) and profile cuts through the center hinted that the morphology might be better represented by the combination of a broken-exponential structure for the nuclear disc and a compact, round component at . Replacing the inner Exponential + GaussianRing with a BrokenExponential component and a central, round Sérsic component produced our final model (panel h), with clearly better residuals in the central region and . There remain some very faint systematic patterns in the residuals at this stage, perhaps indicative of very subtle ring or spiral morphology within the nuclear disc.
4.6.2 Summary
Our final model for NGC 4643 uses Imfit’s BrokenExponential component for the main disc; the new FlatBar component for the outer part of the bar and a mildly elliptical Sersic_GenEllipse component for the inner, B/P part of the bar; another BrokenExponential component for the nuclear disc; and a central compact, nearly circular Sérsic component. Table 2 summarizes the best-fitting parameter values, with the absolute and fractional luminosities in Table 3, and Figures 9 and 10 compare this model with the IRAC1 and F160W data. In the lower half of Figure 4 the ellipticity and position-angle profiles of the best-fit model are compared with those of the data. This shows excellent agreement, even better than that between NGC 4608 and its model, especially in terms of how the PA of the model inside the bar agrees with the data.
The bar is, as for NGC 4608, the combination of a FlatBar component (17% of the total galaxy light, with a break radius of ) and a Sersic_GenEllipse component (with slightly discy isophotes) for the B/P bulge (31% of the total light). In contrast to NGC 4608, the B/P bulge surface-brightness profile is closer to a Gaussian than to an exponential (Sérsic ). As in the case of NGC 4608, there is a slight offset between the position angles of the FlatBar and B/P-bulge components, with the latter about 10° closer to the galaxy major axis. Again, this agrees with the expected projection effects acting on a bar with a vertically thin outer component and an inner B/P component (Erwin & Debattista, 2013).
Finally, the center of NGC 4643 is modeled by the combination of two elements. The first, which we argue represents a nuclear disc, is an elliptical BrokenExponential component with a position angle of 52.6°; this is beautifully consistent with the global PA of 53°. (The main-disc BrokenExponential component of our model has a slightly different PA of , which may represent the influence of weak spirals in the region just outside the bar.) The ellipticity of this component is 0.13, which is somewhat rounder than the outer disc (); this may indicate that the nuclear disc is thicker than the outer disc. The profile, as noted, is a broken exponential, with inner and outer scale lengths of and 160 pc, respectively, and a break radius of pc.
The innermost component models the steep central rise in the surface brightness interior to , using a circular Sérsic component with and pc.
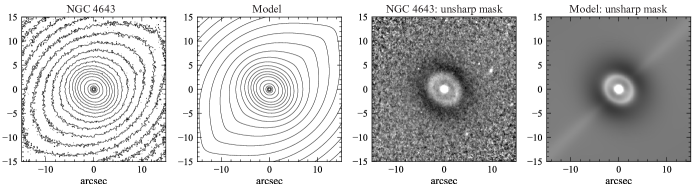
A question remains: can our model really explain the strikingly ringlike appearance that unsharp masks of NGC 4643 images display? Figure 11 compares unsharp masks of the inner region of NGC 4643 and the best-fitting model image, showing how the appearance of a ring can indeed be created by the sharp break in the broken-exponential profile of the nuclear disc. (See also Appendix A for evidence that the broken-exponential nature of the nuclear disc’s profile is robust against changes to how we model this part of the galaxy.)
| Component | Parameter | Value | Units |
| Sersic | PA | ° | |
| (Bulge) | |||
| SB | |||
| ″ | |||
| pc | |||
| BrokenExp | PA | ° | |
| (Nuclear Disc) | |||
| SB | |||
| ″ | |||
| pc | |||
| ″ | |||
| pc | |||
| ″ | |||
| pc | |||
| Sersic_GenEllipse | PA | ° | |
| (bar: BP bulge) | |||
| SB | |||
| ″ | |||
| pc | |||
| FlatBar | PA | ° | |
| (bar: outer) | |||
| PAm | |||
| SB | |||
| ″ | |||
| pc | |||
| ″ | |||
| pc | |||
| ″ | |||
| pc | |||
| BrokenExp | PA | ° | |
| (main disc) | |||
| SB | |||
| pc | |||
| pc | |||
| pc | |||
Summary of the final 2D decomposition of NGC 4643. Column 1: Imfit component names. Column 2: Parameter names. Column 3: Best-fit parameter value; note that for size parameters, we include sizes in arcsec and also in pc. Errors are nominal 68% confidence intervals from bootstrap resampling, and should be considered underestimates; errors for linear sizes do not include uncertainties in the distance. Column 4: Units of the parameter (“SB” = -band mag arcsec-2). For all parameters except the final BrokenExponential (“main disc”), values come from fitting the HST WFC3-IR F160W image; for the latter, values come from fitting the Spitzer IRAC1 image. Surface-brightness values are for . Notes: 1 = at limit of parameter-value boundaries; uncertainty undefined.
| Component | Fraction | |
|---|---|---|
| NGC 4608 | ||
| Gaussian | 0.00056 | |
| (NSC) | ||
| Sersic | 0.121 | |
| (bulge) | ||
| Sersic_GenEll | 0.286 | |
| (bar: B/P bulge) | ||
| FlatBar | 0.142 | |
| (bar: outer) | ||
| GaussianRingAz | 0.0333 | |
| (inner ring) | ||
| BrokenExp | 0.417 | |
| (main disc) | ||
| NGC 4643 | ||
| Sersic | 0.0050 | |
| (bulge/NSC) | ||
| BrokenExp | 0.134 | |
| (nuclear disc) | ||
| Sersic_GenEll | 0.310 | |
| (bar: B/P bulge) | ||
| FlatBar | 0.166 | |
| (bar: outer) | ||
| BrokenExp | 0.386 | |
| (main disc) | ||
Absolute and relative luminosities of components in our best-fitting 2D decompositions for the two galaxies studied in this paper. Column 1: Imfit component names (corresponding galaxy component in second row; NSC = nuclear star cluster). Column 2: -band absolute magnitude of component (assuming Mpc for NGC 4608 and 19.3 Mpc for NGC 4643). Column 3: Fraction of total galaxy luminosity.
4.7 Contrasting NGC 4608 and NGC 4643: Isolating the Central Bulge and Nuclear-Disc Components
Our modeling suggests that NGC 4608 and NGC 4643 have very similar structures – except inside their B/P bulges. The former appears to have something rather like a modest-sized, nearly spherical classical bulge (ellipticity , Sérsic , pc, with a nuclear star cluster in its center), while the latter has (in projection) an elliptical structure with a broken-exponential profile and a compact, spherical structure (Sérsic , pc) in the very center.
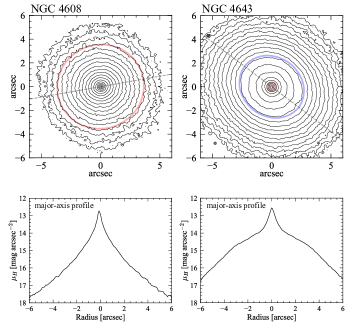
These parameters are taken from our best-fitting models; to see what the centers might look like if we could remove the rest of the galaxy surrounding them, Figure 12 shows isophotes and major-axis profiles from the F160W image after subtracting the disc and bar components of our best-fitting models.
5 The Stellar Kinematics of the Central Structures
The preceding decompositions indicate that both NGC 4608 and NGC 4643 have central regions ( kpc) dominated by the B/P bulges of their bars. In the inner few hundred parsecs, however, the galaxies differ significantly. Our preceding, photometry-based claim – that NGC 4608 hosts a modest classical bulge while NGC 4643 has instead a nuclear disc – implies rather different stellar kinematics: we would expect a “classical bulge” to be slowly rotating and dominated by velocity dispersion, while a “nuclear disc” ought to be rapidly rotating, with lower velocity dispersion. In addition, our argument that the mildly elongated isophotes at kpc in both galaxies are due to the B/P bulges of bars – rather than to massive, large-scale classical bulges – suggests that the kinematics there should be barlike rather than spheroidal. In this section, we use archival and published IFU data to probe the stellar kinematics in the inner regions of both galaxies to test these predictions.
5.1 SAURON Stellar Kinematics
We begin with published stellar kinematics from observations with the SAURON integral field unit. Although VLT-MUSE data with superior coverage and spatial and spectral resolution is available for NGC 4643, the SAURON data is all we have for NGC 4608, so it makes sense to compare the kinematics from the SAURON observations of the two galaxies first. We can then see how well these compare with the MUSE data for NGC 4643.
5.1.1 NGC 4608
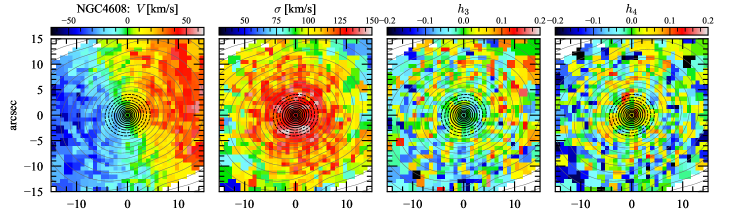
Figure 13 shows the SAURON stellar kinematics for NGC 4608: stellar velocity, velocity dispersion, , and , along with isophotes from our F160W image to show the underlying stellar structure. We can see a clear pattern of rotation, along with velocity dispersion that increases toward the center of the galaxy; the dispersion appears elongated along the major axis of the bar, though it becomes rounder in the very center. The map shows relatively little structure, though there is weak evidence for a slight correlation between velocity and , with positive velocities and values on the NW side of the galaxy center and negative values of both on the SE side. This is potentially significant, since - correlation is a prediction of bar models (e.g., Iannuzzi & Athanassoula, 2015; Li et al., 2018) due to the presence of elliptical, bar-supporting orbits; this suggests that the region from –20″ along the bar minor axis is dominated by bar orbits.
In Figure 14 we show a close-up of the same kinematic data. Here, instead of the observed F160W isophotes, we plot isophotes which show the ratio between the classical-bulge component in our best-fitting Imfit model and the rest of the model. The solid lines show where the former component is brighter than the rest of the model; this is where the classical-bulge component is the dominant stellar structure in our model. This region () shows weak rotation, uniformly high velocity dispersion, and a tenuous hint of weak - anticorrelation (though the statistical significance of the latter is dubious). All of this is consistent with a slowly rotating classical bulge.
5.1.2 NGC 4643
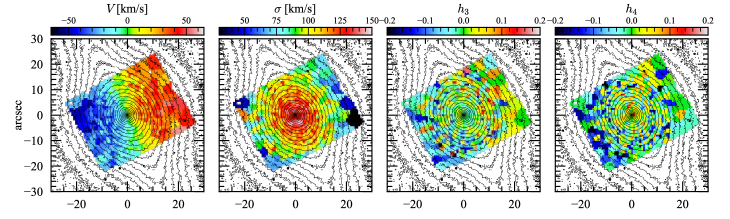
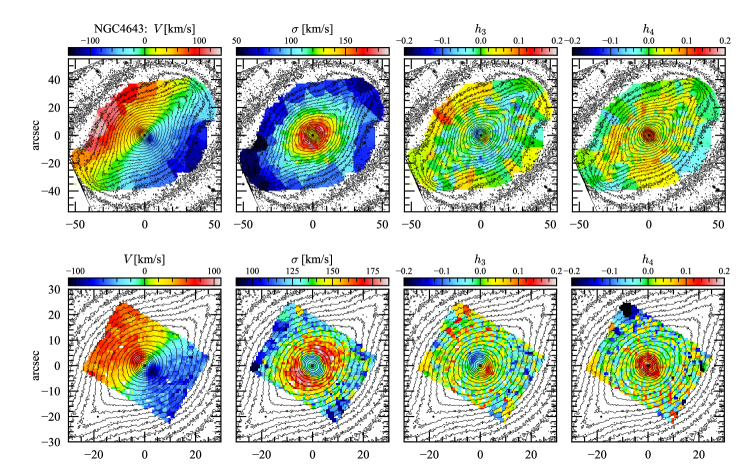
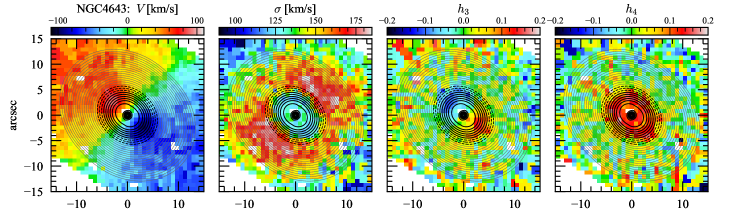
Here, we examine the SAURON velocity fields for NGC 4643. Figure 15 shows SAURON data for this galaxy, along with isophotes from our F160W image of the galaxy. In addition to the ATLAS3D kinematics (lower panel), we also show (top panel) kinematics from the study of Seidel et al. (2015), which used multiple pointings to sample a larger field of view.
Outside , the stellar-velocity pattern is similar to that in NGC 4608: clear stellar rotation, an elongated region of higher velocity dispersion aligned with the bar and increasing toward the center, and a tenuous - correlation (extending to along the major axis of the galaxy, which is approximately the minor axis of the bar). As with NGC 4608, the evidence for - correlation in the bar is very weak; however, for this galaxy the VLT-MUSE kinematics provide clear confirmation of this pattern (e.g., Gadotti et al. 2019 and Section 5.2).
But for ( pc), the stellar kinematics is very different from that of NGC 4608. There is a region of rapid rotation accompanied by a clear anticorrelation with . There is also a clearly elliptical region of distinctly lower velocity dispersion, and a similar region of elevated .
From the bottom panel of Figure 15, it is clear that this inner region of rapid, disclike rotation is associated with the elliptical inner isophotes we previously identified as due to a nuclear disc (e.g., Section 4.6). Figure 16 demonstrates this more clearly by comparing the ATLAS3D kinematics with the isophotes from an image which is the ratio of the nuclear-disc component of our model to the rest of the model (similar in spirit to Figure 14). Solid contour lines show where the nuclear-disc component is the dominant component, and this is precisely where we see the rapid rotation, - anticorrelation, lower dispersion, and elevated .
Our conclusion is that the inner pc of NGC 4643 is dominated by the rapid rotation, - anticorrelation, and lower dispersion typical of a disc rather than a classical bulge. The only really puzzling part of this is the rather high in the nuclear-disc region, since a pure disc should probably have close to zero (see, e.g., Debattista et al., 2005). As we will argue in Section 5.2, this is probably due to the superposition of two components along our line of sight: the dominant, low- nuclear-disc kinematics and the innermost part of the bar’s B/P bulge, with higher .
5.2 NGC 4643: Additional Evidence from MUSE
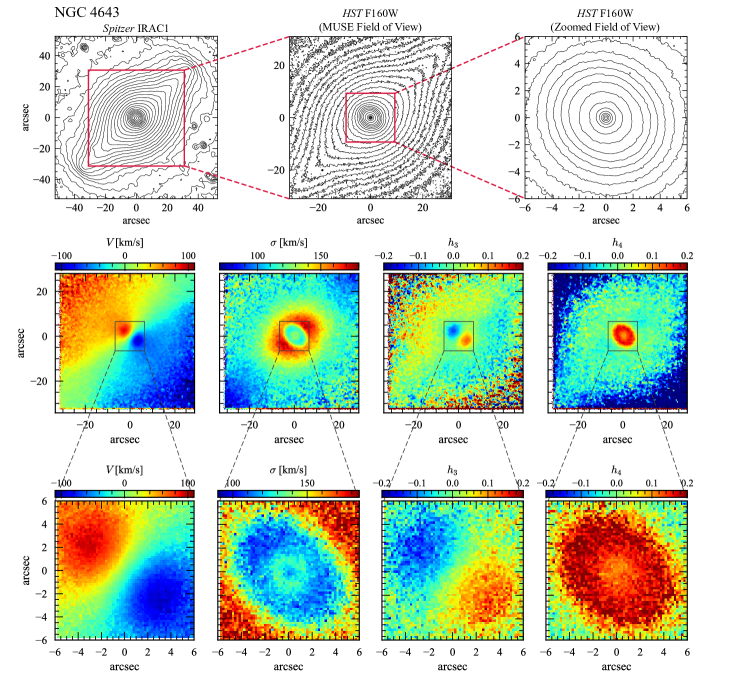
NGC 4643 is one of the barred galaxies studied by the TIMER project (Gadotti et al., 2019). Fig. 3 of that paper shows the VLT-MUSE-based stellar kinematics for this galaxy, and evinces the same stellar-kinematic patterns we noted in the SAURON data, albeit with higher spatial resolution and considerably better . In particular, the nuclear-disc region is singled out by a pattern of high rotation, clear - anticorrelation, lower velocity dispersion, and positive . Outside the nuclear disc, the velocity dispersion is clearly higher along the major axis of the bar. In addition, the maps show that near the minor axis in the outer part of the bar (e.g., between the fourth or fifth and the seventh or eighth contour lines in their figure) is correlated with the velocity, as hinted at in the SAURON data. The combination of the latter two features is, as Gadotti et al. (2019) noted, strong kinematic evidence for a B/P bulge within a bar.
In Figure 17, we show unbinned (single-spaxel) stellar kinematics derived from the same MUSE data, showing both the full MUSE field of view and the region containing the nuclear disc. Here, we can see that the nuclear-disc region has two extra kinematic features. The first is the fact that at smaller radii (e.g., ), the velocity dispersion increases to –130 , versus –115 kms in the region to 3.5″. This corresponds with a nearly circular region of slightly lower .
The second interesting feature is that the dispersion drops again in the very center ( pc), to a value of –115 . This corresponds almost exactly with the round inner Sérsic component in our decomposition. We note that there is some evidence for nuclear stellar-velocity-dispersion depressions on similar scales in other early-type spirals. In NGC 3368, which has a similar-sized ( pc) compact “classical-bulge” component (Nowak et al., 2010; Erwin et al., 2015), the velocity dispersion observed with VLT-SINFONI in AO mode shows a drop in the dispersion in the inner pc (Nowak et al. 2010, their Fig. 14). Erwin et al. (2015) argued for a compact central stellar component with pc in NGC 1068, where the SINFONI AO stellar kinematics of Davies et al. (2007) showed a central decrease (albeit to an implausible value of 0 at the center, presumably due to problems subtracting the contribution of the Seyfert nucleus). Finally, although we do not (currently) have any evidence for a similar round, compact structure in NGC 1097, the SINFONI AO data of Davies et al. (2007) shows a clear drop from from 150 to 100 for pc.
So there is some evidence for central drops in the stellar velocity dispersion in the inner 25–35 pc of massive, early-type spirals. The underlying dynamical origin of the phenomenon needs further investigation.
Figure 18 shows the inner MUSE stellar kinematics again, this time with the nuclear-disc/model ratio isophotes, as in Figure 16. From this, we can again see that the elliptical region of high velocities, low dispersion and anticorrelated matches almost perfectly with where the nuclear-disc component dominates in our model. Fitting the velocity field in this region using the kinemetry code of Krajnović et al. (2006) gives a kinematic position angle of , identical within the uncertainties with the position angle of the BrokenExponential component we use to model the nuclear disc (52.6°, Table 2).
This is also where the elevated is found. By plotting the values against the ratio of the nuclear-disc component to the bar model in Figure 19, we can see a clear trend: the kurtosis values increase as the ratio increases, peaking where the ratio is , and then decline as one moves to even higher ratio values. We interpret this as the result of changing relative contributions from the B/P bulge (high velocity dispersion) and from the nuclear disc (low velocity dispersion) along the line of sight. Outside the nuclear disc (ND ratio ), the LOSVD is dominated by the high-dispersion B/P bulge LOSVD, and so the kurtosis is low. In the region where both the B/P bulge and the nuclear disc contribute almost equally, the kurtosis reaches a maximum. At smaller radii, where the nuclear disc dominates, the kurtosis declines.
We will explore this phenomenon further in a follow-on paper.

5.3 Summary of Stellar Kinematics Results
We can describe the results of our analysis of the stellar kinematics data from published SAURON observations (both galaxies) and from MUSE observations (NGC 4643 only) as follows:
-
•
The outer isophotes of the bars in both galaxies show rotation with possible (NGC 4608) or clear (NGC 4643) - correlation, as expected for bars.
-
•
The B/P-bulge regions (the vertically thickened inner parts of the bars) of both galaxies show higher velocity dispersion, aligned with the projected B/P bulges and increasing towards the center.
-
•
In NGC 4608, the region we photometrically identified as a possible classical bulge ( pc) shows slow rotation, high velocity dispersion ( ), and no clear - correlation or anticorrelation, consistent with a slowly rotating classical spheroid.
-
•
By contract, in NGC 4643 the inner region that we photometrically identified as a nuclear disc ( pc) shows up as an elliptical zone of significantly lower dispersion, with rapid rotation and strong - anticorrelation, consistent with a rotation-dominated disc. The dispersion has a minimum value of , increasing mildly toward the center.
-
•
The nuclear-disc region of NGC 4643 also shows very high values, declining toward the center; we tentatively interpret this as a signature of overlapping LOSVDs from the B/P bulge (higher dispersion) and the nuclear disc (lower dispersion), with the decline in toward the center happening as the nuclear-disc component becomes more dominant (and possibly also as the dispersion of the nuclear-disc component becomes higher).
-
•
Finally, there is a drop to lower dispersion in the very innermost region of NGC 4643 ( pc, from at the edge of this region to in the center), coincident with the photometrically identified compact classical bulge (or large NSC). Although there are some similar near-nuclear dispersion drops seen in a few other massive spirals, the cause of this remains unclear.
6 Discussion
Outside of the central few hundred parsecs, the two galaxies studied in this paper are remarkably similar. In both cases, their bars amount to % of the stellar light, with dominant B/P bulges comprising % of the light. They both have distinct stellar structures inside the B/P bulges, each of which is –13% of the total light. But while this structure in NGC 4608 is nearly circular, centrally concentrated (Sérsic index ), slowly rotating, and dominated by velocity dispersion – matching a traditional classical bulge – the inner structure of NGC 4643 is a nuclear disc: elliptical and aligned with the outer disc, with rapid rotation and lower velocity dispersion.
The photometric and kinematic evidence for a nuclear disc inside the B/P bulge of NGC 4643 is a clear demonstration of a pattern Chung & Bureau (2004) and Bureau et al. (2006) suggested based on their studies of edge-on disc galaxies: that the B/P bulges of barred galaxies are frequently accompanied by nuclear discs. The case of NGC 4608, on the other hand, demonstrates that this is not a universal pattern: some B/P bulges contain structures much more like classical bulges, rather than nuclear discs.
6.1 The Nuclear Disc in NGC 4643
The prominent nuclear disc in NGC 4643 makes up 13% of the galaxy’s near-IR light. Assuming no strong gradients in and a total galaxy stellar mass of (Section 3), the nuclear disc has a stellar mass of . This is about seven times the mass estimated for Milky Way’s nuclear disc (; Nogueras-Lara et al., 2019; Sormani et al., 2020). The stellar-population analysis of the MUSE data in Bittner et al. (2020) indicates that the nuclear disc is old ( Gyr) – but slightly less so than the stars in the B/P bulge ( Gyr) in which it is embedded. It is also slightly more metal-rich than the B/P bulge (Seidel et al., 2015; Gadotti et al., 2019; Bittner et al., 2020). This suggests that it was formed not long after the bar itself, from gas that was slightly enriched compared to that from which the stars in the bar were formed.
The most peculiar thing about NGC 4643’s nuclear disc is its surface-brightness profile: instead of the standard single-exponential form one (perhaps naively) expects of a disc, it has a downbending, broken-exponential profile (a Freeman Type II profile, in the scheme used for large-scale discs) – with a break which is sufficiently sharp to appear ringlike in unsharp masks (e.g., Figure 11); see Appendix A. We are not aware of any similar structures in other galaxies, though it is quite possible they have escaped notice because few nuclear discs have been analyzed with sufficient resolution or in sufficient detail. Broken-exponential profiles are, of course, quite common in large-scale discs, but it is unclear whether the proposed mechanisms for those discs – e.g., radial truncations in star-formation in concert with spiral-driven radial migration (e.g., Debattista et al., 2017a, and references therein) – would apply here. One speculative possibility is that this is an end-state for the combination of a nuclear disc and a nuclear ring, with an initially narrow ring having broadened over time, blending with the nuclear disc to produce the broken-exponential structure.
Most theoretical discussions of nuclear rings and discs inside bars suggest that the stars on them form from gas which has settled onto the x2 orbits of a bar potential, which implies that the stars should themselves be trapped around the same family of orbits. Since x2 orbits are elongated perpendicular to the x1 orbits that support the bar, we might expect nuclear discs to themselves be elongated perpendicular to their host bars. For the case of NGC 4643, where the bar has a PA of 133°, the line of nodes is at 53°, and the inclination is 38°, the minor axis of the bar should have an observed PA of 47°; an elliptical structure oriented along this axis would have an observed PA in between that and line of nodes. However, the ellipse fits to the observed isophotes in the nuclear-disc region (Figure 4 and the nuclear-disc component in our best-fitting model of the F160W image (Table 2) both agree on a PA of 52–53°, essentially identical to that of the main disc – and to the kinematic PA of the nuclear-disc region (52°; Section 5.2). The implication is that the nuclear disc is intrinsically close to circular in the plane of the galaxy, rather than significantly elongated perpendicular to the bar.
The observed ellipticity of the nuclear disc is , which is rounder than that of the main disc (0.20). This in turn suggests that the nuclear disc, if circular, is intrinsically somewhat thicker than the main disc – or perhaps that it is slightly elongated parallel to the bar. The latter possibility might mean that the stars are trapped around round inner x1 orbits of the bar, and even that the nuclear disc could predate the bar. As noted above, the stellar ages estimated from the analysis of the MUSE data by Gadotti et al. 2019 show that the stars in the nuclear disc are approximately the same age as the stars in the bar surrounding it (mass-weighted ages Gyr); given the inherent uncertainties in age estimates for older stellar populations, we probably cannot tell whether the nuclear disc is truly younger or older than the bar.
6.2 Speculations About Formation Histories
We have emphasized that both NGC 4608 and NGC 4643 are quite similar in their large-scale morphology: massive, early-type discs with very strong bars that contain prominent B/P bulges. But their inner structure is rather different: NGC 4608 has what appears to be a modest, kinematically hot classical bulge (and a very compact NSC), while NGC 4643 has a kinematically cool nuclear disc and what is either a very compact classical bulge or a large NSC. This suggests two questions. First, why does NGC 4608 have a significant classical bulge, while NGC 4643 does not? Second, why is there a nuclear disc present in NGC 4643 but not in NGC 4608?
The formation of a classical bulge in NGC 4608 could potentially be ascribed to local variations in the very early formation stages, leading to more merger activity in the central region of one galaxy than the other. The question then becomes why NGC 4608 was not able to form a nuclear disc, despite having a strong bar very much like NGC 4643’s.
One possibility is that this dichotomy reflects the different environments of the two galaxies: NGC 4643 is a field galaxy, while NGC 4608 is a member of the Virgo Cluster. In this scenario, we could argue that NGC 4608 could have undergone ram-pressure stripping within the cluster environment early enough in its history that its bar was unable to drive significant gas inflow and form a nuclear disc. NGC 4643, by contrast, must have retained enough gas after its bar formed for bar-driven inflow and star formation to have formed its nuclear disc. NGC 4643 in fact still retains some gas, with H i detections (e.g., van Driel et al., 2000) and H emission within the bar which is consistent with the optical dust lanes (Figure 3) and with kinematics consistent with that of the stars (Gadotti et al., 2019).
We should note, however, that another barred S0 in the Virgo Cluster – NGC 4371 – contains evidence for both a modest classical bulge (Erwin et al., 2015) and a significant nuclear disc/ring with a slightly younger and more metal-rich population in its MUSE spectra (Gadotti et al., 2015; Bittner et al., 2020). So it is clear that the cluster environment doesn’t exclude nuclear-disc formation.
6.3 Classical Bulges and B/T Ratios
As mentioned in the Introduction, large samples of galaxies, imaged at moderate to low resolution, are typically analyzed in terms of simple bulge/disc decompositions, treating the galaxies as consisting of just an (exponential) disc and an optional (Sérsic-profile) bulge; the latter is often assumed to be a classical bulge, or else treated in a dichotomous fashion as either a classical bulge or a pseudobulge (e.g., depending on whether the Sérsic index is greater or less than 2). Given the complexity in the central regions we find for these two galaxies, it is instructive to consider how they would be analyzed as part of a large, low-spatial-resolution sample.
To do this, we performed simple bulge/disc decompositions with Imfit on two sets of images. The first was the same Spitzer IRAC1 images (Section 2.2) used as part of our multi-component decompositions in Section 4. For NGC 4643, this can be compared with the two-component fit done to the same image by Salo et al. (2015). The second sets of images consisted of SDSS -band images, artificially redshifted to (chosen as a redshift typical of large, SDSS-based samples); this corresponds to an angular-diameter distance almost exactly ten times further away than the galaxies’ actual distances. We redshifted each image by first convolving it with a Gaussian so that it had same effective resolution it would have under the original observing conditions, but with the galaxy at ; we then binned the pixels 10:1. We did not attempt to include any -correction or surface-brightness dimming, since these are minor effects for the target redshift.
For NGC 4608, the two-component fit of the IRAC1 image gives , with Sérsic and kpc for the bulge component. Decomposition of the redshifted -band image also gives ; the Sérsic component now has a higher value of but essentially the same .
For NGC 4643, we find even more “bulge-dominated” fits, with (Sérsic , kpc) for the IRAC1 image; this is similar to the two-component fit to the same image by Salo et al. (2015): , Sérsic and kpc.131313Retrieved from webpage https://www.oulu.fi/astronomy/S4G_PIPELINE4/P4STORE/ For the redshifted -band image, we find , with Sérsic and kpc.
Clearly, the simplistic, two-component B/D decomposition that is still standard for large surveys fails dramatically for galaxies like these. It significantly (even catastrophically) overestimates the fraction of galaxy light that is part of the “bulge”, especially when that component is assumed to be a classical spheroid. Even the somewhat ad-hoc use of Sérsic indices to discriminate between classical bulges and pseudobulges would fail, since for both galaxies the Sérsic indices are . (These galaxies would satisfy at least two of the criteria for classical bulges in Kormendy 2016, since they have and .) This is misleading because both galaxies have significant pseudobulges: the B/P bulge in NGC 4608 and the B/P bulge and the nuclear disc in NGC 4643.
We have argued that NGC 4608 has a classical bulge that is only % of the galaxy light, while NGC 4643 has (at best) a compact classical bulge that is % of the total light; this latter component could also be interpreted as a large NSC. This means that two-component fits would overestimate the spheroid fraction of NGC 4608 by roughly a factor of four, and by roughly a factor of at least one hundred for NGC 4643.
It is now (somewhat) common to include optional bars in decompositions of moderately large samples (e.g., Gadotti, 2009; Salo et al., 2015; Méndez-Abreu et al., 2017; Kruk et al., 2018), though this is still not true of the largest surveys (e.g., Simard et al., 2011; Mendel et al., 2014; Kim et al., 2016; Lange et al., 2016; Bottrell et al., 2019). This does tend to reduce the fraction of light assigned to the “classical bulge”, but can still significantly overestimate things.
In the case of NGC 4608, the “spheroid/T” value drops from the two-component value of 0.49 to 0.33 when a separate (single-Sérsic) bar is included (Gadotti, 2008). For NGC 4643, the value drops from (various two-component fits) to 0.25 in the three-component fit of Salo et al. (2015). So three-component decompositions, with a simple Sérsic or Ferrers component for the bar, still result in overestimating the spheroid fraction by factors of three (NGC 4608) or fifty (NGC 4643).
7 Summary
We have presented a detailed morphological and stellar-kinematic analysis of two similar massive, early-type, barred galaxies, NGC 4608 and NGC 4643. We find that images of both galaxies can be fit using a new two-component bar model which assigns –17% of the total galaxy light to the narrow, vertically thin outer part of the bar and % of the total light to the bar’s B/P bulge (the vertically thickened inner part of the bar). A further –41% of the light can be assigned to the main disc of each galaxy, leaving –13% of the light for the central stellar components inside the bars.
In NGC 4608, this central component is apparently a classical bulge, with Sérsic and half-light radius pc; there is also evidence for a possible nuclear star cluster, though this is only % of the galaxy light. Published SAURON stellar kinematics show slow rotation and high velocity dispersion in this region, consistent with the idea that this is a classical bulge.
By contrast, the inner light in NGC 4643 is dominated by a stellar nuclear disc, with a somewhat unusual broken-exponential surface-brightness profile; the break in this profile produces a ringlike feature in unsharp masks, though there seems to be little in the way of an actual ring in addition to the nuclear disc. There is also evidence for a compact, round structure at the very center, with Sérsic and pc, amounting to % of the light; this is probably either a compact classical bulge (such as some of those identified in Erwin et al., 2015) or a very large nuclear star cluster.
The stellar kinematics for NGC 4643, including both published SAURON and MUSE data (and our reanalysis of the latter), show strong rotation, lower velocity dispersion, strong - anticorrelation, and elevated in the inner region, consistent with a rapidly rotating, kinematically cool nuclear disc. The increased is, we suggest, due to the overlapping contributions from the (more slowly rotating, kinematically hot) B/P bulge and the (faster-rotating, kinematically cool) nuclear disc. The inner pc shows a distinct drop in the velocity dispersion, in approximately the same region as where the central compact classical bulge (or large NSC) dominates. Although there are a handful of other examples of similar nuclear dispersion drops in some other early-type, barred galaxies, the explanation for this remains unclear.
The dramatically different central structures in these two otherwise very similar galaxies indicates that seemingly identical galaxies can have significantly different centers and thus different formation histories.
We also note that both galaxies have quite large ratios when they are fit using the same two-component (bulge + disc) models as are used for large galaxy surveys. If these galaxies were included in such surveys, they would most likely be assigned values of –0.7, even though their actual spheroid fractions are only 0.12 for NGC 4608 and 0.005 for NGC 4643; the high Sérsic indices for the “bulges” in such 2-component fits (–3.5) would (erroneously) suggest the existence of dominant classical bulges in these galaxies. Even three-component fits (disc + Sérsic/Ferrers bar + bulge) produce values of 0.25–0.3, which significantly overestimates the spheroid fraction.
This paper is a preview of the analysis we plan to apply to the other galaxies in our volume- and mass-limited sample of nearby S0 and early/intermediate-type spirals, as part of a project to determine the true nature and characteristics of the central stellar structures of disc galaxies.
Acknowledgments
We thank the referee for their comments on this paper, which have led to several improvements. We are also happy to thank Dimitri Gadotti, Matias Blaña Diaz and Mattia Sormani for comments on earlier drafts of this paper. VPD was supported by Science and Technology Facilities Council Consolidated grant ST/R000786/1. AdLC acknowledges support from grant AYA2016-77237-C3-1-P and JMA acknowledges support from grant AYA2017-83204-P, both from the Spanish Ministry of Economy and Competitiveness (MINECO).
This research is based on observations made with the NASA/ESA Hubble Space Telescope, obtained at the Space Telescope Science Institute. Support for Program number GO-15133 was provided by NASA through a grant from the Space Telescope Science Institute. The Space Telescope Science Institute is operated by the Association of Universities for Research in Astronomy, Incorporated, under NASA contract NAS5-26555.
This work is based in part on observations made with the Spitzer Space Telescope, obtained from the NASA/IPAC Infrared Science Archive, both of which are operated by the Jet Propulsion Laboratory, California Institute of Technology under a contract with the National Aeronautics and Space Administration. This paper also makes use of data obtained from the Isaac Newton Group Archive which is maintained as part of the CASU Astronomical Data Centre at the Institute of Astronomy, Cambridge.
Based on observations collected at the European Organisation for Astronomical Research in the Southern Hemisphere under ESO programme 097.B-0640(A).
Funding for the creation and distribution of the SDSS Archive has been provided by the Alfred P. Sloan Foundation, the Participating Institutions, the National Aeronautics and Space Administration, the National Science Foundation, the U.S. Department of Energy, the Japanese Monbukagakusho, and the Max Planck Society. The SDSS Web site is http://www.sdss.org/.
The SDSS is managed by the Astrophysical Research Consortium (ARC) for the Participating Institutions. The Participating Institutions are The University of Chicago, Fermilab, the Institute for Advanced Study, the Japan Participation Group, The Johns Hopkins University, the Korean Scientist Group, Los Alamos National Laboratory, the Max-Planck-Institute for Astronomy (MPIA), the Max-Planck-Institute for Astrophysics (MPA), New Mexico State University, University of Pittsburgh, University of Portsmouth, Princeton University, the United States Naval Observatory, and the University of Washington.
This research also made use of both the NASA/IPAC Extragalactic Database (NED) which is operated by the Jet Propulsion Laboratory, California Institute of Technology, under contract with the National Aeronautics and Space Administration, and the Lyon-Meudon Extragalactic Database (LEDA; http://leda.univ-lyon1.fr).
Data Availability
The raw HST, Spitzer, and MUSE data for both galaxies are publicly available from the respective archives. Reduced, mosaic Spitzer images for individual observations of both galaxies are also available from the Spitzer archive, and the reduced S4G mosaic image for NGC 4643 is available at the NASA/IPAC Infrared Science Archive (https://irsa.ipac.caltech.edu/data/SPITZER/S4G/). The reduced, combined MUSE datacube for NGC 4643 is available at http://archive.eso.org/wdb/wdb/adp/phase3_spectral/form?collection_name=MUSE_DEEP; our kinematic analyses of this datacube are available on request. Finally, the SAURON kinematic data for both galaxies is available at the ATLAS3D site (http://www-astro.physics.ox.ac.uk/atlas3d/.
Reduced images of our WFC3-IR F160W observations of both galaxies, along with sky-subtracted versions of the IRAC1 images, mask and PSF images, ellipse-fit files, Imfit config files, and Python code for generating the figures in this paper can all be found in a Github repository at https://github.com/perwin/n4608-n4643 and also at https://doi.org/10.5281/zenodo.4235501.
References
- Abazajian et al. (2009) Abazajian K. N., et al., 2009, ApJS, 182, 543
- Akaike (1974) Akaike H., 1974, IEEE T. Automat. Contr., 19, 716
- Anderson (2016) Anderson J., 2016, Technical report, Empirical Models for the WFC3/IR PSF
- Athanassoula (2005) Athanassoula E., 2005, MNRAS, 358, 1477
- Athanassoula & Beaton (2006) Athanassoula E., Beaton R. L., 2006, MNRAS, 370, 1499
- Athanassoula et al. (2015) Athanassoula E., Laurikainen E., Salo H., Bosma A., 2015, MNRAS, 454, 3843
- Baba & Kawata (2020) Baba J., Kawata D., 2020, MNRAS, 492, 4500
- Bacon et al. (2001) Bacon R., et al., 2001, MNRAS, 326, 23
- Bacon et al. (2010) Bacon R., et al., 2010, in McLean I. S., Ramsay S. K., Takami H., eds, Vol. 7735, Ground-based and Airborne Instrumentation for Astronomy III. SPIE, pp 131 – 139
- Bertin & Arnouts (1996) Bertin E., Arnouts S., 1996, A&AS, 117, 393
- Bittner et al. (2020) Bittner A., et al., 2020, arXiv e-prints, p. arXiv:2009.01856
- Blaña Díaz et al. (2017) Blaña Díaz M., Wegg C., Gerhard O., Erwin P., Portail M., Opitsch M., Saglia R., Bender R., 2017, MNRAS, 466, 4279
- Blaña Díaz et al. (2018) Blaña Díaz M., et al., 2018, MNRAS, 481, 3210
- Bland-Hawthorn & Gerhard (2016) Bland-Hawthorn J., Gerhard O., 2016, ARA&A, 54, 529
- Bluck et al. (2014) Bluck A. F. L., Mendel J. T., Ellison S. L., Moreno J., Simard L., Patton D. R., Starkenburg E., 2014, MNRAS, 441, 599
- Bottrell et al. (2019) Bottrell C., Simard L., Mendel J. T., Ellison S. L., 2019, MNRAS, 486, 390
- Brooks & Christensen (2016) Brooks A., Christensen C., 2016, Bulge Formation via Mergers in Cosmological Simulations. p. 317
- Bureau & Freeman (1999) Bureau M., Freeman K. C., 1999, AJ, 118, 126
- Bureau et al. (2006) Bureau M., Aronica G., Athanassoula E., Dettmar R.-J., Bosma A., Freeman K. C., 2006, MNRAS, 370, 753
- Cantiello et al. (2018) Cantiello M., et al., 2018, ApJ, 856, 126
- Cappellari (2017) Cappellari M., 2017, MNRAS, 466, 798
- Cappellari & Emsellem (2004) Cappellari M., Emsellem E., 2004, PASP, 116, 138
- Cappellari et al. (2011) Cappellari M., et al., 2011, MNRAS, 413, 813
- Chung & Bureau (2004) Chung A., Bureau M., 2004, AJ, 127, 3192
- Cole et al. (2014) Cole D. R., Debattista V. P., Erwin P., Earp S. W. F., Roškar R., 2014, MNRAS, 445, 3352
- Combes & Sanders (1981) Combes F., Sanders R. H., 1981, A&A, 96, 164
- Combes et al. (1990) Combes F., Debbasch F., Friedli D., Pfenniger D., 1990, A&A, 233, 82
- Davies et al. (2007) Davies R. I., Müller Sánchez F., Genzel R., Tacconi L. J., Hicks E. K. S., Friedrich S., Sternberg A., 2007, ApJ, 671, 1388
- Debattista et al. (2005) Debattista V. P., Carollo C. M., Mayer L., Moore B., 2005, ApJ, 628, 678
- Debattista et al. (2006) Debattista V. P., Mayer L., Carollo C. M., Moore B., Wadsley J., Quinn T., 2006, ApJ, 645, 209
- Debattista et al. (2017a) Debattista V. P., Roškar R., Loebman S. R., 2017a, in Knapen J. H., Lee J. C., Gil de Paz A., eds, Astrophysics and Space Science Library Vol. 434, Outskirts of Galaxies. p. 77
- Debattista et al. (2017b) Debattista V. P., Ness M., Gonzalez O. A., Freeman K., Zoccali M., Minniti D., 2017b, MNRAS, 469, 1587
- Eales et al. (2020) Eales S., Eales O., de Vis P., 2020, MNRAS, 491, 69
- Erwin (2004) Erwin P., 2004, A&A, 415, 941
- Erwin (2005) Erwin P., 2005, MNRAS, 364, 283
- Erwin (2015) Erwin P., 2015, ApJ, 799, 226
- Erwin & Debattista (2013) Erwin P., Debattista V. P., 2013, MNRAS, 431, 3060
- Erwin & Debattista (2017) Erwin P., Debattista V. P., 2017, MNRAS, 468, 2058
- Erwin & Sparke (2003) Erwin P., Sparke L. S., 2003, ApJS, 146, 299
- Erwin et al. (2008) Erwin P., Pohlen M., Beckman J. E., 2008, AJ, 135, 20
- Erwin et al. (2015) Erwin P., et al., 2015, MNRAS, 446, 4039
- Erwin et al. (2020) Erwin P., et al., 2020, in preparation (Paper I)
- Falcón-Barroso et al. (2011) Falcón-Barroso J., Sánchez-Blázquez P., Vazdekis A., Ricciardelli E., Cardiel N., Cenarro A. J., Gorgas J., Peletier R. F., 2011, A&A, 532, A95
- Ferrers (1877) Ferrers N. M., 1877, Q.J. Pure Appl. Math., 14, 1
- Fragkoudi et al. (2016) Fragkoudi F., Athanassoula E., Bosma A., 2016, MNRAS, 462, L41
- Gadotti (2008) Gadotti D. A., 2008, MNRAS, 384, 420
- Gadotti (2009) Gadotti D. A., 2009, MNRAS, 393, 1531
- Gadotti et al. (2015) Gadotti D. A., Seidel M. K., Sánchez-Blázquez P., Falcón-Barroso J., Husemann B., Coelho P., Pérez I., 2015, A&A, 584, A90
- Gadotti et al. (2019) Gadotti D. A., et al., 2019, MNRAS, 482, 506
- Gadotti et al. (2020) Gadotti D. A., et al., 2020, arXiv e-prints, p. arXiv:2009.01852
- Gallego-Cano et al. (2020) Gallego-Cano E., Schödel R., Nogueras-Lara F., Dong H., Shahzamanian B., Fritz T. K., Gallego-Calvente A. T., Neumayer N., 2020, A&A, 634, A71
- Gao & Ho (2017) Gao H., Ho L. C., 2017, ApJ, 845, 114
- Herrera-Endoqui et al. (2017) Herrera-Endoqui M., Salo H., Laurikainen E., Knapen J. H., 2017, A&A, 599, A43
- Iannuzzi & Athanassoula (2015) Iannuzzi F., Athanassoula E., 2015, MNRAS, 450, 2514
- Kim et al. (2016) Kim K., Oh S., Jeong H., Aragón-Salamanca A., Smith R., Yi S. K., 2016, ApJS, 225, 6
- Knapen et al. (2014) Knapen J. H., Erroz-Ferrer S., Roa J., Bakos J., Cisternas M., Leaman R., Szymanek N., 2014, A&A, 569, A91
- Kormendy (2016) Kormendy J., 2016, in Laurikainen E., Peletier R., Gadotti D., eds, Astrophysics and Space Science Library Vol. 418, Galactic Bulges. p. 431
- Kormendy & Ho (2013) Kormendy J., Ho L. C., 2013, ARA&A, 51, 511
- Kormendy & Kennicutt (2004) Kormendy J., Kennicutt Jr. R. C., 2004, ARA&A, 42, 603
- Krajnović et al. (2006) Krajnović D., Cappellari M., de Zeeuw P. T., Copin Y., 2006, MNRAS, 366, 787
- Krajnović et al. (2011) Krajnović D., et al., 2011, MNRAS, 414, 2923
- Kruk et al. (2018) Kruk S. J., et al., 2018, MNRAS, 473, 4731
- Kruk et al. (2019) Kruk S. J., Erwin P., Debattista V. P., Lintott C., 2019, MNRAS, 490, 4721
- Kuijken & Merrifield (1995) Kuijken K., Merrifield M. R., 1995, ApJ, 443, L13
- Lang et al. (2014) Lang P., et al., 2014, ApJ, 788, 11
- Lange et al. (2016) Lange R., et al., 2016, MNRAS, 462, 1470
- Läsker et al. (2016) Läsker R., Greene J. E., Seth A., van de Ven G., Braatz J. A., Henkel C., Lo K. Y., 2016, ApJ, 825, 3
- Launhardt et al. (2002) Launhardt R., Zylka R., Mezger P. G., 2002, A&A, 384, 112
- Laurikainen & Salo (2017) Laurikainen E., Salo H., 2017, A&A, 598, A10
- Laurikainen et al. (2005) Laurikainen E., Salo H., Buta R., 2005, MNRAS, 362, 1319
- Laurikainen et al. (2014) Laurikainen E., Salo H., Athanassoula E., Bosma A., Herrera-Endoqui M., 2014, MNRAS, 444, L80
- Li et al. (2017) Li Z.-Y., Ho L. C., Barth A. J., 2017, ApJ, 845, 87
- Li et al. (2018) Li Z.-Y., Shen J., Bureau M., Zhou Y., Du M., Debattista V. P., 2018, ApJ, 854, 65
- Lütticke et al. (2000) Lütticke R., Dettmar R.-J., Pohlen M., 2000, A&A, 362, 435
- Martig et al. (2009) Martig M., Bournaud F., Teyssier R., Dekel A., 2009, ApJ, 707, 250
- Martig et al. (2013) Martig M., et al., 2013, MNRAS, 432, 1914
- Martinez-Valpuesta & Shlosman (2004) Martinez-Valpuesta I., Shlosman I., 2004, ApJ, 613, L29
- Mehrgan et al. (2019) Mehrgan K., Thomas J., Saglia R., Mazzalay X., Erwin P., Bender R., Kluge M., Fabricius M., 2019, ApJ, 887, 195
- Mendel et al. (2014) Mendel J. T., Simard L., Palmer M., Ellison S. L., Patton D. R., 2014, ApJS, 210, 3
- Méndez-Abreu et al. (2014) Méndez-Abreu J., Debattista V. P., Corsini E. M., Aguerri J. A. L., 2014, A&A, 572, A25
- Méndez-Abreu et al. (2017) Méndez-Abreu J., et al., 2017, A&A, 598, A32
- Merrifield & Kuijken (1999) Merrifield M. R., Kuijken K., 1999, A&A, 345, L47
- Mowla et al. (2019) Mowla L. A., et al., 2019, ApJ, 880, 57
- Neumann et al. (2019) Neumann J., et al., 2019, A&A, 627, A26
- Neumayer et al. (2020) Neumayer N., Seth A., Boeker T., 2020, A&ARv, in press, arXiv:2001.03626
- Nogueras-Lara et al. (2019) Nogueras-Lara F., et al., 2019, Nature Astronomy
- Nowak et al. (2010) Nowak N., Thomas J., Erwin P., Saglia R. P., Bender R., Davies R. I., 2010, MNRAS, 403, 646
- Oohama et al. (2009) Oohama N., Okamura S., Fukugita M., Yasuda N., Nakamura O., 2009, ApJ, 705, 245
- Opitsch et al. (2018) Opitsch M., Fabricius M. H., Saglia R. P., Bender R., Blaña M., Gerhard O., 2018, A&A, 611, A38
- Quillen (2002) Quillen A. C., 2002, AJ, 124, 722
- Quillen et al. (2014) Quillen A. C., Minchev I., Sharma S., Qin Y.-J., Di Matteo P., 2014, MNRAS, 437, 1284
- Raha et al. (1991) Raha N., Sellwood J. A., James R. A., Kahn F. D., 1991, Nature, 352, 411
- Riess (2011) Riess A. G., 2011, An Independent Determination of WFC3-IR Zeropoints and Count Rate Non-Linearity from 2MASS Asterisms, Space Telescope WFC Instrument Science Report
- Roediger & Courteau (2015) Roediger J. C., Courteau S., 2015, MNRAS, 452, 3209
- Saglia et al. (2016) Saglia R. P., et al., 2016, ApJ, 818, 47
- Salo et al. (2015) Salo H., et al., 2015, ApJS, 219, 4
- Sánchez-Blázquez et al. (2006) Sánchez-Blázquez P., et al., 2006, MNRAS, 371, 703
- Sandage & Bedke (1994) Sandage A., Bedke J., 1994, The Carnegie atlas of galaxies. Washington, DC: Carnegie Institution of Washington with The Flintridge Foundation
- Schlafly & Finkbeiner (2011) Schlafly E. F., Finkbeiner D. P., 2011, ApJ, 737, 103
- Schönrich et al. (2015) Schönrich R., Aumer M., Sale S. E., 2015, ApJ, 812, L21
- Seidel et al. (2015) Seidel M. K., Falcón-Barroso J., Martínez-Valpuesta I., Díaz-García S., Laurikainen E., Salo H., Knapen J. H., 2015, MNRAS, 451, 936
- Sellwood & Gerhard (2020) Sellwood J. A., Gerhard O., 2020, MNRAS, 495, 3175
- Shen et al. (2010) Shen J., Rich R. M., Kormendy J., Howard C. D., De Propris R., Kunder A., 2010, ApJ, 720, L72
- Sheth et al. (2010) Sheth K., et al., 2010, PASP, 122, 1397
- Sheth et al. (2013) Sheth K., et al., 2013, Not Dead Yet! Completing Spitzer’s Legacy with Early Type Galaxies, Spitzer Proposal
- Simard et al. (2011) Simard L., Mendel J. T., Patton D. R., Ellison S. L., McConnachie A. W., 2011, ApJS, 196, 11
- Simien & de Vaucouleurs (1986) Simien F., de Vaucouleurs G., 1986, ApJ, 302, 564
- Sormani et al. (2020) Sormani M. C., Magorrian J., Nogueras-Lara F., Neumayer N., Schönrich R., Klessen R. S., Mastrobuono-Battisti A., 2020, MNRAS, 499, 7
- Vazdekis et al. (2015) Vazdekis A., et al., 2015, MNRAS, 449, 1177
- Wozniak & Michel-Dansac (2009) Wozniak H., Michel-Dansac L., 2009, A&A, 494, 11
- York et al. (2000) York D. G., et al., 2000, AJ, 120, 1579
- de Vaucouleurs et al. (1993) de Vaucouleurs G., de Vaucouleurs A., Corwin H. G., Buta R. J., Paturel G., Fouqué P., 1993, Third Reference Catalog of Bright Galaxies. New York: Springer-Verlag
- van Driel et al. (2000) van Driel W., Arnaboldi M., Combes F., Sparke L. S., 2000, A&AS, 141, 385
Appendix A The Broken-Exponential Nuclear Disc in NGC 4643
For NGC 4643, we argue that the inner region is best understood as a nuclear disc with a somewhat unusual broken-exponential radial surface-brightness profile. The evidence for a distinct nuclear disc of some kind is relatively unambiguous. First, there is set of isophotes (semi-major axes –4.5″) with similar ellipticities and, most significantly, a common position angle () which is clearly distinct from that of the bar (); see, e.g., Figures 3 and 4. Second, unsharp masking shows a clear, narrow “ring-like” zone at where the surface-brightness changes abruptly (e.g., Figure 11). And, of course, there is very clear stellar-kinematic evidence for a kinematically cool and thus disclike structure in this region (Section 5).
However, the exact profile of this structure is perhaps not as clear. For example, might the ringlike feature in the unsharp mask be the result of a narrow ring added to a smoother profile (e.g., that of an exponential)? Figure 20 plots major-axis profiles (folded about ) of residual images obtained by subtracting the bar+main-disc components of three different best-fit models. The goal is to see how much variation in the residual profile is due to variations in the total model. All three models use our standard composite Sérsic + FlatBar model for the bar and a small Sérsic component for the central classical bulge/NSC; they differ in how we model the nuclear-disc region itself. The top panel shows the profile when we use a Sérsic function for the nuclear disc. The middle panel shows the same when the model uses the sum of an exponential and an asymmetric Gaussian ring (Imfit’s GaussianRing2Side component) – a plausible model for the sum of a star-forming nuclear ring and an underlying nuclear disc. Finally, the bottom panel shows the result for our preferred best-fit model (nuclear disc modeled as BrokenExponential), and is the same as what is shown in the right-hand panels of Figure 12.
In all three cases, we see the same basic structure in the residual profile: the compact central excess (which we associate with the CB/NSC) and a broken-exponential profile outside, which dominates the residual profile for . This indicates that our identification of a broken-exponential structure for the nuclear disc in NGC 4643 is robust: it persists regardless of the specific components used in the modeling of this region, and is not an artifact of simply assuming the profile must be modeled with a BrokenExponential component.
It is also worth noting that in the Exponential + GaussianRing2Side model, the best-fit “ring” radius is only 1.22″, which is clearly much smaller than the visible break radius (); in addition, the inner part of this component is essentially flat, so it is not really a ring. Although this more complicated model provides a formally better fit with lower AIC than the BrokenExponential model, its parameters are less useful as descriptions of the structure. Since the best-fit BrokenExponential break radius of 2.9″ is a much closer match to the visible break, we prefer it as an approximation of the nuclear disc.
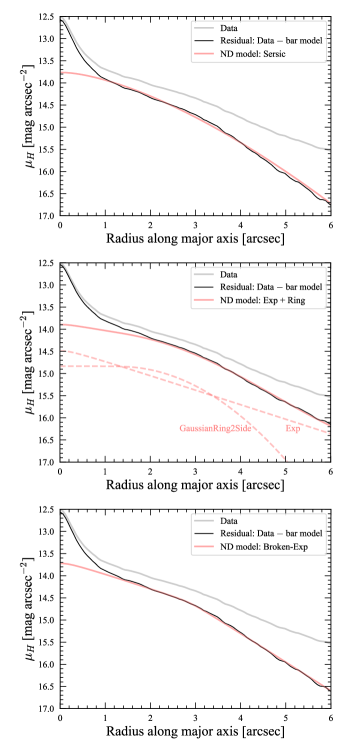
Appendix B A Two-Dimensional Model of a Bar with a Boxy/Peanut-shaped Bulge
Although it is standard to model bars in 2D decompositions as simple elliptical141414With the option of describing the isophotes as having fixed deviations from pure ellipticity in the discy/boxy sense. structures with either Sérsic profiles or variations on the Ferrers (1877) ellipsoid, recent analysis of bars in simulations and real galaxies (e.g., Laurikainen et al., 2014; Athanassoula et al., 2015) has suggested that many bars are better described as two-component systems. In this scheme, one combines an outer, narrow component with a shallow (sometimes constant) radial surface-brightness profile and an inner, rounder component with a steeper profile. These can be readily associated with the dual three-dimensional structure of bars with B/P bulges: the outer, vertically thin part of the bar has (when seen face-on) narrow isophotes and a shallow surface-density profile, while the vertically thick B/P bulge has rounder isophotes and a steeper surface-density profile.
Laurikainen et al. (2014) and Athanassoula et al. (2015) modeled this composite structure using a slightly modified version of the Ferrers ellipsoid for the outer part of the bar and a mildly elliptical Sérsic component, typically with Sérsic index close to 1, for the B/P bulge (the “barlens” in their terminology). While this is a clear improvement on past models for bars, it is only a weak approximation of the outer-bar structure. Our model attempts to capture three characteristics of the outer parts of bars seen at low inclinations:
-
1.
The narrow isophote shape of the outer part of the bar;
-
2.
The fact that the surface-brightness profile along the bar’s major axis has a broken-exponential nature, with a shallow (or even constant) profile breaking sharply to a steeper, quasi-exponential falloff near the end of the bar;
-
3.
The transition between discy isophotes for most of the outer part of the bar and rectangular isophotes near and at the end of the bar.
We achieve this by creating a model for the outer part of the bar (“FlatBar”) with intrinsically elliptical isophotes and a surface-brightness profile which has a broken-exponential form (Erwin et al., 2008; Erwin, 2015). This is then modified by interpolating the profile as a function of angle relative to the bar major axis. Along the major axis, we have the default broken-exponential profile, with inner scale length and outer scale length , and with the transition region specified by the break radius and the sharpness parameter . As we move away from the major axis – i.e., considering radial profiles with angles relative to the major axis – we gradually increase the value of using parabolic interpolation. For , and the profile becomes a simple exponential. In addition, we fix so that it is constant regardless of , as opposed to the normal pattern of reducing to match the ellipticity of the image function away from the major axis (as is done in Imfit’s BrokenExponential function.)
As Figure 21 shows, this result in a structure where the inner isophotes are clearly discy but transition to boxy near the break radius. At very large radii – i.e., well outside the bar proper – the isophotes can become implausibly polygonal, but this will usually be in regions dominated by the main disc and so the effects in a typical combined model will be minimal.
We combine the FlatBar component with a mildly elliptical Sérsic component (for the B/P bulge) to represent the whole bar (Figure 21). Preliminary tests for a small number of barred galaxies indicates that best-fit Sérsic indices for the B/P bulge component range between 0.5 and 1.1. For the two galaxies studied in this paper, we use a Sersic_GenEllipse component (with generalized ellipses for the isophotes) to account for the possibility of slightly boxy (or discy) isophotes in the B/P bulge component.
We emphasize that this is an ad-hoc solution which appears to work well when the galaxy is close to face-on, and to a certain degree for mildly inclined systems when the bar is close to either the major or minor axis – the latter being the case for the two galaxies studied here. For intermediate bar position angles and higher inclinations, the projected appearance of bars with B/P bulges becomes strongly asymmetric (see, e.g. Erwin & Debattista, 2013, 2017) and this model will be less suitable.
This function has been added to the most recent release (v1.8) of Imfit; the code for it can be found on Imfit’s GitHub site (https://github.com/perwin/imfit).

Appendix C A Two-Dimensional Model of a Ring with Azimuthally Varying Intensity
NGC 4608 has a prominent inner ring surrounding its bar (e.g., Figures 6 and 7). Imfit includes an image function (GaussianRing) describing an elliptical ring with a Gaussian radial profile, which we initially used in our modeling of the images of this galaxy. Although this produced reasonable results, it was clear from both the images and residuals of the fit that the galaxy’s ring did not have a constant surface brightness, but rather decayed in brightness away from the major axis of the bar.
To deal with this, we created a modification of the GaussianRing component in which the peak intensity of of the (Gaussian) radial profile varies as a function of angle , with along the ring’s major axis (), and at (along the minor axis), interpolating smoothly between the two values as a function of for intermediate angles. The surface brightness at scaled radius and angle is thus given by
| (1) |
where the ring has semi-major axis and radial width , and
| (2) |
(In practice, , where is one of the fitted parameters.)
This function – GaussianRingAz – has been added to the most recent release (v1.8) of Imfit; the code for it can be found on Imfit’s GitHub site (https://github.com/perwin/imfit).
Appendix D Parameter Correlations from Bootstrap Resampling
The parameter uncertainties for our best-fit models for both galaxies (Tables 1 and 2), based on bootstrap resampling, present a slightly misleading picture, because they suggest the uncertainties for individual parameters are independent of each other. In reality, the uncertainties may include correlations between different parameters.
In Figure 22 we plot parameter distributions from 500 rounds of bootstrap resampling for our fit to the F160W image of NGC 4643. Since the model has over 30 free parameters, a full corner plot would need hundreds of individual panels. We show instead a subset of parameters from the Sérsic and BrokenExponential components which fit the innermost structures of NGC 4643: the compact bulge (or NSC) and the nuclear disc surrounding it. We can see that some parameters are quite strongly correlated: for example, the Sérsic index correlates with the Sérsic effective radius and with the inner slope () of the BrokenExponential, and anti-correlates with the break radius of the latter. Although this has no effect on our conclusions in this paper, we note that future analysis of larger samples of galaxies with similar structures should be careful to ensure that any apparent correlations between parameters of different components are not simply side-effects of parameter degeneracies in the modeling.
