Defining the (Black Hole)-Spheroid Connection with the Discovery of Morphology-Dependent Substructure in the – and – Diagrams: New Tests for Advanced Theories and Realistic Simulations
Abstract
For 123 local galaxies with directly-measured black hole masses (), we provide the host spheroid’s Sérsic index (), effective half-light radius (), and effective surface brightness (), obtained from careful multi-component decompositions, and we use these to derive the morphology-dependent – and – relations. We additionally present the morphology-dependent – and – relations. We explored differences due to: early-type galaxies (ETGs) versus late-type galaxies (LTGs); Sérsic versus core-Sérsic galaxies; barred versus non-barred galaxies; and galaxies with and without a stellar disk. We detect two different – relations due to ETGs and LTGs with power-law slopes and . We additionally quantified the correlation between and the spheroid’s central concentration index, which varies monotonically with the Sérsic index. Furthermore, we observe a single, near-linear – relation for ETGs and LTGs, which encompasses both classical and alleged pseudobulges. In contrast, ETGs and LTGs define two distinct – relations with (cf. 0.51 dex for the – relation and 0.58 dex for the – relation), and the ETGs alone define two steeper – relations, offset by 1 dex in the -direction, depending on whether they have a disk or not and explaining their similar offset in the – diagram. This trend holds using , , or radii. These relations offer pivotal checks for simulations trying to reproduce realistic galaxies, and for theoretical studies investigating the dependency of black hole mass on basic spheroid properties.
2020 November 06 in the Astrophysical Journal
1 Introduction
It is widely known that the mass of the black hole (BH) residing at the centre of most galaxies is correlated with both the host spheroid’s stellar mass () and its central stellar velocity dispersion (). At the same time, bulgeless galaxies, for example, NGC 2478, NGC 4395, and NGC 6926, have also been observed to house massive BHs (e.g. Secrest et al., 2013; Simmons et al., 2013; den Brok et al., 2015; Davis et al., 2019, and references therein), and one of the tightest scaling relations is between black hole mass () and the winding/pitch angle of the spiral arms in spiral galaxies (Seigar et al., 2008; Berrier et al., 2013; Davis et al., 2017). Additional correlations exist between and disk stellar mass (Davis et al., 2018), disk rotation, and dark matter halo mass (Ferrarese, 2002; Baes et al., 2003; Volonteri et al., 2011; Davis et al., 2019). Collectively, this goes beyond the notion of a single primary (causal) relation for all galaxies plus secondary (indirect/consequential) relations, and reveals a greater level of complexity. Indeed, the markedly different – and – relations for early-type galaxies (ETGs, comprised of E-, ES111ES-type represents ellicular galaxies which have an intermediate-scale stellar disk confined to within their spheroid (Liller, 1966; Graham, 2019a).-, and S0-types) and late-type galaxies (LTGs), i.e. spiral (Sp) galaxies (Davis et al., 2018, 2019; Sahu et al., 2019a), undoubtedly reflects the different physical processes, gas supply history, net angular momentum, involved in building these systems.
The review of the BH scaling relations by Graham (2016) highlighted the need to achieve internal consistency among the various scaling relations, in particular between the –, –, and – relations. This followed Graham (2012) who reported on a near-linear and super-quadratic – relation, respectively, for spheroids with a Sérsic or core-Sérsic222Core-Sérsic galaxies have a deficit of light at their centre; hence, their central (bulge) light profile is described using a shallow power-law followed by a Sérsic (1963) function beyond the core (Graham et al., 2003b). This population was first discussed by King & Minkowski (1966, 1972). light profile (see also Graham & Scott (2013) and Scott et al. (2013)). Savorgnan et al. (2016) subsequently discovered an improved division due to ETGs and LTGs (none of LTGs have core-Sérsic bulge profiles) in the – diagram, and in the –(, galaxy luminosity) diagram. This was also later reported by van den Bosch (2016). Savorgnan et al. (2016) coined the notion of a red and blue sequence when two tracks, due to ETGs and LTGs, are evident in a BH mass scaling diagram (see also Terrazas et al., 2016; Dullo et al., 2020). Sahu et al. (2019a) additionally found that the – relation for ETGs with a disk (ES and S0) and ETGs without a disk (E-type) is roughly quadratic, while the two relations are offset by more than an order of magnitude in the -direction. This has since been found in a recent simulation by Marshall et al. (2020). Clearly, it is not simply the amount of stellar mass that matters, but also how it was accumulated and is now distributed. In this vein, we explore the relationship that the BH mass has with the size and shape (centrally concentrated or diffused) of the surrounding bulge/spheroid— terms that we use interchangeably—and as a function of the morphology of the host galaxy.
The above mentioned developments represent a key advance in our understanding of the coevolution of galaxies and black holes. It built upon works such as Wandel (1999), Salucci et al. (2000), Laor (2001), and Graham (2012) and voided the notion (Dressler, 1989; Kormendy & Richstone, 1995; Magorrian et al., 1998) that the black hole mass simply co-evolved linearly with the spheroid mass. The recognition of a more nuanced situation is perhaps not surprising given the variety of accretion/merger histories, and resulting structures among galaxies. For example, core-Sérsic galaxies, thought to be built from the dry merger of galaxies with pre-existing black holes (Begelman, 1984), appear to follow a steeper relation in the – diagram (Sahu et al., 2019b), see also Terrazas et al. (2016, their Figure 3a) and Bogdán et al. (2018, their Figure 5).
Based on the low intrinsic scatter about the – relation (Ferrarese & Merritt, 2000; Gebhardt et al., 2000), some studies have concluded that it is the most fundamental relation between black hole mass and galaxy (e.g. van den Bosch, 2016; de Nicola et al., 2019). However, it may be a premature conclusion without considering the correlations between BH mass and other basic galaxy properties, or allowing for the morphology-dependence and thus (formation physics)-dependence of galaxies. Moreover, it overlooks that the –pitch angle () relation has the least total scatter at 0.43 dex (Davis et al., 2017) compared to 0.51 dex in the latest – diagram (Sahu et al., 2019b).
Establishing if a, and which, single relation is the most fundamental, i.e., the primary relation, and how it depends upon morphology is important for understanding the co-evolution of galaxies and BHs. The secondary scaling relations — not to be confused with the morphology dependent substructure which reveals an additional parameter/factor modulating the co-joined growth of galaxies and BHs333We could re-frame these results by constructing a simplified ‘fundamental plane’, i.e. a 3-parameter equation involving , (or ) and morphological type (even if just a binary parameter). This would effectively unite the morphology-dependent – (–) relations and reduce the scatter about the two-parameter relations which ignore the morphological type. We will pursue this in future work. — are, however, also important. They can still be used, for example, to predict BH masses or to check on the accuracy of computer simulations e.g., CLUES (Yepes et al., 2009), Magneticum (Dolag, 2015), Bolshoi (Klypin et al., 2011), EAGLE (Schaye et al., 2015), Illustris (Vogelsberger et al., 2014), IllustrisTNG (Pillepich et al., 2018), FIRE (Hopkins et al., 2018), and SIMBA (Davé et al., 2019), which are trying to produce realistic galaxies444Simulations lacking primary information about the spheroid can still be tested against the non-linear, morphology-dependent, – relations (Davis et al., 2018; Sahu et al., 2019a).. These empirical relations help to decipher the physics behind the effect of the central supermassive black hole on the host spheroid/galaxy properties and vice versa. How such black hole feedback drives galaxy evolution is the challenge yet to be fully answered (Choi et al., 2018; Ruszkowski et al., 2019; Terrazas et al., 2020; Martín-Navarro et al., 2020).
Here, we will expand upon the previous efforts in establishing the – relation (e.g., Graham et al., 2003a; Graham & Driver, 2007a; Vika et al., 2012; Beifiori et al., 2012; Savorgnan et al., 2013; Savorgnan, 2016), the – relation (e.g., Andredakis et al., 1995; Jerjen et al., 2000; Graham & Guzmán, 2003; Ferrarese et al., 2006; Savorgnan, 2016), the – relation (e.g., Sérsic, 1968a; Graham & Worley, 2008; Lange et al., 2015), and the – relation (e.g., de Nicola et al., 2019) using our extensive sample of 83 ETGs and 40 LTGs with careful (individual, not automated) multi-component decompositions. Importantly, we explore potential substructures due to galaxy sub-morphologies, i.e., Sérsic versus core-Sérsic galaxies, barred versus non-barred galaxies, galaxies with a stellar disk versus galaxies without a stellar disk, and ETGs versus LTGs. We also investigate the relation between and the central concentration index (Graham et al., 2001a), which is known to vary monotonically with the Sérsic index (Trujillo et al., 2001; Graham et al., 2001b).
As with the – relation, the – and – relations can be applied to large surveys of galaxies (e.g., Casura et al., 2019) — if their bulge Sérsic parameters are reliable — to estimate their black hole masses and further construct the black hole mass function (BHMF). The BHMF holds interesting information for cosmologists, e.g., to estimate the mass density of the Universe contained in BHs (e.g. Fukugita & Peebles, 2004; Graham & Driver, 2007b), to map the growth of BHs and constrain theoretical models of BH evolution (e.g. Kelly & Merloni, 2012). In addition, the latest BHMF, which takes part in calculating the black hole merger rate (Chen et al., 2019; Volonteri et al., 2020), will help improve the prediction for the amplitude and time until detection of the long-wavelength (micro to nano Hertz) gravitation wave background — as generated from merging supermassive black holes — using pulsar timing arrays (Siemens et al., 2013; Shannon et al., 2015; Sesana et al., 2016) and using the upcoming Laser Interferometer Space Antenna (LISA, Danzmann, 2017; Baker et al., 2019).
Section 2 details the galaxy sample and parameters which we used for our investigation, and the regression routines applied to obtain the correlations. Various correlations we observed, including their dependencies on galaxy morphology, are described in the subsections of Section 3. In sub-section 3.1, we present the scaling relations observed between the spheroid stellar mass and spheroid Sérsic index. Sub-section 3.2 presents the expected correlation between black hole mass and the bulge Sérsic index by combing the correlation observed between spheroid stellar mass and spheroid Sérsic index with our latest correlation between black hole mass and spheroid stellar mass. It then presents the observed correlations between black hole mass and the bulge Sérsic index based on our data-set. We also show the relationship between the Sérsic index and the central light concentration, and we present the correlation observed between the black hole mass and the central concentration index. In sub-section 3.3, we present the correlations observed between the spheroid stellar mass and the effective spheroid half-light radius. Here, we also explore the correlations of the spheroid stellar mass with the spheroid radii containing and of the light of the spheroid. Sub-section 3.4 provides the expected correlation that the spheroid half-light radius might have with the black hole mass, before presenting the observed correlations between the black hole mass and the spheroid effective half-light radius, along with the correlations between the black hole mass and the spheroid radii containing and of spheroid’s light. These subsections additionally provide a discussion and some explanation for the correlations that we find. Finally, Section 4 presents a summary of our main results.
2 Data
The Sérsic (1963, 1968a) function is nowadays used to describe the light profiles of elliptical galaxies (E) and, when present, the spheroidal component of galaxies with a disk (ES/S0/Sp). A review of the Sérsic function, and its many associated expressions, can be found in Graham & Driver (2005). Briefly, the intensity of a Sérsic light profile can be expressed as a function of the projected galactic radius (R), such that {IEEEeqnarray}rCl I(R)= I_e exp[-b_n { (RRe )^1/n-1 }], where , , and are profile parameters. The term is the effective intensity at the effective radius , which bounds 50% of the total light in the associated 2D image. Graham (2019b) provides a detailed review of this popular radius and addresses the misconceptions about its physical significance. The surface brightness at this effective radius () is related to through .
The Sérsic index n (also known as the shape parameter), describes the curvature of the light profile, such that a Sérsic light profile with a higher Sérsic index is steeper at the centre and has a shallower distribution at larger radius, whereas, a profile with a smaller Sérsic index is shallower at the centre followed by a steeper drop at outer radii (see Figure 2 in Graham, 2019b). Thus, the Sérsic index traces the central concentration of the light within the spheroid (Trujillo et al., 2001; Graham et al., 2001b, their Figure 2); and also the inner gradient of the gravitational potential555This holds when dark matter is negligible, and there is no significant stellar mass-to-light ratio gradient. (Terzić & Graham, 2005, their Figures 2 and 3). The value of the term in Equation 2 depends on n, and is obtained by solving , where denotes the gamma function and is the incomplete gamma function. It can also be approximated by for (Capaccioli, 1989).
In this work, we have used a sample of 123 galaxies with directly-measured black hole masses, for whom the Sérsic model parameters () describing their spheroid’s surface brightness distribution were obtained by a careful multi-component decomposition of the galaxy’s light. These parameters are collectively taken from Savorgnan & Graham (2016), Davis et al. (2019), and Sahu et al. (2019a). These studies performed a 2-dimensional (2D) isophotal analysis, first extracting a 2D luminosity model using Isofit and Cmodel (Ciambur, 2015) to capture the radial gradients in the ellipticity, position angle, and Fourier harmonic coefficients describing the isophote’s deviations from a pure ellipse, and then performing a multi-component decomposition using the isophotal-averaged 1D surface-brightness profile along the major and geometric-mean666The geometric-mean axis, which is also known as the “equivalent axis”, is the radius of the circularized form of the elliptical isophote with major axis radius and minor axis radius , which conserves the same amount of flux. This results in the equivalent axis radius () being the geometric mean of and (), which is also represented as (for more details see the appendix section in Ciambur, 2015). axis of the galaxies. For this purpose, they used the software Profiler (Ciambur, 2016), which is inbuilt with many functions for specific galaxy components, including the Sérsic function for galactic spheroids. The major and geometric-mean axis were modelled independently (see Section 3 in Sahu et al., 2019a, for more details).
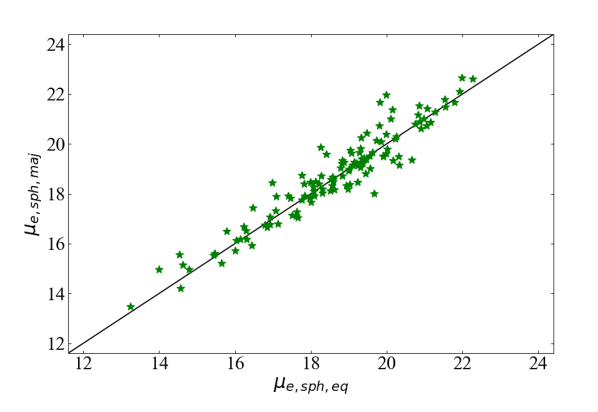
Table 3 in our appendix lists both the major-axis bulge parameters (), and the equivalent-axis bulge parameters (), plus the morphologies, and the bulge masses () taken from Savorgnan & Graham (2016), Davis et al. (2019), and Sahu et al. (2019a), along with the distances and the directly-measured black hole masses of the galaxies. To show the consistency between the structural decomposition of the major- and equivalent-axis surface brightness profiles, we have plotted versus in Figure 1. The 1 scatter in this diagram is which corresponds to a 1 scatter in of 30% given that the Sérsic model’s surface brightness profile has slopes of 1.8 to 2.1 (for to 10) at , where . Table 3 also provides the radial concentration index (C: see Section 3) and the physical (arcsec to kpc) size scale of the galaxies777The physical scale is calculated using the python version of Edward (Ned) L. Wright’s cosmological calculator (Wright, 2006), written by James Schombert, assuming the cosmological parameters , =0.315, and =0.685 (Planck Collaboration et al., 2018).. The morphologies of these galaxies are based on the multi-component decompositions found in Savorgnan & Graham (2016), Davis et al. (2019), and Sahu et al. (2019a).
The black hole masses used here have been obtained from various sources in the literature. Their original sources are listed in Savorgnan et al. (2016) and Sahu et al. (2019a) for the ETGs, and in Davis et al. (2019) for the LTGs. These black hole masses have been directly-measured using either the stellar dynamical modelling, gas dynamical modelling, megamaser kinematics, proper motions (Sgr ), or the latest direct imaging method (M87*). As the distances to the galaxies have been revised over time, the BH masses have also been updated to keep pace with this, and thereby provide a consistent analysis with the arcsecond-to-kpc and apparent-to-absolute magnitude conversions.
Our total sample is comprised of 123 galaxies, of which 83 are ETGs, and 40 are LTGs. We have used the Bivariate Correlated Errors and Intrinsic Scatter (BCES) regression (Akritas & Bershady, 1996) to obtain the symmetric (bisector) best-fit lines for all our correlations. The BCES888We used the Python module from (Nemmen et al., 2012), which is available at https://github.com/rsnemmen/BCES regression considers the measurement errors in both variables and allows for intrinsic scatter in the data. It is a modified form of the ordinary least square (OLS) regression. It calculates the OLS() line by minimizing the scatter in the Y-direction, and the OLS() line by minimizing the scatter in the X-direction. The BCES(Bisector) line symmetrically bisects the OLS() and OLS() lines. We prefer to use the bisector line as it offers equal treatment to the quantities plotted on the X-and Y-axes. Additionally, we also checked the consistency of our correlations by employing the modified-FITEXY (MPFITEXY) regression (Press et al., 1992; Tremaine et al., 2002; Williams et al., 2010; Markwardt, 2012), where we had to bisect the best-fit lines obtained from the forward MPFITEXY() and inverse MPFITEXY() regressions to obtain the symmetric fit to our data (see Novak et al., 2006, for more details about the MPFITEXY regression).
For our investigation, we adopt a uncertainty for the Sérsic bulge parameter n. Various factors which can contribute to the uncertainty in the measurement of the Sérsic bulge parameters include: inappropriate sky subtraction; incomplete masking; inaccurate point-spread function (PSF) for the telescope; uncertainties in the identification of components; especially the nuclear (bar/disk/ring/star cluster) or faint components during the multi-component decomposition of the galaxy luminosity. Thus, it is challenging to quantify the uncertainty in the bulge parameters for every galaxy individually.
In past studies, various measures have been taken to quantify realistic errors on the bulge/galaxy Sérsic index. For example, Caon et al. (1993a) noted a typical error of corresponding to a variation in the (observed - fitted) residual, while some studies (e.g. Graham & Driver, 2007a; Savorgnan et al., 2013) adopted a constant uncertainty of , and others employed Monte Carlo simulations (e.g. Beifiori et al. (2012) obtaining up to a error-bar). Others varied the sky subtraction by to estimate error-bars (Vika et al., 2012), some used mean/median errors based on a broader comparison with published parameters from other studies (Graham & Worley, 2008; Laurikainen et al., 2010) producing up to uncertainty, whereas Savorgnan (2016) used , , and uncertainties, respectively, for their grade 1, grade 2, and grade 3 galaxies following Savorgnan & Graham (2016, their Section 4.2). As Savorgnan & Graham (2016) noted, their generous uncertainties arose when comparing published parameters based upon an array of differing decompositions for the same galaxy. For example, sometimes a single Sérsic component had been fit while other times the image analysis additionally included, as separate components, a disk and sometimes also a bar.
Given that our sky-background intensities are measured carefully (Sahu et al., 2019a, see their Figure 1 and Section 2.2 ), and that our parameters are obtained from multi-component decompositions, we have ruled out our two major sources of systematic errors (i.e. over/under-estimation of the sky and failing to account for a biasing component), and as such we adopt a 20% uncertainty for n, and a 30% uncertainty for based on the scatter in for our galaxy sample as already described in this section. We do, however, test and confirm that our scaling relations are not significantly dependent upon this. Our results are stable (no change in slope or intercept at the uncertainty level) upon using an uncertainty up to 30% in and 40% in . Furthermore, we also performed all the correlations using the major subsample of our total sample for whom the spheroid parameters are derived using images (see Table 3), and the correlations are found to be consistent with the correlations obtained using the total sample within the uncertainty bounds of the slopes and intercepts.
During our linear regressions, we have excluded certain potentially biasing galaxies, which are either stripped galaxies (NGC 4342 and NGC 4486B), a single galaxy with (NGC 404), or more than outliers (NGC 1300, NGC 3377, NGC 3998, NGC 4945, NGC 5419) in any of the correlations presented here. NGC 4342 and NGC 4486B are stripped of their stellar mass due to the gravitational pull of their massive companion galaxies NGC 4365 (Blom et al., 2014) and NGC 4486 (Batcheldor et al., 2010), respectively. Hence, NGC 4342 and NGC 4486B can bias the black hole scaling relations as they have smaller or than they would have had if they weren’t stripped of their mass. NGC 404, the only galaxy in our sample with a BH mass below , can bias the best-fit lines due to its location at the end of the distribution and thus its elevated torque strength. The galaxies NGC 3377, NGC 3998, NGC 4945, and NGC 5419 in the – diagram, and NGC 1300 in the – diagram, are more than outliers from the corresponding best-fit lines and slightly alter their slopes999Including these galaxies in the regressions changes the slopes by uncertainty level of current slopes.. Hence, these galaxies are better excluded in all our regressions to obtain robust correlations. These eight excluded galaxies are indicated in all the plots. This exclusion leaves us with a reduced sample of 115 galaxies.
3 Scaling relations
The stellar masses of our galactic spheroids () are derived from the luminosities measured using the Sérsic model (for the bulge) fit to the equivalent- (or geometric-mean) axis light profile, parameterized by , , and . Therefore, it is expected to find some correlation between and the Sérsic index, and also between and the effective half-light radius. The issue of parameter coupling potentially explaining the trends between the Sérsic parameters and the luminosity was explored and dismissed using model-independent measures of both luminosity and size (Caon et al., 1993b; Trujillo et al., 2001), implying the observed correlation between luminosity versus Sérsic properties (n and ) are indeed real. Moreover, the errors in n and adopted here are not big enough for parameter coupling in the fitting process to explain the observed trends.
3.1 The diagram
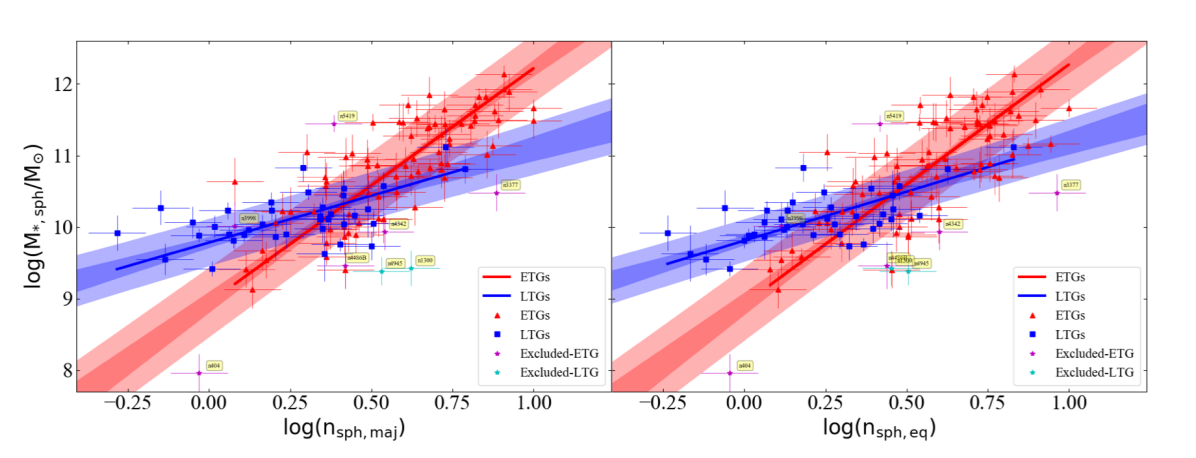
We find two different relations in the – diagram (Figure 2) for the two morphological classes: ETGs and LTGs. Note that the (galaxy absolute magnitude, )– relation for ETGs in Young & Currie (1994), Graham et al. (1996), Jerjen et al. (2000), Graham & Guzmán (2003), and Ferrarese et al. (2006) pertains to the whole galaxy, not the spheroidal component of the ETG (unless it is an elliptical galaxy). The – relation in Andredakis et al. (1995), Graham (2001), Khosroshahi et al. (2000), and Möllenhoff & Heidt (2001) pertains to the spheroid component of predominantly spiral galaxies.
The – relation that we derived for ETGs can be expressed as
{IEEEeqnarray}rCl
log(M_*,sph/M_⊙) &= (3.27±0.25)log(n_sph,maj/3 )
+ (10.50±0.06),
with a total root mean square (rms) scatter of dex in the -direction. The intrinsic scatter and correlation coefficients for Equation 2 and all other relations presented in this paper are provided in Tables 1 and 2.
As mentioned in Section 2, we used the BCES bisector regression that treats the ordinate and abscissa symmetrically. Additionally,
using the bisector line from the MPFITEXY regressions, we obtain the slope and intercept, which is closely consistent with the above relation obtained using the BCES regression.
It should be noted that equation 2 is for spheroids, and is thus different from the (Galaxy mass, )–(galaxy Sérsic index) relation for ETG sample containing disk galaxies.
The bulges of LTGs follow a shallower relation which can be expressed as
{IEEEeqnarray}rCl
log(M_*,sph/M_⊙) &= (1.31±0.22)log(n_sph,maj/3 )
+ (10.41±0.07),
with dex.
The correlation of with the equivalent axis Sérsic indices () for ETGs and LTGs are consistent with the above Equations 2 and 2, respectively, and are provided in Table 2.
Equation 2 is also consistent with the relation obtained from the bisector MPFITEXY regression which provided the slope and intercept for LTGs. Similarly, for other correlations established in this paper, we have checked the best-fit lines using the MPFITEXY regression and these correlations with equivalent-axis bulge parameters are provided in the appendix Table 4.
Our – relations for ETGs and LTGs support the dual sequences seen in the spheroid luminosity (absolute magnitude)–(Sérsic index) diagram for ETGs and LTGs by Savorgnan (2016, and references therein), which was based on a sub-sample of our current sample. Importantly, our greater sample size has enabled a reduced uncertainty on the slope and intercept of the relations.
We also searched for substructures based on the other morphological information (core-Sérsic vs Sérsic galaxies, galaxies with a stellar disk versus galaxies without a stellar disk, and barred vs non-barred galaxies) and found no statistically significant division, except for a small difference between the best-fit lines for barred and non-barred galaxies (because the majority of our barred galaxies are LTGs)
Each of these relations implies that galaxies with greater spheroid stellar masses have higher spheroid Sérsic indices (Andredakis et al., 1995, their figure 5), i.e., a higher central stellar light concentration. Moreover, the – relations with different slopes for the two morphological types (ETGs and LTGs) imply two different progressions of spheroid mass with the central light concentration. This might be reflecting two different ways the stellar mass evolves in the bulges of ETGs and LTGs. Hence, these distinct relations should be helpful for simulations and semi-analytic models studying the formation and evolution of galaxies with different morphology. We refrain from attempting a classical bulge versus pseudo-bulge classification. However, we note that no extra component for the (peanut shell)-shaped structure associated with a buckled bar (Combes et al., 1990; Athanassoula et al., 2015) is included in the galaxy decomposition because such features are effectively encapsulated by the B6 Fourier harmonic term (Ciambur, 2016; Ciambur & Graham, 2016; Ciambur et al., 2020) and the bar component of the decomposition. Inner discs are modelled as such.
3.2 The diagram
Obtaining the Sérsic index of a galactic spheroid is in some ways more straightforward than measuring its mass, or stellar velocity dispersion. This is because the Sérsic index can be obtained from the decomposition of the galaxy light even if the image is not photometrically calibrated. Whereas, measuring the spheroid stellar mass requires decomposition of a flux-calibrated image, which further requires the distance to the galaxy and an appropriate stellar mass-to-light ratio. Similarly, the stellar velocity dispersion measurement requires reducing and analyzing telescope-time-expensive spectra of the central stars of the galaxy.
The correlation between black hole mass and Sérsic index will, obviously, be beneficial for estimating the black hole mass of a galaxy using the Sérsic index of its spheroid (should it have one). Graham et al. (2003a) were the first to establish a log-linear – relation using a sample of 22 galaxies, which yielded . It had a comparable rms scatter of =0.33 dex with the contemporary – relation (=0.31 dex) of the day. Graham & Driver (2007a) subsequently advocated the log-quadratic relation , based on a sample of 27 galaxies. This resulted in a notably smaller intrinsic scatter (of just 0.18 dex) than that (0.31 dex) about their updated log-linear relation . In their log-quadratic – relation, galaxies with smaller Sérsic indices resided on the steeper part of the curve, and galaxies with higher Sérsic indices defined a shallower part of the curve. This might have been an indication of two different relations for low- and high- galaxies that they were not able to see because of a small sample.
In consultation with the published literature, Savorgnan et al. (2013) doubled the sample size and derived the – relations for Sérsic and core-Sérsic galaxies, however, the slopes of the two sub-samples were consistent within their uncertainty bound. Savorgnan (2016) subsequently used their own measurement of spheroid Sérsic index based on multi-component decompositions, to establish a single log-linear relation, which was steeper than the relation reported by Graham & Driver (2007a). This is not surprising, as the slope from a single regression will vary arbitrarily according to the number of low- and high-n spheroids in one’s sample. This difference in the – relation was also because Graham & Driver (2007a) used the forward (Y over X) FITEXY regression routine from Tremaine et al. (2002), which minimized the scatter in the quantity to be predicted, i.e., , yielding a shallower slope for their – relation. Though Graham & Driver (2007a) did not calculate the bisector/symmetric-fit relation using the FITEXY routine, the BCES bisector regression over their dataset yielded a slope of consistent with Savorgnan (2016)’s relation within the uncertainty bound. Savorgnan (2016) additionally explored the possibility of two different – relations for ETGs and LTGs, however, due to just 17 LTGs in her sample, she could not find a statistically reliable best-fit line for the LTGs.
Here, we reinvestigate the – relation, roughly doubling the sample size of 64 from Savorgnan (2016). Upon combining the latest – relations for ETGs and LTGs from Sahu et al. (2019a) and Davis et al. (2019) with our – relations defined by ETGs and LTGs (Equations 2 and 2), we expect and for ETGs and LTGs, respectively.
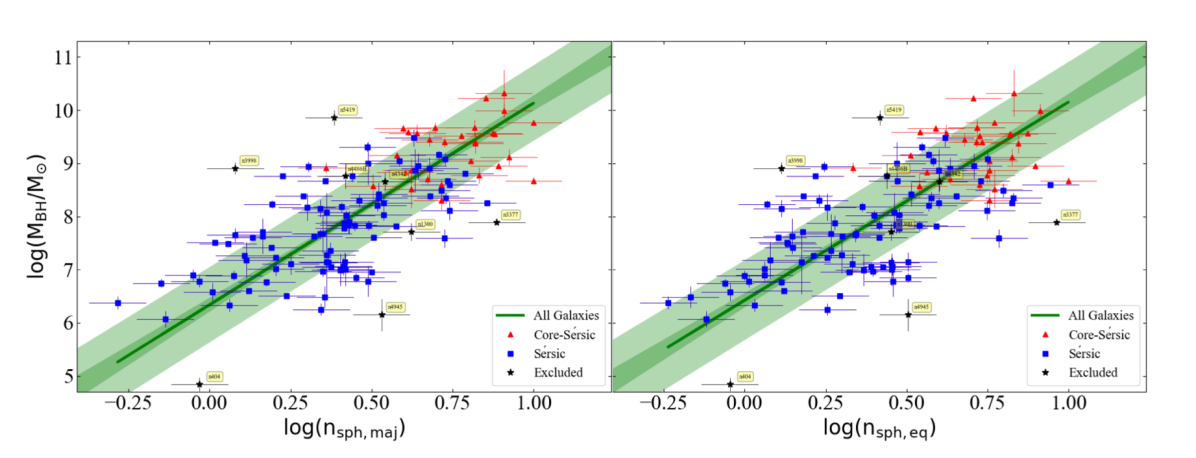
We started by performing a single symmetric regression between and for ETGs and LTGs combined (see Figure 3), which gives
{IEEEeqnarray}rCl
log(M_BH/M_⊙) &= (3.79±0.23)log(n_sph,maj/3 )
+ (8.15±0.06),
between and with a total rms scatter of dex. Similarly, we obtained the single-regression relation between and , presented in Table 2, which is closely consistent with the above – relation.
Notably, this single-regression – relation is consistent with the Savorgnan (2016) relation within her larger error bound of the slope and intercept. The asymmetric BCES() regression for our total sample yields –, which is still consistent with the relation observed in Graham & Driver (2007a), again, within the uncertainty limit of slopes. The intercept, however, has changed. This may partly be due to our use of majorly data while Graham & Driver (2007a) used R-band data101010Many studies (e.g., Kelvin et al., 2012; Häußler et al., 2013; Kennedy et al., 2016) have quantified the dependence of galaxy Sérsic index on the wavelength band of image used..
We further performed separate regressions for the ETGs and LTGs.
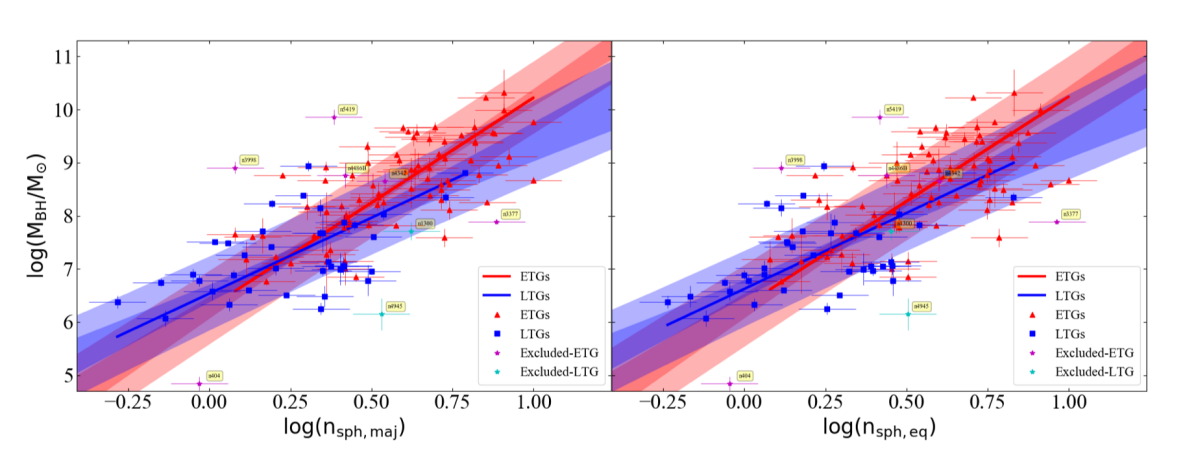
The symmetric – relation defined by ETGs can be expressed as
{IEEEeqnarray}rCl
log(M_BH/M_⊙) &= (3.95±0.34)log(n_sph,maj/3 )
+ (8.15±0.08),
with dex. The LTGs defined the shallower relation
{IEEEeqnarray}rCl
log(M_BH/M_⊙) &= (2.85±0.31)log(n_sph,maj/3 )
+ (7.90±0.14),
with dex. The – and – relations obtained for ETGs versus LTGs are shown in the left- and right- hand panels of Figure 4, respectively. The – relations for ETGs and LTGs are consistent with the above – relations and are presented in Table 2.
Importantly, the two relations for ETGs and LTGs in the – (and also in –) diagram are consistent with the expected relations obtained after combining the – and – relations (as mentioned before) for ETGs and LTGs within the uncertainty bound.
We also performed multiple double regressions by dividing our sample into Sérsic versus core-Sérsic galaxies, galaxies with a disk (ES-, S0-, Sp-Types) versus galaxies without a disk (E-Type), and barred versus non-barred galaxies. In the former two cases, we did not find statistically different relations. Whereas, we see two slightly different – lines for barred and non-barred galaxies because most of our LTGs are barred while most of our ETGs are non-barred. Moreover, the difference between the two relations followed by ETGs and LTGs is more prominent and consistent with the expected relations; hence, we conclude that the substructure in the – diagram is due to ETG versus LTG categorization. Notably higher scatters around the – relations depicted in Figure 4 obstruct the visibility of distinct relations for ETGs and LTGs, even though our statistical analysis suggests different relations. We reckon that, in future, a bigger data set will enable visibly distinct – relations defined by ETGs and LTGs. For a comparison with the barred versus non-barred case, we also provide the – (and –) relations obtained for the barred and non-barred galaxies along with the relations for ETGs and LTGs in Tables 1 and 2.
3.2.1 The – diagram
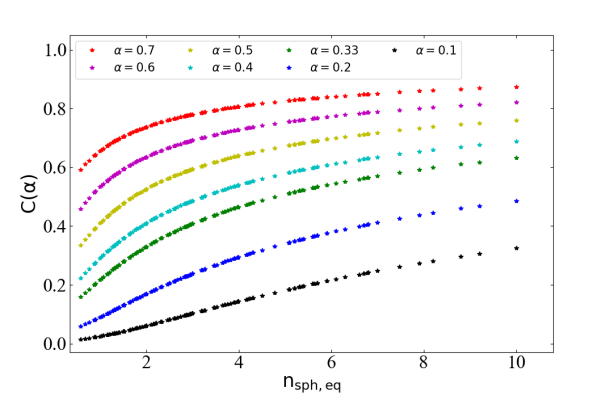
We also analyzed the relation between black hole mass and the light concentration of spheroids. Trujillo et al. (2001) quantified a central concentration index, for the light profile captured by a Sérsic function, as “a flux ratio” which can be expressed as . Where, is equal to , and . For a particular , a higher value of represents a spheroid or an elliptical galaxy with a greater central light or mass concentration.
To calculate the concentration index for our spheroids, we use the equivalent axis Sérsic index and the exact value of obtained using the equation . In Figure 5, we have plotted for our spheroids, for a range of values, against their equivalent axis Sérsic indices, revealing how both quantities are related monotonically, as already seen in Trujillo et al. (2001).
Graham et al. (2001a) explored a range of values of and found that produces a minimum scatter in the vertical direction in the – diagram. Moreover, for the range of concentration index values is so small that it becomes indistinguishable for different profile shapes (i.e., n), which is evident in our Figure 5, while low values of are not so practical, especially for high redshift galaxies, as they require high spatial resolution Graham et al. (2001b). Therefore, in our investigation of the – relation, we use at for our spheroids. The uncertainty in is calculated via error propagation based on a uncertainty in the Sérsic index.
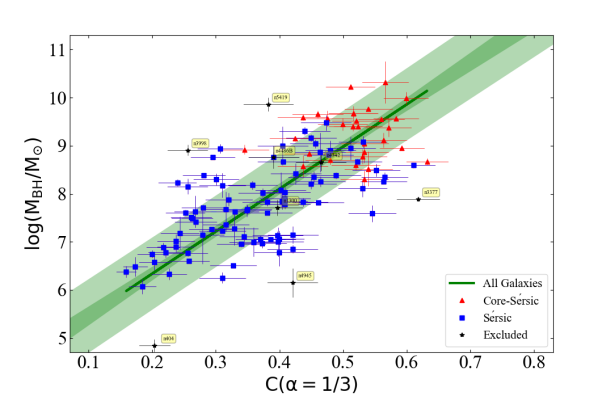
The correlation we obtained upon performing a symmetric regression between and for the total (ETGs+LTGs) sample can be expressed as,
{IEEEeqnarray}rCl
log(M_BH/M_⊙) &= (8.81±0.53)log[C(1/3) /0.4 ]
+ (8.10±0.07).
with dex in -direction. This is represented in Figure 6. This relation is steeper than the relation reported by Graham et al. (2001a) which was based on a set of only 21 galaxies.
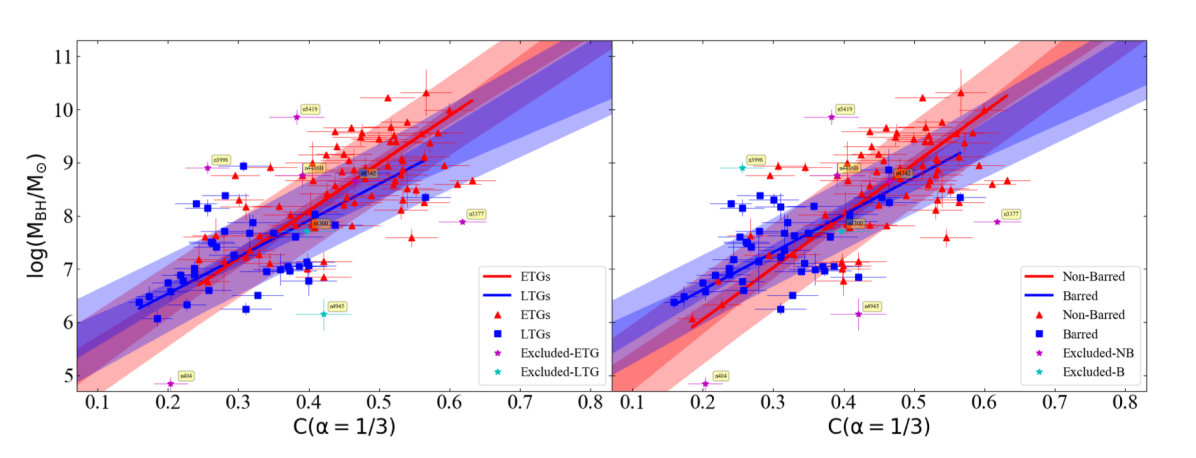
Here, again, we looked for substructures due to Sérsic versus core-Sérsic galaxies, galaxies with a disk versus galaxies without a disk, barred versus non-barred galaxies, and ETGs versus LTGs. We find two slightly different relations only for the latter two cases, similar to the – diagram, which is represented in Figure 7. Again, the substructure in the – diagram due to barred and non-barred galaxies is likely due to most of the LTGs being barred, while the dominant substructuring is due to the ETG and LTG morphology. The parameters of the – relations defined by ETGs and LTGs are provided in Table 2. The best-fit lines obtained for the barred and non-barred galaxies are also provided in Table 2 for comparison.
3.3 The diagram
There is a long history of studies which have worked on the galaxy size–luminosity (–) relation for ETGs and found it to be curved (see Graham, 2019b, for a review). Here we explore the – diagram for the spheroids of ETGs and LTGs in our sample, for whom values were obtained from a careful image analysis.
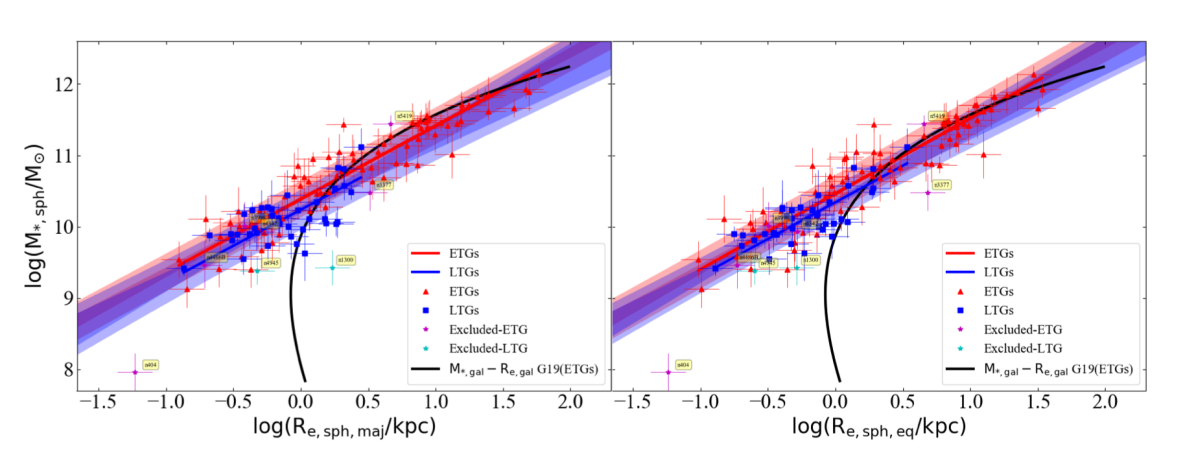
Upon performing two different regressions for our ETGs and LTGs, we find a tight correlation between and (see Figure 8) for both cases with remarkably smaller scatter ( 0.26 dex) in the -direction than the – relations111111The rms scatters in the horizontal direction for Equations 2, 2, and 8 are 0.14 dex, 0.24 dex, and 0.25 dex, respectively. (Equations 2 and 2 with 0.46 and 0.32 dex). The left- and right-hand panels in Figure 8 show the major-axis and equivalent-axis effective half-light radii ( and ), respectively, on the horizontal-axes. The parameters for the – relations for both ETGs and LTGs are provided in Tables 1 (major-axis) and 2 (equivalent-axis).
The best-fit – lines for both ETGs and LTGs are log-linear and very close, such that their scatter region (shaded red and blue area in Figure 8) almost overlap with each other.
Therefore, we further perform a single symmetric regression for our total (ETG+LTG) sample, obtaining
{IEEEeqnarray}rCl
log(M_*,sph/M_⊙) &= (1.08±0.04)log(R_e,sph, maj/kpc )
+ (10.32±0.03),
with dex. This single-regression is represented in Figure 9, where the left-hand and right-hand panels show the – and – relations, respectively.
The parameters for the single-regression – relation can be found in Table 2, which has consistent slope with the above – relation.
Our total (ETG+LTG) sample also includes some alleged pseudo-bulges, marked in Table-1 of Sahu et al. (2019b) along with their source of identification, suggesting that the above single log-linear – relation applies for both alleged pseudo-bulges and the normal/classical bulges.
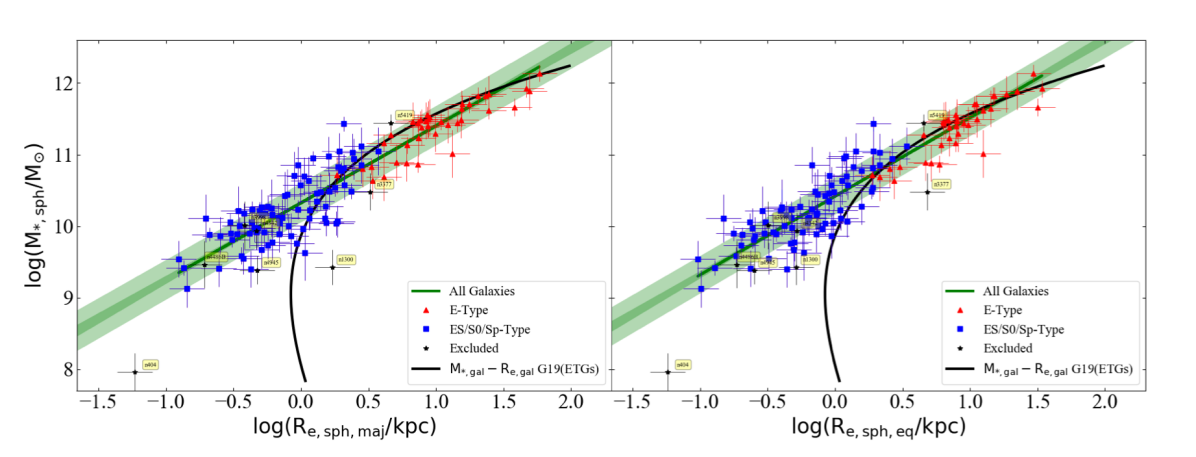
For a comparison, we have plotted the – curve for ETGs from Graham (2019b, their Figure 18) in our Figures 8 and 9. The shallower part of this curve, at the high mass (and size) end, seems to match well with our near-linear – relation for bulges, however, the of our spheroids becomes smaller than their at (or ) due to the presence of disks enabling bigger for their ETGs121212This is also partly intuitive because, for a given stellar density, a 2D disk (or a galaxy with a dominant disk) having the same total stellar mass as a 3D spheroidal distribution of stars will extend to a larger radii.. We do not obtain a curved – relation, possibly, because our sample does not include many dwarf/low-mass ETGs or late-type spiral (Sc-, Sd-types) galaxies.
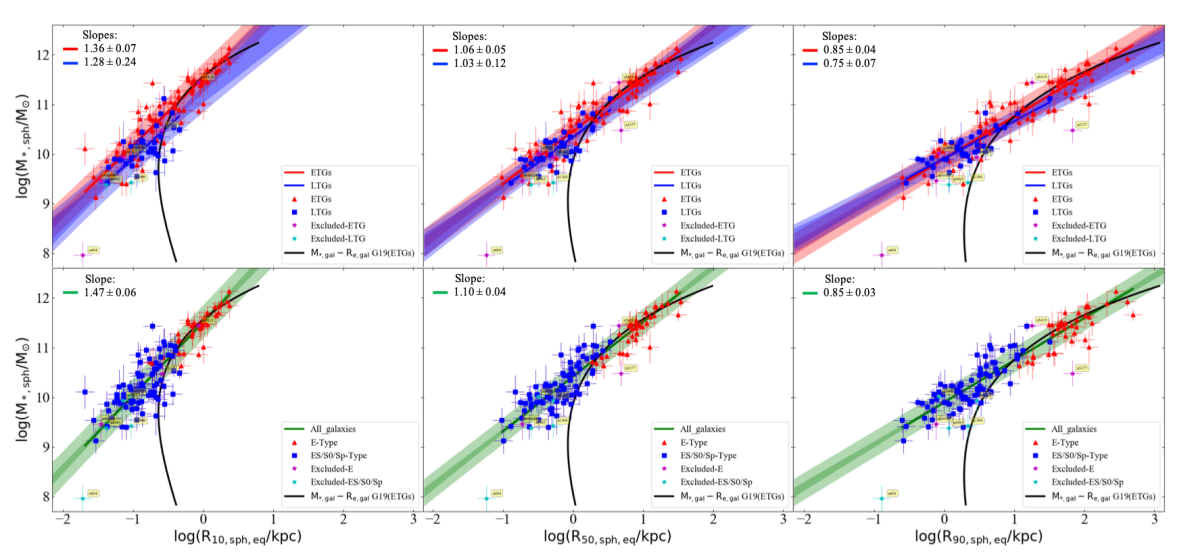
The bend-point of the curved – relation for ETGs has been of past interest, because many studies have claimed that this bend-point is the point of distinction between dwarf elliptical (dE) and classical spheroids or (normal) elliptical galaxies (Sérsic, 1968b; Kormendy et al., 2009; Fisher & Drory, 2010, 2016). Different physical formation processes have been invoked for these alleged disjoint classes of galaxies (e.g., Tolstoy et al., 2009; Kormendy & Bender, 2012; Somerville & Davé, 2015). Providing a detailed investigation of this curved relation, Graham (2019b, their figure 4) present a (galaxy luminosity)– diagram, where represents the radius of the projected galaxy image enclosing z% of the total light, for z varying from 2% to 97%, including for which z=50%. Graham (2019b) find that all the – relations are curved but the location (the absolute magnitude) of the bend-point of each curve changes with z, revealing that the bend-point in the – relation has been used to artificially divide galaxies at a random magnitude based on the random percentage of light used to measure galaxy sizes.
Following Graham (2019b), using their Equation 22, we also calculated the radii containing and of the spheroid’s light, i.e., and , respectively. Figure 10 demonstrates how the spheroid stellar mass correlates with the equivalent axis radii , (or ), and , in the left, middle, and right panels, respectively. In all three cases, we find that ETGs and LTGs follow consistent relations suggesting a single – relation in each panel, however, the slope (and intercepts) of the relations change gradually with z. For comparison, we also show the – curves from Graham (2019b), which seem to agree well with the elliptical galaxies at the high mass end of our – relations. Whereas for galaxies with a disk (i.e., ES-, S0-, Sp-types), the radius containing of the spheroid’s light () is smaller than the radius containing of whole galaxy’s light (). The parameters for the – and – relations are also provided in Table 2. Though for the range of our data-set we observe a (log)-linear relation between and , addition of galaxies at the low-mass and small size end might reveal a curved – relation similar to the – curve for ETGs.
3.4 The – diagram
Combining the – relations defined by ETGs and LTGs, from Sahu et al. (2019a) and Davis et al. (2019), with the single-regression – relation (Equation 8) followed by our combined sample of ETGs and LTGs, we expect and for ETGs and LTGs, respectively.
We first used a single regression for the total (ETG+LTG) sample, which yielded a good relation, provided in Tables 1 and 2 for the major- and equivalent-axis , respectively, but with a higher scatter than the soon to be revealed separate relations for ETGs and LTGs. Moreover, it is inconsistent with the above prediction of the two relations in the – diagram.
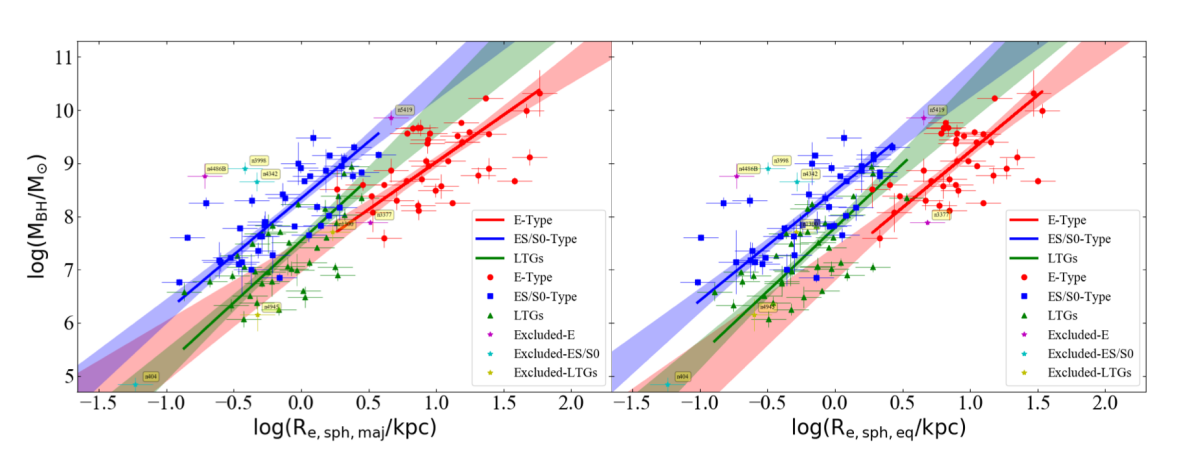
Upon performing separate regressions for ETGs and LTGs in the – diagram, we do find two different relations for the two morphological classes. These relations are presented in Figure 11 with the left-hand and right-hand panels displaying and , respectively.
The relation defined by all ETGs can be expressed as,
{IEEEeqnarray}rCl
log(M_BH/M_⊙) &= (1.26±0.08)log(R_e,sph, maj/kpc )
+ (8.00±0.07),
with dex, while LTGs define the relation
{IEEEeqnarray}rCl
log(M_BH/M_⊙) &= (2.33±0.31)log(R_e,sph, maj/kpc )
+ (7.54±0.10),
with dex. The slope of the – relations for ETGs and LTGs are consistent with the corresponding – relations, and their fit parameters are provided in Table 2. These two relations (Equations 3.4 & 3.4) for ETGs and LTGs are in agreement with the expected – relations mentioned at the beginning of this sub-section.
Additionally, we note that our – relation for ETGs is also consistent with the relation obtained by de Nicola et al. (2019), based on an ETG-dominated sample.
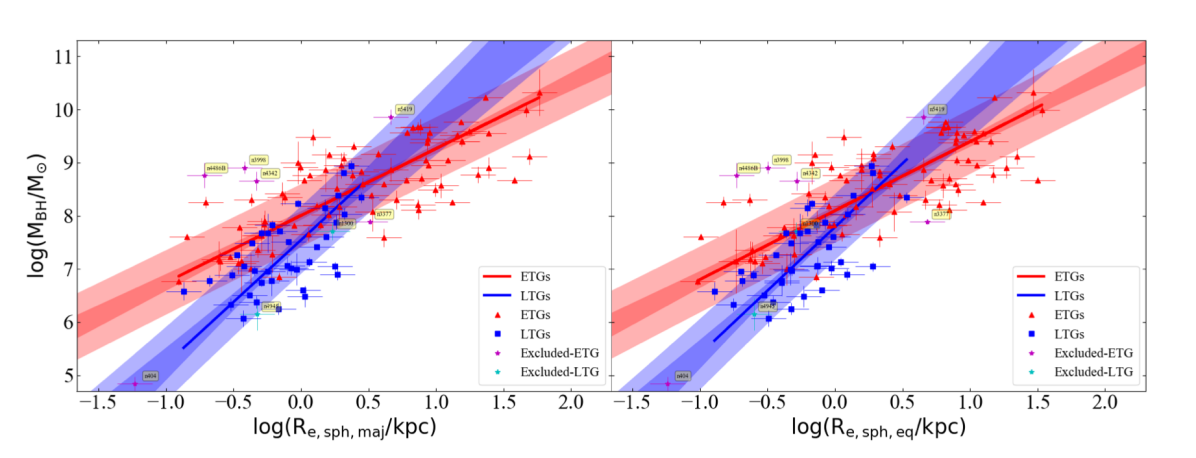
Each of our non-linear, but log-linear, – relations reveal that galaxies with more massive black holes tend to have a larger (bulge) half-light radii. However, the two different slopes of the – relations for ETGs and LTGs suggest that the process of evolution between black hole mass and spheroid size (), which further relates to the spheroid stellar mass, tends to be different for these different morphological types. This also supports our morphology-dependent –, and – relations (Davis et al., 2018; Sahu et al., 2019a), where ETGs and LTGs are found to follow two different relations. The total rms scatter about the – relation is smaller than the total rms scatter about the – relation for LTGs (cf. = 0.64 dex), whereas, for ETGs it is a bit higher about the – relation (cf. = 0.52 dex about the – relation).
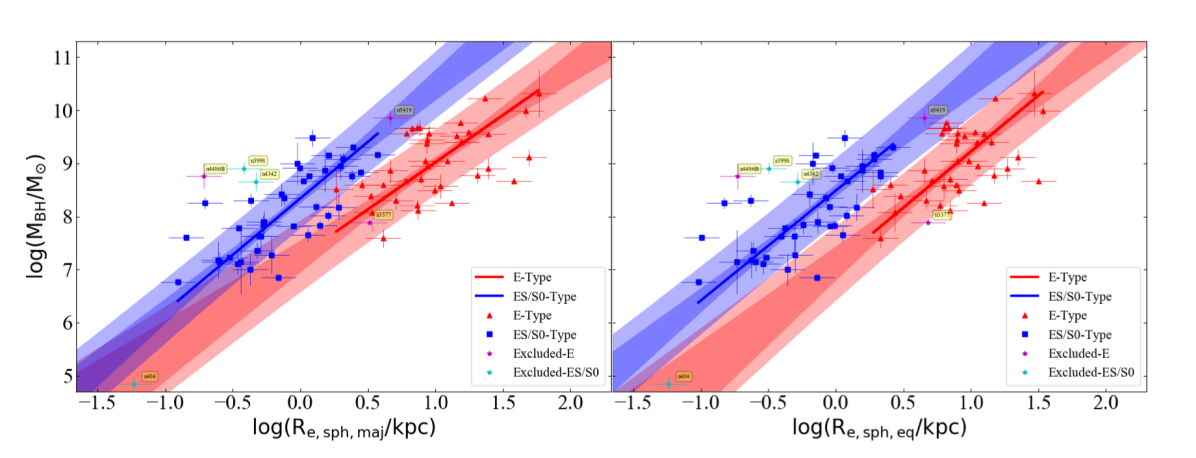
We did not find significantly different relations upon dividing our total sample into Sérsic versus core-Sérsic galaxies, or barred versus non-barred galaxies, in the – diagram. However, when we perform separate regressions for ETGs with a stellar disk (ES-, and S0-types) and ETGs without a stellar disk (E-type), we find two almost parallel relations which are offset by in the -direction (see Figure 12).
ETGs with a disk follow the relation
{IEEEeqnarray}rCl
log(M_BH/M_⊙) &= (2.13±0.22)log(R_e,sph, maj/kpc )
+ (8.34±0.09),
with dex, and ETGs without a disk define
{IEEEeqnarray}rCl
log(M_BH/M_⊙) &= (1.78±0.24)log(R_e,sph, maj/kpc )
+ (7.24±0.25),
with dex.
The – relations for ETGs with disk and ETGs without a disk, which are consistent with above Equations 13 and 13, respectively, are provided in Table 2.
The two relations defined by ETGs with and without a disk are steeper than the single-regression – relation for ETGs (Equation 3.4); however, the vertical scatter is comparable. The – relation for the LTGs (Equation 3.4) is slightly steeper, but still its slope is consistent with the slope of the relations for ETGs with and without a disk at the level; however the intercepts are different. The final substructures in the – diagram, i.e., the relations followed by ETGs with a disk, ETGs without a disk, and LTGs, are presented together in Figure 13.
In passing, we note that the – relation that we obtained for ETGs without a disk (elliptical galaxies) —most of which are core-Sérsic galaxies—is also consistent with the relation obtained by combining the –(break radius or depleted core radius, ) and – relations observed for cored galaxies in Dullo & Graham (2014).
This offset between ETGs with and without a disk in the – diagram is analogous to the offset found between the parallel relations for ETGs with and without a disk in the – diagram (Sahu et al., 2019a, their figure 8). Also, on combining the – relations defined by ETGs with and without a disk (Sahu et al., 2019a, their Equations 12 and 13), with our – relation (Equation 8), we obtain and ( and , for ), which are consistent with the observed relations for ETGs with a disk and ETGs without a disk, respectively (Equation 13 & 13, see Table 2 for parameters).
Importantly, as mentioned in Sahu et al. (2019a), this order of magnitude offset has little to do with the black hole masses of these two categories. Qualitatively, this offset can be understood by the different sizes of the spheroid effective half-light radius corresponding to ETGs with a disk (ES and S0) and ETGs without a disk (E). The ellicular (ES) and lenticular (S0) galaxies, which have intermediate/large-scale stellar disks in addition to their spheroids, have a smaller relative to the elliptical galaxies which are comprised (almost) entirely of spheroids. This difference in between the two sub-populations of ETGs creates the offset between the – relations defined by them, and because of the non-zero slope of the – relations, we see an offset in the vertical direction.
The relation (e.g. Equation 8 in Graham, 2019b), where (M/L) represents the stellar mass-to-light ratio and is the averaged intensity within , suggests that , for a constant mass-to-light ratio. This can help us quantitatively understand the origin of the offset (of dex) found in the – diagram (Sahu et al., 2019a, their section 4.2) between ETGs with and without a stellar disk. We find a vertical offset of dex between the two sub-samples of ETGs in the – diagram. Whereas, we do not find separate statistically significant – relations for these two populations, implying a single – for ETGs with and with out a disk. This suggests that the offset observed in the – diagram by Sahu et al. (2019a) originates mainly from the offset in the – diagram.
Furthermore, in the plot of versus the effective radius of the whole galaxy (), this offset is expected to disappear, such that all the ETGs will follow a single – relation, analogous to the combined behaviour of ETGs with and without a disk in the – diagram (Sahu et al., 2019a, see the right-hand panel of their Figure 8), where the two sub-populations of ETGs follow consistent – relations.
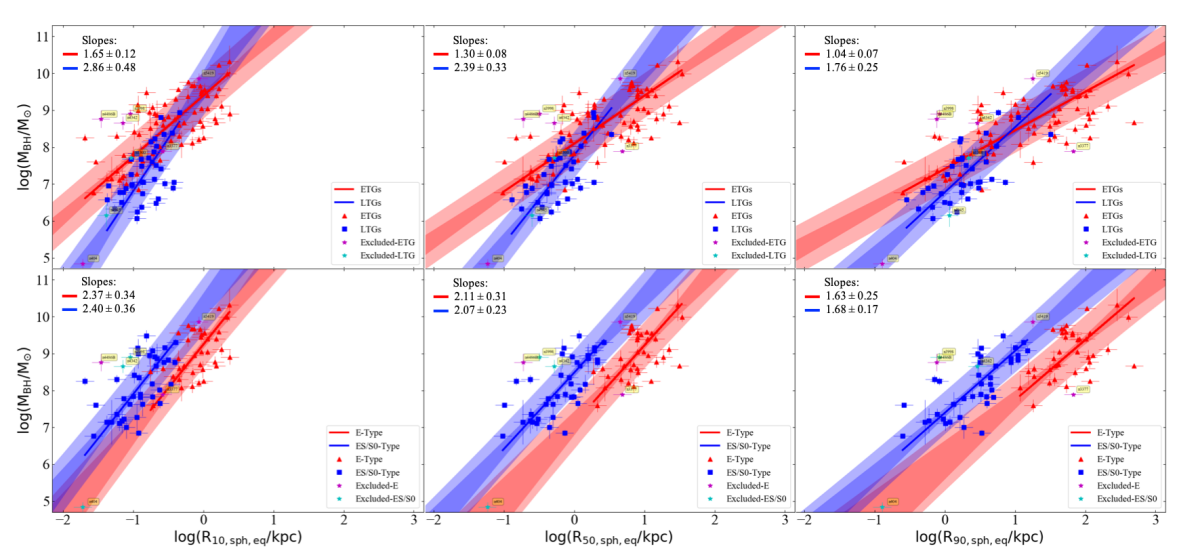
Similar to the previous subsection, here also we investigate the correlations of black hole mass with radii containing and of the spheroid’s total light, in addition to the () radius discussed above. Figure 14 presents the correlations we observed between black hole mass and , (or ), and , respectively in the left, middle, and right panels. The top panels show that ETGs and LTGs define two different – relations irrespective of z, however, the slopes of the relations become shallower with increasing z. The bottom panels reveal that the offset between the – relations followed by ETGs with a disk and ETGs without a disk are found in all cases; however, as expected, the amount of the offset varies with z and also the slopes of these relations become shallower with increasing z. The parameters for the – relations obtained for and are also presented in Table 2.
| Category | Number | ||||||||
|---|---|---|---|---|---|---|---|---|---|
| dex | dex | dex | dex | dex | |||||
| (1) | (2) | (3) | (4) | (5) | (6) | (7) | (8) | (9) | (10) |
| ETGs | 77 | 0.27 | 0.46 | 0.79 | -17.14 | 0.80 | -17.32 | ||
| LTGs | 38 | 0.23 | 0.32 | 0.54 | -3.28 | 0.41 | -2.01 | ||
| All Galaxies | 115 | 0.60 | 0.69 | 0.77 | -22.85 | 0.76 | -22.36 | ||
| ETGs | 77 | 0.54 | 0.65 | 0.71 | -12.46 | 0.69 | -11.42 | ||
| LTGs | 38 | 0.62 | 0.67 | 0.53 | -3.20 | 0.45 | -2.36 | ||
| Non-Barred | 71 | 0.61 | 0.70 | 0.72 | -11.80 | 0.64 | -8.61 | ||
| Barred | 44 | 0.55 | 0.61 | 0.54 | -3.76 | 0.47 | -2.95 | ||
| All Galaxies | 115 | 0.13 | 0.27 | 0.92 | -47.92 | 0.90 | -42.83 | ||
| ETGs | 77 | 0.09 | 0.25 | 0.93 | -34.73 | 0.94 | -36.98 | ||
| LTGs | 38 | 0.16 | 0.27 | 0.66 | -5.26 | 0.58 | -3.84 | ||
| ETGs with a disk | 39 | 0.47 | 0.55 | 0.74 | -7.21 | 0.76 | -7.81 | ||
| ETGs without a disk | 38 | 0.55 | 0.60 | 0.55 | -3.45 | 0.52 | -3.13 | ||
| ETGs (All) | 77 | 0.54 | 0.58 | 0.76 | -15.10 | 0.74 | -13.95 | ||
| LTGs | 38 | 0.54 | 0.62 | 0.63 | -4.66 | 0.62 | -4.43 | ||
| All Galaxies | 115 | 0.63 | 0.67 | 0.78 | -23.56 | 0.78 | -24.26 | ||
Note. — Columns: (1) Subclass of galaxies. (2) Number of galaxies in a subclass. (3) Slope of the line obtained from the BCES(Bisector) regression. (4) Intercept of the line obtained from the BCES(Bisector) regression. (5) Intrinsic scatter in the vertical ( or )-direction (see Equation 1 from Graham & Driver, 2007a). (6) Total root mean square (rms) scatter in the vertical direction. (7) Pearson correlation coefficient. (8) Pearson correlation probability value. (9) Spearman rank-order correlation coefficient. (10) Spearman rank-order correlation probability value.
| Category | Number | ||||||||
|---|---|---|---|---|---|---|---|---|---|
| dex | dex | dex | dex | dex | |||||
| (1) | (2) | (3) | (4) | (5) | (6) | (7) | (8) | (9) | (10) |
| ETGs | 77 | 0.32 | 0.49 | 0.77 | -15.63 | 0.74 | -13.86 | ||
| LTGs | 38 | 0.20 | 0.28 | 0.63 | -4.61 | 0.55 | -3.39 | ||
| All Galaxies | 115 | 0.65 | 0.73 | 0.74 | -20.14 | 0.74 | -20.22 | ||
| ETGs | 77 | 0.63 | 0.73 | 0.64 | -9.37 | 0.60 | -8.13 | ||
| LTGs | 38 | 0.64 | 0.68 | 0.49 | -2.78 | 0.50 | -2.86 | ||
| Non-Barred | 71 | 0.69 | 0.79 | 0.64 | -8.89 | 0.54 | -5.88 | ||
| Barred | 44 | 0.56 | 0.61 | 0.52 | -3.54 | 0.45 | -2.66 | ||
| All Galaxies | 115 | 0.65 | 0.73 | 0.74 | -20.16 | 0.74 | -20.17 | ||
| ETGs | 77 | 0.63 | 0.72 | 0.64 | -9.45 | 0.60 | -8.13 | ||
| LTGs | 38 | 0.64 | 0.68 | 0.47 | -2.57 | 0.50 | -2.83 | ||
| Non-Barred | 71 | 0.70 | 0.79 | 0.64 | -8.77 | 0.54 | -5.88 | ||
| Barred | 44 | 0.56 | 0.61 | 0.51 | -3.36 | 0.45 | -2.63 | ||
| All Galaxies | 115 | 0.08 | 0.26 | 0.93 | -50.60 | 0.92 | -46.02 | ||
| ETGs | 77 | 0.08 | 0.26 | 0.93 | -33.85 | 0.94 | -35.31 | ||
| LTGs | 38 | 0.00 | 0.22 | 0.78 | -7.98 | 0.67 | -5.39 | ||
| ETGs with a disk | 39 | 0.52 | 0.59 | 0.70 | -6.19 | 0.71 | -6.33 | ||
| ETGs without a disk | 38 | 0.55 | 0.61 | 0.53 | -3.27 | 0.46 | -2.43 | ||
| ETGs | 77 | 0.56 | 0.60 | 0.75 | -14.41 | 0.72 | -12.76 | ||
| LTGs | 38 | 0.52 | 0.60 | 0.66 | -5.13 | 0.66 | -5.21 | ||
| All Galaxies | 115 | 0.62 | 0.67 | 0.78 | -23.81 | 0.78 | -24.29 | ||
| All Galaxies | 115 | 0.17 | 0.33 | 0.88 | -38.55 | 0.86 | -34.27 | ||
| ETGs with a disk | 39 | 0.60 | 0.68 | 0.61 | -4.38 | 0.63 | -4.78 | ||
| ETGs without a disk | 38 | 0.53 | 0.61 | 0.54 | -3.37 | 0.47 | -2.54 | ||
| ETGs | 77 | 0.56 | 0.62 | 0.73 | -13.50 | 0.71 | -12.24 | ||
| LTGs | 38 | 0.60 | 0.69 | 0.54 | -3.30 | 0.50 | -2.83 | ||
| All Galaxies | 115 | 0.12 | 0.26 | 0.93 | -50.53 | 0.92 | -47.05 | ||
| ETGs with a disk | 39 | 0.51 | 0.56 | 0.73 | -6.89 | 0.71 | -6.35 | ||
| ETGs without a disk | 38 | 0.61 | 0.63 | 0.47 | -2.52 | 0.41 | -1.95 | ||
| ETGs | 77 | 0.58 | 0.60 | 0.74 | -14.09 | 0.71 | -12.17 | ||
| LTGs | 38 | 0.54 | 0.58 | 0.67 | -5.30 | 0.68 | -5.50 | ||
Note. — Column names are same as Table 1.
4 Summary
We have used the largest sample of galaxies to date with directly-measured black hole masses, and carefully measured bulge parameters obtained from multi-component decomposition of their galaxy light in our previous studies (Savorgnan & Graham, 2016; Davis et al., 2019; Sahu et al., 2019a). Using this extensive data-set, we have investigated the correlations between black hole mass () and the bulge Sérsic index (), bulge central light concentration index (C), and the bulge effective half-light radius ().
For our sample, we also investigated the correlations between bulge mass () and both the bulge Sérsic index and bulge half-light radius. We then combined these with the latest – relations to predict and check upon the observed correlations of with and .
In all of the relations we investigated, we explored the possibility of substructure due to various subcategories of galaxy morphology, i.e., Sérsic versus core-Sérsic galaxies, galaxies with a stellar disk versus galaxies without a stellar disk, barred versus non-barred galaxies, and ETGs versus LTGs.
Parameters for all the correlations presented in this paper are separately listed in Table 1 and Table 2. The slope of the correlations that we obtained for or with the major-axis bulge parameters ( and ) are consistent with the slope from the corresponding correlations of or with the equivalent-axis bulge parameters ( and ).
Our prime results can be summarized as follows,
-
•
ETGs and LTGs follow two different – relations (see Figure 2), with slopes equal to and , and total rms scatter equal to =0.46 dex and 0.32 dex, respectively (Equations 2 and 2), in the – diagram. As the Sérsic index is a measure of the central concentration of a bulge’s light, these different slopes for the – relation suggest distinct mechanisms for the evolution of spheroid mass and central light (or stellar mass) concentration in ETGs and LTGs.
- •
-
•
In the diagram showing the black hole mass versus the spheroid central concentration index, C(1/3), we again find two (slightly) different relations due to ETGs and LTGs (Figure 7, Table 2), analogous to the – diagram. The slopes for the – relations are and with = 0.72 dex and 0.68 dex, respectively, for ETGs and LTGs.
-
•
We find a tight near-linear relation between and for our range of data (Figures 8 and 9). Both ETGs and LTGs define the log-linear relation (Equation 8) with =0.27 dex. An extended view of the – relation for ETGs is curved (Graham, 2019b), and our – relation, somewhat dominated by massive spheroids, agrees with the quasi-linear part of the curve at high-masses where E-type galaxies dominate.
- •
-
•
In the – diagram, ETGs with a disk (ES, S0) and ETGs without a disk (E) follow two different, almost parallel, relations with slopes (Figure 12), which are steeper than the above single-regression – relation for all ETGs (see Tables 1 and 2 for parameters) and offset by a factor of 10 in the vertical -direction. This is again analogous to the offset observed between the – relations followed by ETGs with and without a disk (Sahu et al., 2019a). Given depends on via , we find that the offset in the – diagram originates from the offset between ETGs with and without a disk in the – diagram. The reason behind the offset is the smaller spheroid half-light radius of ETGs with a disk relative to that of elliptical (purely spheroidal) galaxies.
- •
The – and – relations may be useful for predicting the black hole masses of galaxies using their bulge Sérsic index or bulge half-light radius parameters. These parameters can be obtained by performing a multi-component decomposition of a galaxy light profile obtained even from a photometrically uncalibrated image. One should be careful while using the – relation, because ETGs with a disk (ES,S0), ETGs without a disk (E), and LTGs (spirals) are found to follow different trends (Figures 11 and 12). However, when extended ETG or LTG classification is not known, the single regression – or – relations (provided in Tables 1 and 2) can still be used to predict , albeit with a higher uncertainty.
Our BH scaling relations, based on local galaxies, form a benchmark for studies investigating the evolution of BH correlations with galaxy properties across cosmic time (Lapi et al., 2014; Park et al., 2015; Sexton et al., 2019; Suh et al., 2020). In addition to enabling one to determine the black hole mass function (e.g. McLure & Dunlop, 2004; Shankar et al., 2004; Graham et al., 2007; Vika et al., 2009; Davis et al., 2014; Mutlu-Pakdil et al., 2016), these BH scaling relations with bulge Sérsic parameters can also be employed to infer the lifetime of binary black holes (Biava et al., 2019; Li et al., 2020a) and further constrain the BH merger rate. The creation of merger-built spheroids with (initially) higher central stellar densities — which are associated with higher Sérsic indices — should, through dynamical friction (e.g., Chandrasekhar, 1943; Arca-Sedda & Capuzzo-Dolcetta, 2014), experience a quicker inspiral and hardening phase for their binary black holes. The imprint of such processes are the phase-space loss-cones (Begelman et al., 1980) observed as partially-depleted cores in massive spheroids (King & Minkowski, 1966, 1972; Lauer, 1985; Ferrarese et al., 1994; Trujillo et al., 2004; Dullo & Graham, 2014). The eventual coalescence of the black holes results in the emission of gravitational waves (Poincaré, 1906; Einstein, 1916, 1918; Abbott et al., 2016). Our BH scaling relations will play a key role in constraining the detection of low-frequency gravitational waves generated from BH mergers at high redshifts, which fall in the detection domain of pulsar timing arrays (Shannon et al., 2015; Lentati et al., 2015; Sesana et al., 2016; Arzoumanian et al., 2018) and LISA (Amaro-Seoane et al., 2017; Barack et al., 2019).
The different scaling relations for ETGs and LTGs also hold valuable information for simulations, analytical/semi-analytical, and theoretical models of galaxy formation and evolution (e.g. Volonteri & Ciotti, 2013; Heckman & Best, 2014; Conselice, 2014), as they reveal the trends of BH—host bulge/galaxy properties depending on galaxy morphology. These relations can be used for primary size and structure tests in simulations aiming to generate realistic galaxies with supermassive black holes at their center (e.g. Schaye et al., 2015; Hopkins et al., 2018; Mutlu-Pakdil et al., 2018; Davé et al., 2019; Li et al., 2020b). We plan to test our new constraints through a comparison with simulations in our future work. Using our extensive dataset, we will present the correlation of black hole mass with the internal stellar density of galactic spheroids (N. Sahu et al. 2021, in preparation). We will also explore the (first morphology aware) fundamental plane in our future work.
References
- Abbott et al. (2016) Abbott, B. P., Abbott, R., Abbott, T. D., et al. 2016, Phys. Rev. Lett., 116, 061102, doi: 10.1103/PhysRevLett.116.061102
- Akritas & Bershady (1996) Akritas, M. G., & Bershady, M. A. 1996, ApJ, 470, 706, doi: 10.1086/177901
- Amaro-Seoane et al. (2017) Amaro-Seoane, P., Audley, H., Babak, S., et al. 2017, arXiv e-prints, arXiv:1702.00786. https://arxiv.org/abs/1702.00786
- Andredakis et al. (1995) Andredakis, Y. C., Peletier, R. F., & Balcells, M. 1995, MNRAS, 275, 874, doi: 10.1093/mnras/275.3.874
- Arca-Sedda & Capuzzo-Dolcetta (2014) Arca-Sedda, M., & Capuzzo-Dolcetta, R. 2014, ApJ, 785, 51, doi: 10.1088/0004-637X/785/1/51
- Arzoumanian et al. (2018) Arzoumanian, Z., Baker, P. T., Brazier, A., et al. 2018, ApJ, 859, 47, doi: 10.3847/1538-4357/aabd3b
- Athanassoula et al. (2015) Athanassoula, E., Laurikainen, E., Salo, H., & Bosma, A. 2015, MNRAS, 454, 3843, doi: 10.1093/mnras/stv2231
- Baes et al. (2003) Baes, M., Buyle, P., Hau, G. K. T., & Dejonghe, H. 2003, MNRAS, 341, L44, doi: 10.1046/j.1365-8711.2003.06680.x
- Baker et al. (2019) Baker, J., Barke, S. F., Bender, P. L., et al. 2019, arXiv e-prints, arXiv:1907.11305. https://arxiv.org/abs/1907.11305
- Barack et al. (2019) Barack, L., Cardoso, V., Nissanke, S., et al. 2019, Classical and Quantum Gravity, 36, 143001, doi: 10.1088/1361-6382/ab0587
- Batcheldor et al. (2010) Batcheldor, D., Robinson, A., Axon, D. J., Perlman, E. S., & Merritt, D. 2010, ApJ, 717, L6, doi: 10.1088/2041-8205/717/1/L6
- Begelman (1984) Begelman, M. C. 1984, in IAU Symposium, Vol. 110, VLBI and Compact Radio Sources, ed. R. Fanti, K. I. Kellermann, & G. Setti, 227
- Begelman et al. (1980) Begelman, M. C., Blandford, R. D., & Rees, M. J. 1980, Nature, 287, 307, doi: 10.1038/287307a0
- Beifiori et al. (2012) Beifiori, A., Courteau, S., Corsini, E. M., & Zhu, Y. 2012, MNRAS, 419, 2497, doi: 10.1111/j.1365-2966.2011.19903.x
- Berrier et al. (2013) Berrier, J. C., Davis, B. L., Kennefick, D., et al. 2013, ApJ, 769, 132, doi: 10.1088/0004-637X/769/2/132
- Biava et al. (2019) Biava, N., Colpi, M., Capelo, P. R., et al. 2019, MNRAS, 487, 4985, doi: 10.1093/mnras/stz1614
- Blom et al. (2014) Blom, C., Forbes, D. A., Foster, C., Romanowsky, A. J., & Brodie, J. P. 2014, MNRAS, 439, 2420, doi: 10.1093/mnras/stu095
- Bogdán et al. (2018) Bogdán, Á., Lovisari, L., Volonteri, M., & Dubois, Y. 2018, ApJ, 852, 131, doi: 10.3847/1538-4357/aa9ab5
- Caon et al. (1993a) Caon, N., Capaccioli, M., & D’Onofrio, M. 1993a, MNRAS, 265, 1013, doi: 10.1093/mnras/265.4.1013
- Caon et al. (1993b) —. 1993b, MNRAS, 265, 1013, doi: 10.1093/mnras/265.4.1013
- Capaccioli (1989) Capaccioli, M. 1989, in World of Galaxies (Le Monde des Galaxies), ed. J. Corwin, Harold G. & L. Bottinelli, 208–227
- Casura et al. (2019) Casura, S., Liske, J., Robotham, A. S. G., Taranu, D. S., & Laine, J. 2019, in The Art of Measuring Galaxy Physical Properties, 26, doi: 10.5281/zenodo.3556629
- Chandrasekhar (1943) Chandrasekhar, S. 1943, ApJ, 97, 255, doi: 10.1086/144517
- Chen et al. (2019) Chen, S., Sesana, A., & Conselice, C. J. 2019, MNRAS, 488, 401, doi: 10.1093/mnras/stz1722
- Choi et al. (2018) Choi, E., Somerville, R. S., Ostriker, J. P., Naab, T., & Hirschmann, M. 2018, ApJ, 866, 91, doi: 10.3847/1538-4357/aae076
- Ciambur (2015) Ciambur, B. C. 2015, ApJ, 810, 120, doi: 10.1088/0004-637X/810/2/120
- Ciambur (2016) —. 2016, PASA, 33, e062, doi: 10.1017/pasa.2016.60
- Ciambur et al. (2020) Ciambur, B. C., Fragkoudi, F., Khoperskov, S., Di Matteo, P., & Combes, F. 2020, arXiv e-prints, arXiv:2003.00015. https://arxiv.org/abs/2003.00015
- Ciambur & Graham (2016) Ciambur, B. C., & Graham, A. W. 2016, MNRAS, 459, 1276, doi: 10.1093/mnras/stw759
- Combes et al. (1990) Combes, F., Debbasch, F., Friedli, D., & Pfenniger, D. 1990, A&A, 233, 82
- Conselice (2014) Conselice, C. J. 2014, ARA&A, 52, 291, doi: 10.1146/annurev-astro-081913-040037
- Danzmann (2017) Danzmann, K. 2017, in Society of Photo-Optical Instrumentation Engineers (SPIE) Conference Series, Vol. 10566, Proc. SPIE, 1056610, doi: 10.1117/12.2308272
- Davé et al. (2019) Davé, R., Anglés-Alcázar, D., Narayanan, D., et al. 2019, MNRAS, 486, 2827, doi: 10.1093/mnras/stz937
- Davis et al. (2018) Davis, B. L., Graham, A. W., & Cameron, E. 2018, ApJ, 869, 113, doi: 10.3847/1538-4357/aae820
- Davis et al. (2019) Davis, B. L., Graham, A. W., & Cameron, E. 2019, ApJ, 873, 85, doi: 10.3847/1538-4357/aaf3b8
- Davis et al. (2019) Davis, B. L., Graham, A. W., & Combes, F. 2019, ApJ, 877, 64, doi: 10.3847/1538-4357/ab1aa4
- Davis et al. (2017) Davis, B. L., Graham, A. W., & Seigar, M. S. 2017, MNRAS, 471, 2187, doi: 10.1093/mnras/stx1794
- Davis et al. (2014) Davis, B. L., Berrier, J. C., Johns, L., et al. 2014, ApJ, 789, 124, doi: 10.1088/0004-637X/789/2/124
- de Nicola et al. (2019) de Nicola, S., Marconi, A., & Longo, G. 2019, MNRAS, 2130, doi: 10.1093/mnras/stz2472
- den Brok et al. (2015) den Brok, M., Seth, A. C., Barth, A. J., et al. 2015, ApJ, 809, 101, doi: 10.1088/0004-637X/809/1/101
- Dolag (2015) Dolag, K. 2015, in IAU General Assembly, Vol. 29, 2250156
- Dressler (1989) Dressler, A. 1989, in Active Galactic Nuclei, Vol. 134, 217
- Dullo et al. (2020) Dullo, B. T., Bouquin, A. Y. K., Gil De Paz, A., Knapen, J. H., & Gorgas, J. 2020, arXiv e-prints, arXiv:2006.10128. https://arxiv.org/abs/2006.10128
- Dullo & Graham (2014) Dullo, B. T., & Graham, A. W. 2014, MNRAS, 444, 2700, doi: 10.1093/mnras/stu1590
- Einstein (1916) Einstein, A. 1916, Sitzungsberichte der Königlich Preußischen Akademie der Wissenschaften (Berlin, 688
- Einstein (1918) —. 1918, Sitzungsberichte der Königlich Preußischen Akademie der Wissenschaften (Berlin, 154
- Ferrarese (2002) Ferrarese, L. 2002, ApJ, 578, 90, doi: 10.1086/342308
- Ferrarese & Merritt (2000) Ferrarese, L., & Merritt, D. 2000, ApJ, 539, L9, doi: 10.1086/312838
- Ferrarese et al. (1994) Ferrarese, L., van den Bosch, F. C., Ford, H. C., Jaffe, W., & O’Connell, R. W. 1994, AJ, 108, 1598, doi: 10.1086/117180
- Ferrarese et al. (2006) Ferrarese, L., Côté, P., Jordán, A., et al. 2006, ApJS, 164, 334, doi: 10.1086/501350
- Fisher & Drory (2010) Fisher, D. B., & Drory, N. 2010, ApJ, 716, 942, doi: 10.1088/0004-637X/716/2/942
- Fisher & Drory (2016) Fisher, D. B., & Drory, N. 2016, in Astrophysics and Space Science Library, Vol. 418, Galactic Bulges, ed. E. Laurikainen, R. Peletier, & D. Gadotti, 41, doi: 10.1007/978-3-319-19378-6_3
- Fukugita & Peebles (2004) Fukugita, M., & Peebles, P. J. E. 2004, ApJ, 616, 643, doi: 10.1086/425155
- Gebhardt et al. (2000) Gebhardt, K., Bender, R., Bower, G., et al. 2000, ApJ, 539, L13, doi: 10.1086/312840
- Graham et al. (1996) Graham, A., Lauer, T. R., Colless, M., & Postman, M. 1996, ApJ, 465, 534, doi: 10.1086/177440
- Graham (2001) Graham, A. W. 2001, AJ, 121, 820, doi: 10.1086/318767
- Graham (2012) —. 2012, ApJ, 746, 113, doi: 10.1088/0004-637X/746/1/113
- Graham (2016) Graham, A. W. 2016, in Astrophysics and Space Science Library, Vol. 418, Galactic Bulges, ed. E. Laurikainen, R. Peletier, & D. Gadotti, 263, doi: 10.1007/978-3-319-19378-6_11
- Graham (2019a) —. 2019a, MNRAS, 1547, doi: 10.1093/mnras/stz1623
- Graham (2019b) —. 2019b, PASA, 36, e035, doi: 10.1017/pasa.2019.23
- Graham et al. (2016a) Graham, A. W., Ciambur, B. C., & Savorgnan, G. A. D. 2016a, ApJ, 831, 132, doi: 10.3847/0004-637X/831/2/132
- Graham & Driver (2005) Graham, A. W., & Driver, S. P. 2005, Publications of the Astronomical Society of Australia, 22, 118, doi: 10.1071/AS05001
- Graham & Driver (2007a) —. 2007a, ApJ, 655, 77, doi: 10.1086/509758
- Graham & Driver (2007b) —. 2007b, MNRAS, 380, L15, doi: 10.1111/j.1745-3933.2007.00340.x
- Graham et al. (2016b) Graham, A. W., Durré, M., Savorgnan, G. A. D., et al. 2016b, ApJ, 819, 43, doi: 10.3847/0004-637X/819/1/43
- Graham et al. (2001a) Graham, A. W., Erwin, P., Caon, N., & Trujillo, I. 2001a, ApJ, 563, L11, doi: 10.1086/338500
- Graham et al. (2003a) Graham, A. W., Erwin, P., Caon, N., & Trujillo, I. 2003a, in Revista Mexicana de Astronomia y Astrofisica Conference Series, Vol. 17, Revista Mexicana de Astronomia y Astrofisica Conference Series, ed. V. Avila-Reese, C. Firmani, C. S. Frenk, & C. Allen, 196–197. https://arxiv.org/abs/astro-ph/0206248
- Graham & Guzmán (2003) Graham, A. W., & Guzmán, R. 2003, AJ, 125, 2936, doi: 10.1086/374992
- Graham et al. (2006) Graham, A. W., Merritt, D., Moore, B., Diemand , J., & Terzić, B. 2006, AJ, 132, 2711, doi: 10.1086/508992
- Graham & Scott (2013) Graham, A. W., & Scott, N. 2013, ApJ, 764, 151, doi: 10.1088/0004-637X/764/2/151
- Graham et al. (2001b) Graham, A. W., Trujillo, I., & Caon, N. 2001b, AJ, 122, 1707, doi: 10.1086/323090
- Graham & Worley (2008) Graham, A. W., & Worley, C. C. 2008, MNRAS, 388, 1708, doi: 10.1111/j.1365-2966.2008.13506.x
- Graham et al. (2003b) Graham, A. W., et al. 2003b, AJ, 125, 2951, doi: 10.1086/375320
- Graham et al. (2007) —. 2007, MNRAS, 378, 198, doi: 10.1111/j.1365-2966.2007.11770.x
- Häußler et al. (2013) Häußler, B., Bamford, S. P., Vika, M., et al. 2013, MNRAS, 430, 330, doi: 10.1093/mnras/sts633
- Heckman & Best (2014) Heckman, T. M., & Best, P. N. 2014, ARA&A, 52, 589, doi: 10.1146/annurev-astro-081913-035722
- Hopkins et al. (2018) Hopkins, P. F., Wetzel, A., Kereš, D., et al. 2018, MNRAS, 480, 800, doi: 10.1093/mnras/sty1690
- Jerjen et al. (2000) Jerjen, H., Binggeli, B., & Freeman, K. C. 2000, AJ, 119, 593, doi: 10.1086/301216
- Kelly & Merloni (2012) Kelly, B. C., & Merloni, A. 2012, Advances in Astronomy, 2012, 970858, doi: 10.1155/2012/970858
- Kelvin et al. (2012) Kelvin, L. S., Driver, S. P., Robotham, A. S. G., et al. 2012, MNRAS, 421, 1007, doi: 10.1111/j.1365-2966.2012.20355.x
- Kennedy et al. (2016) Kennedy, R., Bamford, S. P., Häußler, B., et al. 2016, MNRAS, 460, 3458, doi: 10.1093/mnras/stw1176
- Kent et al. (1991) Kent, S. M., Dame, T. M., & Fazio, G. 1991, ApJ, 378, 131, doi: 10.1086/170413
- Khosroshahi et al. (2000) Khosroshahi, H. G., Wadadekar, Y., & Kembhavi, A. 2000, ApJ, 533, 162, doi: 10.1086/308654
- King & Minkowski (1966) King, I. R., & Minkowski, R. 1966, ApJ, 143, 1002, doi: 10.1086/148580
- King & Minkowski (1972) King, I. R., & Minkowski, R. 1972, in IAU Symposium, Vol. 44, External Galaxies and Quasi-Stellar Objects, ed. D. S. Evans, D. Wills, & B. J. Wills, 87
- Klypin et al. (2011) Klypin, A. A., Trujillo-Gomez, S., & Primack, J. 2011, ApJ, 740, 102, doi: 10.1088/0004-637X/740/2/102
- Kormendy & Bender (2012) Kormendy, J., & Bender, R. 2012, ApJS, 198, 2, doi: 10.1088/0067-0049/198/1/2
- Kormendy et al. (2009) Kormendy, J., Fisher, D. B., Cornell, M. E., & Bender, R. 2009, ApJS, 182, 216, doi: 10.1088/0067-0049/182/1/216
- Kormendy & Richstone (1995) Kormendy, J., & Richstone, D. 1995, ARA&A, 33, 581, doi: 10.1146/annurev.aa.33.090195.003053
- Lange et al. (2015) Lange, R., Driver, S. P., Robotham, A. S. G., et al. 2015, MNRAS, 447, 2603, doi: 10.1093/mnras/stu2467
- Laor (2001) Laor, A. 2001, ApJ, 553, 677, doi: 10.1086/320989
- Lapi et al. (2014) Lapi, A., Raimundo, S., Aversa, R., et al. 2014, ApJ, 782, 69, doi: 10.1088/0004-637X/782/2/69
- Lauer (1985) Lauer, T. R. 1985, ApJ, 292, 104, doi: 10.1086/163136
- Laurikainen et al. (2010) Laurikainen, E., Salo, H., Buta, R., Knapen, J. H., & Comerón, S. 2010, MNRAS, 405, 1089, doi: 10.1111/j.1365-2966.2010.16521.x
- Lentati et al. (2015) Lentati, L., Taylor, S. R., Mingarelli, C. M. F., et al. 2015, MNRAS, 453, 2576, doi: 10.1093/mnras/stv1538
- Li et al. (2020a) Li, K., Bogdanovic, T., & Ballantyne, D. R. 2020a, arXiv e-prints, arXiv:2007.02051. https://arxiv.org/abs/2007.02051
- Li et al. (2020b) Li, Y., Habouzit, M., Genel, S., et al. 2020b, ApJ, 895, 102, doi: 10.3847/1538-4357/ab8f8d
- Licquia & Newman (2015) Licquia, T. C., & Newman, J. A. 2015, ApJ, 806, 96, doi: 10.1088/0004-637X/806/1/96
- Liller (1966) Liller, M. H. 1966, ApJ, 146, 28, doi: 10.1086/148857
- Magorrian et al. (1998) Magorrian, J., Tremaine, S., Richstone, D., et al. 1998, AJ, 115, 2285, doi: 10.1086/300353
- Markwardt (2012) Markwardt, C. 2012, MPFIT: Robust non-linear least squares curve fitting. http://ascl.net/1208.019
- Marshall et al. (2020) Marshall, M. A., Mutch, S. J., Qin, Y., Poole, G. B., & Wyithe, J. S. B. 2020, MNRAS, 494, 2747, doi: 10.1093/mnras/staa936
- Martín-Navarro et al. (2020) Martín-Navarro, I., Burchett, J. N., & Mezcua, M. 2020, MNRAS, 491, 1311, doi: 10.1093/mnras/stz3073
- McLure & Dunlop (2004) McLure, R. J., & Dunlop, J. S. 2004, MNRAS, 352, 1390, doi: 10.1111/j.1365-2966.2004.08034.x
- Möllenhoff & Heidt (2001) Möllenhoff, C., & Heidt, J. 2001, A&A, 368, 16, doi: 10.1051/0004-6361:20000335
- Mutlu-Pakdil et al. (2016) Mutlu-Pakdil, B., Seigar, M. S., & Davis, B. L. 2016, ApJ, 830, 117, doi: 10.3847/0004-637X/830/2/117
- Mutlu-Pakdil et al. (2018) Mutlu-Pakdil, B., Seigar, M. S., Hewitt, I. B., et al. 2018, MNRAS, 474, 2594, doi: 10.1093/mnras/stx2935
- Nemmen et al. (2012) Nemmen, R. S., Georganopoulos, M., Guiriec, S., et al. 2012, Science, 338, 1445, doi: 10.1126/science.1227416
- Novak et al. (2006) Novak, G. S., Faber, S. M., & Dekel, A. 2006, ApJ, 637, 96, doi: 10.1086/498333
- Park et al. (2015) Park, D., Woo, J.-H., Bennert, V. N., et al. 2015, ApJ, 799, 164, doi: 10.1088/0004-637X/799/2/164
- Paturel et al. (2003) Paturel, G., Petit, C., Prugniel, P., et al. 2003, A&A, 412, 45, doi: 10.1051/0004-6361:20031411
- Pillepich et al. (2018) Pillepich, A., Springel, V., Nelson, D., et al. 2018, MNRAS, 473, 4077, doi: 10.1093/mnras/stx2656
- Planck Collaboration et al. (2018) Planck Collaboration, Aghanim, N., Akrami, Y., et al. 2018, ArXiv e-prints, arXiv:1807.06209. https://arxiv.org/abs/1807.06209
- Poincaré (1906) Poincaré, H. 1906, Academie des Sciences Paris Comptes Rendus, 150, 1504
- Press et al. (1992) Press, W. H., Teukolsky, S. A., Vetterling, W. T., & Flannery, B. P. 1992, Numerical recipes in FORTRAN. The art of scientific computing
- Querejeta et al. (2015) Querejeta, M., Meidt, S. E., Schinnerer, E., et al. 2015, The Astrophysical Journal Supplement Series, 219, 5, doi: 10.1088/0067-0049/219/1/5
- Ruszkowski et al. (2019) Ruszkowski, M., Nagai, D., Zhuravleva, I., et al. 2019, BAAS, 51, 326. https://arxiv.org/abs/1903.09686
- Sahu et al. (2019a) Sahu, N., Graham, A. W., & Davis, B. L. 2019a, ApJ, 876, 155, doi: 10.3847/1538-4357/ab0f32
- Sahu et al. (2019b) —. 2019b, ApJ, 887, 10, doi: 10.3847/1538-4357/ab50b7
- Salucci et al. (2000) Salucci, P., et al. 2000, MNRAS, 317, 488, doi: 10.1046/j.1365-8711.2000.03622.x
- Savorgnan et al. (2013) Savorgnan, G., Graham, A. W., Marconi, A., et al. 2013, MNRAS, 434, 387, doi: 10.1093/mnras/stt1027
- Savorgnan (2016) Savorgnan, G. A. D. 2016, ApJ, 821, 88, doi: 10.3847/0004-637X/821/2/88
- Savorgnan & Graham (2016) Savorgnan, G. A. D., & Graham, A. W. 2016, ApJS, 222, 10, doi: 10.3847/0067-0049/222/1/10
- Savorgnan et al. (2016) Savorgnan, G. A. D., et al. 2016, ApJ, 817, 21, doi: 10.3847/0004-637X/817/1/21
- Schaye et al. (2015) Schaye, J., Crain, R. A., Bower, R. G., et al. 2015, MNRAS, 446, 521, doi: 10.1093/mnras/stu2058
- Scott et al. (2013) Scott, N., Graham, A. W., & Schombert, J. 2013, ApJ, 768, 76, doi: 10.1088/0004-637X/768/1/76
- Secrest et al. (2013) Secrest, N. J., Satyapal, S., Moran, S. M., et al. 2013, ApJ, 777, 139, doi: 10.1088/0004-637X/777/2/139
- Seigar et al. (2008) Seigar, M. S., Kennefick, D., Kennefick, J., & Lacy, C. H. S. 2008, ApJ, 678, L93, doi: 10.1086/588727
- Sérsic (1963) Sérsic, J. L. 1963, BAAA, 6, 41
- Sérsic (1968a) —. 1968a, Atlas de Galaxias Australes - English Translation of the chapter “Photometric Analysis”, Tech. rep., doi: 10.5281/zenodo.2562394
- Sérsic (1968b) —. 1968b, Bulletin of the Astronomical Institutes of Czechoslovakia, 19, 105
- Sesana et al. (2016) Sesana, A., Shankar, F., Bernardi, M., & Sheth, R. K. 2016, MNRAS, 463, L6, doi: 10.1093/mnrasl/slw139
- Sexton et al. (2019) Sexton, R. O., Canalizo, G., Hiner, K. D., et al. 2019, ApJ, 878, 101, doi: 10.3847/1538-4357/ab21d5
- Shankar et al. (2004) Shankar, F., Salucci, P., Granato, G. L., De Zotti, G., & Danese, L. 2004, MNRAS, 354, 1020, doi: 10.1111/j.1365-2966.2004.08261.x
- Shannon et al. (2015) Shannon, R. M., Ravi, V., Lentati, L. T., et al. 2015, Science, 349, 1522, doi: 10.1126/science.aab1910
- Siemens et al. (2013) Siemens, X., Ellis, J., Jenet, F., & Romano, J. D. 2013, Classical and Quantum Gravity, 30, 224015, doi: 10.1088/0264-9381/30/22/224015
- Simmons et al. (2013) Simmons, B. D., Lintott, C., Schawinski, K., et al. 2013, MNRAS, 429, 2199, doi: 10.1093/mnras/sts491
- Somerville & Davé (2015) Somerville, R. S., & Davé, R. 2015, ARA&A, 53, 51, doi: 10.1146/annurev-astro-082812-140951
- Suh et al. (2020) Suh, H., Civano, F., Trakhtenbrot, B., et al. 2020, ApJ, 889, 32, doi: 10.3847/1538-4357/ab5f5f
- Terrazas et al. (2016) Terrazas, B. A., Bell, E. F., Henriques, B. M. B., et al. 2016, ApJ, 830, L12, doi: 10.3847/2041-8205/830/1/L12
- Terrazas et al. (2020) Terrazas, B. A., Bell, E. F., Pillepich, A., et al. 2020, MNRAS, 493, 1888, doi: 10.1093/mnras/staa374
- Terzić & Graham (2005) Terzić, B., & Graham, A. W. 2005, MNRAS, 362, 197, doi: 10.1111/j.1365-2966.2005.09269.x
- Tolstoy et al. (2009) Tolstoy, E., Hill, V., & Tosi, M. 2009, ARA&A, 47, 371, doi: 10.1146/annurev-astro-082708-101650
- Tremaine et al. (2002) Tremaine, S., Gebhardt, K., Bender, R., et al. 2002, ApJ, 574, 740, doi: 10.1086/341002
- Trujillo et al. (2004) Trujillo, I., Erwin, P., Asensio Ramos, A., & Graham, A. W. 2004, AJ, 127, 1917, doi: 10.1086/382712
- Trujillo et al. (2001) Trujillo, I., Graham, A. W., & Caon, N. 2001, MNRAS, 326, 869, doi: 10.1046/j.1365-8711.2001.04471.x
- van den Bosch (2016) van den Bosch, R. C. E. 2016, ApJ, 831, 134, doi: 10.3847/0004-637X/831/2/134
- Vika et al. (2012) Vika, M., Driver, S. P., Cameron, E., Kelvin, L., & Robotham, A. 2012, MNRAS, 419, 2264, doi: 10.1111/j.1365-2966.2011.19881.x
- Vika et al. (2009) Vika, M., Driver, S. P., Graham, A. W., & Liske, J. 2009, MNRAS, 400, 1451, doi: 10.1111/j.1365-2966.2009.15544.x
- Vogelsberger et al. (2014) Vogelsberger, M., Genel, S., Springel, V., et al. 2014, MNRAS, 444, 1518, doi: 10.1093/mnras/stu1536
- Volonteri & Ciotti (2013) Volonteri, M., & Ciotti, L. 2013, ApJ, 768, 29, doi: 10.1088/0004-637X/768/1/29
- Volonteri et al. (2011) Volonteri, M., Natarajan, P., & Gültekin, K. 2011, ApJ, 737, 50, doi: 10.1088/0004-637X/737/2/50
- Volonteri et al. (2020) Volonteri, M., Pfister, H., Beckman, R. S., et al. 2020, arXiv e-prints, arXiv:2005.04902. https://arxiv.org/abs/2005.04902
- Wandel (1999) Wandel, A. 1999, ApJ, 519, L39, doi: 10.1086/312106
- Williams et al. (2010) Williams, M. J., Bureau, M., & Cappellari, M. 2010, MNRAS, 409, 1330, doi: 10.1111/j.1365-2966.2010.17406.x
- Wright (2006) Wright, E. L. 2006, PASP, 118, 1711, doi: 10.1086/510102
- Yepes et al. (2009) Yepes, G., Martínez-Vaquero, L. A., Gottlöber, S., & Hoffman, Y. 2009, in American Institute of Physics Conference Series, Vol. 1178, American Institute of Physics Conference Series, ed. C. Balazs & F. Wang, 64–75, doi: 10.1063/1.3264558
- Young & Currie (1994) Young, C. K., & Currie, M. J. 1994, MNRAS, 268, L11, doi: 10.1093/mnras/268.1.L11
Appendix A Data Set
In Table 3, first 83 galaxies are ETGs, and the remaining are LTGs, where the galaxies with a depleted core are marked with superscript “a” on their names in the first column. The spheroid Sérsic model parameters (), morphology, and spheroid stellar masses are taken from our previous studies Savorgnan & Graham (2016), Sahu et al. (2019a), and Davis et al. (2019). For NGC 1271 and NGC 1277 these parameters are borrowed from Graham et al. (2016a) and Graham et al. (2016b), respectively. Spheroid parameters for the Milky Way are taken from Graham & Driver (2007a) who used the uncalibrated bulge surface brightness profile of Milky Way from Kent et al. (1991). The spheroid mass of Milky Way is taken from Licquia & Newman (2015).
Correlations of and with the equivalent-axis bulge parameters obtained using symmetric MPFITEXY regression are presented in Table 4. These relations are consistent with the corresponding relations obtained using the (bisector) BCES regression presented in Table 2.
=-2in \movetabledown=0.5in
| No. | Galaxy | Band | Type | C | scale | Distance | Ref. | |||||||||||
|---|---|---|---|---|---|---|---|---|---|---|---|---|---|---|---|---|---|---|
| arcsec | dex | arcsec | dex | dex | Mpc | dex | ||||||||||||
| (1) | (2) | (3) | (4) | (5) | (6) | (7) | (8) | (9) | (10) | (11) | (12) | (13) | (14) | (15) | (16) | (17) | (18) | |
| 1 | IC 1459aaGalaxies with a deficit of light at their center, for whom the spheroid profile is parameterized using a core-Sérsic function (Graham et al., 2003b). | (0.6, 3.26) | E | 6.60 | 63.10 | 18.49 | 2.32 | 7.00 | 57.30 | 18.59 | 2.28 | 0.60 | 0.1366 | 11.55 0.12 | 28.4 | 9.38 0.20 | SG16 | |
| 2 | NGC 0821 | (0.6, 3.26) | E | 5.30 | 36.50 | 18.40 | 2.36 | 6.10 | 18.90 | 17.83 | 2.58 | 0.62 | 0.1127 | 10.69 0.33 | 23.4 | 7.59 0.17 | SG16 | |
| 3 | NGC 1023 | (0.6, 3.26) | SB0 | 2.10 | 9.20 | 14.96 | 3.73 | 2.00 | 7.40 | 14.79 | 3.80 | 0.32 | 0.0536 | 10.21 0.12 | 11.1 | 7.62 0.05 | SG16 | |
| 4 | NGC 1316 | (0.6, 3.26) | 2.00 | 21.50 | 15.55 | 3.50 | 1.80 | 15.90 | 15.43 | 3.54 | 0.30 | 0.0897 | 11.05 0.26 | 18.6 | 8.18 0.26 | SG16 | ||
| 5 | NGC 1332 | (0.6, 3.26) | ES | 5.10 | 34.70 | 17.44 | 2.74 | 3.70 | 18.00 | 16.47 | 3.13 | 0.35 | 0.1074 | 11.05 0.33 | 22.3 | 9.160.07 | SG16 | |
| 6 | NGC 1399aaGalaxies with a deficit of light at their center, for whom the spheroid profile is parameterized using a core-Sérsic function (Graham et al., 2003b). | (0.6, 3.26) | E | 10.00 | 405.10 | 21.80 | 1.00 | 10.00 | 338.10 | 21.53 | 1.10 | 0.63 | 0.0935 | 11.66 0.12 | 19.4 | 8.670.06 | SG16 | |
| 7 | NGC 2549 | (0.6, 3.26) | SB0 | 2.30 | 6.10 | 15.57 | 3.49 | 1.50 | 3.10 | 14.54 | 3.90 | 0.24 | 0.0594 | 9.59 0.12 | 12.3 | 7.150.6 | SG16 | |
| 8 | NGC 2778 | (0.6, 3.26) | SAB0 | 1.30 | 2.30 | 15.61 | 3.47 | 1.20 | 2.20 | 15.46 | 3.53 | 0.24 | 0.1074 | 9.41 0.26 | 22.3 | 7.180.34 | SG16 | |
| 9 | NGC 3091aaGalaxies with a deficit of light at their center, for whom the spheroid profile is parameterized using a core-Sérsic function (Graham et al., 2003b). | (0.6, 3.26) | E | 7.60 | 100.50 | 20.43 | 1.55 | 6.60 | 51.20 | 19.47 | 1.94 | 0.49 | 0.2447 | 11.61 0.12 | 51.2 | 9.560.04 | SG16 | |
| 10 | NGC 3115 | (0.6, 3.26) | S0 | 4.40 | 43.60 | 16.67 | 3.04 | 5.10 | 34.40 | 16.85 | 2.97 | 0.58 | 0.0455 | 10.77 0.12 | 9.4 | 8.940.25 | SG16 | |
| 11 | NGC 3245 | (0.6, 3.26) | SAB0 | 2.90 | 4.40 | 14.96 | 3.73 | 1.70 | 2.40 | 14.00 | 4.12 | 0.24 | 0.0979 | 10.06 0.12 | 20.3 | 8.30 0.12 | SG16 | |
| 12 | NGC 3377 | (0.6, 3.26) | E | 7.70 | 61.80 | 19.16 | 2.05 | 9.20 | 91.70 | 20.33 | 1.58 | 0.73 | 0.0527 | 10.48 0.26 | 10.9 | 7.89 0.04 | SG16 | |
| 13 | NGC 3379aaGalaxies with a deficit of light at their center, for whom the spheroid profile is parameterized using a core-Sérsic function (Graham et al., 2003b). | (0.6, 3.26) | E | 5.20 | 57.20 | 17.93 | 2.54 | 5.30 | 50.90 | 17.84 | 2.58 | 0.53 | 0.0498 | 10.8 0.26 | 10.3 | 8.60 0.12 | SG16 | |
| 14 | NGC 3384 | (0.6, 3.26) | SAB0 | 1.60 | 5.50 | 14.21 | 4.03 | 1.80 | 5.60 | 14.56 | 3.89 | 0.32 | 0.0546 | 10.06 0.12 | 11.3 | 7.23 0.05 | SG16 | |
| 15 | NGC 3414 | (0.6, 3.26) | E | 4.80 | 28.00 | 18.10 | 2.48 | 4.50 | 25.50 | 18.08 | 2.48 | 0.46 | 0.118 | 10.83 0.12 | 24.5 | 8.38 0.06 | SG16 | |
| 16 | NGC 3489 | (0.6, 3.26) | SB0 | 1.50 | 2.20 | 13.47 | 4.33 | 1.30 | 1.70 | 13.25 | 4.41 | 0.25 | 0.0565 | 9.54 0.26 | 11.7 | 6.76 0.07 | SG16 | |
| 17 | NGC 3585 | (0.6, 3.26) | E | 5.20 | 105.00 | 19.13 | 2.06 | 6.30 | 86.30 | 19.24 | 2.02 | 0.65 | 0.094 | 11.3 0.26 | 19.5 | 8.49 0.13 | SG16 | |
| 18 | NGC 3607 | (0.6, 3.26) | E | 5.50 | 69.30 | 19.00 | 2.12 | 5.60 | 65.50 | 19.01 | 2.11 | 0.54 | 0.107 | 11.23 0.26 | 22.2 | 8.11 0.18 | SG16 | |
| 19 | NGC 3608aaGalaxies with a deficit of light at their center, for whom the spheroid profile is parameterized using a core-Sérsic function (Graham et al., 2003b). | (0.6, 3.26) | E | 5.20 | 47.50 | 18.93 | 2.14 | 5.70 | 43.40 | 19.00 | 2.12 | 0.58 | 0.1074 | 10.89 0.26 | 22.3 | 8.30 0.18 | SG16 | |
| 20 | NGC 3842aaGalaxies with a deficit of light at their center, for whom the spheroid profile is parameterized using a core-Sérsic function (Graham et al., 2003b). | (0.6, 3.26) | E | 8.10 | 100.70 | 21.43 | 1.16 | 8.20 | 73.60 | 21.07 | 1.31 | 0.61 | 0.4643 | 11.92 0.12 | 98.4 | 9.99 0.13 | SG16 | |
| 21 | NGC 3998 | (0.6, 3.26) | SAB0 | 1.20 | 5.80 | 15.15 | 3.65 | 1.30 | 4.80 | 14.63 | 3.86 | 0.26 | 0.0662 | 10.02 0.33 | 13.7 | 8.91 0.11 | SG16 | |
| 22 | NGC 4261aaGalaxies with a deficit of light at their center, for whom the spheroid profile is parameterized using a core-Sérsic function (Graham et al., 2003b). | (0.6, 3.26) | E | 4.70 | 52.60 | 18.58 | 2.29 | 4.30 | 47.30 | 18.53 | 2.31 | 0.45 | 0.1481 | 11.38 0.26 | 30.8 | 8.70 0.09 | SG16 | |
| 23 | NGC 4291aaGalaxies with a deficit of light at their center, for whom the spheroid profile is parameterized using a core-Sérsic function (Graham et al., 2003b). | (0.6, 3.26) | E | 4.20 | 15.00 | 17.14 | 2.86 | 5.90 | 15.40 | 17.51 | 2.71 | 0.70 | 0.1228 | 10.71 0.26 | 25.5 | 8.52 0.36 | SG16 | |
| 24 | NGC 4374aaGalaxies with a deficit of light at their center, for whom the spheroid profile is parameterized using a core-Sérsic function (Graham et al., 2003b). | (0.6, 3.26) | E | 7.80 | 101.60 | 19.01 | 2.11 | 7.90 | 129.8 | 19.57 | 1.89 | 0.60 | 0.0864 | 11.49 0.26 | 17.9 | 8.95 0.05 | SG16 | |
| 25 | NGC 4459 | (0.6, 3.26) | S0 | 3.10 | 18.40 | 16.69 | 3.04 | 2.60 | 13.00 | 16.23 | 3.22 | 0.34 | 0.0758 | 10.48 0.26 | 15.7 | 7.83 0.09 | SG16 | |
| 26 | NGC 4472aaGalaxies with a deficit of light at their center, for whom the spheroid profile is parameterized using a core-Sérsic function (Graham et al., 2003b). | (0.6, 3.26) | E | 6.60 | 190.20 | 19.33 | 1.98 | 5.40 | 135.30 | 18.83 | 2.18 | 0.44 | 0.0825 | 11.7 0.12 | 17.1 | 9.40 0.05 | SG16 | |
| 27 | NGC 4473 | (0.6, 3.26) | E | 2.30 | 45.90 | 17.93 | 2.54 | 2.90 | 36.90 | 18.10 | 2.47 | 0.46 | 0.0739 | 10.64 0.26 | 15.3 | 8.08 0.36 | SG16 | |
| 28 | NGC 4486aaGalaxies with a deficit of light at their center, for whom the spheroid profile is parameterized using a core-Sérsic function (Graham et al., 2003b). | (0.6, 3.26) | E | 10.00 | 203.00 | 19.87 | 1.77 | 5.90 | 87.10 | 18.26 | 2.41 | 0.33 | 0.0753 | 11.49 0.26 | 16.8 | 9.81 0.05 | SG16 | |
| 29 | NGC 4564 | (0.6, 3.26) | S0 | 2.60 | 5.00 | 15.23 | 3.62 | 3.00 | 6.00 | 15.65 | 3.45 | 0.45 | 0.0705 | 10.01 0.12 | 14.6 | 7.78 0.06 | SG16 | |
| 30 | NGC 4596 | (0.6, 3.26) | SB0 | 2.70 | 6.60 | 15.93 | 3.34 | 3.00 | 9.00 | 16.44 | 3.14 | 0.44 | 0.082 | 10.18 0.12 | 17.0 | 7.90 0.20 | SG16 | |
| 31 | NGC 4621 | (0.6, 3.26) | E | 5.50 | 48.00 | 18.02 | 2.51 | 8.80 | 90.90 | 19.67 | 1.85 | 0.87 | 0.0859 | 11.16 0.12 | 17.8 | 8.59 0.05 | SG16 | |
| 32 | NGC 4697 | (0.6, 3.26) | E | 7.20 | 239.30 | 20.62 | 1.47 | 6.70 | 226.40 | 20.90 | 1.35 | 0.53 | 0.0551 | 11.01 0.33 | 11.4 | 8.26 0.05 | SG16 | |
| 33 | NGC 4889aaGalaxies with a deficit of light at their center, for whom the spheroid profile is parameterized using a core-Sérsic function (Graham et al., 2003b). | (0.6, 3.26) | E | 8.10 | 119.70 | 21.01 | 1.33 | 6.80 | 60.80 | 20.11 | 1.69 | 0.48 | 0.4863 | 12.14 0.12 | 103.2 | 10.32 0.44 | SG16 | |
| 34 | NGC 5077aaGalaxies with a deficit of light at their center, for whom the spheroid profile is parameterized using a core-Sérsic function (Graham et al., 2003b). | (0.6, 3.26) | E | 4.20 | 23.50 | 17.67 | 2.65 | 5.70 | 23.00 | 18.01 | 2.52 | 0.68 | 0.1975 | 11.28 0.12 | 41.2 | 8.87 0.22 | SG16 | |
| 35 | NGC 5128 | (0.6, 3.26) | 1.20 | 61.30 | 15.73 | 3.42 | 2.20 | 60.80 | 16.01 | 3.30 | 0.42 | 0.0185 | 10.64 0.33 | 3.8 | 7.65 0.13 | SG16 | ||
| 36 | NGC 5576 | (0.6, 3.26) | E | 3.30 | 61.50 | 19.41 | 1.95 | 3.70 | 49.30 | 19.34 | 1.98 | 0.49 | 0.1194 | 10.87 0.12 | 24.8 | 8.20 0.10 | SG16 | |
| 37 | NGC 5846aaGalaxies with a deficit of light at their center, for whom the spheroid profile is parameterized using a core-Sérsic function (Graham et al., 2003b). | (0.6, 3.26) | E | 6.40 | 105.10 | 19.67 | 1.85 | 5.70 | 83.40 | 19.28 | 2.01 | 0.48 | 0.1165 | 11.42 0.26 | 24.2 | 9.04 0.05 | SG16 | |
| 38 | NGC 6251aaGalaxies with a deficit of light at their center, for whom the spheroid profile is parameterized using a core-Sérsic function (Graham et al., 2003b). | (0.6, 3.26) | E | 6.80 | 41.70 | 19.82 | 1.81 | 5.60 | 30.10 | 19.31 | 2.01 | 0.44 | 0.4927 | 11.82 0.12 | 104.6 | 8.77 0.16 | SG16 | |
| 39 | NGC 7619aaGalaxies with a deficit of light at their center, for whom the spheroid profile is parameterized using a core-Sérsic function (Graham et al., 2003b). | (0.6, 3.26) | E | 5.30 | 63.20 | 19.53 | 1.91 | 5.20 | 58.00 | 19.55 | 1.90 | 0.51 | 0.2461 | 11.64 0.26 | 51.5 | 9.40 0.09 | SG16 | |
| 40 | NGC 7768aaGalaxies with a deficit of light at their center, for whom the spheroid profile is parameterized using a core-Sérsic function (Graham et al., 2003b). | (0.6, 3.26) | E | 8.40 | 92.90 | 21.37 | 1.19 | 6.70 | 42.10 | 20.15 | 1.68 | 0.45 | 0.5301 | 11.89 0.26 | 112.8 | 9.11 0.15 | SG16 | |
| 41 | NGC 1271 | H (HST) | (1.4, 3.33) | ES | 4.26 | 3.25 | 16.75 | 3.43 | 4.16 | 3.07 | 16.79 | 3.41 | 0.46 | 0.3794 | 10.95 0.1 | 80.0 | 9.48 0.16 | GCS16a |
| 42 | NGC 1277 | V (HST) | (11.65, 4.82) | ES | 5.34 | 6.00 | 20.73 | 3.35 | 5.63 | 5.60 | 21.05 | 3.22 | 0.56 | 0.3445 | 11.43 0.1 | 72.5 | 9.08 0.12 | GDS16b |
| 43 | A1836 BCGaaGalaxies with a deficit of light at their center, for whom the spheroid profile is parameterized using a core-Sérsic function (Graham et al., 2003b). | (0.7, 5.08) | E | 4.10 | 23.99 | 19.36 | 2.80 | 3.47 | 14.75 | 20.66 | 2.28 | 0.39 | 0.7335 | 11.70 0.12 | 158 | 9.59 0.06 | SGD19a | |
| 44 | A3565 BCG | (0.6, 6.02) | E | 3.85 | 43.21 | 21.29 | 2.31 | 3.82 | 41.10 | 21.28 | 2.31 | 0.45 | 0.1951 | 11.47 0.26 | 40.7 | 9.04 0.09 | SGD19a | |
| 45 | NGC 0307 | (2.8, 4.65) | SAB0 | 3.33 | 3.00 | 18.82 | 3.42 | 3.76 | 3.33 | 19.44 | 3.17 | 0.49 | 0.2523 | 10.43 0.33 | 52.8 | 8.34 0.13 | SGD19a | |
| 46 | NGC 0404 | (0.6, 6.02) | S0 | 0.93 | 3.99 | 18.58 | 3.39 | 0.90 | 3.89 | 18.59 | 3.38 | 0.20 | 0.0148 | 7.96 0.27 | 3.1 | 4.85 0.13 | SGD19a | |
| 47 | NGC 0524aaGalaxies with a deficit of light at their center, for whom the spheroid profile is parameterized using a core-Sérsic function (Graham et al., 2003b). | (0.6, 6.02) | SA0(rs) | 2.29 | 8.79 | 18.67 | 3.35 | 2.16 | 8.35 | 18.57 | 3.39 | 0.34 | 0.1122 | 10.57 0.26 | 23.3 | 8.92 0.10 | SGD19a | |
| 48 | NGC 1194aaGalaxies with a deficit of light at their center, for whom the spheroid profile is parameterized using a core-Sérsic function (Graham et al., 2003b). | (0.6, 6.02) | 3.76 | 3.52 | 18.34 | 3.49 | 3.91 | 3.56 | 18.56 | 3.40 | 0.47 | 0.2542 | 10.71 0.33 | 53.2 | 7.81 0.04 | SGD19a | ||
| 49 | NGC 1275 | (0.6, 6.02) | E | 4.78 | 70.69 | 22.62 | 1.78 | 4.31 | 53.6 | 22.27 | 1.92 | 0.44 | 0.3464 | 11.84 0.26 | 72.9 | 8.90 0.20 | SGD19a | |
| 50 | NGC 1374 | (0.6, 6.02) | S0 | 1.68 | 12.56 | 19.65 | 2.96 | 1.65 | 11.74 | 19.62 | 2.97 | 0.29 | 0.0926 | 10.22 0.26 | 19.2 | 8.76 0.05 | SGD19a | |
| 51 | NGC 1407aaGalaxies with a deficit of light at their center, for whom the spheroid profile is parameterized using a core-Sérsic function (Graham et al., 2003b). | (0.6, 6.02) | E | 3.95 | 49.67 | 20.89 | 2.46 | 3.89 | 47.29 | 20.87 | 2.47 | 0.45 | 0.1349 | 11.46 0.27 | 28 | 9.65 0.08 | SGD19a | |
| 52 | NGC 1550aaGalaxies with a deficit of light at their center, for whom the spheroid profile is parameterized using a core-Sérsic function (Graham et al., 2003b). | (0.7, 5.08) | E | 7.50 | 24.80 | 20.87 | 2.17 | 7.48 | 24.8 | 21.16 | 2.05 | 0.58 | 0.2465 | 11.13 0.12 | 51.6 | 9.57 0.06 | SGD19a | |
| 53 | NGC 1600aaGalaxies with a deficit of light at their center, for whom the spheroid profile is parameterized using a core-Sérsic function (Graham et al., 2003b). | (0.6, 6.02) | E | 7.14 | 76.57 | 22.66 | 1.77 | 5.08 | 49.58 | 21.98 | 2.04 | 0.38 | 0.3048 | 11.82 0.12 | 64 | 10.23 0.05 | SGD19a | |
| 54 | NGC 2787 | (0.6, 6.02) | SB0(r) | 1.36 | 4.06 | 17.32 | 3.89 | 1.27 | 2.88 | 17.08 | 3.99 | 0.25 | 0.0353 | 9.13 0.26 | 7.3 | 7.60 0.06 | SGD19a | |
| 55 | NGC 3665 | (0.6, 6.02) | S0 | 2.76 | 14.44 | 19.28 | 3.11 | 2.74 | 12.78 | 19.34 | 3.09 | 0.39 | 0.1666 | 11.03 0.26 | 34.7 | 8.76 0.10 | SGD19a | |
| 56 | NGC 3923aaGalaxies with a deficit of light at their center, for whom the spheroid profile is parameterized using a core-Sérsic function (Graham et al., 2003b). | (0.6, 6.02) | E | 4.78 | 85.97 | 21.50 | 2.22 | 4.77 | 78.78 | 21.55 | 2.20 | 0.5 | 0.1006 | 11.4 0.15 | 20.9 | 9.45 0.13 | SGD19a | |
| 57 | NGC 4026 | (0.6, 6.02) | SB0 | 3.45 | 3.10 | 16.14 | 4.36 | 3.98 | 2.35 | 16.04 | 4.40 | 0.51 | 0.0638 | 10.11 0.33 | 13.2 | 8.26 0.11 | SGD19a | |
| 58 | NGC 4339 | (0.6, 6.02) | S0 | 1.46 | 6.64 | 19.22 | 3.13 | 1.40 | 6.42 | 19.21 | 3.14 | 0.27 | 0.0772 | 9.67 0.26 | 16.0 | 7.63 0.33 | SGD19a | |
| 59 | NGC 4342 | (0.6, 6.02) | ES | 3.48 | 4.22 | 18.48 | 3.43 | 3.99 | 4.69 | 19.23 | 3.13 | 0.51 | 0.1108 | 9.94 0.25 | 23.0 | 8.65 0.18 | SGD19a | |
| 60 | NGC 4350 | (0.6, 6.02) | EBS | 4.30 | 18.84 | 20.8 | 2.50 | 3.97 | 19.45 | 20.75 | 2.52 | 0.44 | 0.0811 | 10.28 0.26 | 16.8 | 8.86 0.41 | SGD19a | |
| 61 | NGC 4371 | (0.6, 6.02) | SB(r)0 | 2.83 | 8.46 | 19.49 | 3.02 | 3.19 | 8.90 | 19.91 | 2.85 | 0.45 | 0.0816 | 9.89 0.26 | 16.9 | 6.85 0.08 | SGD19a | |
| 62 | NGC 4429 | (0.6, 6.02) | SB(r)0 | 2.56 | 16.42 | 19.05 | 3.20 | 2.31 | 11.29 | 18.78 | 3.31 | 0.34 | 0.0796 | 10.46 0.26 | 16.5 | 8.18 0.09 | SGD19a | |
| 63 | NGC 4434 | (0.6, 6.02) | S0 | 2.68 | 4.94 | 19.06 | 3.20 | 2.93 | 5.31 | 19.31 | 3.10 | 0.43 | 0.1079 | 9.91 0.26 | 22.4 | 7.85 0.17 | SGD19a | |
| 64 | NGC 4486B | (2.8, 4.65) | E | 2.63 | 2.60 | 18.20 | 3.66 | 2.74 | 2.53 | 18.30 | 3.62 | 0.4 | 0.0739 | 9.47 0.33 | 15.3 | 8.76 0.24 | SGD19a | |
| 65 | NGC 4526 | (0.6, 6.02) | S0 | 2.28 | 13.01 | 18.19 | 3.54 | 2.96 | 14.88 | 18.98 | 3.23 | 0.47 | 0.0816 | 10.7 0.26 | 16.9 | 8.67 0.05 | SGD19a | |
| 66 | NGC 4552 | (0.6, 6.02) | E | 5.42 | 83.62 | 22.12 | 1.97 | 5.36 | 71.5 | 21.92 | 2.05 | 0.52 | 0.0719 | 10.88 0.25 | 14.9 | 8.67 0.05 | SGD19a | |
| 67 | NGC 4578 | (0.6, 6.02) | S0(r) | 2.30 | 7.82 | 19.26 | 3.11 | 1.99 | 6.32 | 19.14 | 3.16 | 0.31 | 0.0787 | 9.77 0.26 | 16.3 | 7.28 0.35 | SGD19a | |
| 58 | NGC 4649aaGalaxies with a deficit of light at their center, for whom the spheroid profile is parameterized using a core-Sérsic function (Graham et al., 2003b). | (0.6, 6.02) | E | 4.96 | 93.03 | 21.01 | 2.42 | 5.21 | 80.59 | 20.98 | 2.43 | 0.54 | 0.0791 | 11.44 0.12 | 16.4 | 9.67 0.10 | SGD19a | |
| 69 | NGC 4742 | (0.6, 6.02) | S0 | 2.62 | 3.37 | 17.13 | 3.97 | 3.20 | 3.41 | 17.62 | 3.77 | 0.48 | 0.0748 | 9.87 0.26 | 15.5 | 7.15 0.18 | SGD19a | |
| 70 | NGC 4751aaGalaxies with a deficit of light at their center, for whom the spheroid profile is parameterized using a core-Sérsic function (Graham et al., 2003b). | (0.7, 5.08) | S0 | 3.79 | 12.47 | 18.74 | 3.02 | 3.25 | 5.48 | 17.76 | 3.41 | 0.38 | 0.1295 | 10.49 0.26 | 26.9 | 9.15 0.05 | SGD19a | |
| 71 | NGC 4762 | (0.6, 6.02) | SB0 | 2.36 | 4.39 | 17.89 | 3.66 | 1.85 | 2.24 | 17.09 | 3.98 | 0.29 | 0.1089 | 9.97 0.28 | 22.6 | 7.36 0.15 | SGD19a | |
| 72 | NGC 5018 | (0.6, 6.02) | 2.64 | 8.29 | 18.4 | 3.46 | 2.51 | 6.20 | 18.22 | 3.54 | 0.36 | 0.1944 | 10.98 0.27 | 40.6 | 8.02 0.09 | SGD19a | ||
| 73 | NGC 5252 | (0.6, 6.02) | S0 | 3.08 | 2.07 | 17.82 | 3.71 | 2.95 | 1.47 | 17.46 | 3.85 | 0.39 | 0.4569 | 10.85 0.26 | 96.8 | 9.00 0.40 | SGD19a | |
| 74 | NGC 5328aaGalaxies with a deficit of light at their center, for whom the spheroid profile is parameterized using a core-Sérsic function (Graham et al., 2003b). | (0.7, 5.08) | E | 6.58 | 25.11 | 20.29 | 2.40 | 5.21 | 22.46 | 20.26 | 2.42 | 0.42 | 0.3053 | 11.49 0.12 | 64.1 | 9.67 0.15 | SGD19a | |
| 75 | NGC 5419aaGalaxies with a deficit of light at their center, for whom the spheroid profile is parameterized using a core-Sérsic function (Graham et al., 2003b). | (0.6, 6.02) | E | 2.42 | 17.24 | 19.80 | 2.91 | 2.62 | 16.83 | 20.01 | 2.82 | 0.40 | 0.2683 | 11.45 0.12 | 56.2 | 9.86 0.14 | SGD19a | |
| 76 | NGC 5516aaGalaxies with a deficit of light at their center, for whom the spheroid profile is parameterized using a core-Sérsic function (Graham et al., 2003b). | (0.7, 5.08) | E | 5.99 | 51.27 | 21.54 | 1.90 | 5.32 | 32.30 | 20.86 | 2.18 | 0.47 | 0.2788 | 11.44 0.12 | 58.4 | 9.52 0.06 | SGD19a | |
| 77 | NGC 5813aaGalaxies with a deficit of light at their center, for whom the spheroid profile is parameterized using a core-Sérsic function (Graham et al., 2003b). | (0.6, 6.02) | S0 | 4.02 | 18.54 | 20.74 | 2.53 | 3.65 | 14.16 | 19.81 | 2.90 | 0.42 | 0.1504 | 10.86 0.26 | 31.3 | 8.83 0.06 | SGD19a | |
| 78 | NGC 5845 | (0.6, 6.02) | ES | 3.33 | 6.02 | 19.16 | 3.16 | 3.27 | 5.29 | 19.10 | 3.18 | 0.42 | 0.1213 | 10.12 0.26 | 25.2 | 8.41 0.22 | SGD19a | |
| 79 | NGC 6086aaGalaxies with a deficit of light at their center, for whom the spheroid profile is parameterized using a core-Sérsic function (Graham et al., 2003b). | (2.8, 4.65) | E | 4.37 | 13.89 | 21.68 | 2.30 | 4.20 | 12.41 | 21.78 | 2.26 | 0.46 | 0.6441 | 11.52 0.26 | 138 | 9.57 0.17 | SGD19a | |
| 80 | NGC 6861 | (0.6, 6.02) | ES | 3.07 | 18.69 | 19.35 | 3.08 | 3.52 | 20.13 | 20.17 | 2.75 | 0.48 | 0.1314 | 10.94 0.29 | 27.3 | 9.30 0.08 | SGD19a | |
| 81 | NGC 7052aaGalaxies with a deficit of light at their center, for whom the spheroid profile is parameterized using a core-Sérsic function (Graham et al., 2003b). | (0.6, 6.02) | E | 3.20 | 34.42 | 21.84 | 2.36 | 3.46 | 20.04 | 20.82 | 2.50 | 0.46 | 0.3161 | 11.46 0.12 | 66.4 | 8.57 0.23 | SGD19a | |
| 82 | NGC 7332 | (0.6, 6.02) | EB0 | 1.78 | 2.87 | 16.78 | 4.11 | 2.15 | 2.43 | 16.92 | 4.05 | 0.37 | 0.1198 | 10.22 0.34 | 24.9 | 7.11 0.20 | SGD19a | |
| 83 | NGC 7457 | (0.6, 6.02) | S0 | 2.63 | 6.31 | 19.62 | 2.97 | 2.84 | 6.51 | 19.98 | 2.83 | 0.42 | 0.0676 | 9.40 0.26 | 14 | 7.00 0.30 | SGD19a | |
| 84 | Circinus | (0.45, 6.02) | SABb | 2.21 | 33.26 | 18.29 | 3.37 | 1.80 | 23.13 | 18.06 | 3.47 | 0.29 | 0.0204 | 10.12 0.2 | 4.2 | 6.25 0.11 | DGC19a | |
| 85 | ESO558-G009 | I (HST) | (1.88, 4.52) | Sbc | 1.28 | 0.62 | 18.17 | 3.47 | 1.63 | 0.68 | 18.62 | 3.29 | 0.31 | 0.542 | 9.89 0.11 | 115.4 | 7.26 0.04 | DGC19a |
| 86 | IC 2560 | (0.45, 6.02) | SBb | 2.27 | 7.15 | 19.64 | 2.84 | 0.68 | 3.92 | 19.07 | 3.07 | 0.15 | 0.149 | 9.63 0.39 | 31.0 | 6.49 0.20 | DGC19a | |
| 87 | J0437+2456 | I (HST) | (1.88, 4.52) | SB | 1.73 | 1.22 | 19.42 | 2.96 | 1.97 | 0.87 | 19.40 | 2.97 | 0.35 | 0.343 | 9.90 0.2 | 72.8 | 6.51 0.05 | DGC19a |
| 88 | Milky Way | … | SBbc | 1.32 | … | … | 1.32 | … | … | … | 0.38E-4 | 9.96 0.05 | 7.86E-3 | 6.6 0.02 | GD07 | |||
| 89 | Mrk 1029 | I (HST) | (1.88, 4.52) | S | 1.15 | 0.47 | 16.53 | 4.13 | 1.07 | 0.28 | 16.29 | 4.23 | 0.23 | 0.6392 | 9.90 0.11 | 136.9 | 6.33 0.12 | DGC19a |
| 90 | NGC 0224 | (0.45, 6.02) | SBb | 2.20 | 418.6 | 19.58 | 2.87 | 1.30 | 173.6 | 18.41 | 3.33 | 0.22 | 0.0036 | 10.11 0.09 | 0.8 | 8.15 0.16 | DGC19a | |
| 91 | NGC 0253 | (0.45, 6.02) | SABc | 2.53 | 55.55 | 19.22 | 3.00 | 2.33 | 27.89 | 18.82 | 3.16 | 0.34 | 0.0168 | 9.76 0.09 | 3.5 | 7.00 0.30 | DGC19a | |
| 92 | NGC 1068 | (0.62, 5.08) | SBb | 0.71 | 10.52 | 16.17 | 3.99 | 0.87 | 8.29 | 16.14 | 4.00 | 0.20 | 0.0488 | 10.27 0.24 | 10.1 | 6.75 0.08 | DGC19a | |
| 93 | NGC 1097 | (0.45, 6.02) | SBb | 1.95 | 15.72 | 18.71 | 3.21 | 1.52 | 11.39 | 18.27 | 3.39 | 0.26 | 0.1199 | 10.83 0.2 | 24.9 | 8.38 0.04 | DGC19a | |
| 94 | NGC 1300 | (0.45, 6.02) | SBbc | 4.20 | 24.37 | 21.97 | 1.91 | 2.83 | 7.39 | 19.99 | 2.70 | 0.31 | 0.07 | 9.42 0.25 | 14.5 | 7.71 0.16 | DGC19a | |
| 95 | NGC 1320 | (0.45, 6.02) | Sa | 3.08 | 3.35 | 17.93 | 3.53 | 2.87 | 2.23 | 17.40 | 3.74 | 0.38 | 0.1809 | 10.25 0.4 | 37.7 | 6.78 0.29 | DGC19a | |
| 96 | NGC 1398 | (0.45, 6.02) | SBab | 3.44 | 17.53 | 19.75 | 2.80 | 3.00 | 10.38 | 19.04 | 3.08 | 0.38 | 0.1194 | 10.57 0.2 | 24.8 | 8.03 0.11 | DGC19a | |
| 97 | NGC 2273 | I (HST) | (1.88, 4.52) | SBa | 2.24 | 2.99 | 18.13 | 3.47 | 2.49 | 3.15 | 18.52 | 3.31 | 0.39 | 0.1519 | 9.98 0.2 | 31.6 | 6.97 0.09 | DGC19a |
| 98 | NGC 2960 | (0.45, 6.02) | 2.59 | 2.35 | 18.04 | 3.49 | 2.86 | 2.19 | 18.30 | 3.39 | 0.42 | 0.338 | 10.44 0.36 | 71.1 | 7.06 0.17 | DGC19a | ||
| 99 | NGC 2974 | (0.45, 6.02) | SB | 1.56 | 9.21 | 18.49 | 3.30 | 1.17 | 6.53 | 18.12 | 3.45 | 0.23 | 0.1036 | 10.23 0.13 | 21.5 | 8.23 0.07 | DGC19a | |
| 100 | NGC 3031bbThe morphology of these spiral galaxies listed on HyperLeda (Paturel et al., 2003) or NASA/IPAC Extragalactic Database (NED) suggests a weak bar, however, Davis et al. (2019) did not find evidence of an extended/intermediate bar in these galaxies but rather a nuclear bar. | (0.45, 6.02) | Sab | 2.81 | 36.19 | 18.34 | 3.35 | 3.46 | 42.98 | 18.93 | 3.12 | 0.50 | 0.0169 | 10.16 0.11 | 3.5 | 7.83 0.09 | DGC19a | |
| 101 | NGC 3079 | (0.45, 6.02) | SBcd | 0.52 | 5.91 | 16.79 | 3.98 | 0.58 | 4.35 | 17.13 | 3.84 | 0.16 | 0.0796 | 9.92 0.25 | 16.5 | 6.38 0.12 | DGC19a | |
| 102 | NGC 3227 | (0.45, 6.02) | SABa | 2.60 | 17.91 | 20.26 | 2.59 | 1.90 | 8.34 | 19.32 | 2.97 | 0.28 | 0.1017 | 10.04 0.17 | 21.1 | 7.88 0.14 | DGC19a | |
| 103 | NGC 3368 | (0.45, 6.02) | SABa | 1.19 | 5.98 | 17.07 | 3.86 | 1.00 | 4.83 | 16.92 | 3.92 | 0.21 | 0.0517 | 9.81 0.1 | 10.7 | 6.89 0.09 | DGC19a | |
| 104 | NGC 3393 | I (HST) | (1.88, 4.52) | SBa | 1.14 | 1.64 | 17.27 | 3.82 | 1.36 | 1.77 | 17.63 | 3.68 | 0.27 | 0.2664 | 10.23 0.12 | 55.8 | 7.49 0.05 | DGC19a |
| 105 | NGC 3627 | (0.45, 6.02) | SBb | 3.17 | 11.07 | 18.44 | 3.32 | 2.10 | 3.92 | 16.98 | 3.90 | 0.28 | 0.0512 | 9.74 0.2 | 10.6 | 6.95 0.05 | DGC19a | |
| 106 | NGC 4151 | (0.45, 6.02) | SABa | 2.24 | 6.23 | 17.75 | 3.59 | 1.85 | 6.00 | 17.77 | 3.59 | 0.29 | 0.0916 | 10.27 0.15 | 19.0 | 7.68 0.37 | DGC19a | |
| 107 | NGC 4258 | (0.45, 6.02) | SABb | 3.21 | 41.8 | 20.14 | 2.64 | 2.60 | 26.4 | 19.73 | 2.80 | 0.34 | 0.0368 | 10.05 0.18 | 7.6 | 7.60 0.01 | DGC19a | |
| 108 | NGC 4303 | (0.45, 6.02) | SBbc | 1.02 | 2.28 | 16.51 | 4.09 | 0.90 | 2.16 | 15.78 | 4.38 | 0.20 | 0.0594 | 9.42 0.1 | 12.3 | 6.58 0.17 | DGC19a | |
| 109 | NGC 4388 | (0.45, 6.02) | SBcd | 0.89 | 21.68 | 21.68 | 2.02 | 1.15 | 14.3 | 19.82 | 2.77 | 0.24 | 0.0859 | 10.07 0.22 | 17.8 | 6.90 0.11 | DGC19a | |
| 110 | NGC 4501 | (0.45, 6.02) | Sb | 2.33 | 21.22 | 19.53 | 2.88 | 2.83 | 20.35 | 19.91 | 2.73 | 0.44 | 0.0541 | 10.11 0.16 | 11.2 | 7.13 0.08 | DGC19a | |
| 111 | NGC 4594 | (0.45, 6.02) | Sa | 6.14 | 44.94 | 19.38 | 2.94 | 4.24 | 41.36 | 19.46 | 2.91 | 0.35 | 0.0462 | 10.81 0.2 | 9.6 | 8.81 0.03 | DGC19a | |
| 112 | NGC 4699 | (0.45, 6.02) | SABb | 5.35 | 24.44 | 19.51 | 2.89 | 6.77 | 29.75 | 20.31 | 2.57 | 0.69 | 0.1141 | 11.12 0.26 | 23.7 | 8.34 0.10 | DGC19a | |
| 113 | NGC 4736bbThe morphology of these spiral galaxies listed on HyperLeda (Paturel et al., 2003) or NASA/IPAC Extragalactic Database (NED) suggests a weak bar, however, Davis et al. (2019) did not find evidence of an extended/intermediate bar in these galaxies but rather a nuclear bar. | (0.45, 6.02) | Sab | 0.93 | 9.79 | 16.17 | 4.22 | 1.03 | 9.65 | 16.31 | 4.17 | 0.22 | 0.0214 | 9.89 0.09 | 4.4 | 6.78 0.10 | DGC19a | |
| 114 | NGC 4826 | (0.45, 6.02) | Sab | 0.73 | 13.89 | 17.86 | 3.55 | 0.76 | 11.93 | 17.98 | 3.50 | 0.18 | 0.0269 | 9.55 0.22 | 5.6 | 6.07 0.15 | DGC19a | |
| 115 | NGC 4945bbThe morphology of these spiral galaxies listed on HyperLeda (Paturel et al., 2003) or NASA/IPAC Extragalactic Database (NED) suggests a weak bar, however, Davis et al. (2019) did not find evidence of an extended/intermediate bar in these galaxies but rather a nuclear bar. | (0.62, 5.08) | Sc | 3.40 | 26.33 | 18.48 | 3.06 | 3.19 | 13.93 | 17.99 | 3.26 | 0.40 | 0.018 | 9.39 0.19 | 3.7 | 6.15 0.30 | DGC19a | |
| 116 | NGC 5055 | (0.45, 6.02) | Sbc | 2.02 | 55.12 | 20.09 | 2.66 | 1.76 | 43.52 | 19.85 | 2.75 | 0.29 | 0.0429 | 10.49 0.11 | 8.9 | 8.94 0.10 | DGC19a | |
| 117 | NGC 5495 | I (HST) | (1.88, 4.52) | SBc | 2.60 | 3.75 | 20.21 | 2.65 | 2.46 | 3.99 | 20.23 | 2.64 | 0.36 | 0.4767 | 10.54 0.12 | 101.1 | 7.04 0.08 | DGC19a |
| 118 | NGC 5765b | I (HST) | (1.88, 4.52) | SABb | 1.46 | 1.11 | 18.72 | 3.25 | 1.51 | 1.00 | 18.83 | 3.21 | 0.28 | 0.6257 | 10.04 0.13 | 133.9 | 7.72 0.05 | DGC19a |
| 119 | NGC 6264 | I (HST) | (1.88, 4.52) | SBb | 1.04 | 1.13 | 19.23 | 3.06 | 1.35 | 1.05 | 19.37 | 3.00 | 0.27 | 0.7152 | 10.01 0.15 | 153.9 | 7.51 0.06 | DGC19a |
| 120 | NGC 6323 | I (HST) | (1.88, 4.52) | SBab | 1.60 | 1.53 | 20.39 | 2.58 | 1.15 | 1.71 | 19.98 | 2.75 | 0.22 | 0.5488 | 9.86 0.31 | 116.9 | 7.02 0.14 | DGC19a |
| 121 | NGC 7582 | (0.45, 6.02) | SBab | 2.20 | 5.33 | 17.04 | 3.88 | 2.21 | 4.55 | 17.66 | 3.63 | 0.35 | 0.0959 | 10.15 0.2 | 19.9 | 7.67 0.09 | DGC19a | |
| 122 | UGC 3789 | I (HST) | (1.88, 4.52) | SABa | 2.37 | 1.60 | 18.38 | 3.37 | 2.67 | 3.11 | 19.03 | 3.11 | 0.41 | 0.2372 | 10.18 0.14 | 49.6 | 7.06 0.05 | DGC19a |
| 123 | UGC 6093 | I (HST) | (1.88, 4.52) | SBbc | 1.55 | 1.84 | 19.27 | 3.04 | 1.41 | 1.27 | 18.87 | 3.20 | 0.26 | 0.7103 | 10.35 0.14 | 152.8 | 7.41 0.03 | DGC19a |
Note. — Column: (1) Galaxy name. (2) Wavelength-band () of the image used in parent studies (Column 18). Images for the first 41 galaxies were calibrated to Vega magnitude system and the images of the remaining galaxies (except the Milky Way) were calibrated to AB magnitude system. (3) The stellar mass-to-light ratio () and the absolute magnitude of the Sun () used to obtain the bulge stellar mass. Davis et al. (2019) used a reduced (by ) stellar mass-to-light ratio for their LTGs observed at -band following Querejeta et al. (2015) who reported on the dust glow at in LTGs. (4) Galaxy morphology based on the multi-component decomposition of the galaxy light performed in studies listed in Column 18. Galaxy mergers are highlighted with an . (5) Bulge major-axis Sérsic index parameter. (6) Bulge major-axis effective half-light radius. (7) Bulge surface brightness at the corresponding major-axis half-light radius listed in column 6. (8) Logarithm of the bulge intensity at the major-axis half-light radius in the units of , calculated using (Graham et al., 2006, their Equation 10). (9)-(12) Similar to columns (5)-(8), but obtained from an independent multi-component decomposition of the galaxy light profile along the equivalent-axis (). (13) Concentration index (C) calculated using the equivalent-axis bulge Sérsic index and Equation 6 from Trujillo et al. (2001) using . (14) Physical scale in , assuming cosmological parameters from Planck Collaboration et al. (2018). (15) Logarithm of the spheroid stellar mass in units of solar mass. (16) Galaxy distance in megaparsec. (17) Logarithm of the directly-measured black hole mass in units of solar mass. (18) Parent studies which performed multi-component decompositions to obtain the bulge parameters. Where SG16=Savorgnan & Graham (2016), SGD19a=Sahu et al. (2019a), DGC19a=Davis et al. (2019), GCS16a=Graham et al. (2016a) , GDS16b=Graham et al. (2016b), and GD07=Graham & Driver (2007a). Original sources for black hole mass and distances can be found in Savorgnan et al. (2016), and Sahu et al. (2019a) for ETGs and Davis et al. (2019) for LTGs.
| Category | Number | ||||
|---|---|---|---|---|---|
| dex | dex | dex | |||
| (1) | (2) | (3) | (4) | (5) | (6) |
| ETGs | 77 | 0.30 | 0.48 | ||
| LTGs | 38 | 0.20 | 0.29 | ||
| ETGs | 77 | 0.62 | 0.73 | ||
| LTGs | 38 | 0.63 | 0.69 | ||
| ETGs | 77 | 0.62 | 0.72 | ||
| LTGs | 38 | 0.64 | 0.68 | ||
| All Galaxies | 115 | 0.07 | 0.25 | ||
| ETGs with a disk | 39 | 0.51 | 0.60 | ||
| ETGs without a disk | 38 | 0.53 | 0.61 | ||
| ETGs | 77 | 0.56 | 0.60 | ||
| LTGs | 38 | 0.51 | 0.60 | ||
Note. — Columns: (1) Subclass of galaxy. (2) Number of galaxies in subclass. (3) Slope of the line obtained from the MPFITEXY(Bisector) regression. (4) Intercept of the line obtained from the MPFITEXY(Bisector) regression. (5) Intrinsic scatter in the vertical ( or )-direction. (6) Total root mean square (rms) scatter in the vertical direction.