Carrier Density and Thickness Dependent Proximity Effect in Doped Topological Insulator - Metallic Ferromagnet Bilayers
Abstract
We use magneto-conductivity to study the magnetic proximity effect on surface states of doped topological insulators. Our bilayers consist of a layer of Fe7Se8, which is a metallic ferrimagnet and a layer of Bi0.8Sb1.2Te3 which is a highly hole-doped topological insulator. Using transport measurements and a modified Hikami-Larkin-Nagaoka model, we show that the ferromagnet shortens significantly the effective coherence length of the surface states, suggesting that a gap is opened at the Dirac point. We show that the magnetically induced gap persists on surface states which are separated from the magnet by a topological insulator layer as thick as 170 [nm]. Furthermore, the size of the gap is found to be proportional to the magnetization that we extract from the anomalous Hall effect. Our results give information on the ties between carrier density, induced magnetization and magnetically induced gap in topological insulator/ferromagnet bilayers. This information is important both for a theoretical understanding of magnetic interactions in topological insulators and for the practical fabrication of such bilayers, which are the basis of various suggested technologies, such as spintronic devices, far infra-red detectors etc.
I Introduction
Strong topological insulators (TIs) are band insulators with time reversal symmetry protected gapless surface statesBernevig and Hughes (2013); Hasan and Kane (2010); Zhang et al. (2009). The dispersion of the surface states exhibits an odd number of massless Dirac fermions and a strong spin-momentum lockingBernevig and Hughes (2013); Zhang et al. (2009); Miyamoto et al. (2012); Kuroda et al. (2016). Magnetic fields normal to the surface will open a gap at the Dirac point Bernevig and Hughes (2013); Hasan and Kane (2010). Magnetically gapped surface states host a variety of fascinating phenomena, including the quantum anomalous Hall effect (QAHE)Okuyama et al. (2019); Lee et al. (2018).
One way to break time reversal symmetry is by interfacing a TI with a ferromagnetic (FM) material Okuyama et al. (2019); Lee et al. (2018); Otrokov et al. (2017); Lu and Shen (2014); Lu et al. (2011); He et al. (2017); Katmis et al. (2016); Wei et al. (2013); Lang et al. (2014). The surface states interact with the magnetic moments and acquire a magnetic proximity effect induced energy gapOkuyama et al. (2019); Lee et al. (2018); Wei et al. (2013). One major advantage of this method is the ability to pattern the FM layer and create spatially varying magnetic interactionsLindner et al. (2014).
Magnetic proximity effect induced energy gaps on surface states in TI/FM bilayers may result for two different mechanismsLi et al. (2015): 1) induction of spin polarization in the TI. 2) exchange mechanisms such as RKKY that couple the surface states and the magnetic material leaving the TI non-magnetic Li et al. (2015). Polarized neutron reflection and magnetic second harmonic generation measurements show that only 1-2 nanometers in the TI are magnetized by the magnetic interfaceKatmis et al. (2016); Li et al. (2017); Lee et al. (2016). However, magnetic exchange coupling in FM/Metal structures can penetrate tens of nanometers into the metalLi et al. (2015); Bruno and Chappert (1992).
While magnetic proximity effect is known to gap the surface states on the interface that is in direct contact with the FMOkuyama et al. (2019), an important question is whether magnetic exchange coupling can also gap surface states that are not in direct contact with the FM. This remains so far an open questionOkuyama et al. (2019); Lee et al. (2018); Yang et al. (2013, 2019); Zheng et al. (2016); Lee et al. (2014). In this work, we studied this question for FM/doped-TI bilayers, for which one of the surface states is in direct contact with the FM, while the opposing (exposed) surface is separated from the FM by the TI bulk.
Direct ways to probe the surface states dispersion are angle-resolved photoemission spectroscopy (ARPES) and scanning tunneling microscopy (STM). However, these are surface methods that require high quality surfaces which are difficult to achieve in TI/FM bilayers. Simpler methods to probe the surface states energy gap involve electrical transport measurements. The anomalous Hall effect in the TI can indicate time reversal symmetry breaking and gapped surface statesYang et al. (2013); Tang et al. (2017). Furthermore, the surface states gap strongly affects the magneto-conductivityLu and Shen (2014); Lu et al. (2011). The gap size can be calculated using a modified Hikami-Larkin-Nagaoka (m-HLN) equationLu and Shen (2014); Lu et al. (2011). We discuss this equation in section II.
Naturally, insulating TIs and FM are preferable to explore the surface states gap using transport measurements. Thus, previous transport studies on TI/FM bilayers used low carrier density ultra-thin TIs and insulating FM Lee et al. (2018); Lu and Shen (2014); Lu et al. (2011); He et al. (2017); Katmis et al. (2016); Wei et al. (2013); Lang et al. (2014); Li et al. (2017); Yang et al. (2013, 2019); Zheng et al. (2016); Tang et al. (2017); Kandala et al. (2013). However, low carrier density samples might lack the exchange mechanisms needed to open a gap in the exposed surface states, since exchange mechanisms are highly sensitive to carrier densityLi et al. (2015); Bruno and Chappert (1992); Kim et al. (2011); He et al. (2011); Wang et al. (2016); Bansal et al. (2012). We therefore used doped TIs in this study.
In addition, proximity to a FM metal can be considerably different from a proximity to a FM insulator. This is because the metal can modify the TI’s band structure, chemical potential and the magnetic coupling mechanismMarmolejo-Tejada et al. (2017); Hsu et al. (2017); Li et al. (2015); Li (2015). Therefore, in this study we focused on TI/FM metal bilayers. This is also of practical interest since there are only a few TI-compatible ferromagnetic insulators and some possible TI/FM applications require a FM metalMellnik et al. (2014).
Here, we study the electrical transport properties of highly doped TI/FM-metal bilayers with varying TI thicknesses and carrier densities. By fitting the bilayers magneto-conductivity with the modified Hikami-Larkin-Nagaoka model Lu and Shen (2014); Lu et al. (2011) for surface states magneto-conductivity we extract the magnetic proximity effect induced energy gap. Our results indicate a long-range, carrier density dependent proximity effect which gaps both surface states, the one in direct contact with the FM but also the surface states on the exposed surface of the TI. We also verify the validity of m-HLN equation in our system despite the large amount of bulk conducting channels.
II Results and Discussion
Figure 1 shows the structure of our bilayers. The TI layer is a highly p-type doped film with thickness ranging from 17 [nm] to 170 [nm]. This compound has an hexagonal lattice structure and a 0.3 [eV] band gapZhang et al. (2011); Weyrich et al. (2016). We note that for TIs thinner than 5 [nm] the surface states may be gapped due to a hybridization between themOkuyama et al. (2019); Zhang et al. (2010). As we show, the thickness variation results also in carrier density variation, enabling us to study both thickness and carrier density effects.
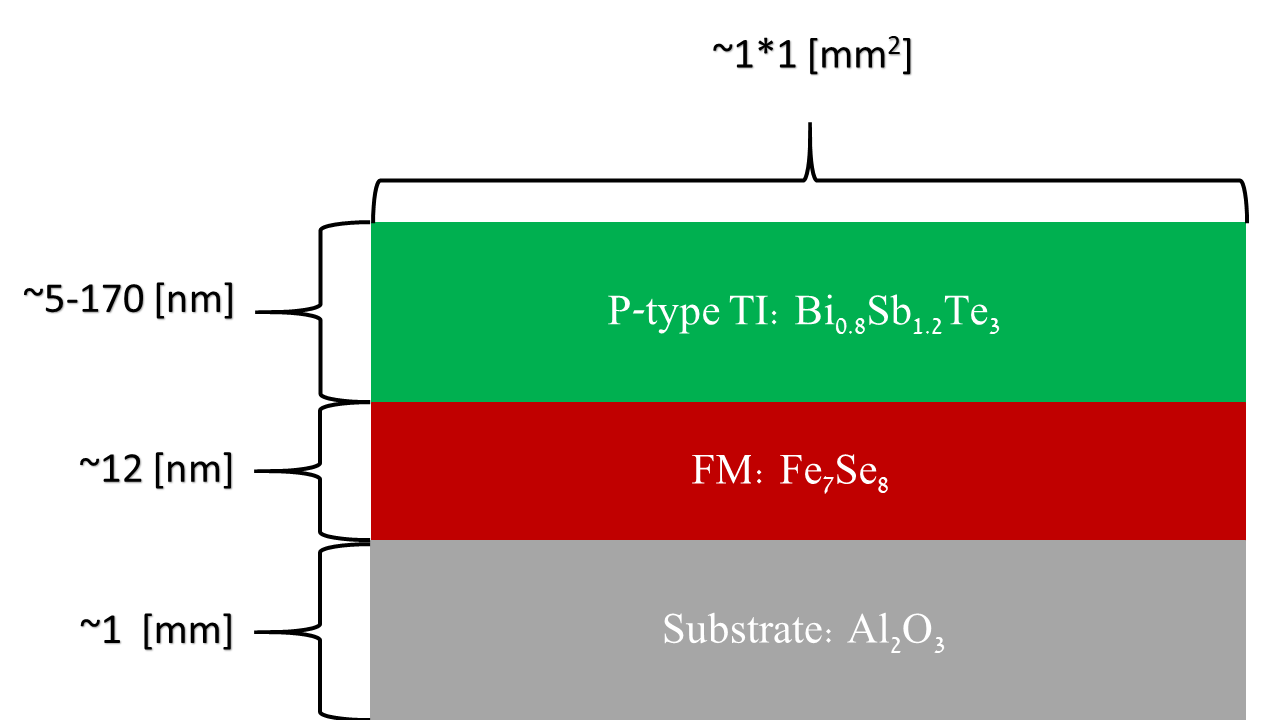
The FM layer is a film, which is a hexagonal metallic ferrimagnet with and a canted easy magnetization axisTakemura et al. (1997); Terzieff and Komarek (1978). We grew the bilayers on substrates using pulsed laser deposition (PLD) at 280 [C] and a pressure of . X-ray diffraction shows that the FM and the TI grow along the c-axis, with grain size of about 45 [nm] (see appendix E). The FM layer thickness was 12 [nm] in all of the bilayers. All transport measurements were done at T=1.5 [K] using the standard 4-contact Van-der-Pauw (VDP) technique.
Surface states properties: The film out-of-plane magnetization component opens an energy gap () at the Dirac node of the surface states dispersion. In this case, the surface states magneto-conductivity (MC) obeys a modified Hikami-Larkin-Nagaoka modelLu and Shen (2014); Lu et al. (2011) (m-HLN). We begin our analysis using the small-gap limit of the model (for details see appendix A):
| (1) | ||||
| (2) |
Where is the MC of one surface and is the digamma functionLu and Shen (2014); Lu et al. (2011). The parameter is the magnetic length. The length scale is the effective coherence length of the surface states in the presence of an induced gap. As indicated by Eq. 2, depends on , which is the surface states coherence length; , which is the elastic mean free path; and is the normalized magnetically induced energy gap. Furthermore, in Eq. 1 and are functions of , whose form is given in appendix A Lu and Shen (2014); Lu et al. (2011).
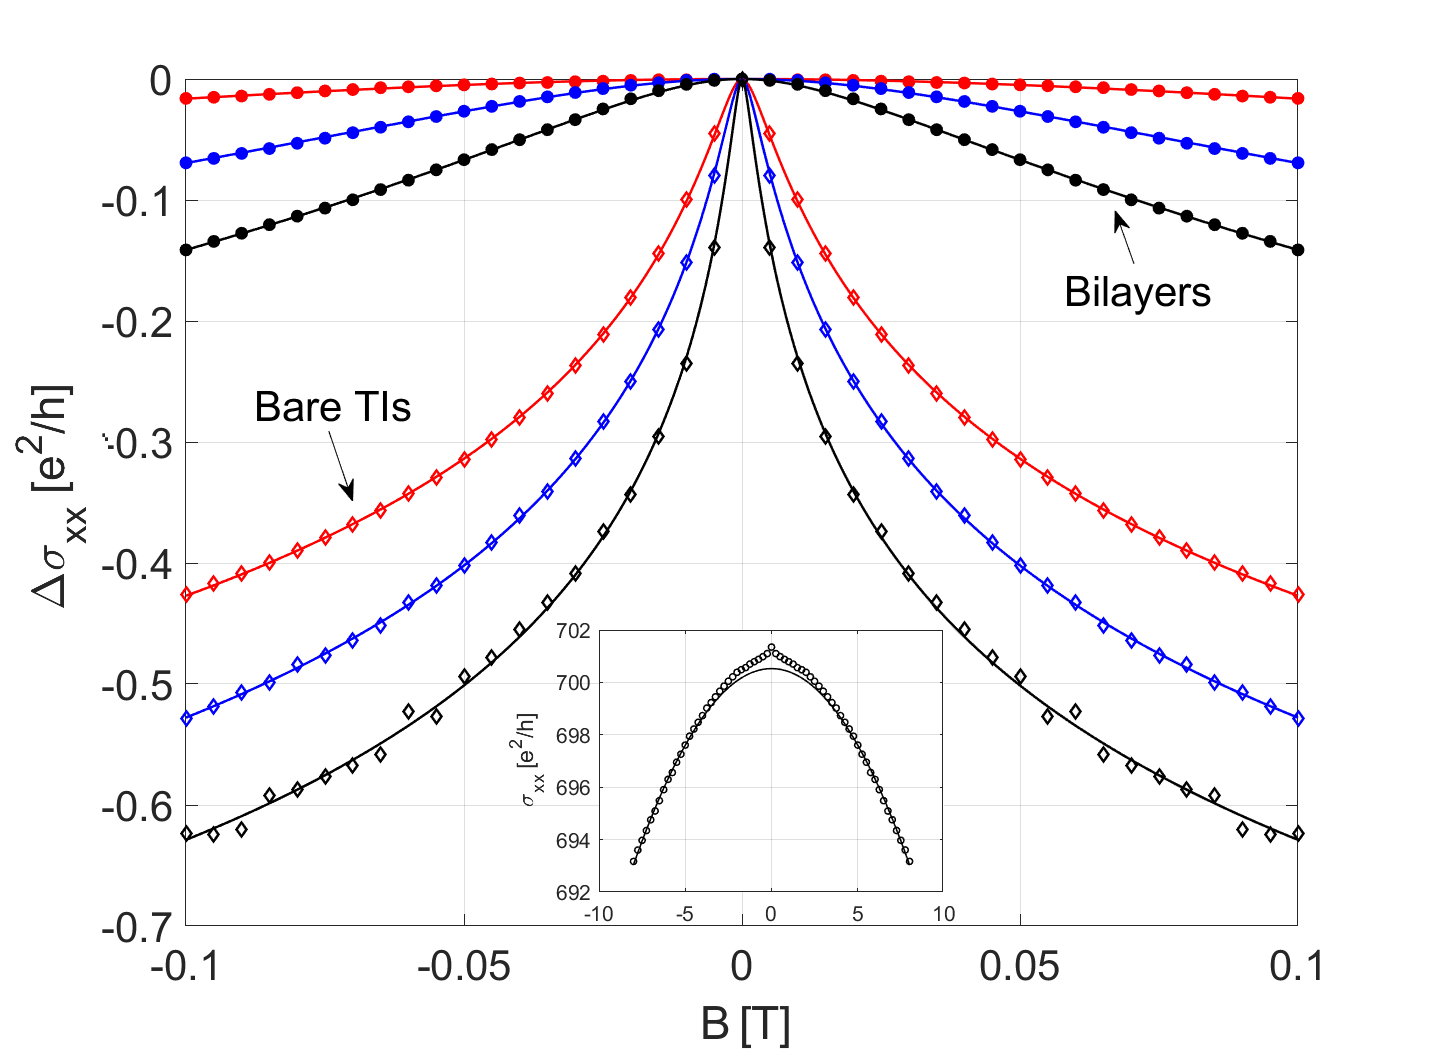
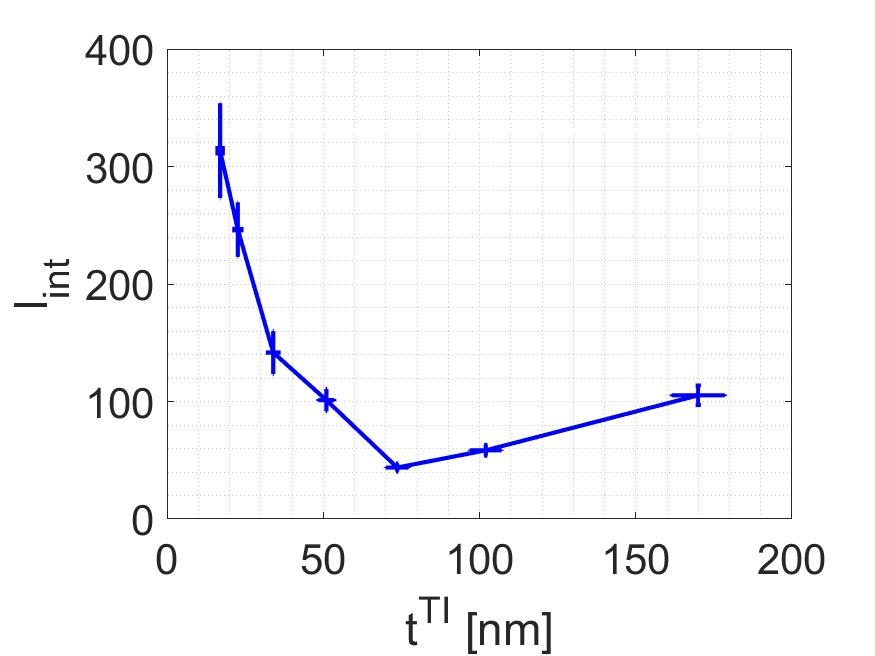
We can therefore study magnetic interactions in our bilayers by fitting the MC signal with Eq. 1. In Figure 2 we show a comparison between the MC data of a bilayer and a bare TI film for several different TI thicknesses. We fitted the data with the m-HLN model for the MC given by Eq1. Below we show that the bilayer MC data is dominated by the exposed surface states and not by other transport channels, and discuss the fitting parameters of Eq. 1. Afterwards we return to our main topic which is the extracted energy gap () properties.
Transport channels analysis: Eq. 1 gives the conductivity of a system with a single 2D massive Dirac Fermion dispersion. The good quality of the fitting of Eq. 1 to our data demonstrates the surface states robustness even in proximity to a FM-metal interface Marmolejo-Tejada et al. (2017); Hsu et al. (2017). It also indicates that the MC of both the and the TI bulk are negligible.
To verify that the MC is negligible we had measured a bare film and found MC values below of the total MC of the BLs. For the TI bulk, the MC can have different contributions. First, the classical Kohler equationKim et al. (2011); He et al. (2011) term: , with the mobility. By fitting this equation to the high-field MC data and extrapolating down to zero field, we found that the this term is an order of magnitude smaller than the total MC of the bilayers. The inset in Fig. 2 shows this fit for a bilayer with 170 [nm] thick TI (thickest in this study). From this fit we obtained a mobility of about 90 [cm2/(vs)]. This mobility value is within from the value obtained by Hall measurements, which verifies our MC extrapolating procedure.
Previous studies have shown that in thin TI films the bulk MC could also have a weak anti-localization term due to strong spin-orbit couplingKim et al. (2011); Steinberg et al. (2011). This gives a term similar to Eq. 1 with Kim et al. (2011); Steinberg et al. (2011) and a zero magnetically induced energy gap. However, other studies have shown experimentally that the bulk weak anti-localization term is smaller than of the surface termHe et al. (2011), or even negligiblePark et al. (2018); Li et al. (2019). Moreover, for 73-170 [nm] thick TIs we found lower bulk carrier density and higher bulk mobility in the bilayers than in the bare TI films (see below how we extracted these properties in the bilayers). The opposite behaviour is found for the thinner samples. The bulk coherence length is proportional to the mobility and is inversely proportional to the carrier densityKim et al. (2011). The weak anti-localization term is stronger for higher coherence lengths (equation 1). Therefore if the bulk term would be significant in our samples, we would get a higher MC in the bilayers with 73-170 [nm] thick TI than in the bare TIs. This is clearly not the case in figure 2, where the MC is much higher in the bare TIs for every TI thickness. We therefore conclude that we can neglect the bulk anti-localization term in our samples.
Although a TI layer has two surfaces and sometimes also a bulk channel as mentioned above, the MC data can be fitted using Eq. 1 which corresponds to a single surface. This was reported in several previous works Kim et al. (2011); Wang et al. (2016); Bansal et al. (2012); He et al. (2011); Zhang et al. (2012); Steinberg et al. (2011); Park et al. (2018); Li et al. (2019). The amplitude however may vary from the theoretically predicted of , depending on sample propertiesKim et al. (2011); Wang et al. (2016); Bansal et al. (2012); He et al. (2011); Zhang et al. (2012); Steinberg et al. (2011); Park et al. (2018); Li et al. (2019). One common explanation is that the two surfaces (and the bulk) can couple even for TI thickness of 100 [nm]Kim et al. (2011); Wang et al. (2016); Bansal et al. (2012); Steinberg et al. (2011); Park et al. (2018); Li et al. (2019). This results in when all channels are coupled, or per channel when the channels are fully decoupledSteinberg et al. (2011); Park et al. (2018). In our samples we got for all thicknesses, both in the bare TIs and bilayers.
However, the two surfaces cannot couple if their coherence length is smaller than sample thicknessSteinberg et al. (2011); Park et al. (2018). Figure 3a shows that the coherence length is smaller than the thickness in the bilayers with 100-170 [nm] thick TI. Coupling between the surfaces should not occur in these samples and should equal 1Steinberg et al. (2011); Park et al. (2018), but this is not the case as mentioned above. We therefore have to conclude that there is one surface which dominates our MC data, and possibly smaller contributions from the other surface and the bulk. The surface states coherence length at the interface is generally smaller than at the exposed surface due to enhanced strain and defects at the interfaceHe et al. (2011); Zhang et al. (2012). In our bilayers there should be also stronger magnetic interactions at the interface which can further reduce the coherence lengthLu and Shen (2014); Lu et al. (2011). We therefore conclude that the surface states at the exposed surface dominates our MC data. Consequently, the magnetically induced energy gap we are going to extract is a property of the exposed surface.
This is a crucial point in our analysis. In appendix F we give another detailed justification for this conclusion. One important consequence is that we cannot explain the reduced bilayer MC as a result of magnetic scattering at the surface alone, because there are no magnetic particles at the exposed surface. Moreover, it allows us to use the MC data to study the thickness dependence of the magnetically induced energy gap, since the thickness should affect mainly the exposed surface states, or the coupling of these states to the magnetic interface.
Normalized energy gap extraction: In the m-HLN model the function in Eq. 1 depends solely on Lu and Shen (2014); Lu et al. (2011), but previous studies have shown that this is true only up to an experimental prefactor, due to coupling between different transport channels and other interactionsKim et al. (2011); He et al. (2011); Zhang et al. (2012); Wang et al. (2016); Bansal et al. (2012). The experimental prefactor masks the dependence of on , so we can regard as an independent parameter. Consequently, there are two independent fit parameters in Eq. 1: and the effective coherence length . Below we explain how we estimated the different contributions of the gap, the mean free path, and coherence length to the effective coherence length (Eq. 2).
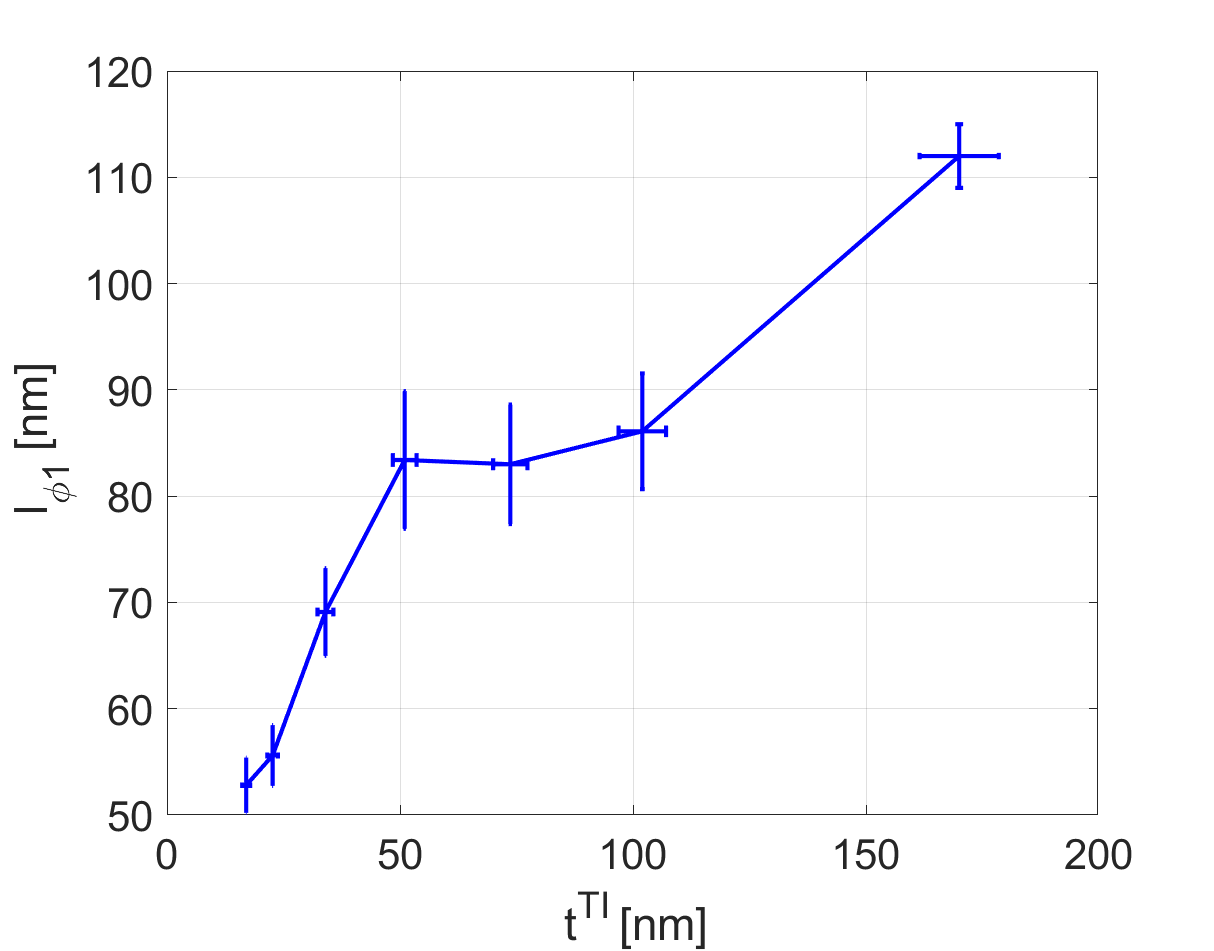
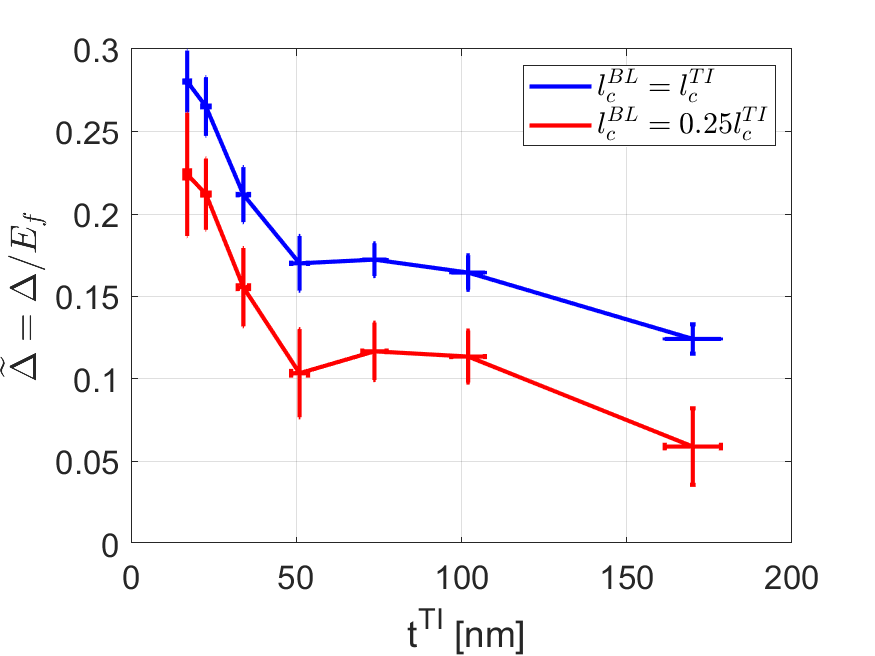
Figure 2 shows a strong effect of the FM layer on the TI surface states transport properties, as expected if the surface states are gappedLu and Shen (2014); Lu et al. (2011). The gap reduces the surface states coherence length (Eq. 2) and consequently reduces their MC (Eq. 1). Figure 3a shows the values for bilayers with various TI thicknesses and a constant 12 [nm] FM. The bilayers’ are of order 100 [nm], much shorter than in bare TI films where we found of order 500 [nm]Lu and Shen (2014); Lu et al. (2011). We therefore argue that the exposed surface states acquire a gap by a magnetic proximity effect, and that this gap dictates the bilayer short effective coherence length, (see Eq. 2). Below we further justify these conclusions by showing self-consistency with other parts of our data. In particular, we show that the gap is proportional to the magnetization we extract from the anomalous Hall data. We also explain below and in appendix E why we claim that the reduced effective coherence length is due to magnetic effects and not due to structural differences between the bare TIs and the TI layers in the bilayers.
To extract the normalized energy gap quantitatively we assumed that in the bilayers is the same as in the bare TIs. Under this assumption, we used the full m-HLN equation to fit the MC data and extract (see appendix A for details). Figure 3b shows of the bilayers as a function of TI thickness. The values we find correspond to energy gaps between and . We also compare between the results we got by assuming that values in the bilayers equal of the bare TIs (blue), and the results we got for fourth of this value (red). As figure 3b shows, our assumption is robust and the results remain almost the same, as long as is at least 20% of in the bare TIs. Our results show that the exposed surface states are gapped even in the thickest bilayer with a 170 [nm] TI layer, suggesting a coupling between the magnetic interface and the exposed surface states. As we will show below, this coupling highly depends on the TI bulk carrier density and thickness.
Figure 3b shows that has an inflection point as a function of thickness between 50 [nm] and 100 [nm]. Below we show that this corresponds to a minimum in the bulk magnetization and carrier density. To study this point, and since the magnetic coupling and could depend on the TI carrier densityLi et al. (2015); Bruno and Chappert (1992); Kim et al. (2011); He et al. (2011); Wang et al. (2016); Bansal et al. (2012) and magnetizationLu and Shen (2014); Lu et al. (2011), we discuss now these properties.
Thickness dependent bulk carrier density: Figure 4 shows the carrier density of the TI layer as a function of its thickness. Note that in the notation we mean of the TI bulk. Importantly, is minimal where the gap has its inflection point (Fig. 3).
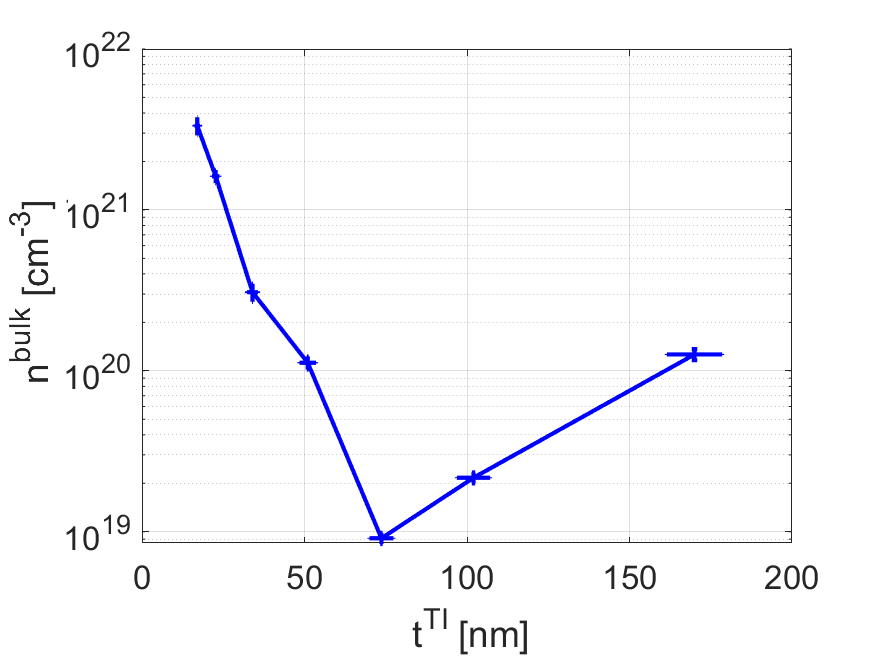
We extracted from Hall measurements using the Drude model for conductors connected in parallel. We only needed to consider the FM layer and TI bulk transport channels because the high resistance of the surface states makes their contribution negligible Weyrich et al. (2016). The Drude model gives:
| (3) |
Where and are the measured Hall coefficient and linear resistance of the bilayer. We used the approximation with the thickness and the mobility since in our samples . Note that Eq. 3 holds only for the linear Hall terms without the anomalous Hall terms which are a function of sample magnetization (see below). We extracted the linear terms from the high magnetic field data where the magnetization saturates.
To extract the TI bulk properties from Eq. 3 we need and . We could not measure them directly from a bare FM because the TI layer growth changes the FM properties. We thus grew a bilayer with only 5 [nm] thick TI layer, where we assumed that the FM layer dominates the transport properties. This assumption is justified by the resistance of a bare 5 [nm] thick TI film being ten times larger than that of a 12 [nm] thick FM film. Therefore, we used the measured properties of the BL with 5 [nm] TI to represent the properties of the FM layer in our analysis. For example, we took .
The carrier density non-monotonic behavior (Fig. 4) may result from a combination of different reasons. First, lattice mismatch creates strain and defects that decrease with film thickness. Second, the metal-semiconductor interface leads to a band bending due to the Shottky barrier effectBart Van Zeghbroeck (2008). Third, diffusion from the layer can reduce hole concentration since is an electron donor in compoundsRen et al. (2011); Arakane et al. (2012); Neupane et al. (2012). Different thickness dependence of the various contributions to the carrier density variation can lead to a non-monotonic carrier density thickness dependence. However, to quantify these effects will require a detailed chemical and structural study, which is beyond the scope of this paper.
Bulk magnetization: We turn now to the magnetization. In a FM, the Hall resistivity includes an anomalous Hall effect (AHE) term that is proportional to perpendicular magnetizationShiomi (2013); Nagaosa et al. (2010):
| (4) |
With and being the out of plane component of magnetic field and bilayer magnetization, respectively. According to the theory of Luttinger and Berger, with and a constant. For simplicity we take .
To differentiate between the ordinary and anomalous terms we take the symmetric part with respect to the magnetic field: . Figure 5a shows for a bare 12 [nm] thick film (black, right axis) and three bilayers (colored, left axis).
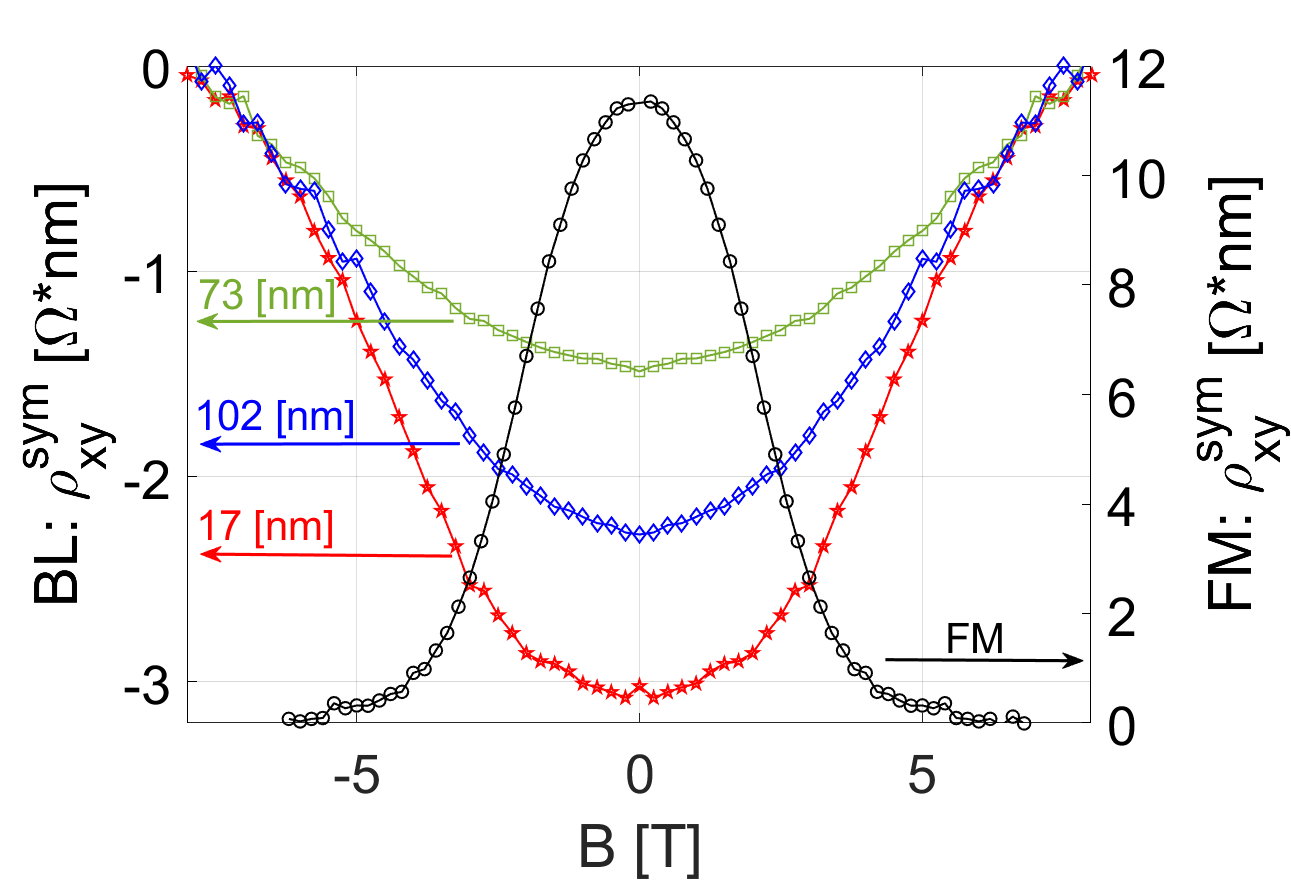
Intriguingly, the bilayers have a negative AHE term while in the bare Fe7Se8 the sign is positive. The bilayer curves FWHM is wider, namely their coercive fields are higher than that of the bare Fe7Se8.
Previous works have shown negative AHE terms in TI/FM-insulator bilayers, where the AHE arises from the TI layer Lang et al. (2014); Tang et al. (2017); Yang et al. (2019). They have also shown that the FM magnetization penetrates the TI layer with a flipped direction, explaining the negative AHELang et al. (2014). Bulk mediated magnetic exchange coupling is also diamagnetic in compoundsLi et al. (2015). We therefore conclude that the TI layers have the dominant contribution to the AHE of the bilayers. The AHE in the TI is indicative of time reversal symmetry breaking and gapped surface statesYang et al. (2013); Tang et al. (2017), as we argued by analyzing the effective coherence length (Fig. 3a).
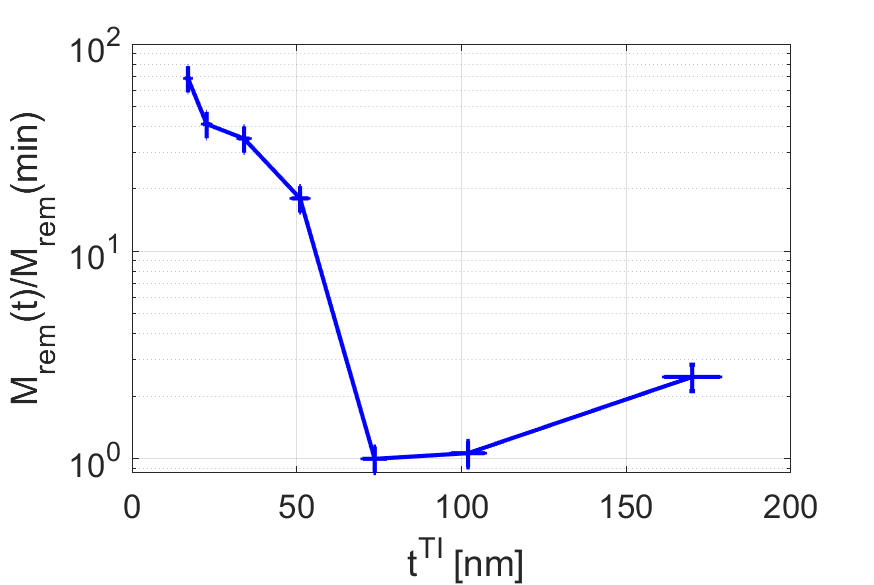
We are interested in the zero field surface states energy gap so we will focus now on the remnant magnetization, defined as the magnetization at zero external magnetic field. Using Eq. 3 and Eq. 4 we can write (appendix B):
| (5) |
Figure 5b shows vs TI thickness normalized by its minimal value. A non-zero value of leads to a gap in the surface states. Notably, the remnant magnetization and carrier density (Fig. 4) share a minimum just where the normalized magnetic gap has its inflection (Fig. 3).
Analyzing the gap using bulk properties: So far we only discussed the normalized gap, , which we obtained from the m-HLN fit. To estimate the actual gap values we first need to estimate . Using the parabolic band approximation, we can write:
| (6) |
Here, is the effective electron mass and is the carrier density of the TI layer (Fig. 4).
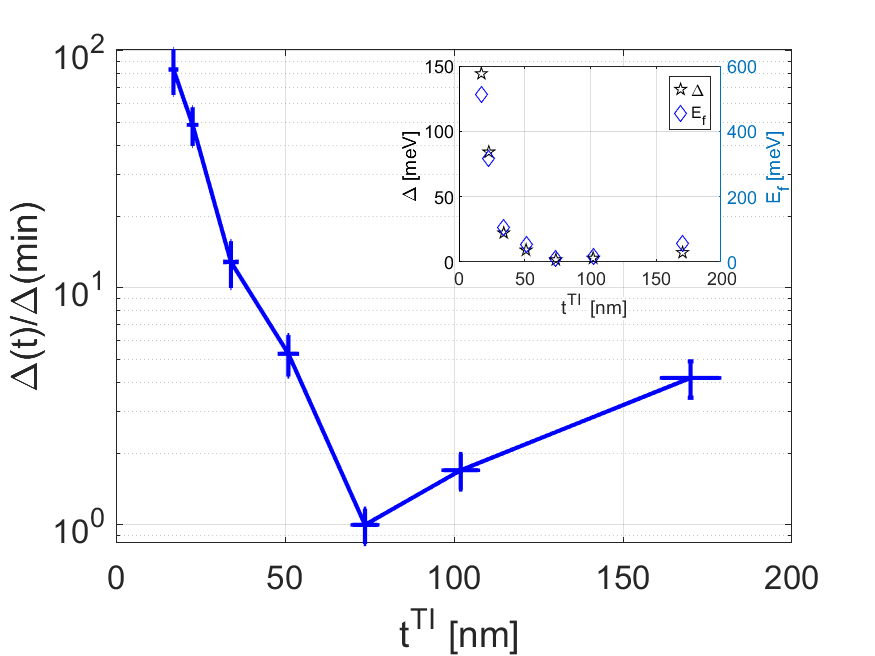
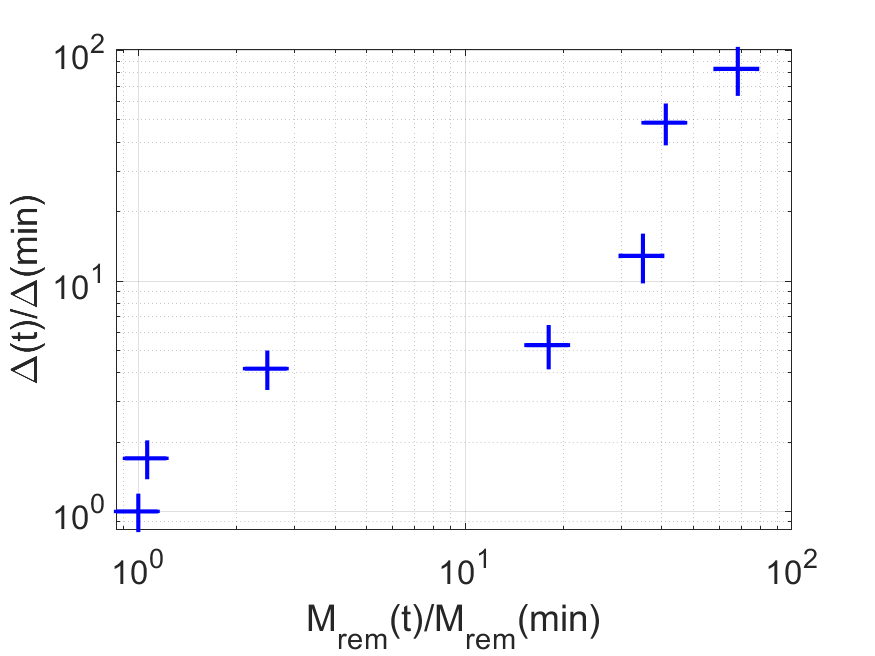
Figure 6a shows the magnetic gap as a function of the TI layer thickness. We normalized the values by the minimal value to cancel the mass prefactor. Figure 6b shows a clear correlation between the bulk magnetization and the energy gap. We note that this correlation verifies our assumption that the clear difference between the magneto-conductivity of the bilayers and bare TI films (Fig. 2) is due to a gap opening in the surface states. The gap must be opened since the sample magnetization breaks time reversal symmetryBernevig and Hughes (2013); Hasan and Kane (2010).
Previous works found that the bulk states effective electron mass in compounds is about one electron massMadavali et al. (2019); Whitney et al. (2017). Inserting in Eq. 6 we get values of 10-400 [meV] and corresponding magnetic gap values of 1.5-120 [meV], depending on TI thickness. These gap values are similar to gaps reported in other TI/FM systemsOkuyama et al. (2019); Yang et al. (2019); Zheng et al. (2016). However, the parabolic band approximation does not fully describe the band structure of , so the real gap values may differ from our estimation.
The results indicate that there is a gap even for the thickest TI layer of 170 [nm]. A natural length scale for exchange interactions isBruno and Chappert (1992)
| (7) |
Using the parabolic band approximation with and our carrier densities we get length scales of 45-300 [nm]. For example, is about 100 [nm] in our 170 [nm] sample. These length scales are of the same order of magnitude as the samples thickness which can explain how we found proximity effect is such thick samples.
The minimum in the energy gap that we find for a specific thickness may seem surprising. One would expect the interactions between the exposed surface states and the magnetic interface to decay monotonically with the TI thickness. However, the interaction length scale depends on which is a function of the carrier density. This can result in a non-monotonic thickness dependence of the exchange interaction, because the carrier density dependence on the thickness is non monotonic in our bilayers (Fig. 4).
In our bilayers we grew the TI layers on the FM layer, while we grew the bare TIs directly on the substrate. Therefore one might assume that the reduced surface states effective coherence length (figures 2 and 3) is due to stronger strains and smaller grain size, and not due to magnetic proximity effect as we suggest here. Indeed, using X-ray data we show in appendix E that there is slightly higher strain in the TI layers of the bilayers compared to the bare TIs. However, we show that this is a tensile in-plane strain, which is known to enhance surface properties and therefore cannot reduce the coherence length in the bilayers Liu et al. (2014). We also show in appendix E that the TI grain size is about 45 [nm] both in the bare TIs and the bilayers, confirming that grain size difference is not responsible for our results. Moreover, in appendix D we explain why we could neglect possible effects of Fe doping of the TI layer from the underlining FM layer in our analysis.
Previous publications have shown that ferromagnetism penetrates only 2 [nm] into the TIKatmis et al. (2016); Li et al. (2017). This might seem in contradiction with our results. However, in these publications the films have very low carrier concentration of , and the measurements were done at a slightly higher temperature where equation 7 indeed predicts a small magnetization penetration length of . More importantly, these publications present induction of ferromagnetism into the TI, while RKKY-like interactions are antiferromagnetic. It might be that only a small portion of our TI layers is ferromagnetically magnetized and gives the AHE signal. However, the exposed TI surface can still interact with this ferromagnetic part via bulk states mediated long ranged RKKY-like antiferromagnetic interactionsLi et al. (2015); Bruno and Chappert (1992). Such interactions break the time reversal symmetry of the exposed surface states He et al. (2017) and open a gap.
III Summary
In this study we measured the electrical transport properties of doped-TI/FM-metal bilayers, made of 17-170 [nm] on 12 [nm] . By fitting the low field MC data to the m-HLN model we demonstrated its validity in doped-TI/FM-metal interfaces. As a fit parameter we extracted the exposed surface states effective coherence length , which is a geometric average of the coherence length and a term arising from a magnetically induced gap.
We compared the MC and between our bilayers and bare TIs and showed that in the bilayers is much shorter. We therefore argued that the gap term dominates in the bilayers. Assuming that the ordinary coherence length of the surface states in the bilayers is not changed by more than a factor of five compared to its value in the bare TIs, we extracted the normalized gap . We found that the normalized energy gap of the exposed surface states remains finite even for a 170 [nm] thick TI layer. This indicates a coupling between the magnetic interface and the exposed surface states which is mediated by the bulk states. We conclude that high bulk carrier densities of are necessary for the coupling in such thick layers.
To justify our analysis, we first showed a strong correlation between the carrier density the magnetization and . Second, we showed that the bilayer anomalous Hall signal is dominated by the magnetic interactions inside the TI layer. Such magnetic interactions break time reversal symmetry in the TI and open a gap in the surface states. Lastly, using a simple model for the electronic dispersion we showed that for thin bilayers (where data by other groups exists) the gap values we found are comparable to values found in other TI/FM systemsOkuyama et al. (2019); Yang et al. (2019); Zheng et al. (2016).
More studies with different FM materials and TI thicknesses and carrier densities, as well as direct energy band measurements, are needed to fully understand the physical mechanism behind the carrier density and thickness dependent magnetic proximity effect we found in this study.
IV Methods
We grew our bilayers on polished substrates of a area and 0.1 [cm] thickness. The average substrate RMS roughness was below 0.5 [nm]. Before each bilayer growth we used a mask during the deposition to pattern the bilayers into a VDP compatible geometry. After annealing the substrate at 330 [C] for an hour, we had used a homemade pulsed laser deposition (PLD) device to grow the bilayer. The base pressure of the deposition chamber was . The substrate temperature was 280 [C] for both and layers. In the PLD process we used a 355 [nm] Nd:YAG laser with a 1 [Hz] repetition rate for the and 3 [Hz] for the . The pulse energy flux was and respectively. The target was a pressed pellet of powders of and with a ratio of . The target was a pressed pellet made of grounded single crystals.
We characterized the bilayers orientation and phase using a Bruker D8eco X-ray diffractometer, and found the characteristic c-axis peaks of the and phases. We measured thickness and roughness using a Veeco Wyko NT1100 profilometer. The characteristic bilayer RMS roughness was below 2 [nm]. To verify the bilayers stoichiometry and homogeneity we used a Quanta SEM-EDS. We did not find any detectable chemical inhomogeneity up to the device resolution. To further analyze the thickness dependent chemical composition and the quality of the interface we used TOF-SIMS. We discussed the results in the main text.
For electrical transport measurements we used an Oxford Teslatron and homemade electronics. We made the contacts from silver paint in a 4-contacts Van der Pauw configuration (VDP). The bilayer’s area was 1*1 [mm], and the thicknesses were 5-170 [nm]. The contacts area was less than of the sample size and reciprocity theorem was valid within , which hold with VDP measurement requirements. We conduct all magneto-transport measurements with DC source current of 0.75 [mA] at 1.5 [K] with temperature fluctuations of .
V Data availability
The data that support our findings are available from the corresponding author upon reasonable request.
VI Acknowledgments
We thank B. Shapiro and E. Akkerman for useful discussions. This work was supported by the Israel Science Foundation grant no. 320/17. Y. Jarach was supported by the Israel Ministry of Energy under the program of BSc to PhD students scholarships in the field of energy.
Appendix A The Modified HLN formula for Surface States
For the massive Dirac cone dispersion, the magnetoconductivity can be fitted by a modified HLN formulaLu and Shen (2014); Lu et al. (2011) with an experimental global pre-factorKim et al. (2011); He et al. (2011); Zhang et al. (2012); Wang et al. (2016); Bansal et al. (2012):
| (8) |
Where A is the experimental prefactor, is the magnetic length, and , is the surface states’ phase coherence length, and (the digamma function) . For , the mean free path and , the and parameters are given byLu et al. (2011):
| (9) | |||||
| (10) | |||||
| (11) | |||||
| (12) |
For pure weak antilocalization, namely without magnetic interactionsLu and Shen (2014); Lu et al. (2011), . By fitting the magnetoconductivity data with this formula the normalized magnetically induced energy gap, , can be extracted. This formula assumes and Lu and Shen (2014); Lu et al. (2011), which limits its validity only for in topological insulators where Lu et al. (2011). It also assumes that the phase coherence length includes all the information about disorder and scattering from magnetic impuritiesLu et al. (2011).
The full model have four fit parameters- A, , and . In the low magnetically induced energy gap limit is smaller than and the MC is mainly dominated by the and terms. In this case the experimental prefactor almost masks the dependence on since the prefactor also depends on sample properties. In addition, depends on parameters , and . Hence, in the low gap limit there are two dominant effective fit parameters, A and , and one cannot get a trustworthy MC fit using all four parameters. To simplify notations we define when we discuss this limit in the article (Eq. 1).
In this article we expect energy gaps in the low gap regime, so we begin with analysis of this limit (see the discussion of Eq. 1 and its results in the main text). This is self-consistent with our results. However, to disentangle the gap term from the mean free path we need the full model (Eq. 8). To do this despite the low gap limit fitting problems just discussed, we first show that our results really indicate that such a gap indeed exists. Next, we show that the bilayer fitted values are about five times smaller than the real coherence length in bare TIs. This allows us to assume that in the bilayer, the real coherence length contribution to is small. Therefore, in the bilayers we did not use as a fit parameter but substitute its values with the values obtained for bare TI films. This process is valid unless the bilayer is about five times smaller than in the bare TI films. After concluding that a gap exists, and substituting , we only used the full model to separate the contributions of and to and .
Appendix B Calculation of the remnant magnetization
In a system where only the ordinary Hall effect takes place the transverse resistance is , with ; the out-of-plane magnetic field; the 3D carrier density; the thickness; and the electron chargeShiomi (2013); Nagaosa et al. (2010). As explained in the main text (see Eq. 3 in the main text), we can get the total transverse (Hall) resistance of our bilayers by using the Drude model for parallel connection of the FM layer and the TI bulk:
| (13) |
where and are the values we got from measurements of the transverse and parallel resistance of a bilayer, respectively. The TI surface states are negligible here due to their high parallel resistance .
In a general system with the anomalous Hall effect, the transverse resistance takes the formShiomi (2013); Nagaosa et al. (2010):
| (14) |
is the out-of-plane magnetization component. In the main text we discuss and explain that according to anomalous Hall effect theories we can approximate with C a constantShiomi (2013); Nagaosa et al. (2010). Since , we can write .
In the main text we conclude that the TI layer has the largest contribution to the AHE of the bilayers. Therefore, we neglect the anomalous term of the FM layer. Now, in Eq. 13 we can replace with (ordinary Hall term), and with Eq. 14. We therefore get:
| (15) |
We are interested in the remnant magnetization, namely the magnetization at zero external magnetic field. Substituting we get:
| (16) |
Since the magnetization term comes from the TI, then so finally we get:
| (17) |
Now we can extract the remnant magnetization:
| (18) |
Appendix C A simple model for the remnant magnetization
To get some insights into the non-monotonic thickness dependence of the bilayers remnant magnetization (and as a result, of the energy gap), we use a simple exponential decay model:
| (19) |
Here is the sample magnetization and is the distance from the FM layer. is the magnetization at the FM-TI interface. We assume that the FM dictates such that it is sample independent. The magnetic interaction length is:
| (20) |
where is the Fermi velocity and is the temperature. We can calculate under the parabolic band approximation using Eq. 20 and the TI bulk carrier densities (Fig. 4 in the main text). Fig. 7a shows of the bilayers vs the TI layer thickness. Up to our thickest TI layer (170 [nm] thick) the magnetic interaction length remains of the same order as the TI thickness. This explains how the gap is finite even in such thick samples.
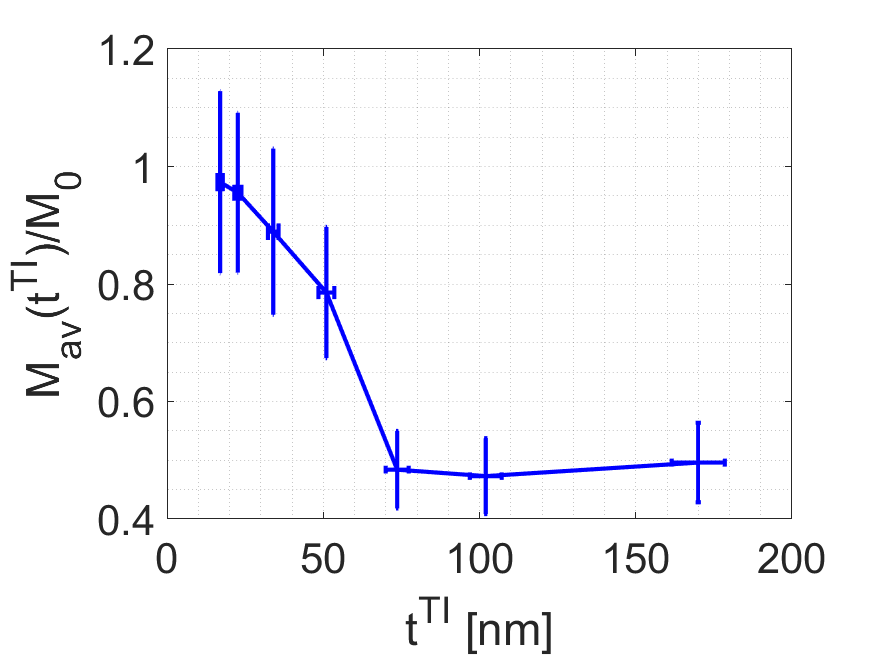
As Eq. 19 presents, the magnetization induced into the TI decays with the distance from the FM-TI interface. The remnant magnetization we got from the anomalous Hall effect measurements (Fig. 5b in the main text) is though an averaged value over the TI thickness. We define the averaged magnetization in our model as:
| (21) |
Fig. 7b shows for our bilayers against the TI layer thickness in units of . We get that . As can be seen from Eq. 21 and Eq. 20, this inequality and the non-monotonic behavior of the magnetization (figures 5b and 7b) result from the dependence of on the BL thickness, which in turn results from the carrier density dependence on the BL thickness (Fig. 4 in the main text).
Appendix D Role of Iron doping in the TI layer
Tof-SIMS measurements put an upper limit of about on Fe dopant concentration in the TI layers. This is far below the Fe doping needed to open a gap in the surface states dispersionRibak (2014). In addition, our out-of-plane coercive fields are almost an order of magnitude larger than in Fe-doped TIsJi et al. (2012). Last, Fe dopant in BSTS compounds are known as electron donorsZhao et al. (2019); Sugama et al. (2001). Since our samples are p-type, Fe doping reduces the charge density. If the Fe dopants are dominant in the bilayer magnetic properties, the magnetization should be maximal where the charge density is minimal (maximal Fe density). This is opposite to our results where the charge density, magnetization, and magnetization induced gap share the same minimum. We therefore conclude that Fe dopants are not dominant in the bilayers magnetization. We claim that the dominant mechanism is interactions between the TI bulk, the upper TI surface, and the FM layer, which the TI conductive bulk states mediate.
Appendix E Role of strain and grain size
In figure 8a we show X-ray diffraction data of a bare 102 [nm] TI film (black), and a bilayer with 12 [nm] FM and 102 [nm] TI (red). Clearly, the films are C-axis oriented. The TI peaks intensities are similar, and the small difference is due to a different sample alignment and sample area.
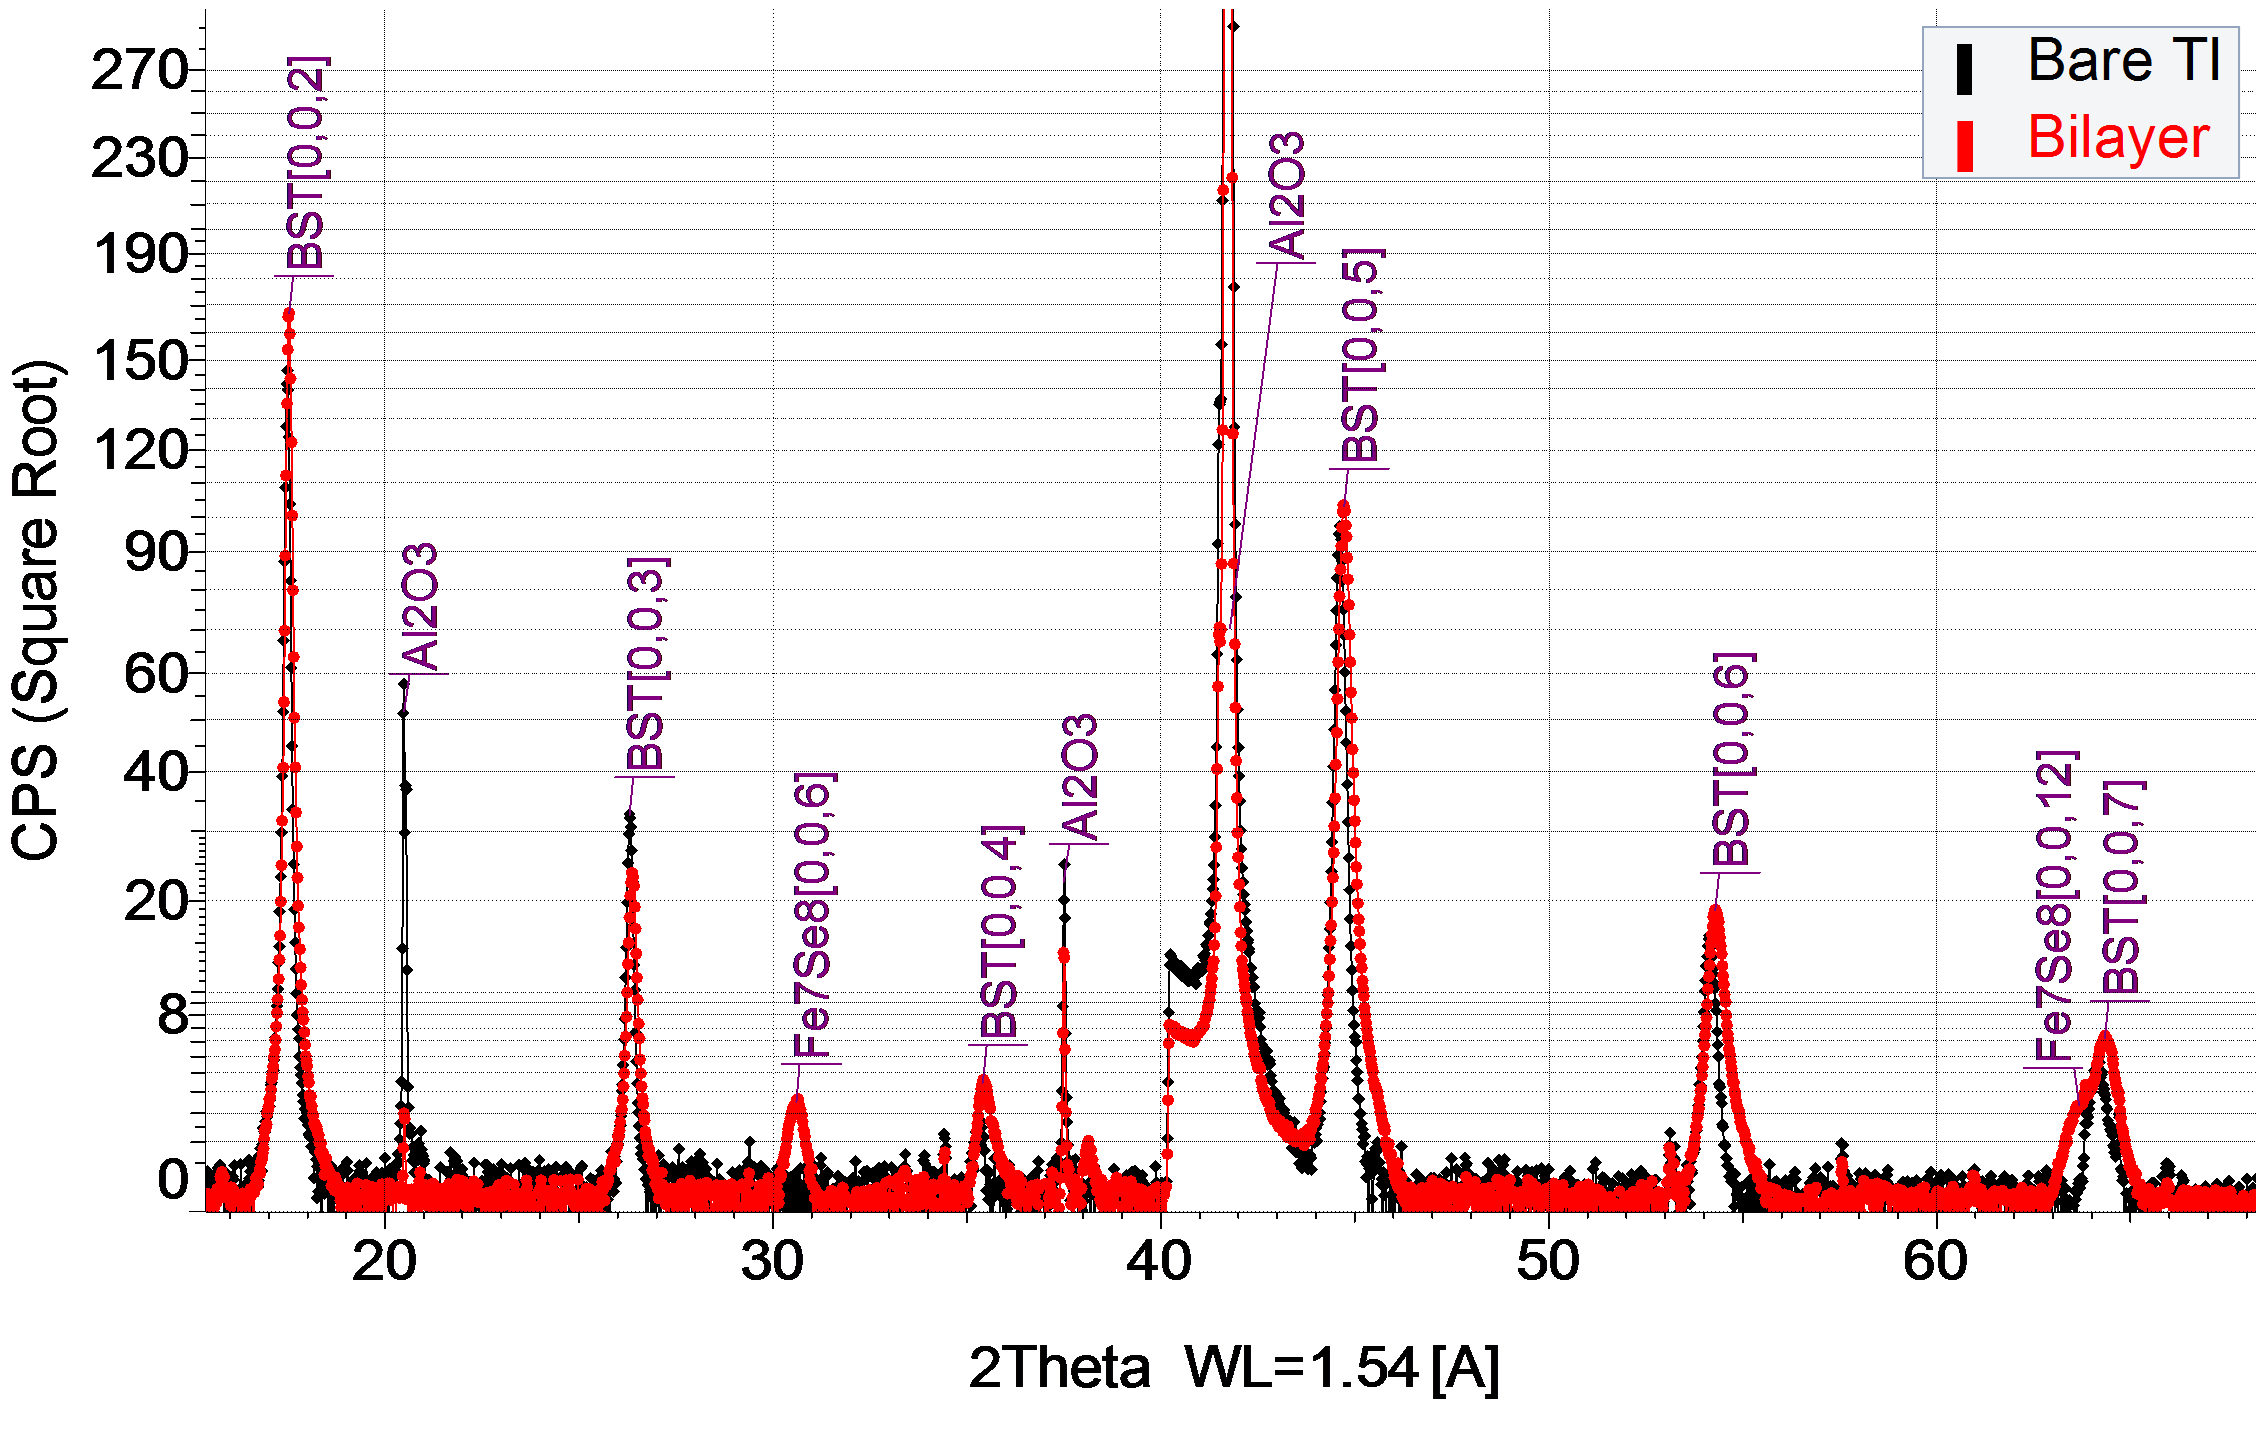
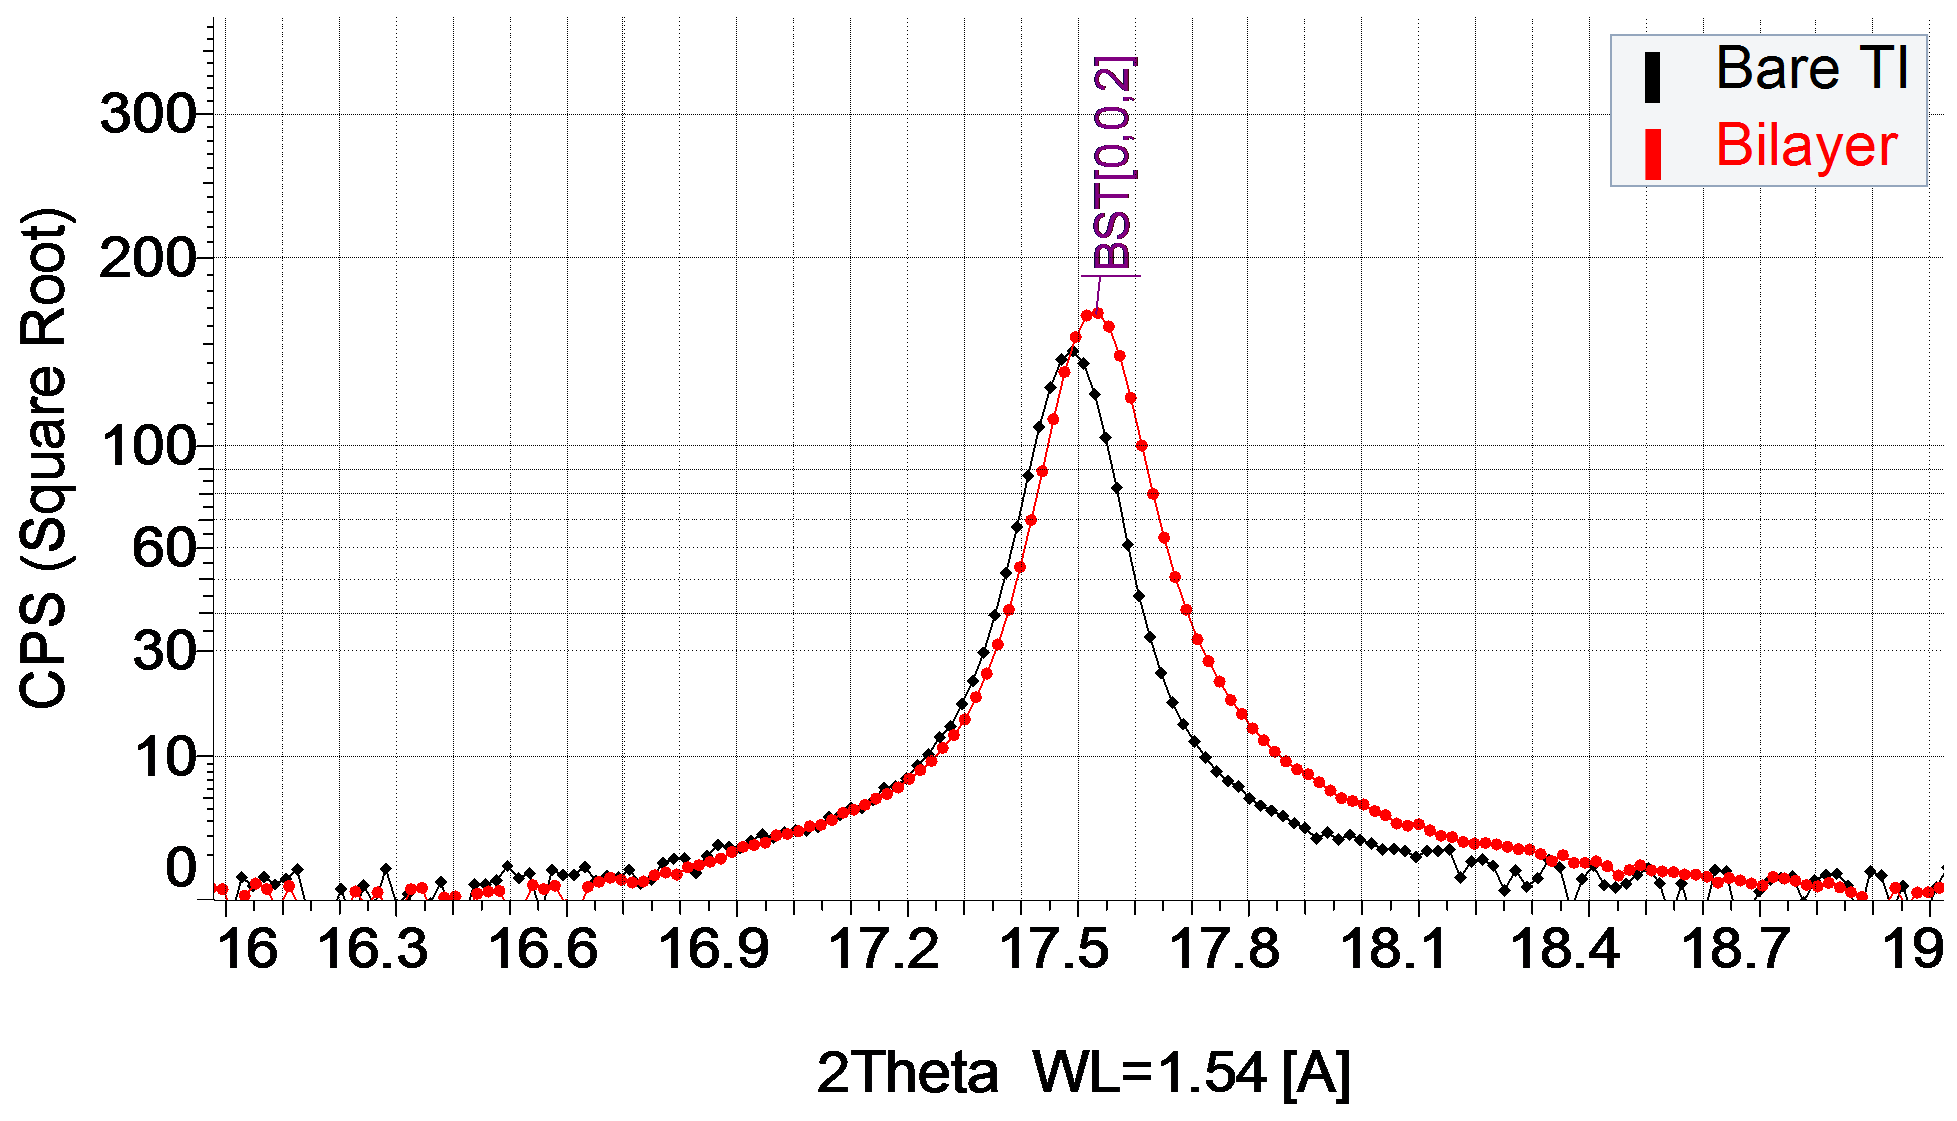
Figure 8b shows a zoom on in the TI [0,0,2] peak. The bilayer peak is shifted by a with respect to the bare TI peak. This means a tensile in-plain strain in the bilayer which shortens the TI C-axis lattice vector Liu et al. (2014). It is known from the literature that a tensile in-plane strain enhances the surface states properties Liu et al. (2014), and therefore this strain cannot be the cause for the reduced surface states coherence length we found in this article.
The bilayer peak is also broader, which can result from a smaller TI grain size. Using the Scherrer equation Borchardt-Ott (2012) with a shape factor K of 0.9 Borchardt-Ott (2012) we got a grain size of for the TI in the bilayer, and in the bare TI. This clearly shows that grain size is also not the source for reduced coherence length in the bilayers.
In addition, in the bare TI the surface states coherence length is about 500 [nm], which we extracted from its magneto conductivity as explained in the main article. This is much higher than the grain size, which is reasonable since the non-gapped surface states are protected from back-scattering by the grain boundaries Bernevig and Hughes (2013). In the bilayers, the surfaces states are gapped and are not protected from back-scattering. This may explain why in the bilayer the coherence length is about (see main article), similar to the grain size. Note that our calculated grain size is a lower boundary on real grain size, which may be somewhat larger since the Scherrer equation does not take into account peak broadening by randomly oriented strainBorchardt-Ott (2012).
Appendix F The dominance of the exposed surface in our magneto-conductivity data
In the main text we concluded that our measured low field magneto-conductivity (MC) is a property of the exposed surface. We justified this by the ability to fit the MC of bare TIs and bilayers using a one-surface modified HLN modelLu and Shen (2014); Lu et al. (2011), as was reported also by many previous publicationsKim et al. (2011); He et al. (2011); Zhang et al. (2012); Wang et al. (2016); Bansal et al. (2012); Steinberg et al. (2011); Park et al. (2018); Li et al. (2019). We discussed the possible contributions of the bulk and the interface surface to the MC and concluded that these are smaller than the contribution of the exposed surface which dominate the MC. From this we concluded that the effective coherence length is reduced in the exposed surface by the magnetic layer and its surface states acquire an energy gap. Therefore, magnetic scattering on the interface cannot explain our effect alone, because there are no magnetic particles at the exposed surface (see appendix D why Fe dopant are not important in our system).
Here we wish to give another justification for our conclusion that our measured reduced MC in the bilayers is a property of the exposed surface. In the end, we will only stay with the assumption that in bare TIs, the contribution of the exposed surface states at least equals that of the interface surface. This is a reasonable assumption since the interface suffers more from strain, defects, impurities etc.
Let us first assume the opposite assumption- the surface states at the exposed surface of the TI in the bilayers remains intact, and the change occurs only at the interface surface. Let us also assume that the surface states at the two surfaces are not coupled and behaves as two separate transport channels. We can therefore treat the two surfaces as two transport channels connected in parallel. In this case the total conductance is the sum of the conductance of each surface, and so is the total magneto conductivity (MC):
| (22) |
The exposed surface is probably of a better quality than the interface surface, since the interface suffers more from impurities, strain, defects etc. Therefore, in a bare TI film we can assume that the contribution of the interface surface to the MC is less or equal to that of the exposed surface.
In our bilayers the total MC is about fifth of its value in the bare TI films. Remember we are assuming that the magnetic layer reduces the MC only at the TI interface surface in the bilayers. Since the total MC is the sum of the MC of both surfaces, and the contribution of the interface surface is less or equal to that of the exposed surface, than the total MC in the bilayers cannot be less than half of the MC in bare TI. This is so unless either the MC of the interface surface changes sign or one of our assumptions is false.
If the MC of the interface surface changes sign, it means that the surface states magnetically induced energy gap is greater than the Fermi energyLu and Shen (2014); Lu et al. (2011). For example, in our bilayer with 17 [nm]-thick TI layer this means a gap larger than 300 [meV] (see the Fermi energy analysis in the main text). This value is more than three times larger than any previously reported or predicted magnetically induced gap at TI-FM interfaces, so we assume this scenario as highly improbable. Therefore, we must conclude that one of our assumptions is false.
We used three assumptions: 1) In the bare TIs the contribution of the exposed surface states at least equals that of the interface surface. 2) The two surfaces are not coupled. 3) The FM layer affects only the interface surface. As we already explained, we see the first assumption as highly probable due the inferior quality of the interface surfaceHe et al. (2011); Zhang et al. (2012).
If the second assumption is false, and the two surfaces behaves as a one coupled transport channel, then we cannot differ between the surface states at the interface and the exposed surfaces. Therefore, the magnetically induced gap which our MC data reflects is a property of all the surface states in the bilayers, including the exposed surface states. But this is exactly our claim- the surface states at the exposed surface of our bilayers are gapped. We also noted in the main text that for our thickest bilayers the surfaces can not couple because the coherence length is smaller than the sample thickness Steinberg et al. (2011).
Therefore, we have to conclude that the third assumption is false, and the FM does affect the exposed surface and reduces its MC, namely reduces the effective coherence length of its surface states (see the discussion of figure 2). As we thoroughly explain in the main text, this can be done either by reducing the coherence length or the surface states, or by opening a magnetically induced gap.
Until now we did not mention the possible contribution of the bulk channel in this appendix. As we mentioned in the main text, the bulk might also contribute the weak anti localization component of the MCSteinberg et al. (2011); Park et al. (2018); Li et al. (2019). Time reversal symmetry does not protect the bulk states from back-scattering as the surface states in the bare TIs, and the bulk states have an energy dispersion of massive particles, not massless as the surface states. Therefore, it is highly plausible that their coherence length is also less or equal to that of the exposed surface states in the bare TIs. This makes all our previous claims about the interface surface states valid also for the bulk states. We cannot explain the attenuation of the MC in the bilayers to about fifth of the bare TI values if we assume that the exposed surface states remain intact.
In the main text we explained that to assume that there is no gap at the exposed surface, we have to assume that the coherence length of its surface states is less than fifth of its value in the bare TIs. In appendix E we showed that the average grain size of the TI in the bilayers is almost the same as in the bare TIs (with 10% difference), and the additional strain leads only to a shift of in the [0,0,2] peak of the TI. We therefore claim that such drastic reduction of the coherence length is less probable than the opening of a magnetically induced energy gap at the exposed surface. Such a gap can occur only due to magnetic coupling to magnetic interface, and not due to magnetic scattering since there are no magnetic particles at the exposed surface.
References
- Bernevig and Hughes (2013) B. A. Bernevig and T. L. Hughes, Topol. Insul. Topol. Supercond. (2013).
- Hasan and Kane (2010) M. Z. Hasan and C. L. Kane, Rev. Mod. Phys. 82, 3045 (2010).
- Zhang et al. (2009) H. Zhang, C. X. Liu, X. L. Qi, X. Dai, Z. Fang, and S. C. Zhang, Nat. Phys. 5, 438 (2009).
- Miyamoto et al. (2012) K. Miyamoto, A. Kimura, T. Okuda, H. Miyahara, K. Kuroda, H. Namatame, M. Taniguchi, S. V. Eremeev, T. V. Menshchikova, E. V. Chulkov, K. A. Kokh, and O. E. Tereshchenko, Phys. Rev. Lett. 109, 166802 (2012), 10.1103/PhysRevLett.109.166802.
- Kuroda et al. (2016) K. Kuroda, J. Reimann, J. Güdde, and U. Höfer, Phys. Rev. Lett. 116, 076801 (2016), 10.1103/PhysRevLett.116.076801, arXiv:1511.00460 .
- Okuyama et al. (2019) Y. Okuyama, R. Ishikawa, S. Kuroda, and T. Hirahara, Appl. Phys. Lett. 114, 051602 (2019).
- Lee et al. (2018) J. S. Lee, A. Richardella, R. D. Fraleigh, C. xing Liu, W. Zhao, and N. Samarth, npj Quantum Mater. 3, 51 (2018), arXiv:1706.04661 .
- Otrokov et al. (2017) M. M. Otrokov, T. V. Menshchikova, M. G. Vergniory, I. P. Rusinov, A. Y. Vyazovskaya, Y. M. Koroteev, G. Bihlmayer, A. Ernst, P. M. Echenique, A. Arnau, and E. V. Chulkov, 2D Mater. 4, 025082 (2017), arXiv:1810.00235 .
- Lu and Shen (2014) H. Z. Lu and S. Q. Shen, Phys. Rev. Lett. 112, 146601 (2014).
- Lu et al. (2011) H. Z. Lu, J. Shi, and S. Q. Shen, Phys. Rev. Lett. 107, 076801 (2011), arXiv:1101.5437 .
- He et al. (2017) Q. L. He, X. Kou, A. J. Grutter, G. Yin, L. Pan, X. Che, Y. Liu, T. Nie, B. Zhang, S. M. Disseler, B. J. Kirby, W. Ratcliff, Q. Shao, K. Murata, X. Zhu, G. Yu, Y. Fan, M. Montazeri, X. Han, J. A. Borchers, and K. L. Wang, Nat. Mater. 16, 94 (2017).
- Katmis et al. (2016) F. Katmis, V. Lauter, F. S. Nogueira, B. A. Assaf, M. E. Jamer, P. Wei, B. Satpati, J. W. Freeland, I. Eremin, D. Heiman, P. Jarillo-Herrero, and J. S. Moodera, Nature 533, 513 (2016).
- Wei et al. (2013) P. Wei, F. Katmis, B. A. Assaf, H. Steinberg, P. Jarillo-Herrero, D. Heiman, and J. S. Moodera, Phys. Rev. Lett. 110, 186807 (2013).
- Lang et al. (2014) M. Lang, M. Montazeri, M. C. Onbasli, X. Kou, Y. Fan, P. Upadhyaya, K. Yao, F. Liu, Y. Jiang, W. Jiang, K. L. Wong, G. Yu, J. Tang, T. Nie, L. He, R. N. Schwartz, Y. Wang, C. A. Ross, and K. L. Wang, Nano Lett. 14, 3459 (2014).
- Lindner et al. (2014) N. H. Lindner, A. Farrell, E. Lustig, G. Refael, and F. von Oppen, arxiv.org (2014), arXiv:1403.0010 .
- Li et al. (2015) M. Li, W. Cui, J. Yu, Z. Dai, Z. Wang, F. Katmis, W. Guo, and J. Moodera, Phys. Rev. B - Condens. Matter Mater. Phys. 91, 014427 (2015), arXiv:1407.6900 .
- Li et al. (2017) M. Li, Q. Song, W. Zhao, J. A. Garlow, T. H. Liu, L. Wu, Y. Zhu, J. S. Moodera, M. H. W. Chan, G. Chen, and C. Z. Chang, Phys. Rev. B 96, 201301(R) (2017).
- Lee et al. (2016) C. Lee, F. Katmis, P. Jarillo-Herrero, J. S. Moodera, and N. Gedik, Nat. Commun. 7, 1 (2016).
- Bruno and Chappert (1992) P. Bruno and C. Chappert, Phys. Rev. B 46, 261 (1992).
- Yang et al. (2013) Q. I. Yang, M. Dolev, L. Zhang, J. Zhao, A. D. Fried, E. Schemm, M. Liu, A. Palevski, A. F. Marshall, S. H. Risbud, and A. Kapitulnik, Phys. Rev. B - Condens. Matter Mater. Phys. 88, 081407(R) (2013), arXiv:1306.2038 .
- Yang et al. (2019) S. R. Yang, Y. T. Fanchiang, C. C. Chen, C. C. Tseng, Y. C. Liu, M. X. Guo, M. Hong, S. F. Lee, and J. Kwo, Phys. Rev. B 100, 045138 (2019).
- Zheng et al. (2016) G. Zheng, N. Wang, J. Yang, W. Wang, H. Du, W. Ning, Z. Yang, H. Z. Lu, Y. Zhang, and M. Tian, Sci. Rep. 6, 1 (2016).
- Lee et al. (2014) A. T. Lee, M. J. Han, and K. Park, Phys. Rev. B - Condens. Matter Mater. Phys. 90, 155103 (2014).
- Tang et al. (2017) C. Tang, C. Z. Chang, G. Zhao, Y. Liu, Z. Jiang, C. X. Liu, M. R. McCartney, D. J. Smith, T. Chen, J. S. Moodera, and J. Shi, Sci. Adv. 3, e1700307 (2017).
- Kandala et al. (2013) A. Kandala, A. Richardella, D. W. Rench, D. M. Zhang, T. C. Flanagan, and N. Samarth, Appl. Phys. Lett. 103, 202409 (2013).
- Kim et al. (2011) Y. S. Kim, M. Brahlek, N. Bansal, E. Edrey, G. A. Kapilevich, K. Iida, M. Tanimura, Y. Horibe, S. W. Cheong, and S. Oh, Phys. Rev. B - Condens. Matter Mater. Phys. 84, 073109 (2011).
- He et al. (2011) H. T. He, G. Wang, T. Zhang, I. K. Sou, G. K. L. Wong, J. N. Wang, H. Z. Lu, S. Q. Shen, and F. C. Zhang, Phys. Rev. Lett. 106, 166805 (2011), arXiv:1008.0141 .
- Wang et al. (2016) W. J. Wang, K. H. Gao, and Z. Q. Li, Sci. Rep. 6, 1 (2016).
- Bansal et al. (2012) N. Bansal, Y. S. Kim, M. Brahlek, E. Edrey, and S. Oh, Phys. Rev. Lett. 109, 116804 (2012), arXiv:1104.5709 .
- Marmolejo-Tejada et al. (2017) J. M. Marmolejo-Tejada, K. Dolui, P. Lazić, P. H. Chang, S. Smidstrup, D. Stradi, K. Stokbro, and B. K. Nikolić, Nano Lett. 17, 5626 (2017), arXiv:1701.00462 .
- Hsu et al. (2017) Y. T. Hsu, K. Park, and E. A. Kim, Phys. Rev. B 96, 235433 (2017), arXiv:1707.06319 .
- Li (2015) M. Li, , PhD Thesis 2015 (2015).
- Mellnik et al. (2014) A. R. Mellnik, J. S. Lee, A. Richardella, J. L. Grab, P. J. Mintun, M. H. Fischer, A. Vaezi, A. Manchon, E. A. Kim, N. Samarth, and D. C. Ralph, Nature 511, 449 (2014).
- Zhang et al. (2011) J. Zhang, C. Z. Chang, Z. Zhang, J. Wen, X. Feng, K. Li, M. Liu, K. He, L. Wang, X. Chen, Q. K. Xue, X. Ma, and Y. Wang, Nat. Commun. 2, 1 (2011), arXiv:1106.1755 .
- Weyrich et al. (2016) C. Weyrich, M. Drögeler, J. Kampmeier, M. Eschbach, G. Mussler, T. Merzenich, T. Stoica, I. E. Batov, J. Schubert, L. Plucinski, B. Beschoten, C. M. Schneider, C. Stampfer, D. Grützmacher, and T. Schäpers, J. Phys. Condens. Matter 28 (2016), 10.1088/0953-8984/28/49/495501, arXiv:1511.00965 .
- Zhang et al. (2010) Y. Zhang, K. He, C. Z. Chang, C. L. Song, L. L. Wang, X. Chen, J. F. Jia, Z. Fang, X. Dai, W. Y. Shan, S. Q. Shen, Q. Niu, X. L. Qi, S. C. Zhang, X. C. Ma, and Q. K. Xue, Nat. Phys. 6, 584 (2010).
- Takemura et al. (1997) Y. Takemura, H. Suto, N. Honda, K. Kakuno, and K. Saito, J. Appl. Phys. 81, 5177 (1997).
- Terzieff and Komarek (1978) P. Terzieff and K. L. Komarek, Monatshefte für Chemie 109, 1037 (1978).
- Steinberg et al. (2011) H. Steinberg, J. B. Laloë, V. Fatemi, J. S. Moodera, and P. Jarillo-Herrero, Phys. Rev. B - Condens. Matter Mater. Phys. 84, 233101 (2011), arXiv:1104.1404 .
- Park et al. (2018) H. Park, J. Chae, K. Jeong, H. Choi, J. Jeong, D. Kim, and M. H. Cho, Phys. Rev. B 98, 045411 (2018).
- Li et al. (2019) H. Li, H. W. Wang, Y. Li, H. Zhang, S. Zhang, X. C. Pan, B. Jia, F. Song, and J. Wang, Nano Lett. 19, 2450 (2019).
- Zhang et al. (2012) S. X. Zhang, L. Yan, J. Qi, M. Zhuo, Y. Q. Wang, R. P. Prasankumar, Q. X. Jia, and S. T. Picraux, Thin Solid Films 520, 6459 (2012).
- Bart Van Zeghbroeck (2008) Bart Van Zeghbroeck, IEEE Circuits Devices Mag. 22, 58 (2008).
- Ren et al. (2011) Z. Ren, A. A. Taskin, S. Sasaki, K. Segawa, and Y. Ando, Phys. Rev. B - Condens. Matter Mater. Phys. 84, 165311 (2011).
- Arakane et al. (2012) T. Arakane, T. Sato, S. Souma, K. Kosaka, K. Nakayama, M. Komatsu, T. Takahashi, Z. Ren, K. Segawa, and Y. Ando, Nat. Commun. 3, 1 (2012).
- Neupane et al. (2012) M. Neupane, S. Y. Xu, L. A. Wray, A. Petersen, R. Shankar, N. Alidoust, C. Liu, A. Fedorov, H. Ji, J. M. Allred, Y. S. Hor, T. R. Chang, H. T. Jeng, H. Lin, A. Bansil, R. J. Cava, and M. Z. Hasan, Phys. Rev. B - Condens. Matter Mater. Phys. 85, 235406 (2012).
- Shiomi (2013) Y. Shiomi, PhD Thesis, Springer Theses (Springer Japan, Tokyo, 2013).
- Nagaosa et al. (2010) N. Nagaosa, J. Sinova, S. Onoda, A. H. MacDonald, and N. P. Ong, Rev. Mod. Phys. 82, 1539 (2010), arXiv:0904.4154 .
- Madavali et al. (2019) B. Madavali, H. S. Kim, C. H. Lee, D. soo Kim, and S. J. Hong, J. Electron. Mater. 48, 416 (2019).
- Whitney et al. (2017) W. S. Whitney, V. W. Brar, Y. Ou, Y. Shao, A. R. Davoyan, D. N. Basov, K. He, Q. K. Xue, and H. A. Atwater, Nano Lett. 17, 255 (2017), arXiv:1607.03844 .
- Liu et al. (2014) Y. Liu, Y. Y. Li, S. Rajput, D. Gilks, L. Lari, P. L. Galindo, M. Weinert, V. K. Lazarov, and L. Li, Nat. Phys. 10, 294 (2014).
- Ribak (2014) A. Ribak, The effect of electrochemical intercalation of copper and bulk doping of iron impurities on the topological insulator Bi2Se3, Ph.D. thesis, Technion - Israel Institute of Technology, Haifa (2014).
- Ji et al. (2012) H. Ji, J. M. Allred, N. Ni, J. Tao, M. Neupane, A. Wray, S. Xu, M. Z. Hasan, and R. J. Cava, Phys. Rev. B - Condens. Matter Mater. Phys. 85, 165313 (2012), arXiv:1202.4957 .
- Zhao et al. (2019) W. Zhao, D. Cortie, L. Chen, Z. Li, Z. Yue, and X. Wang, Phys. Rev. B 99, 165133 (2019).
- Sugama et al. (2001) Y. Sugama, T. Hayashi, H. Nakagawa, N. Miura, and V. A. Kulbachnskii, Phys. B Condens. Matter 298, 531 (2001).
- Borchardt-Ott (2012) W. Borchardt-Ott, Crystallography (Springer Berlin Heidelberg, Berlin, Heidelberg, 2012).