Outbursting Young Stellar Object PGIR 20dci in the Perseus Arm
Abstract
We report the discovery of a likely outbursting Class I young stellar object, associated with the star-forming region NGC 281-W (distance kpc). The source is currently seen only at infrared wavelengths, appearing in both the Palomar Gattini InfraRed (m) and the Near Earth Object Widefield Infrared Survey Explorer ( and m) photometric time-domain surveys. Recent near-infrared imaging reveals a new, extended scattered light nebula. Recent near-infrared spectroscopy confirms the similarity of PGIR 20dci to FU Ori type sources, based on strong molecular absorption in CO, H2O, and OH, weak absorption in several atomic lines, and a warm wind/outflow as indicated by a P Cygni profile in the He I 10830 Å line. This is a rare case of an FU Ori star with a well-measured long term photometric rise before a sharper outburst, and the second instance of an FU Ori star with a documented two-step brightening in the mid-infrared.
accepted to AJ on 5 February 2021
1 Introduction
Episodic accretion in young stellar objects is an important aspect of mass accumulation in stars. It also plays a determining role in the evolution of circumstellar disks, and likely influences the process of planet formation, as well as planetary survival. Armitage (2015) provides a review of disk physics in young stars, including nonsteady accretion and disk instabilities.
In “classical” T Tauri type young stars, the accretion process is controlled mainly by physics in the inner disk and magnetospheric region that connects the disk to the star. Observed time-variability in broad-band photometry and in emission line profiles of these sources is dominated by stochastic behavior, with timescales from hours to days (e.g. Findeisen et al., 2015; Cody & Hillenbrand, 2018; Costigan et al., 2014). The empirical zoo of accretion-related photometric behavior has been measured in unprecedented detail for young stars by space missions including CoRoT, Spitzer, Kepler, and now TESS, all of which sample timescales from minutes to a few months. Ground-based surveys such as ASAS (Shappee et al., 2014), PTF (Law et al., 2009), ZTF (Bellm et al., 2019; Graham et al., 2019), and ATLAS (Tonry et al., 2018) in the optical, and VVV (Minniti et al., 2010) in the infrared, by contrast, typically have lower precision and cadence (day to a few days), but the advantage of long duration monitoring. Gaia and WISENEOWISE also provide precise space-based photometric data, but at much lower cadence (months), with total duration exceeding a decade now. Many of these surveys have all-hemisphere or even all-sky coverage, enabling rare event detection – including episodic accretion outbursts in very young stars.
Accretion-driven outbursts associated with young stellar objects have been identified at an increasing rate over the past decade. The discoveries have come from both the ground-based and the spaced-based platforms. Infrared surveys have the advantage of being able to penetrate the high levels of extinction towards the molecular clouds where young stars are born, and to some extent the additional circumstellar extinction of the youngest self-embedded sources.
Although young star outbursts appear to come in a continuum of amplitudes and rise times, for historical reasons (Herbig, 1977), the labels EX Lup type bursts (also known as EXors) and FU Ori type outbursts (also known as FUors) are often applied. The former are more frequent, characterized by brightness increases of a few magnitudes in amplitude, lasting a few months to one-to-two years, and have emission line spectra. The latter are more infrequent, and can be up to 5-6 mag in amplitude, lasting decades to centuries, and with absorption line spectra except for P Cygni structure in some wind lines. An increasing number of objects are unable to be cast neatly into either of these categories, however. Our knowledge of the spectrum of amplitudes, durations, and duty cycles for young star outbursts is still in its infancy.
The large-scale FU Ori outburst events are intrinisically rare. Furthermore, those few that have been captured in-progress have not been particular well-characterized111The situation can be compared to shorter timescale rare occurences such as tidal disruption events and nearby supernovae, which garner armies of dedicated followers.. The most recent FU Ori outburst discoveries are improving the situation, e.g. Gaia 17bpi (Hillenbrand et al., 2018), Gaia 18dvy (Szegedi-Elek et al., 2020), and NWISE-F J213723.5+665145 (Stecklum, 2020; Connelley & Reipurth, 2020). The total census of FU Ori type stars numbers objects at present, with less than half of these having had their outburst actually observed – rather than inferred from imaging at well-separated pre-outburst and post-outburst epochs.
We report here on the discovery of substantial photometric brightening of an object designated as PGIR 20dci. This source is located at R.A. = 00:52:20.21, Dec. = 56:34:03.9, and we associate it with the NGC 281-W star forming region. The object appears to be a bona fide FU Ori star that has just reached a plateau phase in its brightening.
2 Source Environment
NGC 281, also known as Sh 2-184, is an H II region located in the Perseus spiral arm. While the traditional distance in the literature on the stellar population is 2.2 kpc, astrometry from Gaia DR2 (Gaia Collaboration et al., 2018) indicates a somewhat further 2.8 kpc. This is also the distance derived by Sato et al. (2008) from parallax studies at radio wavelengths of a maser population associated with NGC 281-W (where PGIR 20dci is located). These results place the region on the far side of the Perseus arm, and about 300 pc out of the Galactic plane.
IC 1590 (2 Myr) is the main stellar cluster within the nebular region, and contains the bright ionizing sources collectively designated as HD 5005. This source is now a spatially resolved multiple star system, consisting of components with spectral types O6.5, O8, and O9 (Guetter & Turner, 1997). The cluster thus draws analogies in the literature as a Trapezium type system. The stellar population of the IC 1590 cluster was investigated by Guetter & Turner (1997) and by Sharma et al. (2012), the latter of whom find a size pc.
To the southwest of the main cluster IC 1590, is a dark lane known as NGC 281-W. Another dark area just to the east of the nebulosity is designated NGC 281-E. These are the locations of molecular clouds at the same distance as the large nebula, and presumably situated, at least in part, on its near side. APOD provides an optical picture222https://apod.nasa.gov/apod/ap110825.html that may clarify the geometry for some readers. CO maps of the overall region can be found in Elmegreen & Lada (1978) and Lee & Jung (2003), who provide evidence for cloud compression coming from the direction of the cluster and H II region.
The NGC 281-W molecular core has a bright sub-millimeter and far-infrared source, readily apparent in Herschel/SPIRE (Griffin et al., 2010) and SCUBA-2 (Holland et al., 2006) maps. This dust clump harbors a collection of mid-infrared point sources to its east and southeast, as seen in WISE (Wright et al., 2010) images.
The portion of this highly embedded cluster that is visible in the near-infrared was discovered and studied by Carpenter et al. (1993). These authors targeted the region with early near-infrared imaging capabilities based on the position of IRAS 00494+5617. They found a cluster size r = 0.74 pc (corrected here for differences in the distance assumption), with northeastern and southwestern portions separated by a ridge of high extinction. The “typical” extinction towards the embedded sources was estimated at mag, with peak mag. Carpenter et al. (1993) also derived a mass of 340 (corrected here for differences in the distance assumption), for the associated CS core333A distance-corrected mass in CO of 4000 was also reported by Carpenter et al. (1993), though the NGC 281-W cloud is somewhat larger than the area studied, with Lee & Jung (2003) finding a total mass for the extended cloud of .. The same area of NGC 281-W was specifically targeted in a similar study by Megeath & Wilson (1997) using more sensitive radio and infrared observations.
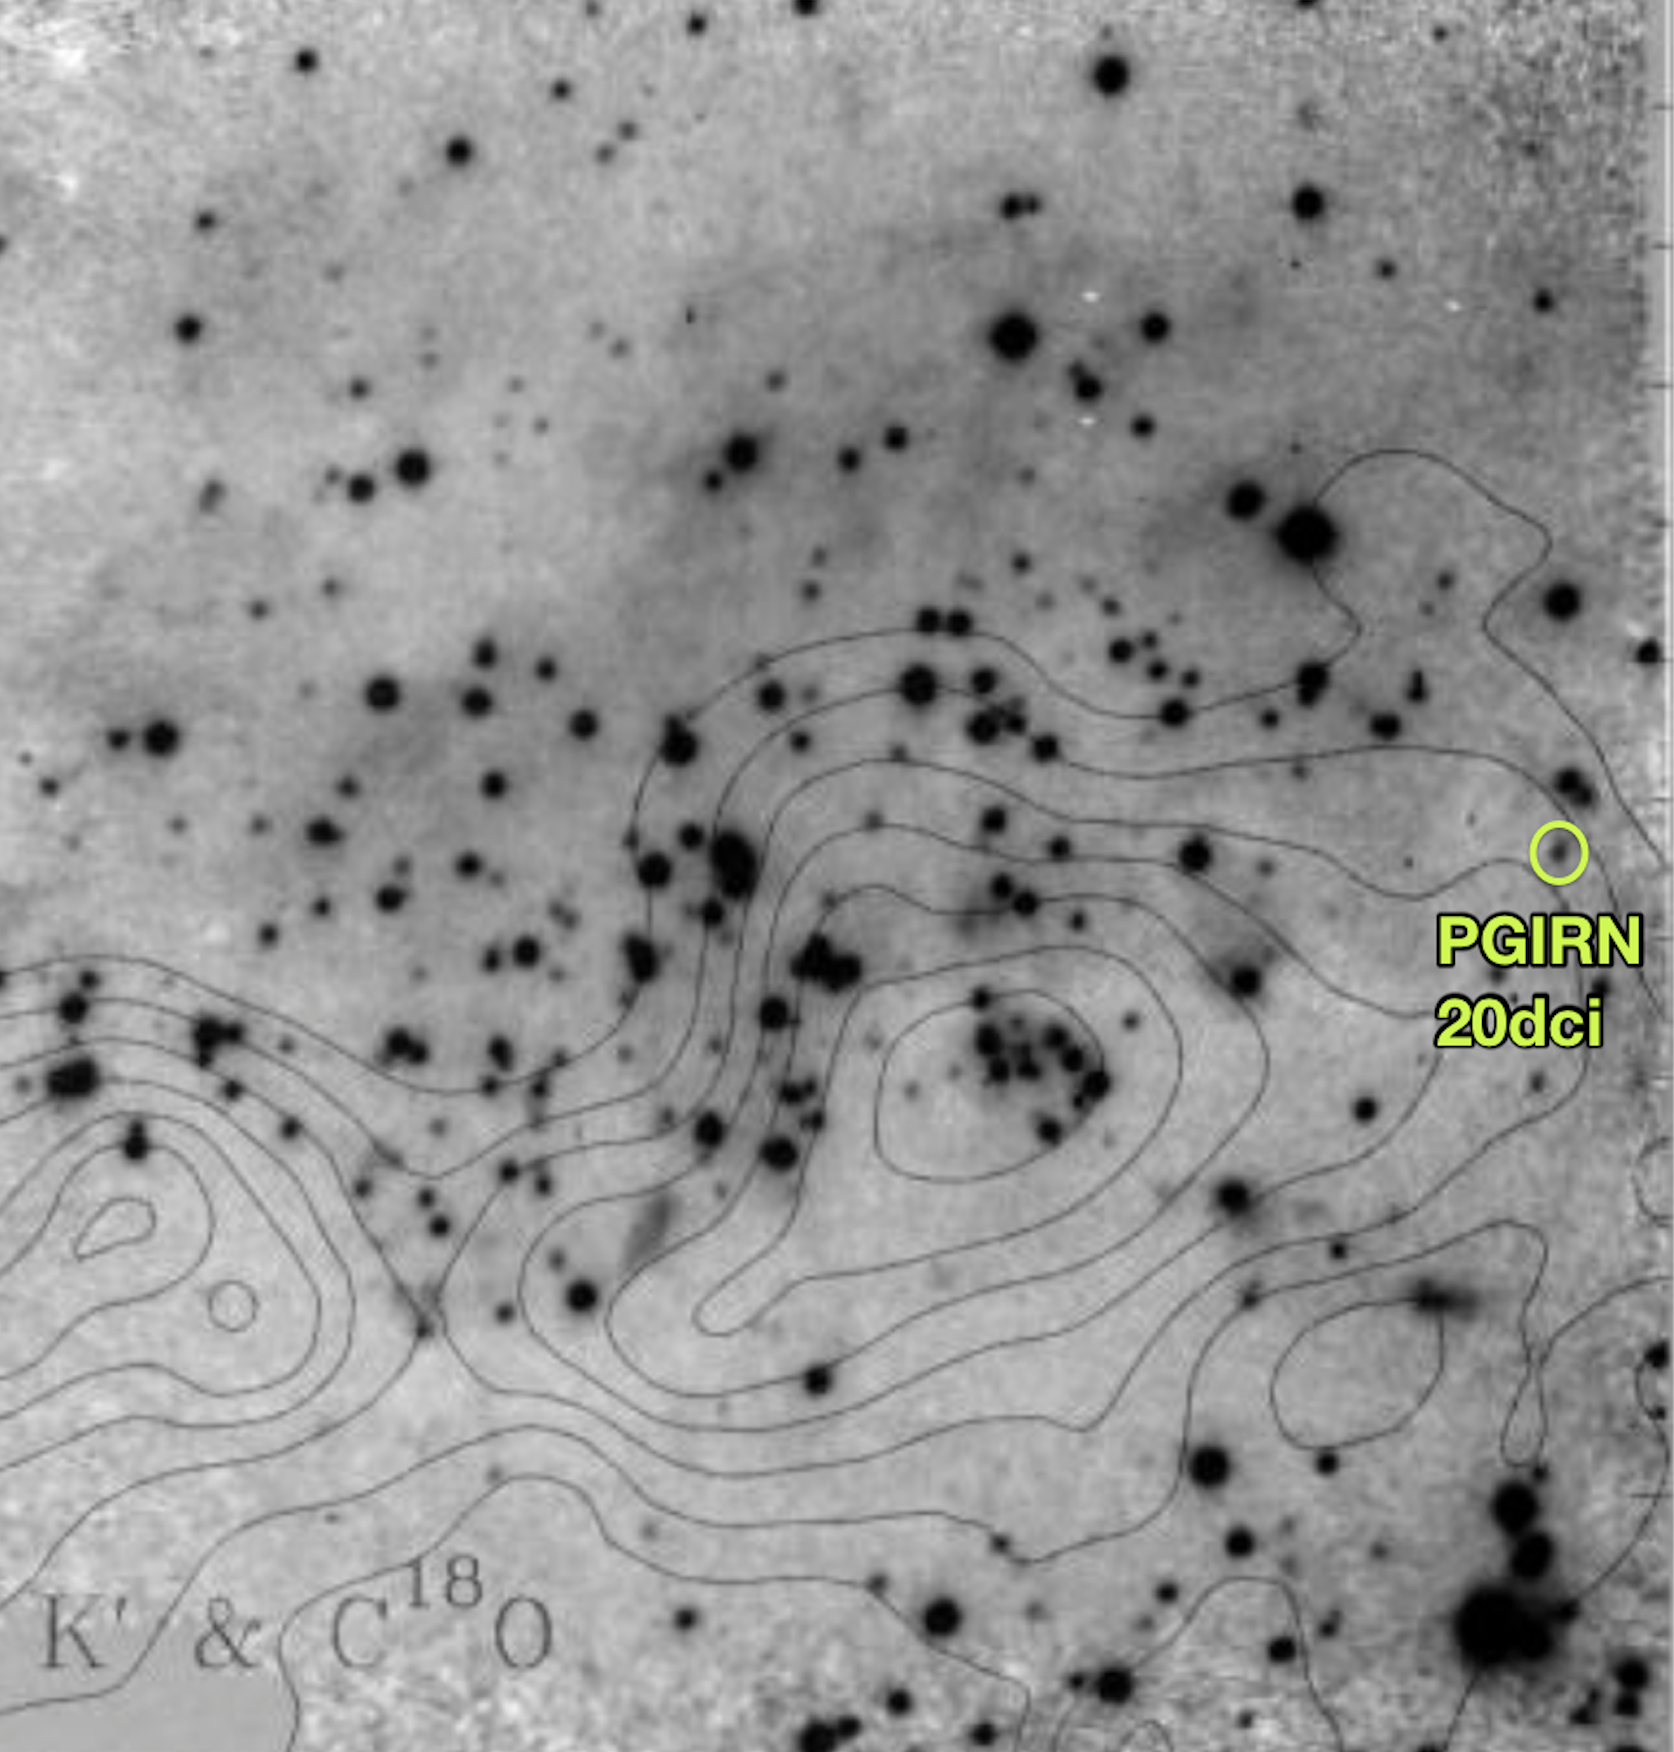
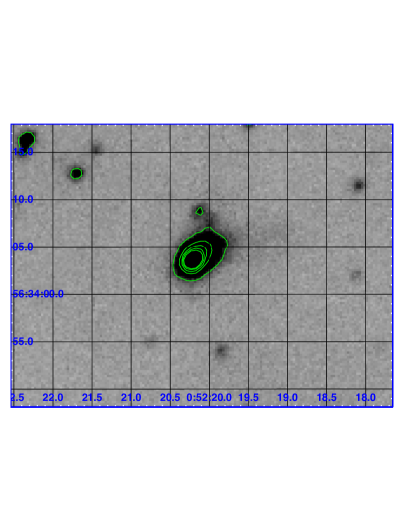
The object of interest here, PGIR 20dci, is located within the region of these previous surveys, about 30″ west of the embedded cluster center. Figure 1 shows a portion of the field imaged by Megeath & Wilson (1997), with the position of PGIR 20dci designated. Although faintly visible at -band in this archival image, PGIR 20dci has not been previously cataloged, studied, or characterized.
3 Outburst Discovery and Validation
In this section, we describe the initial photometric alert that drew our attention to PGIR 20dci. We then detail the optical, near-infrared, and mid-infrared photometric forensics work leading to establishment of the outburst profile over time.
3.1 Gattini 1.2 m (-band) Lightcurve
The Palomar Gattini InfraRed survey (PGIR; De et al., 2020a; Moore & Kasliwal, 2019). observes the sky every two nights in the near-infrared -band, to a median depth of J = 15.7 mag (AB). The faint limit is much brighter than this in crowded or confused regions, such as near the Galactic plane and in high surface brightness regions, such as NGC 281-W.
On 2019, August 31, a “hostless” source was first detected in PGIR as a positive image subtraction, and flagged (by co-author KD) for photometric and spectroscopic follow-up. The initial source position required some refinement due to the 8″ pixel size of PGIR. There are no counterparts in optical (e.g. PanSTARRS Flewelling et al., 2016) or near-infrared (2MASS Skrutskie et al., 2006) survey catalogs, though a hard stretch of the 2MASS images does reveal a faint detection at and perhaps . A nearby WISE catalog (Cutri et al., 2013) source at 00:52:20.41 +56:34:03.3 was determined to be the source that had brightened. The brightening is also recorded in NEOWISE (Mainzer et al., 2014) data. The consequent increase in signal-to-noise likely yields better astrometry, and hence a more accurate true source position of 00:52:20.21 +56:34:03.9, which we adopt. This position is 1.3″ away from the position reported for the fainter WISE source, and 4-5″ from the PGIR position.
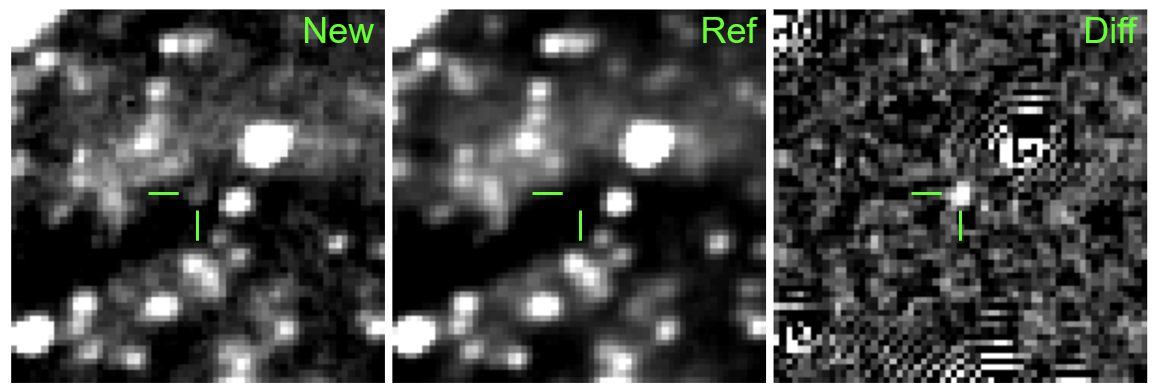
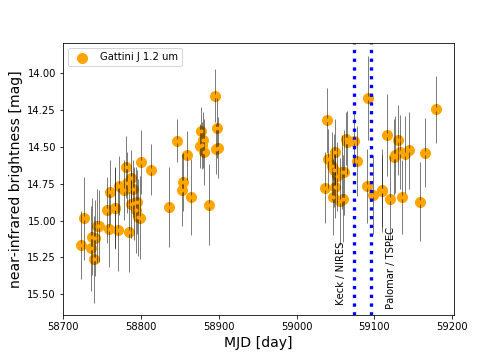
Figure 2 shows the lightcurve produced from the PGIR forced difference photometry pipeline. PSF-fit photometry is performed, with noise uncertainty at the location of the transient estimated, as described in De et al. 2020b, from difference images produced using the ZOGY algorithm (Zackay et al., 2016).
Since its discovery at mag, PGIR 20dci has slowly increased in brightness. The brightening trend observed during the 2019-2020 season (Figure 2) can be fit with a linear slope of mag/month. During the latter part of 2020 the lightcurve appears to have plateaued, and a linear fit is consistent with zero slope.
3.2 Pre-Discovery Photometric Information
In this section, we discuss the limited photometric record available for PGIR 20dci.
3.2.1 Optical and Near-Infrared
At the time of its PGIR detection, PGIR 20dci was invisible in optical time-domain survey data, including ASAS and ZTF. Recently, however, a faint optical source with mag is transiently present in ZTF alerts (Masci et al., 2019). There is not a useful optical lightcurve, however, due to infrequent detection and large error bars.
We also note that PGIR 20dci was undetected in deeper imaging of the NGC 281-W region with HST in the optical F814W and F675W filters, from 2000, September, accessible via the Hubble Legacy Archive. PGIR 20dci is also undetected in archival Keck images with DEIMOS of the region from 2010, October 6, accessible via the Keck Observatory Archive.
In the near-infrared, PGIR 20dci was undetected by 2MASS (Cutri et al., 2003), as noted above. While the nominal 2MASS survey limit is , we derive a more accurate number for this exact environment by considering the error vs magnitude distribution of sources within 4′ of PGIR 20dci. We find that photometry is available to mag and photometry to mag. While the diffuse background is high in the NGC 281-W region, the dark cloud renders the point source background and confusion lower than would be the case otherwise. Thus, the 2MASS magnitude limit is plausibly deeper than nominal. We conclude that a reasonable flux upper limit for PGIR 20dci at epoch 2000, January 13 is approximately mag.
In the deeper -band imaging of Megeath & Wilson (1997), PGIR 20dci is also not apparent, except for perhaps a faint low surface brightness smudge near the edge of detection. The claimed faint point source limit of these data is mag. PGIR 20dci does, however, have an apparent faint counterpart in the K’-band imaging of Megeath & Wilson (1997), as indicated in Figure 1. Although the sources from this study are not cataloged, the authors report that the fainter stars in the displayed image have mag (80% completeness level). PGIR 20dci thus appears to have experienced a 5 mag brightening since the mid-1990’s epoch of the Megeath & Wilson (1997) data acquisition.
3.2.2 Mid-Infrared Spitzer
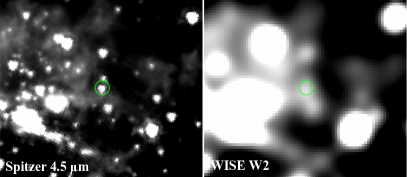
In the mid-infrared, there is also a faint counterpart to PGIR 20dci in Spitzer/IRAC (Werner et al., 2004; Fazio et al., 2004) imaging. The source appears blue in comparison to the main embedded cluster, approximately 30″ to the east of PGIR 20dci, perhaps due to somewhat lower extinction away from the center of the molecular core (see contours in Figure 1).
There are three relevant Spitzer/IRAC AORs, one for P.I. Fazio in 2004 (AORKEY 4127744) and two for P.I. Wolk in 2009 (AORKEYs 34780160 and 34780416). The former, from Spitzer’s cryogenic phase, includes all four IRAC bands (3.6, 4.5, 5.8, and 8 m). The latter two were taken in the post-cryo phase of Spitzer and thus include only IRAC1 (3.6 m) and IRAC2 (4.5 m). We performed aperture photometry at the target’s location in the pipeline-produced post-BCD mosaics using a radial aperture of 3 native pixels (1.2/pixel) and a background annulus from 3-7 native pixels. Aperture corrections were applied as appropriate to the cryo and the post-cryo observations, as described in the IRAC Instrument Handbook444https://irsa.ipac.caltech.edu/data/SPITZER/docs/irac/iracinstrumenthandbook. Specifically, we used values of 1.124, 1.127, 1.143, & 1.234 for the 4 channels in the cryogenic era, respectively, and 1.125 & 1.120 for the 2 channels in the post-cryo era, respectively.. The Instrument Handbook also has the zero points555280.9, 179.7, 115.0, & 64.13 Jy for the four IRAC channels, respectively. we used for converting the flux densities to magnitudes. Our photometric results for Spitzer/IRAC are provided in the first three rows of Table 1.
From some of these same Spitzer data, Sharma et al. (2012) found [S3.6] or IRAC1 = 14.40 mag and [S4.5] or IRAC2 = 12.89 mag using a similar 3.″6 radial aperture to us, but a smaller 3.″6–8.″4 sky annulus. These values are consistent with our results for the first observation epoch, in 2004. We also note that IRSA’s SEIP catalog666http://irsa.ipac.caltech.edu/data/SPITZER/Enhanced/SEIP/overview.html contains a source SSTSL2 J005220.20+563403.8 with IRAC1 = 14.57 mag and IRAC2 = 12.80 mag, adopting the 3.″8 aperture values and applying the flux-to-magnitude conversions above, again consistent with our measurements for the 2004 epoch, within the reported errors.
Finally, we note that there are also Spitzer/MIPS observations of the region available in the m band. These MIPS1 data were taken in 2006, February, which is between the two Spitzer/IRAC epochs. It would be valuable to be able to compare the 2006 MIPS1 photometry to the 2010 W4 photometry, for reasons that will become apparent below. Unfortunately, however, the MIPS1 imaging results in only flux upper limits for PGIR 20dci.
3.2.3 Mid-Infrared AllWISE
WISE images at the comparable bands WISE1 or (3.4 m) and WISE2 or (4.6 m) have lower spatial resolution, but do show a source that appears more distinct and pointlike in the unWISE image processing (Lang, 2014). The AllWISE catalog (Cutri et al., 2012) records a source WISEA J005220.41+563403.3 with reported photometry given in Table 1. We took the AllWISE profile fitting magnitudes and errors, as quoted. The measurements are rated as “AAAA” in photometric quality, meaning SNR in each of the four bands, and they are unsaturated.
| MJD | WISE1 | err | IRAC1 | err | IRAC2 | err | WISE2 | err | IRAC3 | err | IRAC4 | err | WISE3 | err | WISE4 | err |
| 3.4 m | 3.6 m | 4.5 m | 4.6 m | 5.8 m | 8.0 m | 12 m | 22 m | |||||||||
| 53214.65 | (15.01) | 14.49 | 0.17 | 12.86 | 0.07 | (12.61) | 11.77 | 0.30 | 11.56 | 1.60 | ||||||
| 55077.57 | (14.49) | 13.99 | 0.12 | 12.42 | 0.07 | (12.18) | ||||||||||
| 55080.44 | (14.45) | 13.96 | 0.11 | 12.43 | 0.07 | (12.19) | ||||||||||
| (AllWISE) | 12.51 | 0.08 | 11.40 | 0.05 | 6.11 | 0.04 | 3.36 | 0.07 | ||||||||
| 55222.15 | 12.63 | 0.25 | 11.41 | 0.09 | 6.04 | 0.22 | 3.27 | 0.32 | ||||||||
| 55409.82 | 12.63 | 0.25 | 11.41 | 0.09 | 6.13 | 0.22 | 3.37 | 0.32 | ||||||||
| 55586.45 | 12.62 | 0.25 | 11.43 | 0.09 | ||||||||||||
| 56684.21 | 12.34 | 0.15 | 11.14 | 0.10 | ||||||||||||
| 56873.87 | 12.56 | 0.22 | 11.14 | 0.03 | ||||||||||||
| 57045.96 | 12.40 | 0.13 | 11.07 | 0.10 | ||||||||||||
| 57235.95 | 12.43 | 0.21 | 11.12 | 0.07 | ||||||||||||
| 57408.47 | 12.26 | 0.26 | 11.00 | 0.01 | ||||||||||||
| 57602.68 | 12.31 | 0.26 | 10.97 | 0.07 | ||||||||||||
| 57769.55 | 12.20 | 0.20 | 10.89 | 0.05 | ||||||||||||
| 57966.88 | 12.32 | 0.17 | 10.85 | 0.06 | ||||||||||||
| 58129.81 | 12.02 | 0.17 | 10.68 | 0.06 | ||||||||||||
| 58331.39 | 12.09 | 0.18 | 10.62 | 0.05 | ||||||||||||
| 58491.38 | 11.83 | 0.18 | 10.50 | 0.03 | ||||||||||||
| 58698.13 | 11.17 | 0.10 | 9.70 | 0.04 | ||||||||||||
| 58858.12 | 10.35 | 0.09 | 8.97 | 0.03 | ||||||||||||
| 59062.32 | 10.25 | 0.10 | 8.89 | 0.03 | ||||||||||||
| 59222.09 | 10.20 | 0.08 | 8.93 | 0.03 |
3.2.4 Mid-Infrared Colors
The available colors of the PGIR 20dci progenitor are and mag from Spitzer, and , , and mag from AllWISE.
These colors place the object firmly within the Class I category of young stellar objects, meaning a steeply rising spectral energy distribution that is best explained by the presence of a massive circumstellar envelope. The colors are too red to be consistent with a geometrically flatter disk, as is characteristic of Class II sources. PGIR 20dci is, however, even redder than most Class I sources, which indicates substantial foreground extinction.
3.3 WISENEOWISE Lightcurve

In this section, we present mid-infrared data that support the PGIR detection of a significant brightening of the source.
We collected photometry from the WISE Multi-Epoch and NEOWISE (Cutri et al., 2015) mission archives via IRSA999https://irsa.ipac.caltech.edu/Missions/wise.html, rejecting measurements with qi_fact=0 or qual_frame=0. We checked the WISE/NEOWISE photometry flags101010https://wise2.ipac.caltech.edu/docs/release/neowise/expsup/sec2_1a.html, finding no entries in the w[12]cc_map_str (contamination and confusion) column, and only non-event entries in the na (deblending) column. The nb (multiple PSF) column indicates that a single profile is used in % of the measurements; only % of the measurements (all towards the fainter end) require a second PSF, perhaps to account for the faint star just to the north of PGIR 20dci (see the Spitzer image panel in Figure 3).
For the WISE Multi-Epoch catalog and the subsequent, ongoing NEOWISE monitoring data, we took the median of all profile fitting magnitude measurements within each spacecraft “visit” covering the position, and we calculated the error as the dispersion among these magnitudes. The median time span per WISE or NEOWISE visit is about 1.25 days. Results are provided in Table 1.
As illustrated in Figure 3, the mid-infrared lightcurve of PGIR 20dci experienced an exponential rise phase over the past few years, that appears to be plateauing during 2020. Considering only the three NEOWISE measurements at MJD = 58491.8, 58698.2, and 58858.1, before the flattening, the rise rate was mag/month or -1.40 mag/year during 2019-2020. We note that this is identical, within the errors, to the slope derived for the -band lightcurve ( mag/month; see discussion above regarding Figure 2). Before this steep recent rise, there was a much shallower but steady upward trend in the WISE/NEOWISE lightcurve between 2010 and 2019, with a rise slope of only -0.01 mag/month or -0.13 mag/year.
3.4 Overall Mid-Infrared Light and Color Evolution
As discussed in 3.2.2, prior to the 2010 WISE mission measurements, there are data available in 2009 and 2004 from Spitzer. A shallow rise is also seen in these data, though there are a limited number of data points. The steeper jump that is implied between the Spitzer and WISE epochs occurs in a fairly narrowly confined time frame, within 2009 September 6 (Spitzer) and 2010 January 26 (WISE), and warrants critical investigation.
The two shortest wavelength Spitzer and WISE filters are similar, and Jarrett et al. (2011) find agreement in large-scale photometry comparisons to within 2-3%. However, PGIR 20dci is an extremely red source, beyond the range of colors available to Jarrett et al. (2011), and thus we need to consider potential color terms between the earlier Spitzer and later WISE photometry. Similar considerations were also made for the lightcurve analysis of Gaia 17bpi (Hillenbrand et al., 2018) and PTF 14jg (Hillenbrand et al., 2019), where color transformations were derived111111 mag, with rms = 0.24 mag. and implemented, but not magnitude transformations. Here for PGIR 20dci, we have tried to assess more carefully the impact of color terms on the lightcurve, by looking at a large sample of young stellar objects observed with both Spitzer and WISE. While there is a narrow correlation in the magnitudes themselves, when considering the IRAC1 and IRAC2 transformations as a function of IRAC1-IRAC2 color, the comparison data show a fanning out towards redder IRAC1-IRAC2 color, which introduces significant uncertainty. Identical issues were investigated by Antoniucci et al. (2014, see their section 2.1.1) and we have adopted their corrections121212 and . For the IRAC1-IRAC2 color of PGIR 20dci, this amounts to shifts of approximately 0.5 mag fainter in going from IRAC1 to , and -0.25 mag brighter in going from IRAC2 to . Figure 3 illustrates both the observed and the WISE-corrected Spitzer magnitudes, which also appear in the WISE columns of Table 1.
In order order to negate the conclusion of a large jump in brightness between the last Spitzer epoch and the first WISE epoch, the color corrections to the photometry would have to be much larger than currently supposed (which is certainly possible), but also in the opposite direction for the Spitzer IRAC1 channel. We also note that, even among the very red sources in this spatial region, PGIR 20dci is an outlier in direct comparisons of Spitzer vs AllWISE photometry, lending support to the reality of the apparent brightness jump.
We can further scrutinize the WISE/NEOWISE photometry by considering reported aperture magnitudes. The aperture photometry exhibits the expected trends with aperture size, with the 5″.5 aperture undersized and producing magnitude overestimates, and other apertures oversized and thus having magnitudes that well-underestimate the profile fitting magnitudes. Even if the undersized 5″.5 aperture photometry were used, the brightness jump between the Spitzer 2009 and WISE 2010 measurements would remain, albeit reduced by about 0.25 and 0.75 mag in and , respectively. We note that the w[12]flg_1 (5.5″ aperture confusion) column indicates that about 8% of the aperture photometry measurements have some identified source of confusion; this is not significant for the w1mpro magnitude measurements that we have adopted, however. Overall, the profile fitting photometry is more robust to bad pixels, cosmic rays, and the need to establish aperture corrections.
Finally, we can consider the evidence for color changes as the source has brightened in the mid-infared. The recent steep brightening of PGIR 20dci has been colorless, within the errors. The median color over the 2014-2020 NEOWISE epochs is consistent with a constant value of mag and rms = 0.21 mag. Earlier, in 2010, however, the WISE colors were mag for each of the three epochs, so marginally bluer in the period just after the 2009-2010 jump in brightness. The even earlier 2009 and 2004 Spitzer colors are both IRAC1-IRAC2 , which after applying the Spitzer-to-WISE color transformation quoted above, results in a corresponding mag. Applying the Antoniucci et al. (2014) magnitude corrections detailed above results in fairly similar colors of 2.40, 2.31, and 2.26 mag for the the three Spitzer epochs.
The above suggests that the color of PGIR 20dci became bluer by about 1 mag in as it brightened during late 2009 and very early 2010 period, before reddening by a small amount ( mag) and then continuing to brighten colorlessly. It is hard to know how to interpret this overall behavior. If driven by an accretion event, one would expect some blueing behavior. At the same time, there may be extinction clearing going on, which would also imply a color change to the blue. The neutral color behavior that is observed over the past five years as PGIR 20dci has brightened seems anomalous with respect to these expectations.
In summary, the mid-infrared lightcurve of PGIR 20dci shows that the source has undergone a long-timescale, two-step rise from a faint state to a bright state over the past years. During the period 2004-2019, the source increased its mid-infrared brightness by mag in total. There was a shallow brightening from 2004-2009, a first significant jump in brightness during a 4 month time frame in late 2009 or early 2010, a second shallow rise phase, and a more recent second significant brightness jump beginning in 2019 and plateauing in 2020.
4 Follow-up Observations and Data Analysis
In this section, we describe the imaging and spectroscopy that we collected on PGIR 20dci.
4.1 Imaging
4.1.1 Data Acquisition
PGIR 20dci was flagged for follow-up with the Palomar 60” telescope and SEDM (Spectral Energy Distribution Machine; Blagorodnova et al., 2018) in its imaging mode. A sequence in the filters was acquired on 2020 August 14 (UT) and reduced using the photometric reduction pipeline.
On 2020 August 28, we obtained near-infrared imaging of PGIR 20dci using the Wide Field Infrared Camera (WIRC; Wilson et al. 2003) on the Palomar 200-inch telescope. The data were acquired as a series of dithered exposures in , , and bands for a total exposure time of 495, 330, and 300 seconds, respectively. The data were reduced, stacked and photometrically calibrated using the pipeline described in De et al. (2020a).
4.1.2 Findings
No counterpart to PGIR 20dci was detected in and bands, with an approximate upper limit of mag. However, we detect a faint extended source in band, coincident with the bright nebula detected in the near-infrared image. The final -band image was shown in Figure 1. A close-up on PGIR 20dci appears in Figure 4, which highlights the extended cometary structure of the source in the near-infrared. Figure 5 shows the JHK color composite image.
Taken together, the optical and infrared imaging suggests an extremely red source, as well as a bright, extended, scattered light component associated with the brightening of PGIR 20dci. The angular size of the extended structure corresponds to a physical size 14,000 AU.
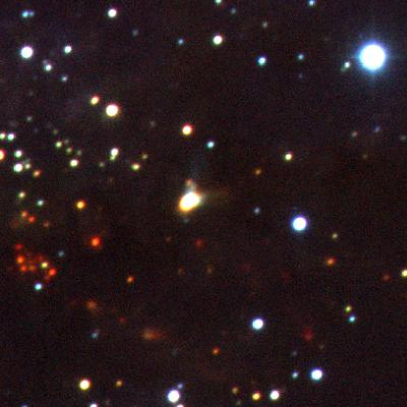
In order to encompass the non-point source, extended nature of PGIR 20dci, we measured photometry from the Palomar/WIRC images using a fairly large aperture radius of 9 pixels (2″.25), whereas a 5-pixel (1″.25) radius would suffice for point sources. Using the smaller radius would decrease the brightness of PGIR 20dci by about 0.1 mag. We calibrated by matching to 110 sources in common between our final images and the 2MASS catalog. We find , , and mag in 2020, September. The near-infrared colors of PGIR 20dci in outburst are thus mag and mag. This location in a vs diagram is consistent with that of a young stellar object that is highly reddened.
4.2 Spectroscopy
4.2.1 Data Acquisition
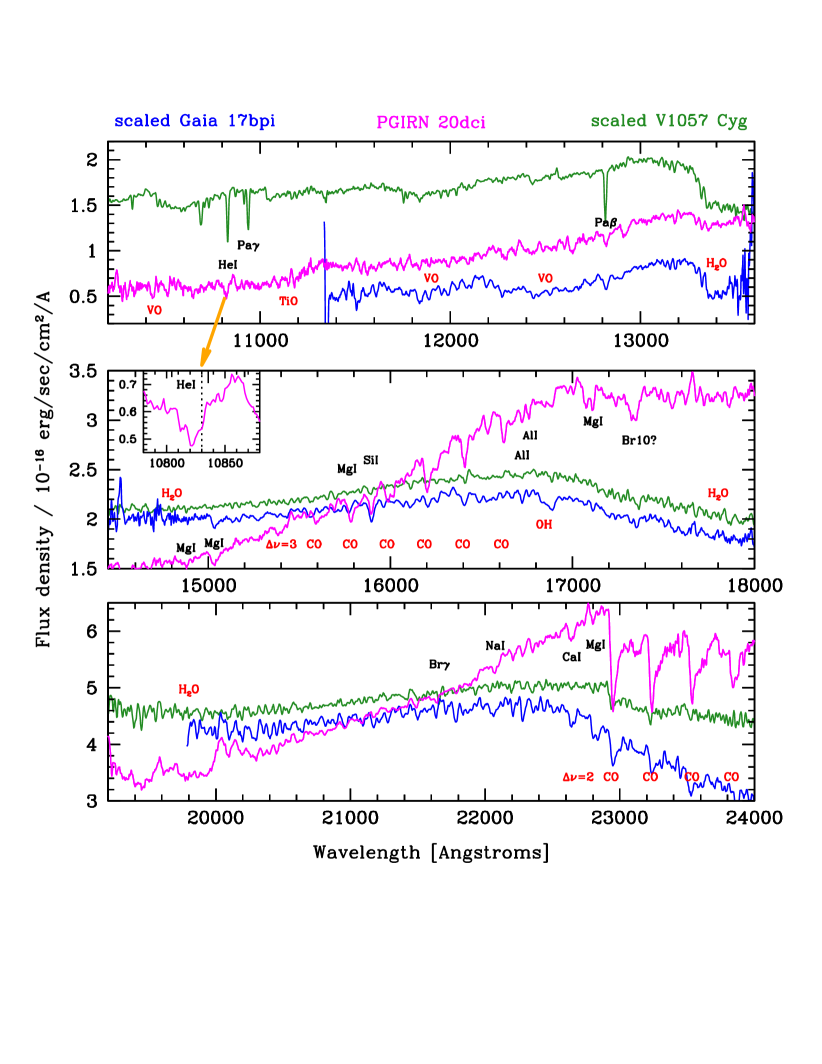
On 2020 August 13, PGIR 20dci was observed with Keck II and NIRES (Near Infrared Echellette Spectrometer), which is part of the family of similar instruments described in Wilson et al. (2004). The detector records a prism-dispersed simultaneous spectrum at resolution 2700. Four spectra were acquired using a 6″ ABBA nodding pattern, with integration time of 90 seconds at each position. The data were reduced using a modified version of spextool (Cushing et al., 2004), and flux-calibrated with the telluric A0V standard star HIP 6002 using the xtellcor code (Vacca et al., 2003). Figure 6 shows the final extracted and combined spectrum. Due to the very red nature of the source, there is little signal at the shorter wavelengths, and thus we show only the spectral region.
On 2020 September 4, a second spectrum was obtained at with the Palomar 200” and the TripleSpec (Herter et al., 2008) near-infrared spectograph. Although lower signal-to-noise, and not shown as a result, the spectrum is broadly the same in its shape and presence of strong spectral features as the Keck/NIRES spectrum from a month earlier. However, the flux level is brighter. Considering Figure 2, the flux at this point in time could have been several tenths of a magnitude brighter, though the error on this estimate is large. A more likely explanation is that the TripleSpec slit (1.0″) is wider than the NIRES slit (0.55″), and thus the spectrum would include more of the bright extended structure of the source (see Figure 4). Normalizing the two at -band, the -band slope is identical to that shown in Figure 6, but there is a sharper break just before the CO region, resulting in even deeper CO absorption. The -band region is then slightly brighter than the spectrum shown in Figure 6. This could mean that the source became slightly bluer while temporarily brighter at this epoch. However, we attribute the difference to the possibility that the two spectra may have included different parts of the extended nebula.
4.2.2 Findings
Focussing on the Keck/NIRES spectrum, PGIR 20dci is highly reddened, consistent with the extremely red mid-infrared colors measured by WISE. The comparison objects131313Gaia 17bpi is a recent FU Ori outburst occurring in 2017 (Hillenbrand et al., 2018), which is still near its peak brightness. V1057 Cyg is one of the originally defined FU Ori stars, estimated to have outburst in 1970 (Herbig, 1977), and although it has faded considerably, the spectrum maintains the general features of FU Ori stars (e.g. Connelley & Reipurth, 2018). in Figure 6 are less reddened than PGIR 20dci. We can estimate the relative reddening, and thus the extinction, by applying a standard extinction law to find the the best spectral match to the V1057 spectrum. We find a differential extinction mag, which can be added to a baseline =4 mag for V1057 (Connelley & Reipurth, 2018). The total extinction towards PGIR 20dci is thus estimated to be mag.
Spectroscopically, the most salient feature of PGIR 20dci is the strong CO absorption. The source has both the CO bands in the -band, and the bands CO in the -band. There is also strong H2O in -band and -band, probably in -band as well, and likely in -band. Less obvious is the expected TiO and VO absorption, though it may be weakly present. PGIR 20dci shares with Gaia 17bpi and V1057 Cyg in having clear -band H2O absorption, and -band and -band CO absorption. The H2O is weaker in PGIR 20dci, while the CO is stronger. We note that the CO in V1057 Cyg is atypically weak for FU Ori stars (Connelley & Reipurth, 2018).
In terms of atomic lines, weak Na I, Mg I, Al I, Si I, and Ca I absorption are all present. There is also weak H I Pa absorption at m. The metal line strengths are similar to those seen in the comparison object Gaia 17bpi, and somewhat stronger than in V1057 Cyg. PGIR 20dci and Gaia 17bpi also have comparable Pa, which is likely blueshifted and formed in a wind.
Notably, the He I 10830 Å line in PGIR 20dci shows a clear P Cygni profile (see inset panel within Figure 6). This is evidence of a strong wind or outflow, with blueshifted absorption in He I 10830 Å frequently seen in FU Ori stars (Connelley & Reipurth, 2018). We estimate a maximum velocity around -450 kms-1.
In the nomenclature of Connelley & Reipurth (2018), PGIR 20dci appears to be a bona fide FU Ori star. In addition to having had its eruption observed, it satisfies all of the spectroscopic criteria: CO absorption, H2O absorption, VO or TiO absorption (weakly), Pa absorption, lack of emission lines, weak metal absorption, and He I 10830 Å absorption. The hydrogen and helium lines likely have some outflow aspect to their absorption. The metal lines originate in the source photosphere, however, and combined with the molecular line absorption, indicate a mixed temperature spectrum.
5 Discussion
The dramatic brightening behavior of PGIR 20dci is detected most obviously in the mid-infrared (Figure 3). The combined Spitzer, WISE, and NEOWISE data provide a long duration lightcurve. As the source has brightened, it has become detectable in the near-infrared as well (Figure 2). In the PGIR data, which is higher cadence, the brightness of PGIR 20dci is currently near the survey limit due to the high background in this field, and the lightcurve is thus somewhat noisy, though well-sampled. Over only the few months prior to manuscript submission, PGIR 20dci has appeared near the faint limit in the ZTF alert stream, sampling the red optical. Given the evidence for a current (second) plateau phase, the source may not become amenable to study in the optical, however.
A two-step rise is indicated by the mid-infrared lightcurve, each step being preceded by a shallow rise phase. The earliest available data for PGIR 20dci show a shallow brightening between 2004 and 2009. Then PGIR 20dci exhibited a rapid (-0.25 mag/month) blue brightening by 1.8 mag in and 0.8 mag between 2009 September 6 and 2010 January 26. This was followed by a shallower slope (-0.01 mag/month), long-term colorless brightening over 2010-2018, amounting to only another 0.5 mag in both W1 and W2. The slope of the brightening increased during the latter part of 2018, and switched in 2019 to a much steeper rise rate (-0.12 mag/month). At this point, the source became detectable by PGIR in the near-infrared. PGIR (1.2 m) and NEOWISE (3.4 and 4.6 m) both record the same rise slope in this time frame, and both show a transition to a plateau during 2020. The total brightening of PGIR 20dci over the past 16-25 years is mag.
Putting these lightcurve results into context, the recent rise slope compares well to the typical rise rates that can be derived for the optical lightcurves of historically documented FU Ori outbursts. These have a wide range, but are most frequently about to mag/month (Hillenbrand, 2021, in preparation). Regarding the two-step rise in the mid-infrared lightcurve, a similar phenomenon was recorded for the confirmed FU Ori source Gaia 17bpi (Hillenbrand et al., 2018). However, in that object the total duration of the first plateau phase was shorter, only 1-2 years, instead of the 5-10 years measured here for PGIR 20dci.
We can estimate a source luminosity near the outburst peak based on the brightness level of the apparent plateau in the lightcurve ( mag from PGIR and mag from ZTF), and the adopted distance kpc. The bolometric correction is of course unknown, but adopting values appropriate for a mid-F type star leads to a luminosity estimate of 10-12 , with perhaps a factor of 3 uncertainty if the bolometric correction is mag. This is on the far low side of FU Ori outburst peak luminosities. Only Gaia 17bpi, the only other source known to have exhibited a two-step mid-infrared brightening, like PGIR 20dci has, and HOPS 383, an embedded young star outburster whose status as an FU Ori type outburst is unclear, have luminosities this low.
Concluding our discussion, we note that the best studied FU Ori stars are the optically visible portion of the population, especially those bright enough for high dispersion spectroscopy. However, a sizable fraction of the known FU Ori stars, about 1/3, are seen only at infrared wavelengths due to high extinction (e.g. the mag population in Connelley & Reipurth, 2018). Indeed, theoretical predictions are that earlier stage young stellar objects experience a higher rate of FU Ori type outbursts (Bae et al., 2014). Most of the known optically invisible group have been designated as FU Ori objects through source brightening at K-band that was noticed only post facto, rather than while it was actually happening, along with spectroscopic confirmation. Embedded FU Ori sources thus generally do not have quiescence-to-rise lightcurves available.
Because it meets all applicable criteria for the FU Ori designation, notably the spectral absorption signatures, lack of emission lines other than P Cygni structure, and the total lightcurve amplitude, PGIR 20dci can be added to the list of optically invisible FU Ori candidates. Unlike the other sources 141414We note that the VVV survey has produced some interesting candidates as well, recently Guo et al. (2020)., PGIR 20dci has had its photometric rise captured through wide-field continuous photometric monitoring programs.
6 Summary
We have discovered an outbursting young stellar object first detected at near-infrared wavelengths, but also seen in long duration mid-infrared time series data. PGIR 20dci is associated with the NGC 281-W molecular core, a known area of recent and ongoing dense star formation activity. Its salient features are:
-
•
A Class I spectral energy distribution.
-
•
Foreground interstellar, molecular core, and circumstellar extinction amounting to mag.
-
•
A photometric rise that was detected in the PGIR time-domain survey, and emphasized by comparing the recent -band photometry with the lack of a -band detection at the same position more than two decades ago in the 2MASS all-sky photometric survey or in the pointed work of Megeath & Wilson (1997), implying a total near-infrared brightness increase of mag.
-
•
Extended nebulosity in our new -band imaging, that was not present in 1990’s images at the same wavelength, with a cometary type structure AU in size.
-
•
A measured 10-15 year photometric brightening trend exhibited in m Spitzer WISE NEOWISE data, accumulating a total mid-infrared brightness increase of mag.
-
•
Steepened mid-infrared brightening during 2019 that was coincident with source detection at J-band.
-
•
Consistent rise rates during 2018-2020 in the mid-infrared NEOWISE lightcurve, and 2019-2020 in the near-infrared PGIR lightcurve, amounting to mag/month.
-
•
A flattening of the lightcurve from its rise phase to a plateau in 2020. The peak luminosity is estimated at a modest 10-12 .
-
•
A near-infrared absorption line spectrum showing hydrogen line, metal line, and molecular band absorption, indicative of a “mixed temperature” spectrum.
-
•
Outflow as evidenced by a He I 10830 Å profile, with blueshifted absorption seen to about -450 kms-1.
We conclude that PGIR 20dci is a bona fide FU Ori star. The object warrants further study, especially at high spectral dispersion, as its outburst continues to develop.
References
- Antoniucci et al. (2014) Antoniucci, S., Giannini, T., Li Causi, G., et al. 2014, ApJ, 782, 51. doi:10.1088/0004-637X/782/1/51
- Armitage (2015) Armitage, P. J. 2015, arXiv:1509.06382
- Bae et al. (2014) Bae, J., Hartmann, L., Zhu, Z., & Nelson, R. P. 2014, ApJ, 795, 61
- Bellm et al. (2019) Bellm, E. C., Kulkarni, S. R., Graham, M. J., et al. 2019, PASP, 131, 018002
- Blagorodnova et al. (2018) Blagorodnova, N., Neill, J. D., Walters, R., et al. 2018, PASP, 130, 035003. doi:10.1088/1538-3873/aaa53f
- Carpenter et al. (1993) Carpenter, J. M., Snell, R. L., Schloerb, F. P., et al. 1993, ApJ, 407, 657. doi:10.1086/172548
- Cody & Hillenbrand (2018) Cody, A. M., & Hillenbrand, L. A. 2018, AJ, 156, 71
- Connelley & Reipurth (2018) Connelley, M. S., & Reipurth, B. 2018, ApJ, 861, A145
- Connelley & Reipurth (2020) Connelley, M. & Reipurth, B. 2020, The Astronomer’s Telegram, 14035
- Costigan et al. (2014) Costigan, G., Vink, J. S., Scholz, A., et al. 2014, MNRAS, 440, 3444. doi:10.1093/mnras/stu529
- Cushing et al. (2004) Cushing, M. C., Vacca, W. D., & Rayner, J. T. 2004, PASP, 116, 362. doi:10.1086/382907
- Cutri et al. (2003) Cutri, R. M., Skrutskie, M. F., van Dyk, S., et al. 2003, “The IRSA 2MASS All-Sky Point Source Catalog, NASA/IPAC Infrared Science Archive.
- Cutri et al. (2012) Cutri, R. M., et al. 2012, VizieR Online Data Catalog, 2311 (WISE)
- Cutri et al. (2012) Cutri, R. M., Wright, E. L., Conrow, T., et al. 2012, Explanatory Supplement to the WISE All-Sky Data Release Products
- Cutri & et al. (2014) Cutri, R. M., & et al. 2014, VizieR Online Data Catalog, II/328 (AllWISE)
- Cutri et al. (2013) Cutri, R. M., Wright, E. L., Conrow, T., et al. 2013, Explanatory Supplement to the AllWISE Data Release Products, by R. M. Cutri et al.
- Cutri et al. (2015) Cutri, R. M., Mainzer, A., Conrow, T., et al. 2015, Explanatory Supplement to the NEOWISE Data Release Products, http://wise2.ipac.caltech.edu/docs/release/neowise/expsup
- De et al. (2020a) De, K., Hankins, M. J., Kasliwal, M. M., et al. 2020, PASP, 132, 025001
- De et al. (2020b) De, K., Kasliwal, M. M., Tzanidakis, A., et al. 2020, arXiv:2004.09029
- Elmegreen & Lada (1978) Elmegreen, B. G. & Lada, C. J. 1978, ApJ, 219, 467. doi:10.1086/155801
- Fazio et al. (2004) Fazio, G. G., Hora, J. L., Allen, L. E., et al. 2004, ApJS, 154, 10. doi:10.1086/422843
- Findeisen et al. (2015) Findeisen, K., Cody, A. M., & Hillenbrand, L. 2015, ApJ, 798, 89. doi:10.1088/0004-637X/798/2/89
- Flewelling et al. (2016) Flewelling, H. A., Magnier, E. A., Chambers, K. C., et al. 2016, arXiv:1612.05243
- Gaia Collaboration et al. (2018) Gaia Collaboration, Brown, A. G. A., Vallenari, A., et al. 2018, A&A, 616, A1
- Graham et al. (2019) Graham, M. J., Kulkarni, S. R., Bellm, E. C., et al. 2019, PASP, 131, 078001. doi:10.1088/1538-3873/ab006c
- Griffin et al. (2010) Griffin, M. J., Abergel, A., Abreu, A., et al. 2010, A&A, 518, L3. doi:10.1051/0004-6361/201014519
- Guetter & Turner (1997) Guetter, H. H. & Turner, D. G. 1997, AJ, 113, 2116. doi:10.1086/118423
- Guo et al. (2020) Guo, Z., Lucas, P. W., Contreras Peña, C., et al. 2020, MNRAS, 492, 294. doi:10.1093/mnras/stz3374
- Herbig (1977) Herbig, G. H. 1977, ApJ, 217, 693
- Herter et al. (2008) Herter, T. L., Henderson, C. P., Wilson, J. C., et al. 2008, Proc. SPIE, 7014, 70140X
- Hillenbrand et al. (2018) Hillenbrand, L. A., Contreras Peña, C., Morrell, S., et al. 2018, ApJ, 869, 146
- Hillenbrand et al. (2019) Hillenbrand, L. A., Miller, A. A., Carpenter, J. M., et al. 2019, ApJ, 874, 82. doi:10.3847/1538-4357/ab06c8
- Holland et al. (2006) Holland, W., MacIntosh, M., Fairley, A., et al. 2006, Proc. SPIE, 6275, 62751E. doi:10.1117/12.671186
- Jarrett et al. (2011) Jarrett, T. H., Cohen, M., Masci, F., et al. 2011, ApJ, 735, 112. doi:10.1088/0004-637X/735/2/112
- Kun et al. (2019) Kun, M., Ábrahám, P., Acosta Pulido, J. A., et al. 2019, MNRAS, 483, 4424. doi:10.1093/mnras/sty3425
- Law et al. (2009) Law, N. M., Kulkarni, S. R., Dekany, R. G., et al. 2009, PASP, 121, 1395
- Lang (2014) Lang, D. 2014, AJ, 147, 108. doi:10.1088/0004-6256/147/5/108
- Lee & Jung (2003) Lee, Y. & Jung, J.-H. 2003, New A, 8, 191. doi:10.1016/S1384-1076(02)00227-0
- Mainzer et al. (2014) Mainzer, A., Bauer, J., Cutri, R. M., et al. 2014, ApJ, 792, 30
- Masci et al. (2019) Masci, F. J., Laher, R. R., Rusholme, B., et al. 2019, PASP, 131, 018003
- Megeath & Wilson (1997) Megeath, S. T. & Wilson, T. L. 1997, AJ, 114, 1106. doi:10.1086/118541
- Minniti et al. (2010) Minniti, D., Lucas, P. W., Emerson, J. P., et al. 2010, New A, 15, 433. doi:10.1016/j.newast.2009.12.002
- Moore & Kasliwal (2019) Moore, A. M., & Kasliwal, M. M. 2019, Nature Astronomy, 3, 109, doi: 10.1038/s41550-018-0675-x
- Sato et al. (2008) Sato, M., Hirota, T., Honma, M., et al. 2008, PASJ, 60, 975. doi:10.1093/pasj/60.5.975
- Szegedi-Elek et al. (2020) Szegedi-Elek, E., Ábrahám, P., Wyrzykowski, Ł., et al. 2020, ApJ, 899, 130. doi:10.3847/1538-4357/aba129
- Shappee et al. (2014) Shappee, B. J., Prieto, J. L., Grupe, D., et al. 2014, ApJ, 788, 48. doi:10.1088/0004-637X/788/1/48
- Sharma et al. (2012) Sharma, S., Pandey, A. K., Pandey, J. C., et al. 2012, PASJ, 64, 107. doi:10.1093/pasj/64.5.107
- Skrutskie et al. (2006) Skrutskie, M. F., Cutri, R. M., Stiening, R., et al. 2006, AJ, 131, 1163
- Stecklum (2020) Stecklum, B. 2020, The Astronomer’s Telegram, 13834
- Tonry et al. (2018) Tonry, J. L., Denneau, L., Heinze, A. N., et al. 2018, PASP, 130, 064505. doi:10.1088/1538-3873/aabadf
- Vacca et al. (2003) Vacca, W. D., Cushing, M. C., & Rayner, J. T. 2003, PASP, 115, 389. doi:10.1086/346193
- Werner et al. (2004) Werner, M. W., Roellig, T. L., Low, F. J., et al. 2004, ApJS, 154, 1. doi:10.1086/422992
- Wilson et al. (2003) Wilson, J. C., Eikenberry, S. S., Henderson, C. P., et al. 2003, Proc. SPIE, 4841, 451. doi:10.1117/12.460336
- Wilson et al. (2004) Wilson, J. C., Henderson, C. P., Herter, T. L., et al. 2004, Proc. SPIE, 5492, 1295. doi:10.1117/12.550925
- Wright et al. (2010) Wright, E. L., et al. 2010, AJ, 140, 1868
- Zackay et al. (2016) Zackay, B., Ofek, E. O., & Gal-Yam, A. 2016, ApJ, 830, 27. doi:10.3847/0004-637X/830/1/27