Role of Crown in Tree Resistance Against High Winds
Abstract
Rather than using wooden sticks to simulate the breakage of trees in high winds as in most research, we employed fresh samples with branches and leaves to certify the crucial role played by the tree crown. By using the blowdown wind tunnel with a maximum wind speed of 60 m/s, we purposely reduce the number of leaves and show that the drag force will drop by as much as two thirds when half pruned. Based on real observations, we model the leaf by an open and full cone in the presence of light and strong wind, and calculate how their corresponding cross-sectional area and drag force vary with wind speed. Different power-law relations are predicted and confirmed by experiments for these properties before and after the formation of a full cone. Compared to the empirical value of 1/3 and 3/4, our simple model gave 2/5 and 2/3 for the power-law exponent of cross-sectional area at low and high winds. Discrepancy can be accounted for by including further details, such as the reorientation of open cones and the movement of branches.
I Introduction
People have been interested at the resistance of solid matter and done many research to find out how different structures affect the strength of material. Direct applications include not only architecture, but also investigating the adaptability of plants, muscles, and bones to extreme conditions. In this study we focus on trees for which the force of twisting and bending due to windpre can be much harsher than gravityroyal . In recent years, climate change increases the number and severity of natural disasterpnas ; frequent ; natgeo . The resistance of trees under extreme climate has gotten attention of scientists pre . Common wisdom tells us that wider crowns and talller trunks catch more wind during the storm. Therefore, they should bear more stress and are more likely to snap. But is it really the case in nature? Correlated by tree allometry selfsim , the crown shape/size and trunk diameter are often associated with many factors, such as optimizing the exposure to sunlight, maximizing the accessability to soil and resistance to wind, and controlling the loss of water through evapotranspiration light ; nature ; science ; 2017Eloy .
A nice example that successfully combined experimental and theoretical studies is found in a recent workpre by a group of French researchers. Based on data from a storm in 2009, they concluded that all trees break down when the wind speed exceeds the critical value of roughly 42 m/s. They simulated distinct varieties and characteristics of tree by different radii of beech stick and pencil lead that were fixed horizontally at one end, while increasing the weight hung at the other end. The radius of curvature was measured until the sample stick broke. By approximating trees as a cylinder, they could calculate the equivalent wind force from the curvature. Finally, they concluded that the critical wind speed at which trees break has nothing to do with the height, diameter, and elastic properties of trees pre .
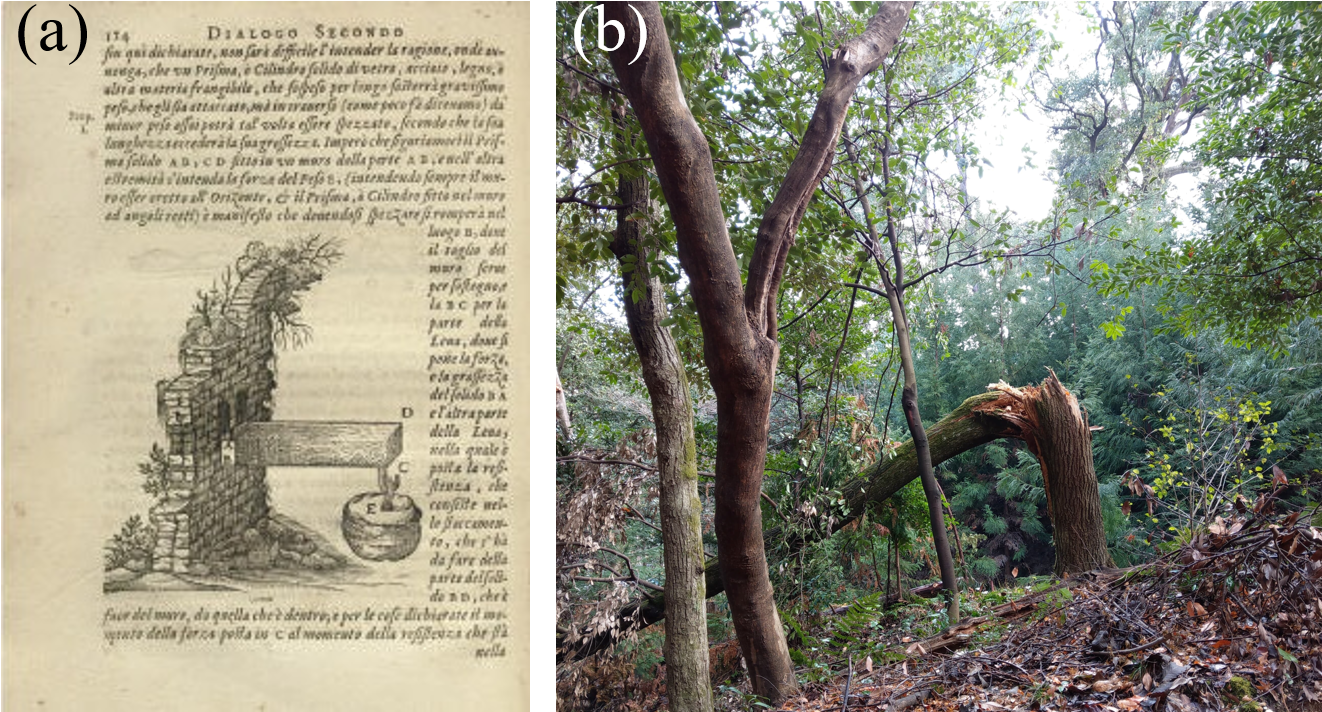
One interesting observation is that their experimental design pre pretty much followed that of Galileo Galilei from the 17th century in Fig. 1(a). This tradition in fact can be traced further back to Da Vinci da and has been observed by later researchers Buffon . Although the conclusions of Ref. pre seemed to match the field observations, there are important loose ends to be tied Comment . For instance, their pencil lead always breaks at the fixed end which is apparently unlike the fate of real trees in Fig. 1(b). Aside from details like this, a more pressing question is how realistic it is to simulate a tree by a cylinder. Most arbonists and urban foresters will protest that branches and leaves ought to play a major role when discussing tree resistance to wind. Otherwise, cutting and pruning of trees will not be regarded as an effective precautionary measure for high winds. Academically a sensible question to ask is how the tree crown contributes to the drag force, while at the same time its cross-sectional area depends sensitively on the wind speed . To obtain , it is thus necessary to obtain intimate knowledge on how leaves are distorted under different magnitude of wind.
There have been many wind tunnel experiments 1973Mayhead in countries where forest industries were well developed since the last century. Among them, a series of noticeable papers 2004Rudnicki ; 2005Rudnicki by Mitchell et al. were dedicated to studying several species of conifers and hardwoods, that concluded (1) the relationship between drag force and the product of branch mass and is near-linear, and (2) the qualitative pattern for how the frontal area of trees was reduced by increasing wind speed was not substantially changed by pruning. Unfortunately, the speed of their wind tunnel was limited to under 20 m/s.
A useful survey on was made by Cullen2005Cullen who organized literatures that have reported or commented on a linear increase in wind drag by trees with wind speed, and tried to explore possible explanations behind their relationship. Although the data available to him was similarly limited to m/s, he concluded that at high is not inappropriate.
In the mean time, there were other researchers who paid attention to the behavior of leaves under high winds. For instance, Vogel 1989Vogel indicated that some broad leaves reconfigure into increasingly acute cones and their drag coefficients decrease with increasing , but he only provided data for m/s when the leaves already form a full cone. Consider the urgency to understand the role of crown in tree resistance under severe hurricanes saffir whose frequency has increased in recent years, it is imperative to revisit these studies for a wider range of .
II Experimental Setup
We use the blowdown wind tunnel in Fig. 2(a) to simulate the blowing wind. It can be divided into four parts: fan, flow straightener, contraction cone, and test section. The test section has a height of 0.5 m and a width of 1.2 m with a maximum wind speed of 60 m/s, equivalent to strong typhoons or level 17 in the Beaufort scale saffir .
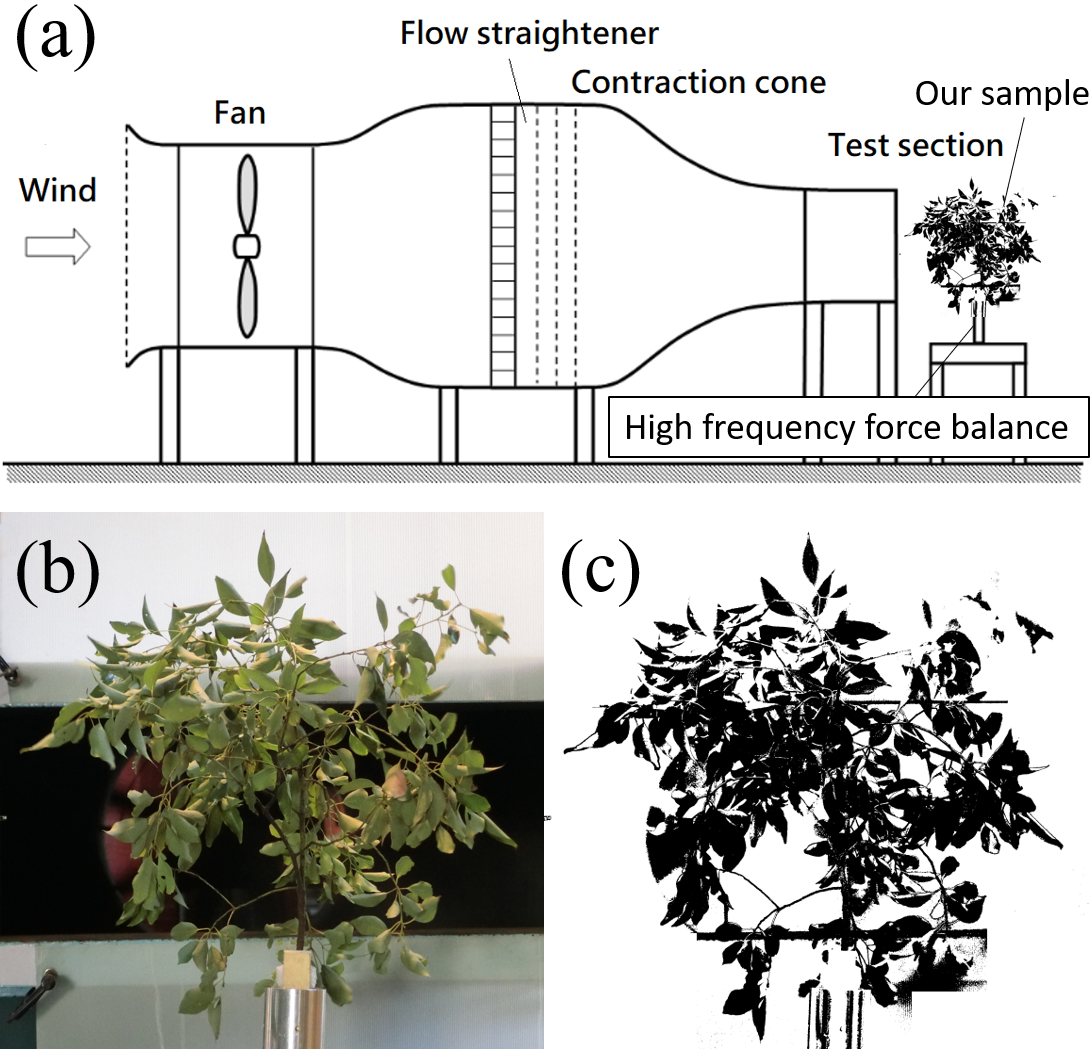
Our sample mainly consists of Cinnamomum camphora, commonly known as camphor tree, that is native to and easily accessible in Taiwan. Fresh sample comprising both branches and leaves is retrieved and connected to a high-frequency force balance to measure the magnitude of wind force experienced by the sample. There are five pairs of strain gauges in the force balance. When the wind starts to pound on the sample, a voltage change can be picked up and transformed to force. Note that the force balance need to be calibrated before the measurement so that the estimated force falls in the valid range of the balance.
We also take pictures of the sample from leeward, such as Fig. 2(b), to compute under different . With the aid of image processing imagej , we distinguish the actual area occupied by the sample from the background, as in Fig. 2(c). This information is useful not only because it quantifies the portion of tree crown that takes the brunt of the wind, but also verifies that leaves and branches and boughs are far from being passive in their interactations with the wind. It is interesting to study how and why they adjust themselves under different .
III Experimental Results
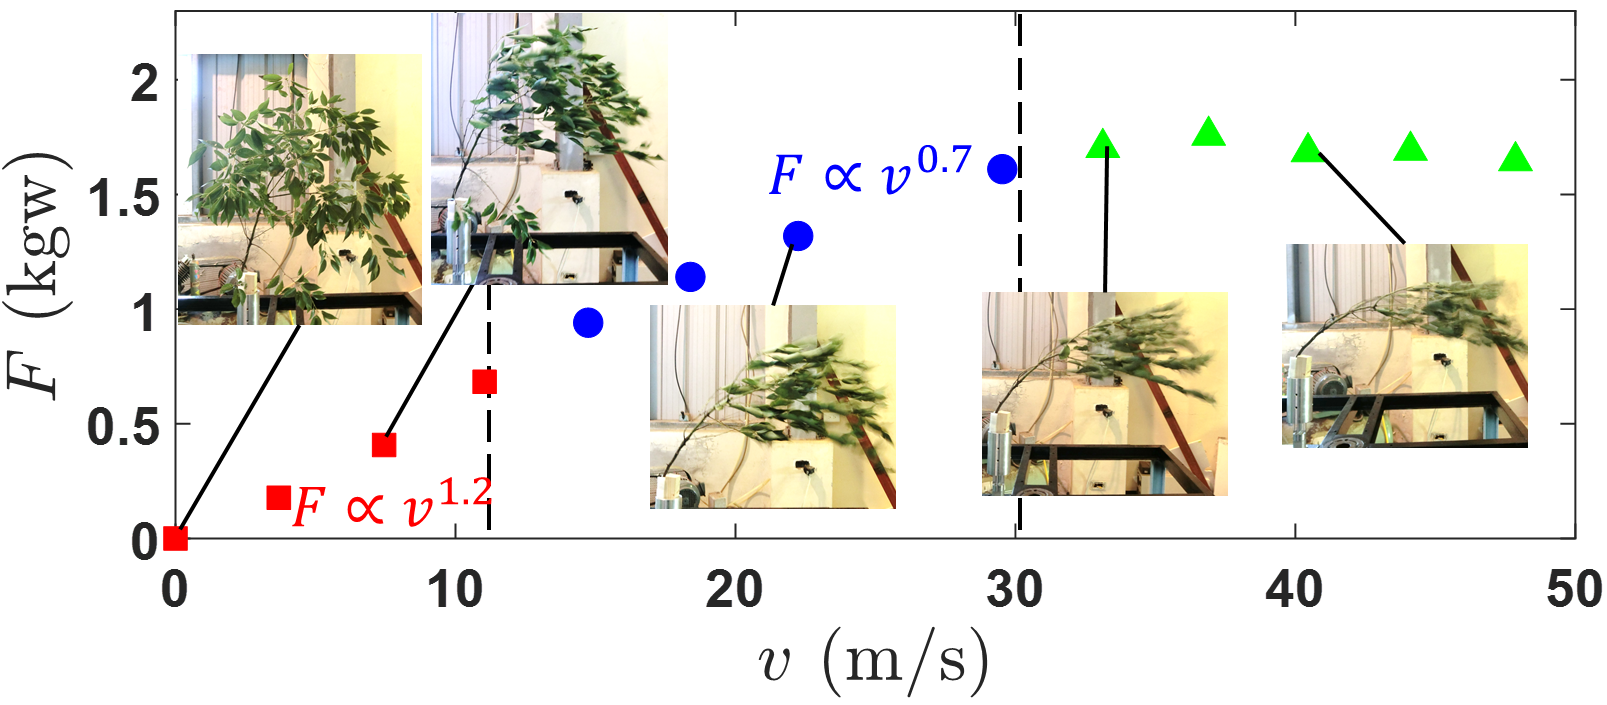
As expected, the force experienced by the sample increases with in Fig. 3 and can be divided into three regimes at around 11 and 30 m/s. When is low, is roughly linear, consistent with the previous research 1973Mayhead ; 2004Rudnicki ; 2005Rudnicki ; 2005Cullen . What has not been reported is that eventually levels off beyond 30 m/s. We ascribe this saturation to the observation that leaves start to be torn and blown off by the high winds, which compensates the increment of wind force experienced by the remaining leaves. Note that this implies the leaves play a dominant role when a tree tries to adjust itself to minimize the damage brought by the adverse environment, as opposed to the relatively passive branches, boughs, and trunk.
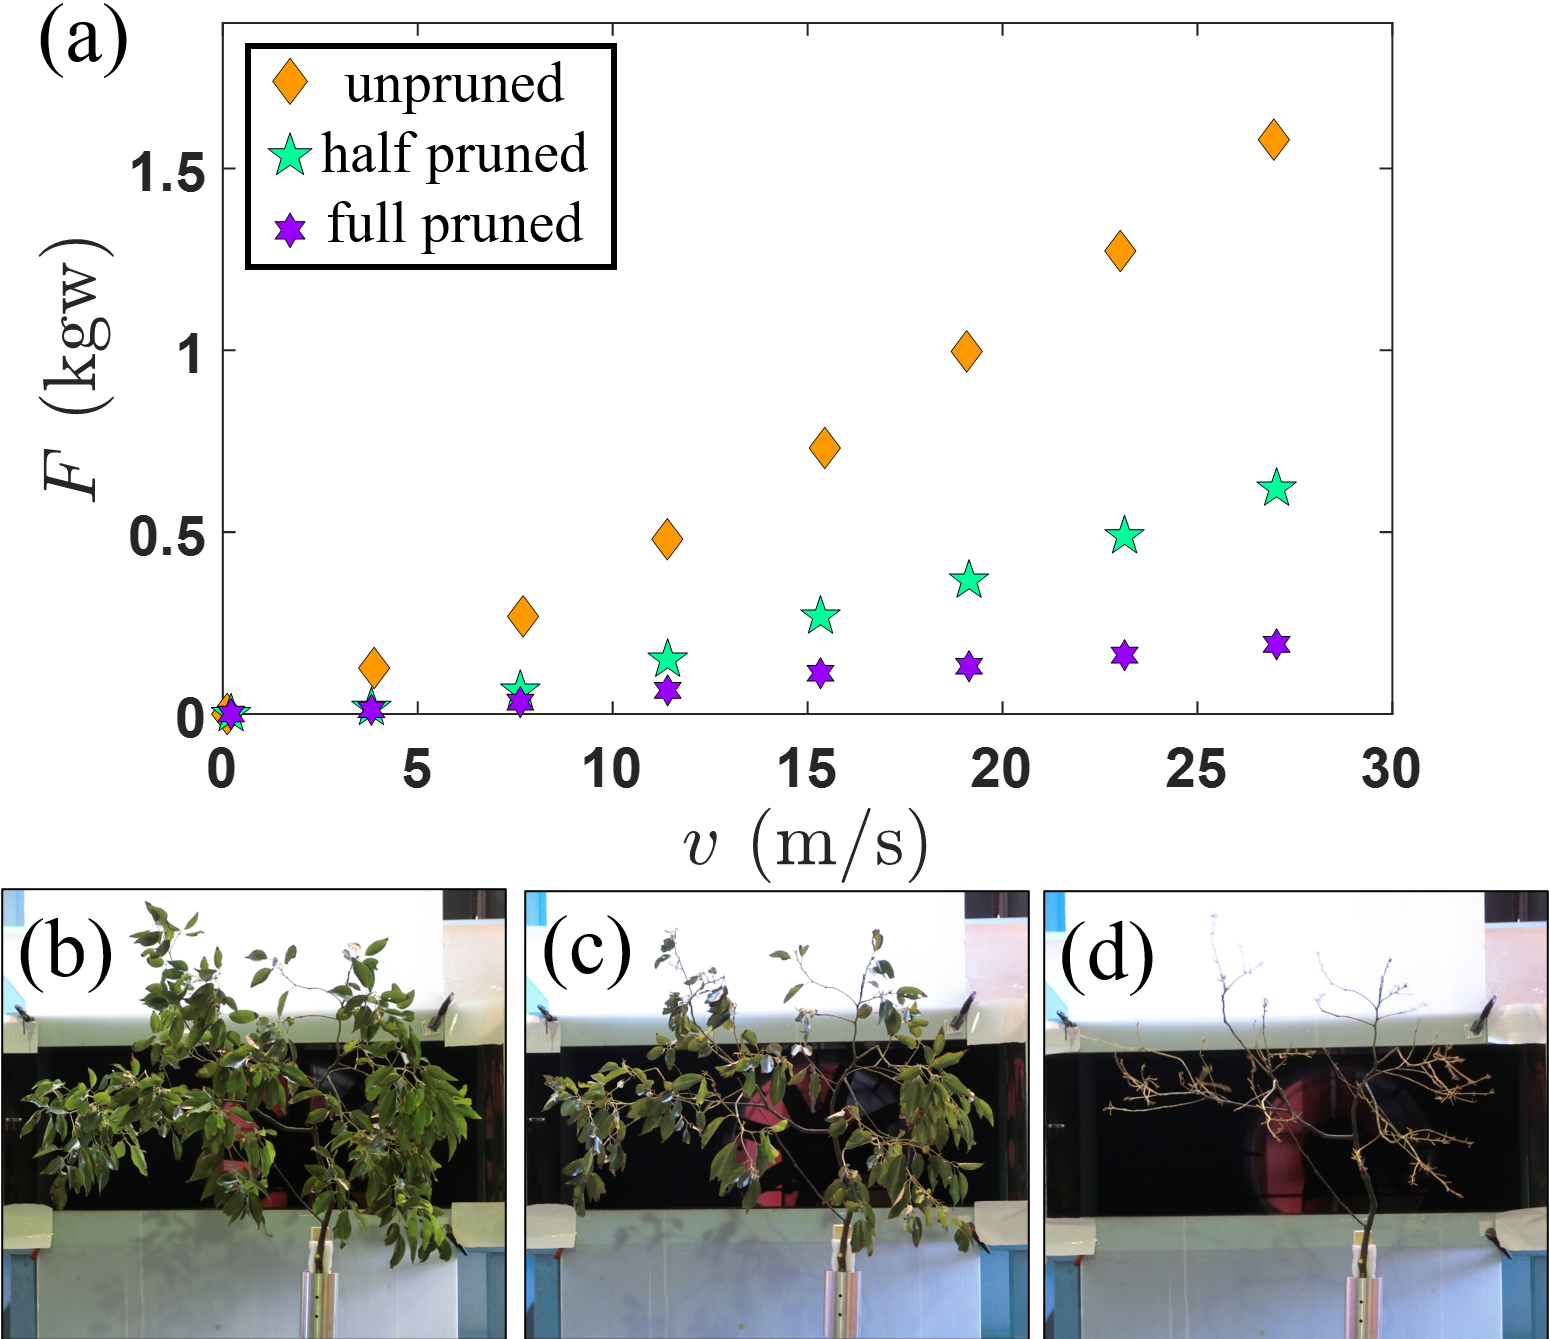
Next, we want to investigate how the density of leaves influences the resistance of trees. In contrast to the original sample, we arrange to trim half of the leaves and the whole leaves in two separate experiments. As shown in Fig. 4, the extent of pruning has a noticable effect on . This is a clear evidence that the crown, leaves in particular, must be taken into consideration when estimating the air drag or the critical wind speed at which trees break pre .
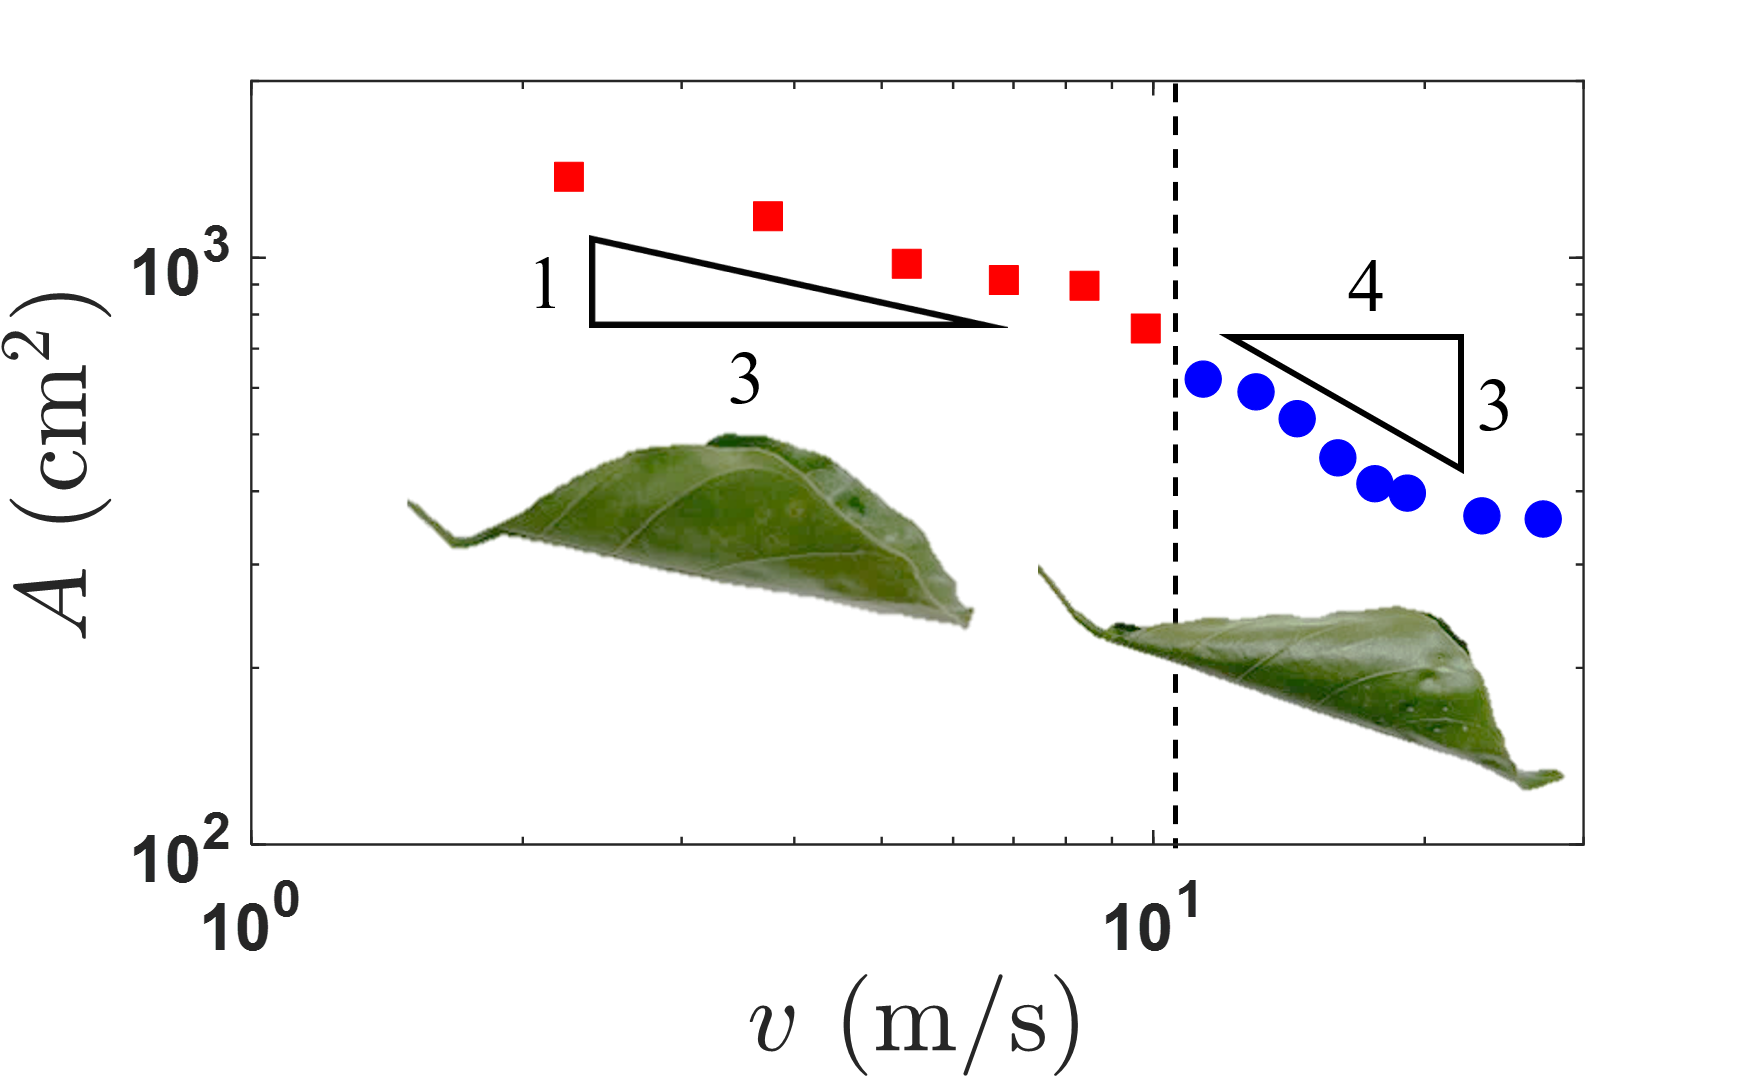
Being an important parameter in our problem, the cross-sectional area of our sample is plotted against wind speed in Fig. 5 which is indicative of power-law behavior, . Coincide with the configurational change at m/s in Fig. 3, the empirical value of is found to transit from 1/3 to 3/4. This implies that the tree crown undergoes a more dramatic rate of reduction in cross section at high winds, although the leaves have already been rolled up in the shape of a full cone.
IV Theoretical Model
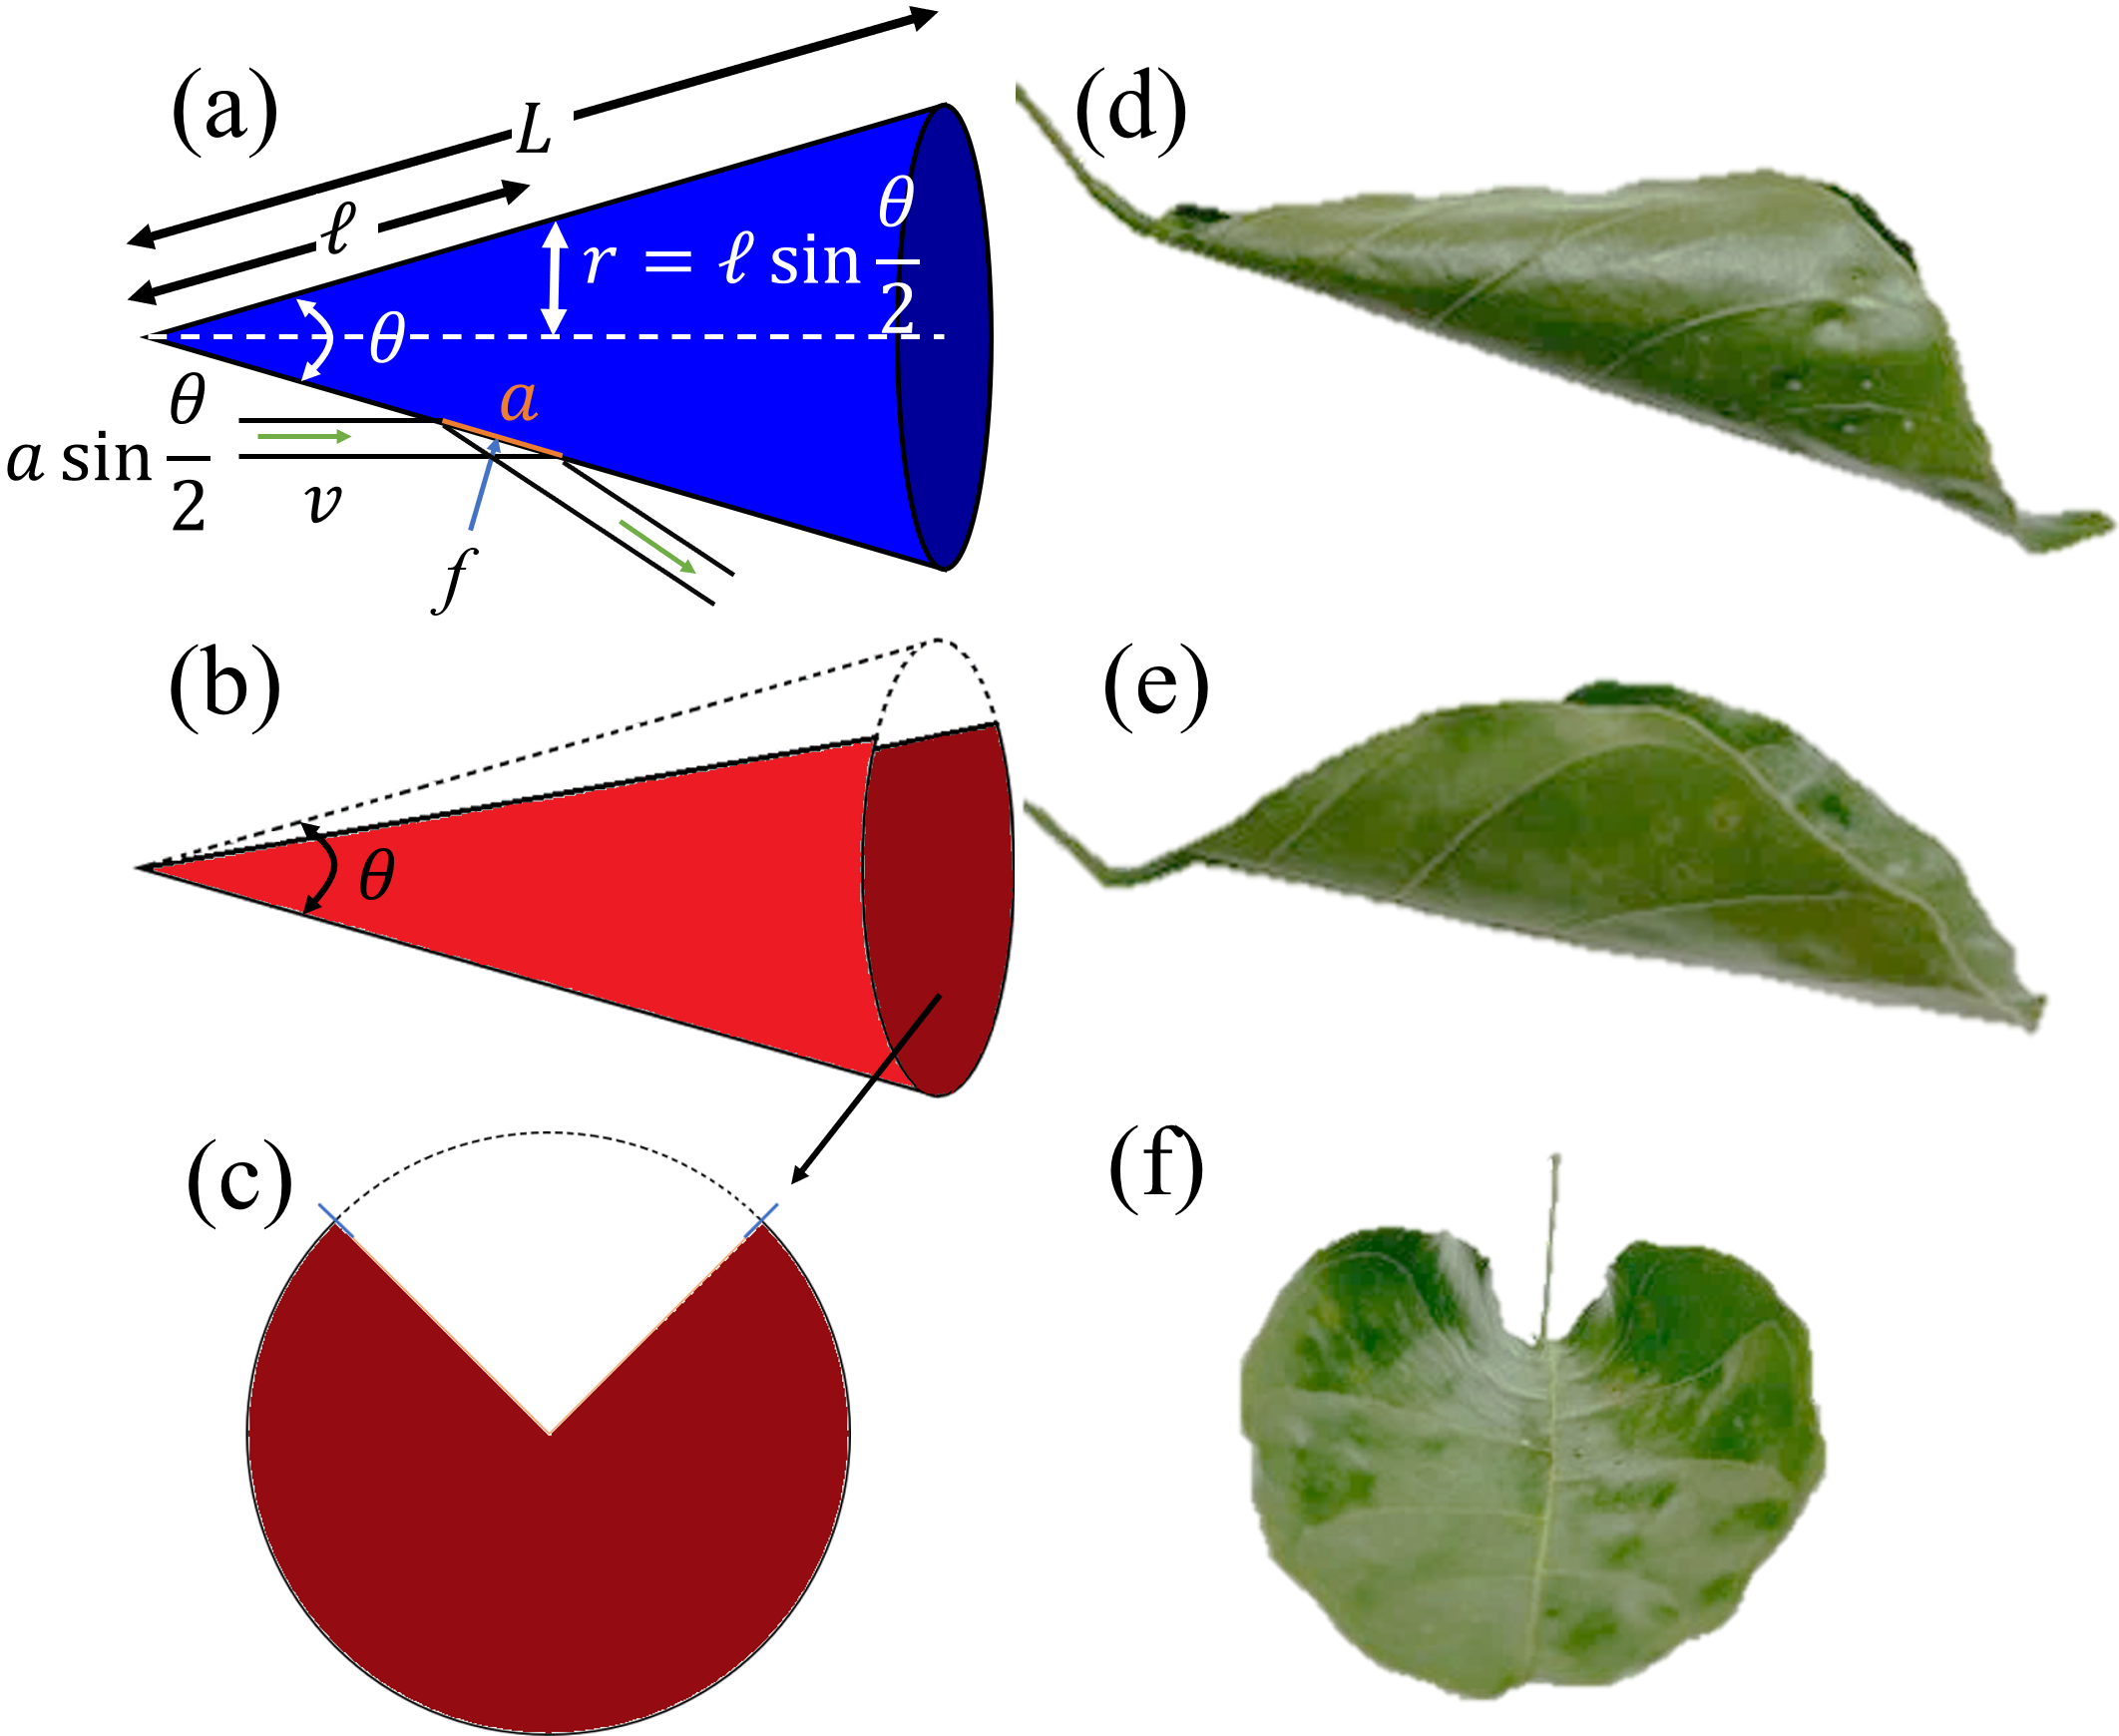
Let’s simplify the leaf shape as being fanlike, for convenience. The radius of sector represents the leaf length, and the central angle multiplied by acts for the width. When blown by the wind, leaves roll into a cone 1989Vogel with an apex angle and height , as indicated in Fig. 6(a). The radius of curvature at a distance from the apex equals . By integrating over different slices of , the total elastic energy of the rolled-up leaf can be calculated as
| (1) |
where denotes the bending modulus and the spurious divergence at can be neglected. Since is mostly much less than 1, differentiating with respect to renders a restoring torque
| (2) |
In the mean time, we can compute the normal force per unit surface area experienced by the leaf due to the constant pounding by wind molecules as where denotes the air density and elastic collisions are assumed without loss of generality. Multiply it by the moment arm and sum over the cone area gives the external torque that tries to roll up the leaf:
| (3) |
Equilibrate Eq. (3) and Eq. (2) immediately gives and since .
We can also compute the drag force on the leaf:
| (4) |
where and do not vary with the surface area. Counting the extra introduced by the surface integral, - close to but slightly different from the linear dependence predicted by previous researchers1973Mayhead ; 2004Rudnicki ; 2005Rudnicki ; 2005Cullen .
For less than 11 m/s, Fig. 3 already suggested that the impulse from wind is not enough to fully roll up the leaf and what ends up is an open cone, as shown schematically in Fig. 6(b). In this case, the restoring torque is the same as Eq. (2) for a full cone because the elastic energy still integrates over the whole leaf surface. However, the external torque will be diminished and need to be recalculated. Replace by and get
| (5) |
which implies , as opposed to in Eq. (3) for a full cone. Set Eq. (5) equal to Eq. (2), we get . Different from the full cone case, only covers a partial circle and is easy to determine as .
How does the opening on the cone affect the drag force? Equally straightforward calculations give
| (6) |
that can be simplified to , consistent with Fig. 3.
V Conclusions and Discussions
By extending the upper bound of wind speed from 20 to over 50 m/s, we found that the drag force remains roughly proportional to before saturating at around 30 m/s when more and more leaves cease to contribute since they are either shattered or blown off by the high wind. Rather than using wooden sticks to simulate trees, we employed fresh camphor samples with branches and leaves. In order to prove that the tree crown plays a crucial role in the resistance in trees to high winds, we purposely reduced the number of leaves and shows that the drag force diminishes sensitively with pruning.
The leaves are found to be rolled up by the wind. As intensifies, the two margins gradually approach and close on each other. Based on this observation, we model the leaf by an open and full cone at low and high winds, and calculate the -dependence of their corresponding cross-sectional area and drag force. As opposed to the empirical value of 1/3 and 3/4, our model predicts =2/5 and 2/3 for low and high winds. Considering the simplicity of our model, its ability to capture the right ballpark figure and a larger value at large is impressive. The discrepancy can be remedied by including more details, such as (1) the gap on the open cone will cause an imbalance in normal force and cause the right side of cone in Fig. 6(b) to tilt upwards. Roughly this will diminish by multiplying it by cosine of the tilt angle. And a smaller implies a larger gap, a bigger tilt, and more decrement for . This correction will cause 2/5 to decrease and move closer to 1/3. (2) After most leaves have formed a full cone beyond m/s, the next heirarchical structure to deform should be the branches. We expect them to be drawn closer to each other by the high wind. In hindsight, this appears to drive some cones out of hiding for some hydrodynamic reasons that we do not yet fully comprehend.
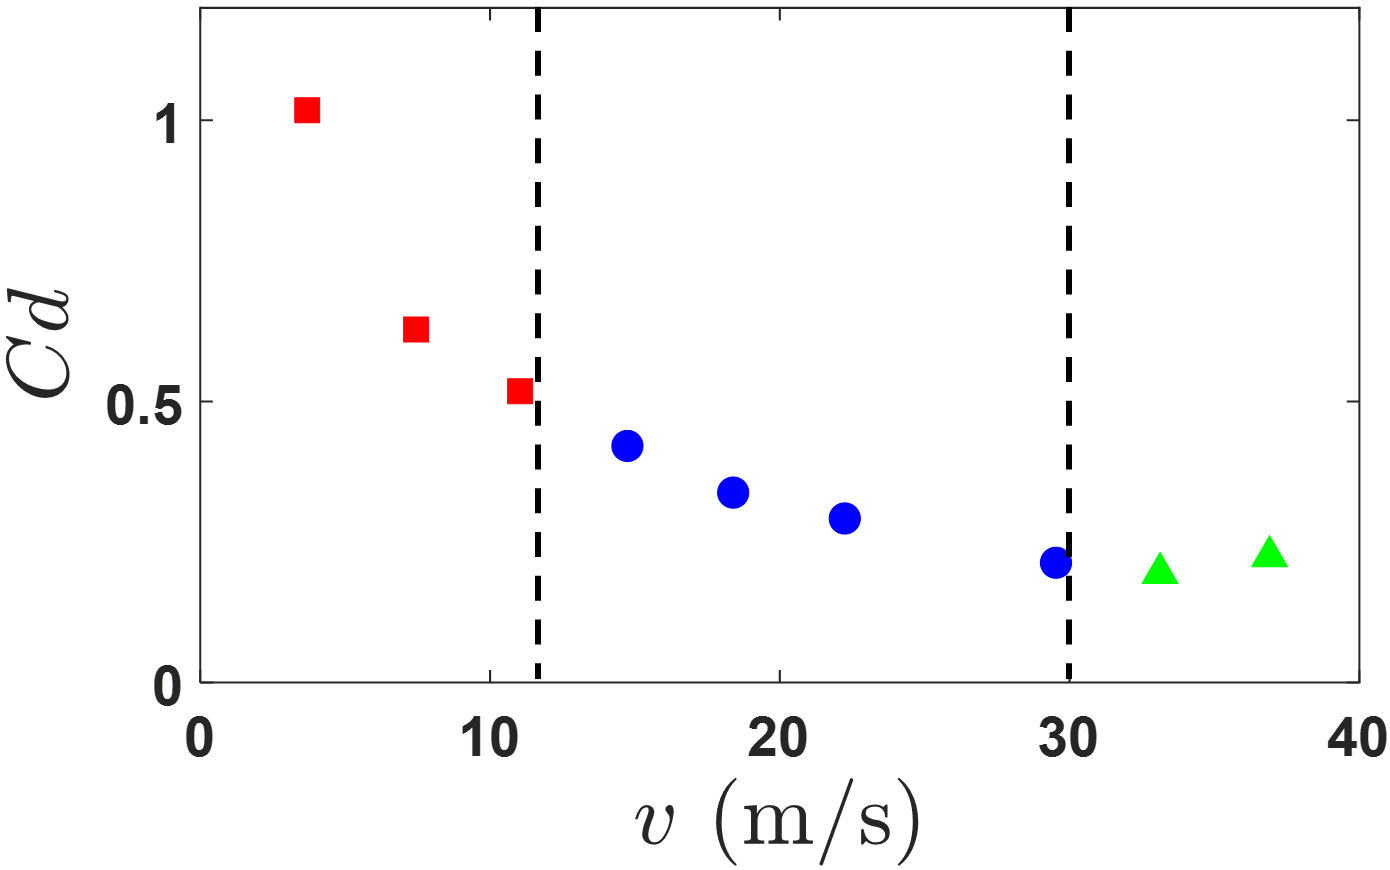
Previous researchers1973Mayhead ; 2004Rudnicki ; 2005Rudnicki ; 2005Cullen also concerned themselves with how the drag coefficient of trees varies with . Our data in Fig. 7 put in the same range [0.2, 1] set by previous research1973Mayhead ; 2004Rudnicki ; 2005Rudnicki ; 2005Cullen where decreases as intensifies. Virot et al. pre used to compute the critical wind speed at which trees break - presumably in the high-wind limit. Judged by Fig. 7, this is an overestimation. If modify to a more realistic value of 0.2, their calculated value for the critical wind speed will jump from 56 to 125 m/s, further deviate from the destined value of 42 m/s.
VI Acknowledgement
We gratefully acknowledge technical assistance from Sheng-Han Hsieh, Li-Jie Chiu, and Professor Wei-Keng Lin, and financial support from MoST in Taiwan under Grants No. 105-2112-M007-008-MY3 and No. 108-2112-M007-011-MY3.
References
- (1) [∗] ming@phys.nthu.edu.tw
- (2) E. Virot, A. Ponomarenko, . Dehandschoewercker, D. Qur, and C. Clanet, Critical Wind Speed at Which Trees Break, Phys. Rev. E 93, 023001 (2016).
- (3) L. Duchemin, C. Eloy, E. Badel, and B. Moulia, Tree crowns grow into self-similar shapes controlled by gravity and light sensing, Journal of The Royal Society Interface 15, 20170976 (2018).
- (4) ProfileNoah S. Diffenbaugh, Deepti Singh, ProfileJustin S. Mankin, Daniel E. Horton, Daniel L. Swain, Danielle Touma, Allison Charland, Yunjie Liu, Matz Haugen, Michael Tsiang, and Bala Rajaratnam, Quantifying the influence of global warming on unprecedented extreme climate events, Proc. Natl. Acad. Sci. (USA) 114, 4881 (2017).
- (5) Brage B. Hansen, Marlène Gamelon, Steve D. Albon, Aline M. Lee, Audun Stien, R. Justin Irvine, Bernt-Erik Sæther, Leif E. Loe, Erik Ropstad, Vebjørn Veiberg, and Vidar Grøtan, More frequent extreme climate events stabilize reindeer population dynamics, Nat. Commun. 10, 1616 (2019).
- (6) Thomas R. Knutson, John L. McBride, Johnny Chan, Kerry Emanuel, Greg Holland, Chris Landsea, Isaac Held, James P. Kossin, A. K. Srivastava, and Masato Sugi, Tropical cyclones and climate change, Nat. Geosci. 3, 157 (2010).
- (7) Christophe Eloy, Leonardo’s Rule, Self-Similarity, and Wind-Induced Stresses in Trees, Phys. Rev. Lett. 107, 258101 (2011).
- (8) Christophe Eloy, Meriem Fournier, André Lacointe, and Bruno Moulia, Wind loads and competition for light sculpt trees into self-similar structures, Nat. Commun. 8, 1014 (2017).
- (9) E. A. Vaganov, M. K. Hughes, A. V. Kirdyanov, F. H. Schweingruber, and P. P. Silkin , Influence of snowfall and melt timing on tree growth in subarctic Eurasia, Nature (London) 400, 149 (1999).
- (10) Thomas McMahon, Size and Shape in Biology, Science 179, 1201 (1973).
- (11) C. Eloy, M. Fournier, A. Lacointe, and B. Moulia, Wind Loads and Competition for Light Sculpt Trees into Self-similar Structures, Nat. Commun. 8, 1014 (2017).
- (12) G. Galilei, Discorsi e dimostrazioni matematiche, intorno due nuove scienze (Appresso gli Elsevirii, Leida, 1638).
- (13) L. da Vinci, Codex Atlanticus (1487-1508), Folio 152 recto-b; A. Uccelli, Leonard de Vinci, tome premier: la science des constructions (Cercle du bibliophile, Paris, 1963).
- (14) G.-L. Leclerc, (Comte de Buffon), Supplment l’histoire naturelle, onzime mmoire: expriences sur la force du bois (Imprimerie Royale, Paris, 1775), pp. 111-184.
- (15) Axel Albrecht, Eric Badel, Vivien Bonnesoeur, Yves Brunet, Thiéry Constant, Pauline Défossez, Emmanuel de Langre, Sylvain Dupont, Meriem Fournier, Barry Gardiner, Stephen J. Mitchell, John R. Moore, Bruno Moulia, Bruce C. Nicoll, Karl J. Niklas, Mart-Jan Schelhaas, Hans-Christof Spatz, and Frank W. Telewski, Comment on “Critical wind speed at which trees break”, Phys. Rev. E 94, 067001 (2016).
- (16) G. J. Mayhead, Some drag coefficients for British forest trees derived from wind tunnel studies, Agric. Meteorol. 12, 123 (1973).
- (17) M. Rudnicki, S. J. Mitchell, and M. D. Novak, Wind Tunnel Measurements of Crown Streamlining and Drag Relationships for Three Conifer Species, Can. J. For. Res. 34, 666 (2004).
- (18) Stephan Vollsinger, Stephen J. Mitchell, Kenneth E. Byrne, Michael D. Novak, and M. Rudnicki, Wind Tunnel Measurements of Crown Streamlining and Drag Relationships for Several Hardwood Species, Can. J. For. Res. 35, 1238 (2005).
- (19) Scott Cullen, Trees and Wind: a Practical Consideration of the Drag Equation Velocity Exponent for Urban Tree Risk Management, J. Arbor. 31, 101 (2005).
- (20) S. Vogel, Drag and Reconfiguration of Broad Leaves in High Winds, J. Exper. Bot. 40, 941 (1989).
- (21) Wind speed of 20 m/s can only be categorized as a gale in the Beaufort scale. https://https://en.wikipedia.org/wiki/Beaufort_scale
- (22) https://imagej.nih.gov/ij/