11email: aage@astro.su.se 22institutetext: Department of Space, Earth and Environment, Chalmers University of Technology, Onsala Space Observatory, SE-439 92 Onsala, Sweden 33institutetext: Omnisys Instruments AB, Ringvägen 100E, SE-118 60 Stockholm, Sweden 44institutetext: OHB Sweden, PO Box 1269, SE-164 29 Kista, Sweden
Herschel and Odin observations of H2O, CO, CH, CH+, and [N ii] in the barred spiral galaxy NGC 1365 ††thanks: Herschel is an ESA space observatory with science instruments provided by European-led Principal Investigator consortia and with important participation from NASA. Herschel was launched on May 14, 2009 and decommissioned on June 17, 2013. ††thanks: Odin is a Swedish-led satellite project funded jointly by the Swedish National Space Board (SNSB), the Canadian Space Agency (CSA), the National Technology Agency of Finland (Tekes), the Centre National d’Etudes Spatiales (CNES), France, and the European Space Agency (ESA). The former Space division of the Swedish Space Corporation, today OHB Sweden, is the prime contractor also responsible for Odin operations. Odin was launched on February 20, 2001 and is still in active operation.
Abstract
Context. The Odin satellite is now into its twentieth year of operation, much surpassing its design life of two years. One of its major astronomical pursuits was the search for and study of water vapor in diverse regions of the Solar System and the Milky Way galaxy. The Herschel space observatory was needed to detect water vapor in external galaxies.
Aims. Our goal is to study the distribution and excitation of water vapor and other molecules in the barred spiral galaxy NGC 1365.
Methods. Herschel has observed the central region of NGC 1365 in two positions, and both its SPIRE and PACS observations are available in the Herschel Science Archive. Herschel PACS images have been produced of the 70 and 160 m infrared emission from the whole galaxy, and also of the cold dust distribution as obtained from the ratio of the 160 to 70 m images. The Herschel SPIRE observations have been used to produce simultaneously observed maps of the 557 GHz o-H2O, 752 GHz p-H2O, 691 GHz CO(), 1037 GHz CO(), 537 GHz CH, 835 GHz CH+, and the 1461 GHz [N ii] lines (efficiently probing the warm ionized medium) in the inner bar and circumnuclear torus region; – however, these observations have no effective velocity resolution. For this reason Odin has recently observed the 557 GHz ortho-H2O ground state line in the central region with high (5 km s-1) spectral resolution.
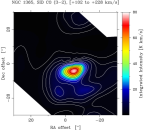
Results. The emission and absorption of H2O at 557 GHz, with a velocity resolution of 5 km s-1, has been marginally detected in NGC 1365 with Odin. The water vapor is predominantly located in a shocked 15″ (1.3 kpc) region near some central compact radio sources and hot-spot H ii regions, close to the northeast component of the molecular torus surrounding the nucleus. An analysis of the H2O line intensities and velocities indicates that a shock-region is located here. This is corroborated by a statistical image deconvolution of our SEST CO() observations, yielding 5″ resolution, and a study of our Very Large Array (VLA) H i absorption observations, as well as comparisons with published interferometric CO observations. Additionally, an enticing 20″ H i ridge is found to extend south-southeast from the nucleus, coinciding in position with the southern edge of an O iii outflow cone, emanating from the nucleus. The molecular chemistry of the shocked central region of NGC 1365 is analyzed with special emphasis on the CO, H2O and CH, CH+ results.
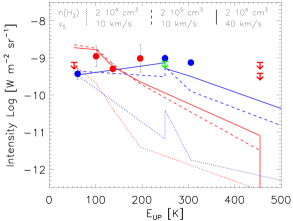
Conclusions. The dominating activity near the northeast (NE) torus component may have been triggered by the rapid bar-driven inflow into the circumnuclear torus causing cloud-cloud collisions and shocks, leading to the formation of stellar superclusters and, hence, also to more efficient PDR chemistry, which, here, may also benefit from cosmic ray focusing caused by the observed aligned magnetic field. The very high activity near the NE torus component may reflect the fact that the eastern bar-driven gas inflow into the NE region is much more massive than the corresponding western gas inflow into the southwest (SW) region. The H2O and CH+ emissions peak in the NE torus region, but the CO and CH emissions are more evenly distributed across the whole circumnuclear torus. The higher energy CO spectral line energy distribution (SLED) is nicely modeled by a low velocity (10 km s-1) shock, which may as well explain the required CH excitation and its high abundance in denser gas. The higher velocity (40 km s-1) shock required to model the H2O SLED in the NE torus region, paired with the intense UV radiation from the observed massive young stellar superclusters, may also explain the high abundance of CH+ in this region. The nuclear H i ridge may have been created by the action of outflow-driving X-ray photons colliding with ice-covered dust grains. A precessing nuclear engine, as is suggested by the tilted massive inner gas torus, may be necessary to explain the various nuclear outflows encountered.
Key Words.:
Galaxies: ISM – Galaxies: individual: NGC 1365 – Galaxies: Seyfert – Galaxies: nucleiAage Sandqvist,
1 Introduction
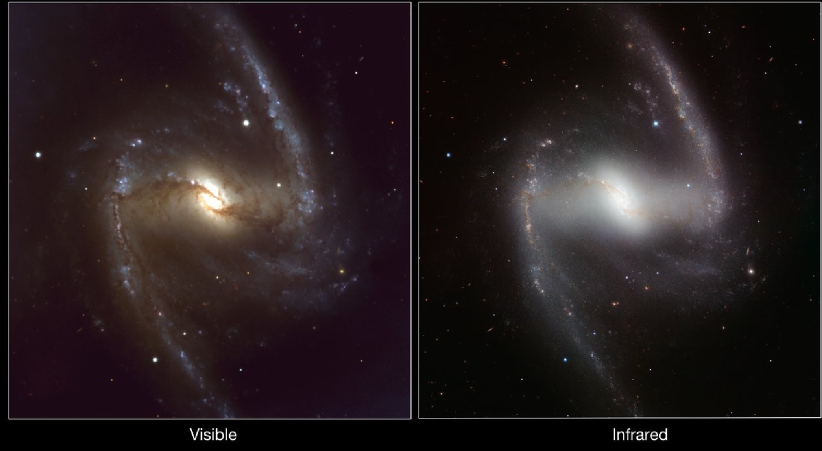
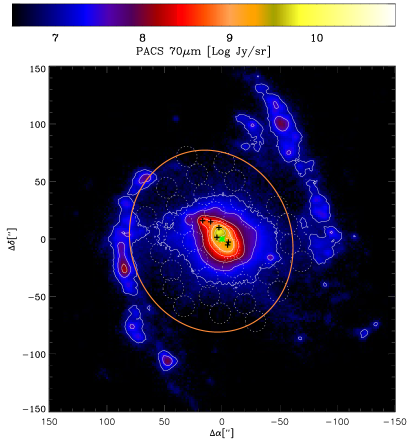
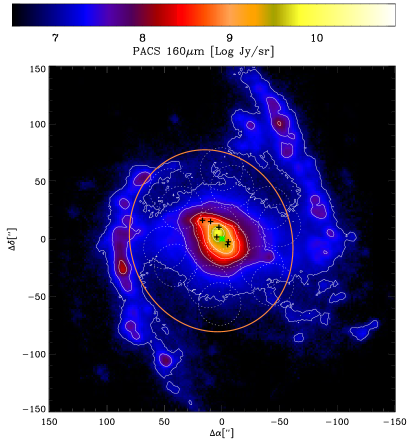
NGC 1365 is a prominent barred supergiant spiral galaxy in the Fornax cluster with a heliocentric velocity of +1632 km s-1 (the velocity with respect to the Local Standard of Rest, km s-1, is used in this paper). In Fig. 1 we present a comparison of a visible-light “true-color” image of NGC 1365 from three exposures taken with the FORS1 camera on ESO’s VLT UT1, along with an infrared -band image ( m) obtained with the HAWK-I camera on the ESO VLT UT4 telescope (ESO/P. Grosböl). The infrared picture suggests a smaller stellar bar, or disk, within the radius of the Inner Lindblad Resonance (ILR) of 30″ (P.A.B. Lindblad et al. lin96 (1996)) that is roughly perpendicular to the larger bar (as well as elongated along the line of nodes). Alonso-Herrero et al. (alo12 (2012)) performed a thorough study of the infrared spectrum ( m) of the central region of NGC 1365 using the Herschel Photodetector Array Camera and Spectrometer (PACS) and Spectral Photometric Imaging REceiver (SPIRE), as well as Gemini and Spitzer. From the Herschel Science Archive, we retrieved their 70 and 160 m PACS observations of NGC 1365 and display 70 m and 160 m images in Fig. 1, where we also indicate the high- and low-frequency beams, respectively, of the SPIRE spectrometer observations presented in Sect. 2.1. The galaxy displays a wide range of phenomena indicating activity – including a Seyfert 1.5 type nucleus with strong, broad, and narrow H lines. Ionized outflows from the active galactic nucleus (AGN) with velocities up to a few hundred km s-1 have been observed (e.g., Venturi et al. ven18 (2018) and references therein). Kristen et al. (kri97 (1997)) used the Hubble Space Telescope to study the Seyfert nucleus and circumnuclear hot spots in NGC 1365 and found these hot spots to be resolved into a number of bright compact condensations, which they interpreted as super star clusters (SSC). The magnetic field in the central region has been mapped at the NRAO VLA with a resolution of 9″ by Beck et al. (bec05 (2005)). Jörsäter & van Moorsel (jor95 (1995)) used the NRAO VLA to map the H i emission distribution in the arms and the bar. In this paper, we present the H i absorption results in the galaxy’s central region, which were not discussed by them. A rapidly spinning supermassive black hole has been disclosed at the center of NGC 1365 by Risaliti et al. (ris13 (2013)). At an assumed distance of 18.6 Mpc (Madore et al. mad98 (1998)), 1″ corresponds to 90 pc. For an extensive review of NGC 1365, see Lindblad (lin99 (1999)).
To set a solid background of observational knowledge, we now provide a rather detailed introductory review upon which the interpretation of our own observations can be based. In a flattened rotating proto-galaxy – very likely created in the potential well of a cosmological dark matter fluctuation (Persson et al. per10 (2010)) – there exist intrinsic instability modes such as spiral and bar instabilities, which may be triggered by encounters with nearby galaxies or by internal “noise” (e.g., P.O. Lindblad lin60 (1960); Lin & Shu lin64 (1964); Shu et al. shu73 (1973); Sundelius et al. sun87 (1987); Pfenniger & Norman pfe90 (1990); P.A.B. Lindblad et al. lin96 (1996); P.O. Lindblad lin99 (1999); Pinol-Ferrer et al. pin12 (2012)). Here the A. Toomre (too64 (1964)) (in)stability criterion is a useful constraint.
Inside corotation, the bar pattern velocity is slower than the rotational motion of the gas. According to modeling and observations (e.g., P.A.B. Lindblad et al. lin96 (1996); P.O. Lindblad et al. polin96 (1996); P.O. Lindblad lin99 (1999); Sakamoto et al. sak07 (2007); Elmegreen et al. elm09 (2009)), the gas catches up with the bar, and when leaving it on the front side of the bar experiences a strong shock with a drop of velocity of up to a few hundred km s-1. This leads to an inflow of gas along the curved leading dust lanes of the bar (in the eastern bar estimated to be 22 /year at an inflow velocity of 80 km s-1), creating a rather massive rotating torus inside the ILR. Here the orbit crowding is expected to cause multiple cloud-cloud collisions and shocks, leading to cloud coalescing into very massive ( ) cloud complexes, as well as to the subsequent birth of OB stars and massive (several ) stellar superclusters, as is observed in the outer NGC 1365 torus (Elmegreen et al. elm09 (2009); Galliano et al. gal12 (2012); Fazeli et al. faz19 (2019)). The aforementioned expectations were based upon the fact that massive OB stars are born (mainly) in the spiral arms – where orbit crowding and density wave streaming is causing cloud-cloud collisions and shocks (cf. Roberts & Stewart rob87 (1987); Rydbeck et al. ryd85 (1985); Aalto et al. aal99 (1999); Schinnerer et al. sch10 (2010)) – as concluded from the Milky Way observational result, that the number of giant H ii regions in a specified volume roughly scales as ¡(H2)¿2, where ¡n(H2)¿ is the mean H2 density in the same volume (Scoville et al. sco86 (1986)). The physical reason for the increased stellar formation activity is the increased external pressure created by the spiral arm molecular cloud collisions, triggering multiple massive gravitational collapses in these clouds, already residing in their low internal pressure (low temperature) virial equilibrium. This is a result of the efficient cooling provided by spectral line radiation from the interstellar molecules 12CO, 13CO, H2O, and other species – (astro)chemistry (e.g., Irvine et al. irv87 (1987); van Dishoeck & Blake dis98 (1998); van Dishoeck et al. dis13 (2013)) and (astro)physics in a necessary collaboration (Goldsmith & Langer gol78 (1978); Takahashi et al. tak85 (1985); Neufeld et al. neu95 (1995); see Hjalmarson & Friberg hja88 (1988) for a discussion and additional references).
The very active starburst region in the central parts of the NGC 1365 bar has been studied in CO molecular lines at high resolutions: the CO line with 5″ effective resolution (Sandqvist san99 (1999); this paper), and the lines of 12CO, 13CO, and C18O with 2″ resolution (Sakamoto et al. sak07 (2007)). Sandqvist et al. (san95 (1995)) performed VLA aperture synthesis observations of the radio emission from ionized gas, revealing a lower level circumnuclear ring of radius pc), interspersed with compact radio sources, all of which have spectral indices indicating free-free emission from hot ionized gas, except one, called “F”, which has the spectral index characteristic of synchrotron radiation (see Table 2). They also mapped the distributions of the CO and lines using the SEST (Swedish ESO Submillimeter Telescope, now ”retired”). In the nuclear region, the envisioned synchrotron jet is enshrouded by a fan- or rather cone-shaped ionized gas outflow, revealed by its visual O iii emission (Fig. 7(4) and Hjelm & Lindblad hje96 (1996), discussed in detail in the review paper by Lindblad lin99 (1999)). More recently this kpc-size wide-angle outflow of ionized gases was studied in detail by Lena et al. (len16 (2016)) and Venturi et al. (ven18 (2018)). Combes et al. (com19 (2019)) present Atacama Large Millimeter/submillimeter Array (ALMA) observations of CO() with a resolution of in a sample of seven Seyfert/LINER galaxies which includes NGC 1365, where they estimate a central AGN (black hole) mass of by model fitting to the velocity field observed inside a radius of . It appears that the rotation axis of the inner nuclear torus has a position angle (P.A.) and inclination (Incl.) – (P.A. ; Incl. ) – which markedly deviates from the common rotation axis of the spiral arm disk, the bar, and the outer molecular gas torus of the galaxy (P.A. ; Incl. ). The orientation of the (symmetry) axes of the nuclear outflows (the wide-angle bi-conical ionized gas outflow, the synchrotron radiation radio jet, as well as the narrow CO outflow outlined in the present paper) all seem to be co-aligned with the galaxy rotation axis. The tilted rotation axis of the inner nuclear torus, or accretion disk, may suggest that we are witnessing the action of a precessing nuclear engine, a matter which will be outlined in our forthcoming discussion. The radius of the rotating inner torus, possibly a black hole accretion disk, was determined to be 0.3″ (26 pc) and its estimated gas mass is . Their larger scale mapping, in addition, confirms the outer rotating circumnuclear molecular gas torus of radius 9″ (800 pc), already known from the CO() observations by Sandqvist (san99 (1999)) and the CO() SubMillimeter Array (SMA) mapping by Sakamoto et al. (sak07 (2007)); compare also Fig. 7 of this paper.
The convincing signs of shocks in the NE outer torus region of NGC 1365 have indeed been observationally reported in terms of vibration-rotation 2 m H2 emission lines, requiring shock excitation and also pronounced Br line wings, indicative of outflows and shocks emanating from three carefully studied superclusters (Galliano et al. gal12 (2012)). Fazeli et al. (faz19 (2019)), in their recent VLT SINFONI near-IR bservations of the central 9″ 9″ region of NGC 1365, found strong evidence of shocks – in terms of emission from several 2 m vibration-rotation H2 lines, as well as from the “shock indicator line” 1.644 m “forbidden” Fe ii – all emissions being strong in the SW and eastern side of the circumnuclear torus where the radio sources A, F, and H are situated (See Table 2). Source F may be especially interesting since it is the one being identified with the nuclear synchrotron radiation jet and CO outflow discussed in Sects. 4.3.1 and 4.3.2.
The outer much more massive torus is likely be an important reservoir of matter, feeding the accretion disk of the supermassive black hole (SMBH), but the inward matter transport process between the outer and inner tori is still unclear. However, Lena et al. (len16 (2016)), in their study of the nuclear outflow of ionized gas, also seem to “find kinematic components that may trace gas which has lost angular momentum and is slowly migrating toward the nucleus”. Here Fazeli et al. (faz19 (2019)) find “a spiral-shaped molecular gas structure (at a scale ¡2″) which could indicate inward streaming motions”. Such kinematic features also appear to be be visible in the ALMA data of Combes et al. and hopefully will be discussed in their forthcoming study of gas outflow. Here the observed existence of a narrow relativistic plasma jet outflow and an accompanying co-aligned molecular gas outflow (jet) from the nuclear engine may be important. The cold gas expulsion process may be an upscaled version of the magnetohydrodynamics (MHD) generation of the bi-polar outflows necessary to solve the angular momentum problem of star formation (e.g., Königl & Pudritz kon00 (2000); Arce et al. arc07 (2007)), hence supporting the accretion toward the central AGN. The launching mechanism of the synchrotron jet as such may be a process closely connected with the angular momentum loss required for mass accretion onto and growth of the AGN (e.g., Blandford & Begelman bla99 (1999); Nayakshin nay14 (2014); Garcia-Burillo et al. gar14 (2014)). For a more initiated and detailed discussion, we here refer to Aalto et al. (aal16 (2016)).
The submillimeter line spectrum of the Seyfert galaxy NGC 1068 has been observed with Herschel SPIRE by Spinoglio et al. (spi12 (2012)). While González-Alfonso et al. (gon10 (2010), gon12 (2012)) find that their Herschel SPIRE and PACS observations of multiple H2O lines in the ULIRGs (Ultra-Luminous Infrared Galaxies) Mrk 231, NGC 4418, and Arp 220 were best modeled by FIR excitation (“radiation pumping”), the SPIRE observations of the early-stage merger galaxy NGC 6240 lead Meijerink et al. (mei13 (2013)) to conclude that shock excitation must be the cause of the CO-SLED (Spectral Line Energy Distribution). Submillimeter H2O lines have been studied in detail in nine nuclei of actively star-forming galaxies using the Herschel HIFI, SPIRE, and PACS receivers (Liu et al. liu17 (2017)). That sample did not include NGC 1365 but there are unpublished results which are available in the Herschel SPIRE and PACS Archive, and they form partial basis of the present paper. However, SPIRE does not yield spectral resolution capable of resolving any velocity structure across the galaxy in the signal. Since the 557 GHz (0.54 mm) H2O line is a sensitive indicator of the existence of photodissociation regions (PDR) and other physical and chemical processes, leading to enhanced H2O abundances such as outflows and shocks (e.g., Hjalmarson et al. hja03 (2003), hja05 (2005); Gerin et al. ger16 (2016)), we have used the Odin satellite to probe the central region of NGC 1365 with high spectral resolution in this H2O line.
The outline of this paper reads as follows. After an Introduction, containing a summary of the current knowledge of NGC 1365 relevant for the present communication, we present in Sect. 2 observations by the Herschel and Odin space telescopes. In Sect. 3 our new results from the Herschel PACS and SPIRE data and the complementary spectrally resolved Odin data are reported together with support analyses of SEST CO() and VLA H i data. In Sect. 4 our results concerning CO, H2O, CH, CH+, [N ii], and H i are discussed in some detail. Our Summary and conclusions are provided in Sect. 5. For the interested reader, we have in Appendices B and C provided shortcut briefings on the interstellar chemistry of H2O and CH, CH+ in prototype regions of our own Galaxy, wherein the physical and chemical conditions and processes are more accurately known, for comparison with observational results in external galaxies.
2 Observations
2.1 Herschel SPIRE
The nuclear region of NGC 1365 has been observed by Herschel using the SPIRE Fourier-transform spectrometer in the SpireSpectroPoint observing mode at two positions near the two maxima of the central CO torus, NGC 1365 NE: (J2000.0) (), and NGC 1365 SW: (J2000.0) () – the numbers in parentheses are equatorial offsets from the optical nucleus. These observations, which are unpublished, were made on 22 August 2010 with total integration times of 3476 and 5640 seconds for the NE and SW positions, respectively. The channel resolution of the spectrometer is 1.447 GHz and the half-power beamwidth (HPBW) is roughly 35″ and 20″ for the low- and high-frequency parts of the spectra, respectively (Swinyard et al. swi10 (2010); cf. Fig. 1 of Spinoglio et al. spi12 (2012)). We have retrieved these SPIRE observations from the Herschel Science Archive.
2.2 Odin
The observations of NGC 1365 in the 557 GHz H2O line were performed with the Odin space telescope in December 2016, March and December 2017, and February 2018. The satellite was commanded toward the galaxy’s optical nucleus located at (J2000.0) (Lindblad lin99 (1999)). Position-switching was performed in right ascension with the OFF-position being displaced by . The ON-source integration time was 7.4, 51.4, 14.5, and 10.9 hours in December 2016, March and December 2017, and February 2018, respectively. The backend spectrometer was a 1050-channel AOS with a channel resolution of 1 MHz. The system temperature was about 3500 K. The HPBW beamwidth of Odin at this frequency is and the beam efficency is 0.89 (Frisk et al. fri03 (2003)). The nominal pointing accuracy of Odin is 10″, but due to a systematic pointing error, slightly different positions were actually observed in the different periods. For the total averaged H2O profile, this error led to an effective elliptical beam of 140″ 160″, centered at an equatorial offset from the optical nucleus of (+10″, 2″). This beam is also displayed in Fig. 1.
3 Results
3.1 Herschel SPIRE and PACS results
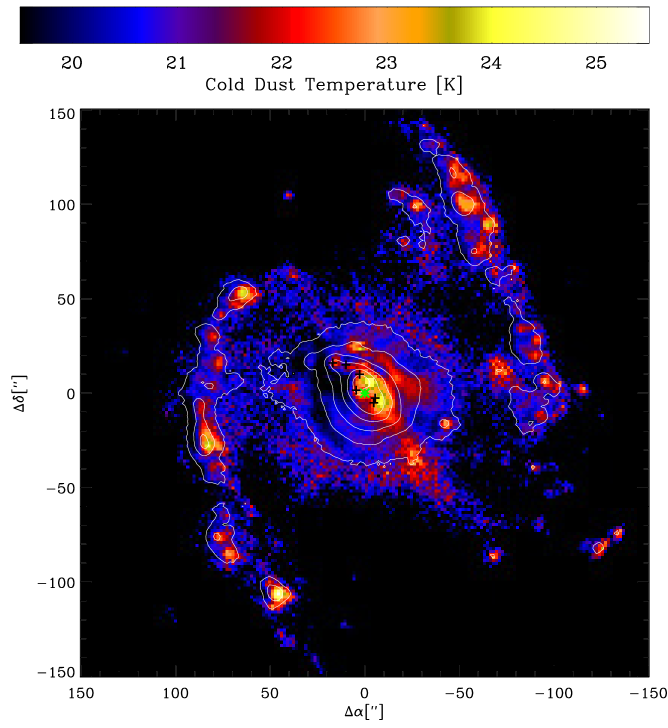
From the ratio of the PACS 160 m to 70 m images of NGC 1365 presented in Fig. 1, we obtain a cold dust color temperature distribution for the entire galaxy (see Fig. 2) in a manner similar to Alonso-Herrero et al. (alo12 (2012)) who used the 100 m to 70 m PACS images for the central region.
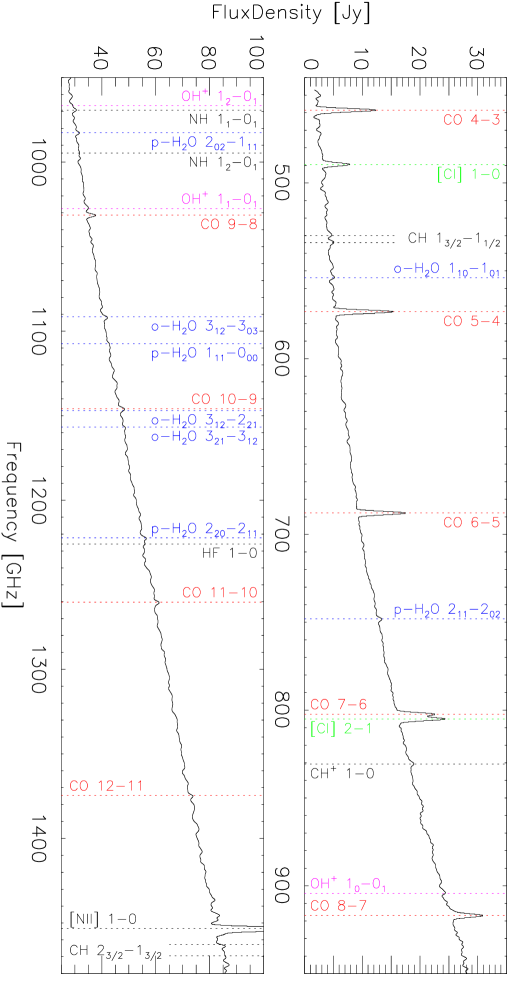
The Herschel SPIRE apodized spectrum obtained toward the NGC 1365 NE torus position, corrected to a continuum source size of 14″ in a 40″ beam, is shown in Fig. 3. A myriad of lines has been detected for the following molecules: o-H2O and p-H2O, 12CO, CH, NH, CH+, and atoms: [C i] and [N ii]; their properties are listed in Table 1.
| Species | Transition | Frequency | Flux | Flux Error | |
|---|---|---|---|---|---|
| [GHz] | [K] | ( W m-2) | |||
| 12CO | J = 4-3 | 461.041 | 55.3 | 19.11 | 0.38 |
| 12CO | J = 5-4 | 576.268 | 83.0 | 19.27 | 0.38 |
| 12CO | J = 6-5 | 691.473 | 116.2 | 15.87 | 0.38 |
| 12CO | J = 7-6 | 806.652 | 154.9 | 11.95 | 0.38 |
| 12CO | J = 8-7 | 921.800 | 199.1 | 10.16 | 0.38 |
| 12CO | J = 9-8 | 1036.91 | 248.9 | 6.86 | 0.75 |
| 12CO | J = 10-9 | 1151.99 | 304.2 | 3.57a𝑎aa𝑎aBlended CO and H2O | 0.79 |
| 12CO | J = 11-10 | 1267.01 | 365.0 | 3.50 | 0.75 |
| 12CO | J = 12-11 | 1382.00 | 431.3 | (1.85) | 0.75 |
| 12CO | J = 13-12 | 1496.92 | 503.1 | 0.75 | |
| o-H2O | 110-101 | 556.936 | 60.9 | 1.10 | 0.38 |
| o-H2O | 312-303 | 1097.36 | 249.4 | 2.88 | 0.75 |
| o-H2O | 312-221 | 1153.13 | 249.4 | (1.18)a𝑎aa𝑎aBlended CO and H2O | 0.79 |
| o-H2O | 321-312 | 1162.91 | 305.2 | 2.21 | 0.75 |
| o-H2O | 523-514 | 1410.62 | 642.4 | 0.75 | |
| p-H2O | 211-202 | 752.033 | 136.9 | 1.49 | 0.38 |
| p-H2O | 422-331 | 916.172 | 454.3 | (0.66) | 0.38 |
| p-H2O | 202-111 | 987.927 | 100.8 | 3.27 | 0.75 |
| p-H2O | 111-000 | 1113.34 | 53.4 | (0.92) | 0.75 |
| p-H2O | 422-413 | 1207.64 | 454.3 | 0.75 | |
| p-H2O | 220-211 | 1228.79 | 195.9 | 2.86 | 0.76 |
| CH | 13/2-11/2 | 532.7 | 25.7 | 1.19 | 0.38 |
| CH | 13/2-11/2 | 536.8 | 25.8 | 1.81 | 0.38 |
| CH | 23/2-13/2 | 1470.7 | 96.3 | 2.53 | 0.75 |
| CH | 23/2-13/2 | 1477.3 | 96.7 | 2.23 | 0.75 |
| NH | 12-01 | 974.48 | 46.8 | 2.82 | 0.76 |
| NH | 11-01 | 999.97 | 48.0 | (1.06) | 0.76 |
| CH+ | 1-0 | 835.137 | 40.1 | 1.47 | 0.38 |
| CI | 3P1-3P0 | 492.161 | 23.6 | 9.06 | 0.38 |
| CI | 3P2-3P1 | 809.342 | 62.5 | 15.06 | 0.38 |
| NII | 3P1-3P0 | 1461.128 | 70.1 | 87.60 | 0.75 |
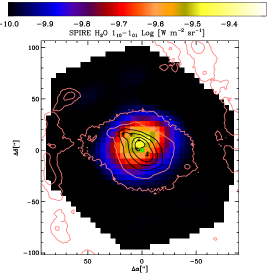
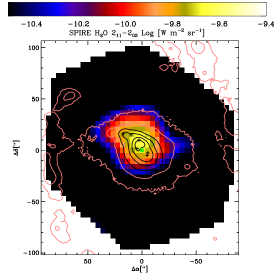
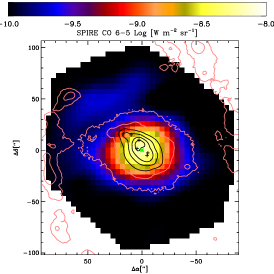
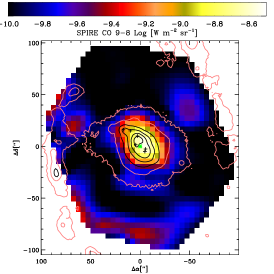
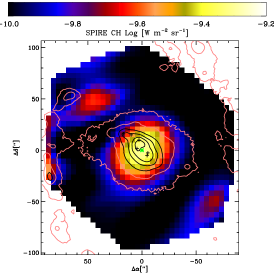
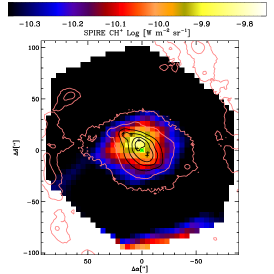
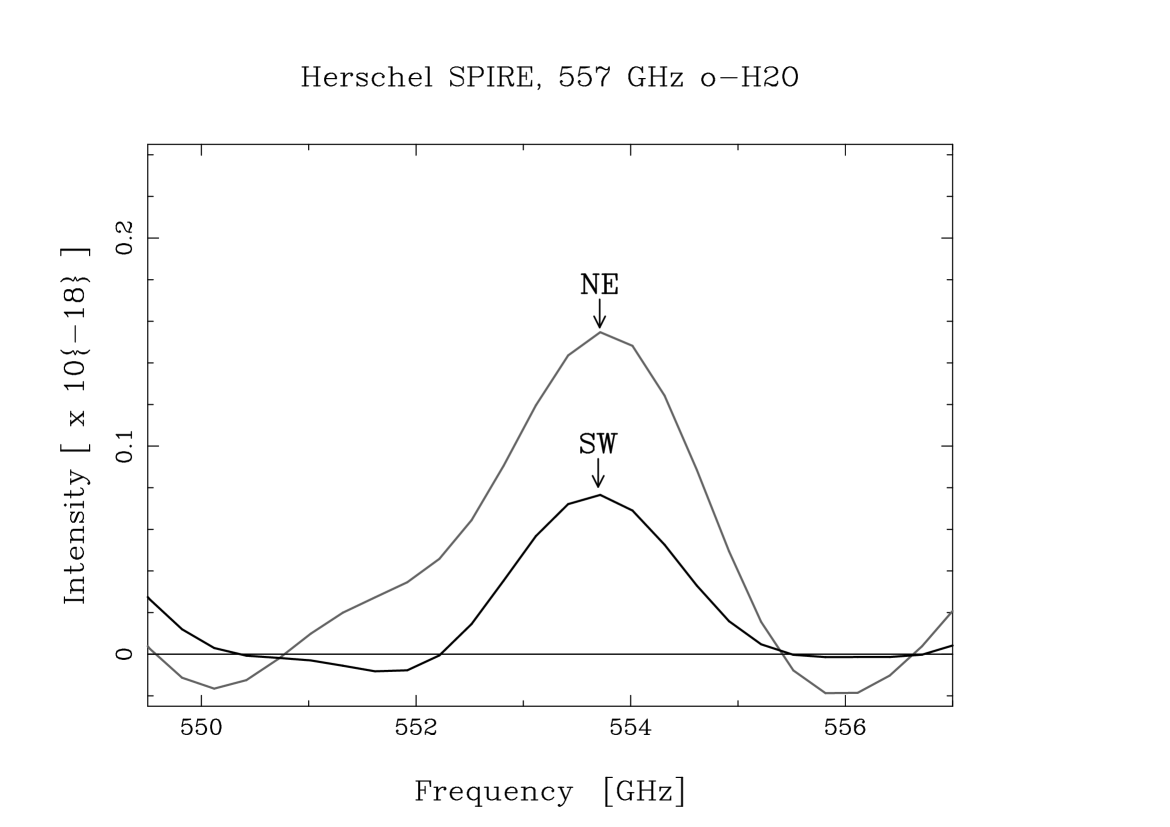
We have made map images of the combined NGC 1365 torus NE and SW Herschel SPIRE observations using the 557 GHz o-H2O and 752 GHz p-H2O lines, as well as the and CO lines, 537 GHz CH and 835 GHz CH+ lines. These images are shown in Fig. 4 where they are superimposed upon contours of the PACS 70 m observations (also seen in Fig. 1), which show the distribution of warm dust. We note that the NE torus region is much stronger in warm dust emission than the SW torus peak. The “hot spot” H ii regions L1, L2, L3, L4, L11, and L12 (Alloin et al. all81 (1981)) are also indicated in these figures as is the position of the optical nucleus. Their equatorial offsets from the optical nucleus are listed in Table 2, as are the offsets of the compact radio sources detected by Sandqvist et al. (san95 (1995)), and the co-located compact MidIR sources, detected and studied in detail by Galliano et al. (gal05 (2005), gal08 (2008) and gal12 (2012)) using adaptive optics on the ESO 3.6 m telescope and VLT. The co-location with CO() intensity peaks in the 2″ resolution SMA aperture synthesis mapping by Sakamoto et al. (sak07 (2007)) is also convincingly illustrated in their Figs. 9 and 10, and is confirmed in the ALMA CO() higher resolution mapping by Combes et al. (com19 (2019)).
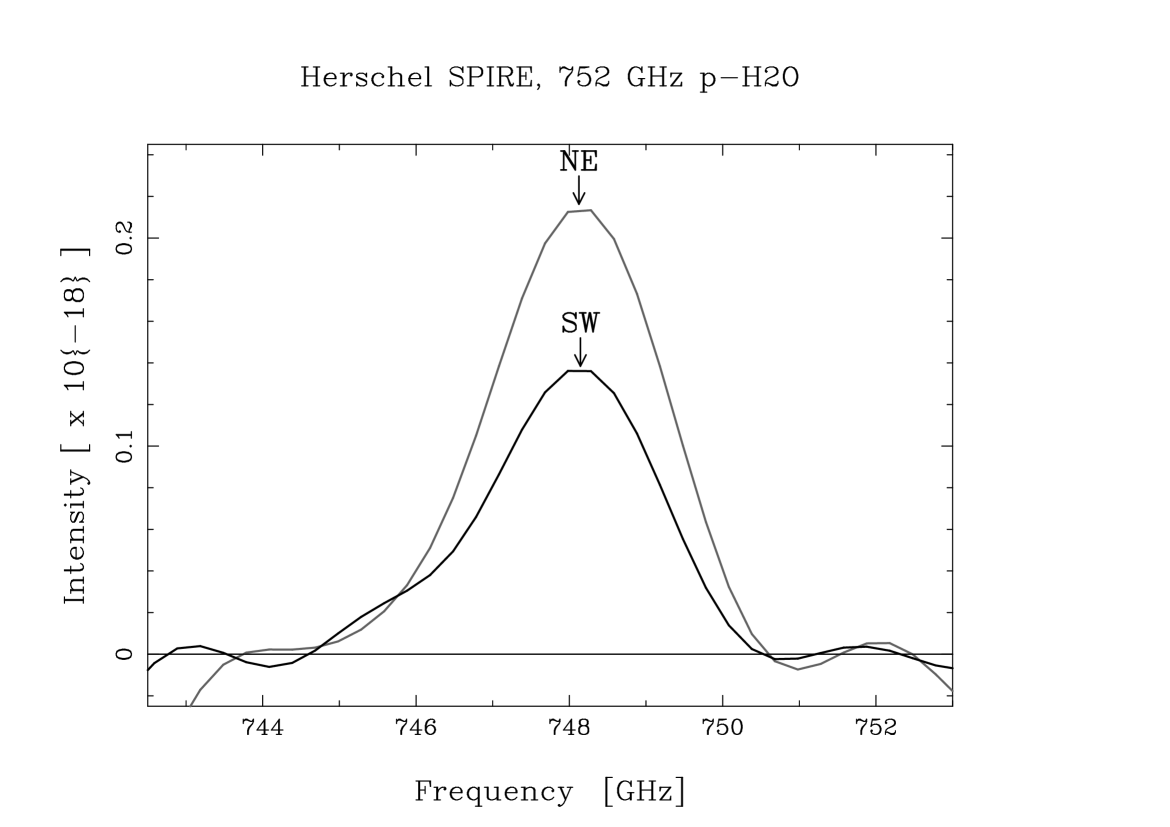
The SEST maximum entropy method (MEM) map of the CO line with 5″ resolution (Sandqvist san99 (1999)) showed that a central molecular torus exists around the nucleus with the NE and SW peaks being of similar magnitudes. This is in clear contrast to the appearance of the 557 GHz o-H2O and 752 GHz p-H2O lines where the NE torus peak is considerably stronger than the SW peak, as can be seen in Fig. 4. This is also illustrated in Fig. 6 where the SPIRE profiles for these lines are presented. Since the torus peak positions NE and SW are separated by only 15″while the beam size is 35″, Fig. 6 in fact tells us that the H2O emissions are very weak in the SW torus peak.
3.2 Odin high spectral resolution H2O results
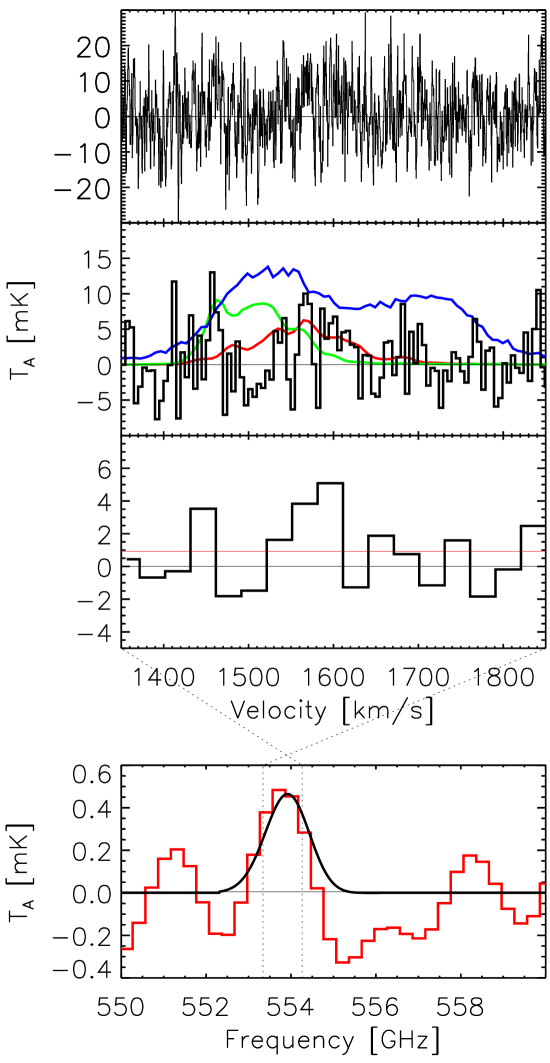
The Odin observations of NGC 1365 in the 557 GHz H2O line for the four different periods were integrated yielding a resultant profile with a total ON-source integration time of 81 hours. In Fig. 5 “Top”, we present the resultant profile with a channel resolution of 0.54 km s-1 and a linear baseline subtracted. In the “Upper Middle” part of Fig. 5 we binned the Odin profile to a velocity resolution of 5 km s-1 and compare it with several CO() profiles – from mapping observations obtained with SEST (Sandqvist san99 (1999)). The blue profile is the total SEST Odin-beam-convolved CO() profile. Two 5″-resolution SEST statistical image deconvolution (SID) CO() line profiles (see Sect. 3.4), observed close to the NE torus peak, are also presented in this panel. The green CO profile is in the direction of ; the red CO profile is in the direction of . In the “Lower Middle” panel of Fig. 5, we binned the Odin H2O profile to a velocity resolution of 30 km s-1 and indicate the 1 rms noise level of 0.9 mK as a red line. Two emission features are above the 3 level, one near 1450 km s-1, the other near 1570 km s-1. There may also be an absorption feature with a 2 intensity near 1500 km s-1. It is interesting that near these three velocities there exist corresponding CO() components in the green profile, presented in the Upper Middle panel of Fig. 5, a profile observed near the radio contiunuum source G (see Table 2). The intensity of the SPIRE data from Fig. 3, convolved to an Odin beam, has an intensity similar to the Odin data convolved to the 1.4 GHz SPIRE resolution. This is shown in Fig. 5 “Bottom” where these two profiles have been superimposed. From the evidence presented in Fig. 5, we draw the conclusion that Odin has indeed made a marginal detection of H2O in NGC 1365 – two H2O emission features near 1450 and 1570 km s-1 and a possible absorption feature near 1500 km s-1.
3.3 VLA H i observations of the central regions of NGC 1365
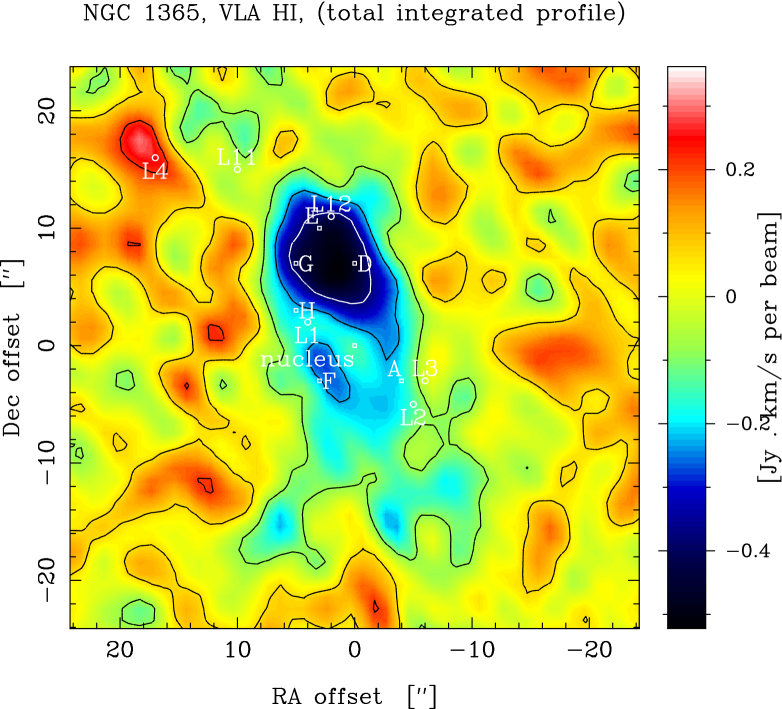
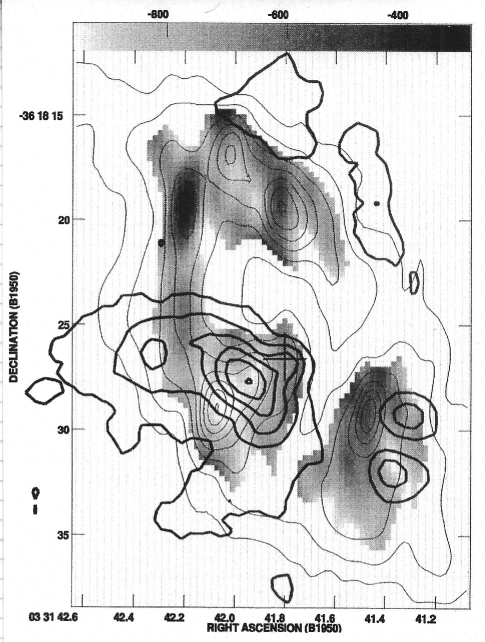
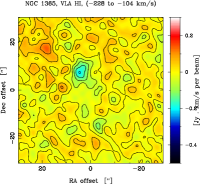
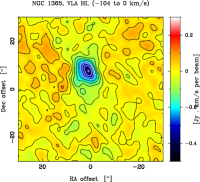
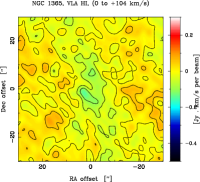
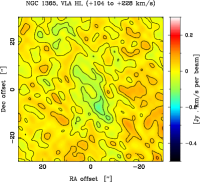
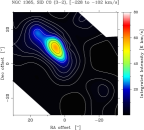
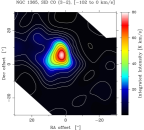
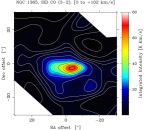
We have used the VLA H i data cube of Jörsäter & van Moorsel (jor95 (1995)) to study the central region of NGC 1365 in greater detail, using both the emission and absorption data. The total integrated line intensity map is shown in Fig. 7. Emission is dominant at the H ii region L4, absorption at the compact radio sources D, E and G, but a marked absorption also is seen at F. Four velocity-integrated maps, spaced at 100 km s-1, are presented in Fig. 8. The dominant H i emission is in the (228 to 104) km s-1 velocity interval and originates in the L4 region at the upper left part of that figure near offsets (+17″,+16″). The major H i absorption is seen in the velocity interval (104 to 0) km s-1 and comes from the D, E, G region near offsets (+1″,+7″), as can be seen in Fig. 8. And, finally, Fig. 8 shows that the major absorption region in the velocity interval of (0 to +104) km s-1 comes from the F region at offsets near (+3″,3″), and in the velocity interval of (+104 to +228) km s-1 comes from the region around sources A, L2 and L3, in the lower right of that H i figure. One may compare these features with the three velocity components seen in the Odin H2O profile presented in Fig. 5 “Upper Middle”, namely the two emission peaks near 1460 (150) and 1560 (50) km s-1 and the absorption component at 1510 () km s-1, where the velocities in brackets are relative to the systemic velocity, all three originating northeast of the nucleus. The H i position-velocity (P-V) maps are presented in Appendix A. In Fig. A.1 (for ″), the map is along the major axis of NGC 1365, through L4 (wide emission), G (strong absorption), the nucleus (empty), and finally A and L3 (absorption). The H i map in Fig. A.1 (for ″) is parallel to the major axis but southeast of it, thus passing through F – the absorption close to +50 km s-1 appears at the position of F.
3.4 Statistical image deconvolution analysis of our CO SEST observations
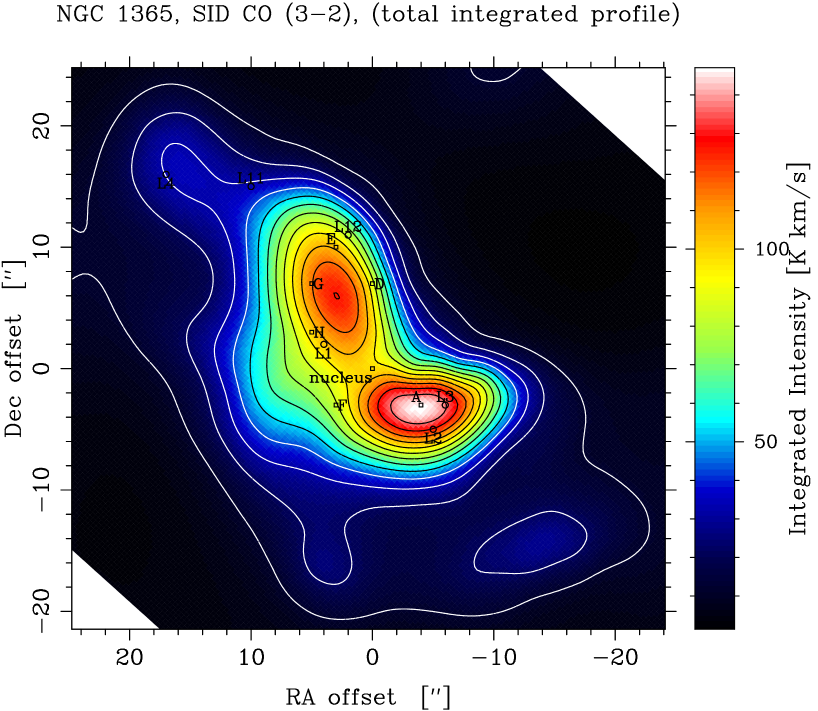
The SEST CO() observations of NGC 1365, published by Sandqvist (san99 (1999)), were performed over an region centered on the optical nucleus. A grid spacing of 10″ was used for the outer parts of the region whereas a grid spacing of 5″ was used for the inner region. We have applied a statistical image deconvolution (SID) analysis (Rydbeck ryd08 (2008)) to the SEST CO observations to obtain high resolution (5″) maps at different velocities and P-V maps. These maps will help us to identify the origins of the different Odin H2O components. The intensity unit in the maps is antenna temperature. The main beam efficiency of 0.26 has been applied in the P-V maps to yield main beam brightness temperature. Examples of CO integrated intensity maps for the total and selected velocity intervals are shown in Figs. 7 and 8; examples of CO P-V maps are shown in Fig. A.1.
A comparison of the integrated intensity H i absorption and CO emission maps, seen in Fig. 7, shows that the main features in both species are oriented in a northeast-southwest direction along the circumnuclear torus. There is an additional somewhat enticing feature seen in the H i map, namely, an approximately 20″-long H i absorption ridge emanating from the nucleus in a south-southeast direction. This H i ridge may have a CO counterpart as shown by the low-level extension in the same direction in the CO map. A careful study of the H i and CO maps in Fig. 8 shows that this ridge has a very wide velocity dispersion. This ridge will be discussed further in Sect. 4.3.1.
| Sources | RA | Dec | Line | Velocity (Width)a𝑎aa𝑎aVelocities and line widths are from Sakamoto et al. (sak07 (2007)) and Galliano et al. (gal12 (2012)). |
| (″) | (″) | ( km s-1) | ||
| L4 | +17 | +16 | ||
| L11 | +10 | +15 | ||
| L12 | +2 | +11 | ||
| L1 | +4 | +2 | ||
| L3 | 6 | 3 | ||
| L2 | 5 | 5 | ||
| D (= M4) | 0 | +7 | CO() | +1560 (70) |
| Br | +1555 (145) | |||
| H2 | +1560 (?) | |||
| E (= M5) | +3 | +10 | CO() | +1540 (60) |
| Br | +1520 (145) | |||
| H2 | +1530 (?) | |||
| G (= M6) | +5 | +7 | CO() | +1480 (80) |
| Br | +1475 (200) | |||
| H2 | +1470 (?) | |||
| H (= M8?) | +5 | +3 | CO() | +1510 (70) |
| Fb𝑏bb𝑏bThe steep spectrum of this compact radio source indicates emission from a synchrotron radiation outflow jet originating in the nuclear engine (Sandqvist et al. san95 (1995); Lindblad lin99 (1999)). | +3 | 3 | CO() | +1590 (90) |
| A | 4 | 3 | CO() |

4 Analysis and discussion
4.1 Gas distribution, dynamics, and star formation in the central region of NGC 1365
The distribution of molecular gas in the central region of NGC 1365 can be understood in the framework of bar-driven gas dynamics, as described in the Introduction. This implies that the rapid inward gas flows along the bar dust lanes are transferred into an oval circumnuclear torus of streaming gas clouds (see Sakamoto et al. sak07 (2007), especially their Fig.12).
4.1.1 Cold molecular gas clouds causing intense star formation
According to our Herschel SPIRE mapping (Fig. 4), the ground state o-H2O (110 - 101) emission at 557 GHz, observed by Odin in NGC 1365 (in the velocity range km s-1), is mainly emanating from within a ″ size (i.e., kpc) region, including the NE hot spot (of CO, etc.) of the circumnuclear torus and some very nearby hot spots east thereof. However, we cannot exclude that some of the water emission in the velocity range km s-1 emanates from the L4 hot spot situated in the leading dust lane of the eastern bar, about 25″ away from the center (see e.g., Fig. 1), since this is also the velocity range observed at this position in the CO() line (see Fig. A.1). Our SPIRE map of the 752 GHz line in fact may support such a contribution, although not the 557 GHz line map (see Fig. 4).
It may seem peculiar that we observe little or no ground state o-H2O emission from the SW torus region (i.e., in the velocity range km s-1), since the CO() as well as the CO() emissions are observed to be similarly strong in the NE and SW torus regions (Sakamoto et al. sak07 (2007); Sandqvist san99 (1999); Fig. A.1 of this paper). However, in addition to the lack of sensitivity in our Odin observations, a likely explanation is offered by the recent mapping of the dust emission at 870 m in NGC 1365 usíng LABOCA (the Large APEX Bolometer Camera; Tabatabaei et al. tab13 (2013)). These authors estimate that the eastern bar is more massive than the western one by at least a factor of four. Hence the bar-driven inflow of gas into the NE torus region may be expected to be much more massive than the similar inflow into the SW torus region. Tabatabaei et al. also find that the dust (and presumably the gas) in the western bar is warmer (about 40 K) than that in the eastern bar (about 20 K) by a factor of two. Even the cold dust temperature map, presented in our Fig. 2, shows a tendency for the western bar to be warmer. This temperature difference may indeed explain why the (optically thick) CO() emissions remain similarly strong in the eastern and western torus and bar regions (Fig. 8 [ to 0 km s-1] and [ to km s-1]) in spite of the apparently very different gas masses.
Using the careful SMA aperture synthesis CO (2-1) mapping at 2″ resolution by Sakamoto et al.(sak07 (2007)), Elmegreen et al. (elm09 (2009)) estimate that the gas inflow into the NE torus region has a velocity of km s-1 and an accretion rate of /yr. They also estimate a star formation rate (SFR) of /yr in the central, circumnuclear torus region (using the observed FIR luminosity). Tabatabaei et al. (tab13 (2013)) find an SFR of /yr in the central 80″ region in a similar way. Based upon their CO mapping, Sakamoto et al. (sak07 (2007)) and Sandqvist (san99 (1999)) estimated the observed central molecular cloud mass to be and , respectively, however relying on very different -factors, vs. (K km s-1)-1. If we instead use a common conversion value of cm-2 (K km s-1)-1 in both cases, as suggested by Tabatabaei et al., we arrive at and – mass estimates likely to be accurate to within a factor of two.
Our CO() P-V diagram (Fig. A.1 [″])
nicely demonstrates an overall solid body rotation
(i.e., a rotational velocity increasing linearly with the distance
from the center) of the cicumnuclear molecular cloud torus region
inside kpc, but with considerable velocity dispersion
caused by individual cloud motion, cloud-cloud collisions, shocks and
outflows (also causing increased turbulence in the clouds). For ¿
1 kpc we observe the expected differential rotation. In fact, we may
also (in Fig. A.1 [″] see a
hint of the NE bar-driven inflow in terms of two velocity components
(at and km s-1, at a major axis offset of +10″, or 0.9
kpc). Correcting for a galaxy inclination of 40°, this velocity
difference becomes close to the aforementioned inflow velocity of 80
km s-1. The P-V diagram also allows us to calculate the dynamical mass
(of gas, stars plus central AGN) inside a specified radius
(using the balance between the centrifugal force caused by rotation at
a velocity and the gravitational attraction of the mass
inside – valid in the low-order approximation of circular
motion), namely,
() = /G,
(1)
where G is the gravitation constant, which in more useful parameters
can be rewritten
)2. (2)
From our P-V-diagrams (Fig. A.1), we may now estimate km s-1/sin 40°= 233 km s-1 and 200 km s-1/sin 40°= 311 km s-1 at and 2 kpc, and hence calculate dynamical masses of and , respectively. Our previously observationally determined gas masses amount to about 20% of the dynamical masses in the center versus an average of 6% in the more extended region (including the center). Hence we may see a trend of increasing gas mass fraction toward the center, but not unexpectedly the stellar mass dominates.
4.1.2 Warm ionized medium, created by the intense star formation
We now move from the discussion of the bar-driven, outer circumnuclear molecular gas torus, causing the formation of supermassive stellar clusters, to the creation of the warm ionized medium (WIM), the ISM component surrounding the molecular cloud ensemble and the stellar superclusters, which is caused by the intense UV radiation of the multitude of newly formed stars.
Nitrogen has a higher ionization potential (14.5 eV) than does Hydrogen (13.6 eV) and will stay atomic N where hydrogen is atomic H or molecular H2, and becomes ionized N+ where hydrogen is almost completely ionized H+. The 205 m N ii line is easily collisionally excited in warmer gas since its upper state energy is 70 K and its critical density is only 44 cm-3. Hence it is an excellent probe of the WIM, consisting of moderately dense H ii regions and ionized boundary layers of clouds, that is to say, a useful measure of the star formation rate (SFR) (Langer et al. lan16 (2016); Zhao et al. zha16 (2016)). Our SPIRE map of the 205 m N ii line (Fig. 7), observed with a 17″ beam, shows that this emission is extended beyond the SW torus peak and here is as intense as in the NE peak. The high SFR observed also at and beyond the SW torus peak provides a nice explanation of the higher dust, gas temperature (40 vs 20 K) and lower dust, gas mass (by a factor four) in the western bar region versus the eastern bar, as estimated by Tabatabaei et al. (tab13 (2013)). This observed mass and temperature asymmetry of the bar may be understood if the western bar region resides in a, somewhat later, high SFR stage, where a larger amount of the star forming molecular clouds has been consumed and where the intense UV radiation from the newly formed stars has heated the dust.
4.2 Analysis of the Odin and Herschel SPIRE observations
4.2.1 Odin results
A Gaussian fit with two emission and one absorption components has been applied to the Odin H2O profile shown in Fig. 5. The values for , , and are 7.1 mK, 1456 km s-1, 42 km s-1 and 5.1 mK, 1582 km s-1, 81 km s-1 for the emission components and mK, 1511 km s-1, 40 km s-1 for the absorption component. The two emission features appear at velocity offsets of and km s-1 with respect to the systemic LSR velocity of 1613 km s-1. The absorption feature has a velocity offset of km s-1. Although the Gaussian fit may be somewhat uncertain – due to the very low signal-to-noise ratio, and since the lower excitation foreground H2O regions may absorb not only the thermal dust continuum but also some of the velocity ranges of the background H2O emission from higher excitation regions – it is worthwhile to use the velocity information in an attempt to determine the origin of the these three 557 GHz H2O regions. In the following, we use our own SEST SID CO() and VLA H i results as well as the CO() SMA observations by Sakamoto et al. (sak07 (2007)) and new ALMA observations of the CO() line by Combes et al. (com19 (2019)).
While the large Odin beam is covering most of the bar, the H2O region has already been limited in extent to the central region by our SPIRE 557 GHz H2O map presented in Fig. 4. The H2O emission is dominant near the NE torus component where the aforementioned hot spot L-regions and compact radio sources gather.
Our CO() P-V map in Fig. A.1 () shows a distinct feature at a velocity offset of km s-1, which is close to one of the H2O emission features velocity of km s-1. That occurs at a major axis offset ″. This position is very close to the compact radio source G (see Table 2) and is also the region in the ALMA velocity map where the velocity offset is most negative, namely km s-1. Near the position of E, the ALMA velocity offset is around km s-1, which is comparable to the Odin H2O absorption feature value of km s-1. Near D the ALMA velocity offset is closer to km s-1, which can be compared to the Odin emission feature value of km s-1. The VLA H i maps in Fig. 8 show major absorptions toward G and D in the velocity offset ranges of ( to ) km s-1 and ( to 0) km s-1, respectively, agreeing reasonably well with the above-mentioned comparisons. Our conclusion is thus that the three Odin H2O features originate in the NE shock region, giving rise to the violent star formation activity caused by the interactions of the - and -like streamlines in the inner bar and center, as proposed by Sakomoto et al. (sak07 (2007)).
An estimate of the expected background continuum antenna temperature, convolved to the Odin effective beam of 140″ by 160″, can be obtained from the Herschel SPIRE spectrum seen in Fig. 3. The flux density continuum level at 555 GHz is 4.5 Jy which converts to 1.5 mK antenna temperature, convolved to the Odin beam.
We now make an effort to estimate H2O abundances based upon
our three-component Gaussian fit to the 557 GHz ground state o-H2O spectrum
observed by Odin. The absorption feature around 1511 km s-1 has a width
km s-1 and appears to be saturated since the absorption
is similar to, or larger than, the continuum level determined from our
Herschel SPIRE spectrum (Fig. 3). A column density estimate for
this lower density, lower excitation foreground gas, or rather a lower
limit thereof, then may be obtained from the relation (derived by
Karlsson et al. kar13 (2013)),
(H2O)(H2O) , (3)
where we assume an optical depth and an
ortho-to-para ratio OPR . The resulting total water column
density becomes (H2O) cm-2. The
corresponding H2 column density, in front of the source(s) of the
thermal dust continuum emission (and H2O emission) being absorbed,
may be estimated from the visual extinctions of the mid/near IR (and
radio) sources M4, M5 and M6 (see Table 2), from their observed
Br/Br ratios, estimateded to be , 3.2
and 8.5 mag, respectively (Elmegreen et al. elm09 (2009)). If we use
an “average” mag in the scaling relation found from
observations by the Copernicus satellite (Bohlin et al. boh78 (1978)),
that is,
(H2)/ cm-2, (4)
our estimate would be (H2) cm-2, with a considerable uncertainty range (for a discussion and references see e.g., Hjalmarson and Friberg 1988). However, this value is in fact about half of the average total column density found from our SID CO() analysis (soon to be discussed), which is a useful criterion of correctness. Finally, the water abundance can be estimated to be (H2O) = (H2O)(H2) – an abundance level which is well accommodated by PDR chemistry in lower density, translucent and diffuse regions (e.g., Hollenbach et al. 2009, 2012; see also our Tables 5 and B.1).
Our previous absorption line analysis must be considered comparatively accurate – since the method itself relies on the realistic assumption that the absorbing molecular population is mainly residing in the lowest possible energy state – although the optical depth of the 557 GHz o-H2O absorption tentatively observed by Odin is uncertain. In case of the two weak emission features apparent in the same Odin spectrum, the analysis uncertainty stems to a large extent from the relatively poor knowledge of sizes, densities, and temperatures of the emission regions, which by nature also are bound to be inhomogeneous. Their approximate sizes of ″ are estimated from our SID CO() maps at 5″ resolution (for the relevant velocity ranges shown in Fig. 8) and the SMA CO() maps at 2″ resolution by Sakamoto et al. (sak07 (2007)). Guidance on temperatures and densities is drawn from the analysis of our multi-transition CO observations by SEST and Herschel SPIRE, presented in Sect. 4.2.2. Two-component fits to the CO rotation diagram, as well as the CO SLED, reveal a hot ( K) component, most likely caused by shock excitation, together with a lukewarm ( K) component having an average H2 density of 104 cm-3. The average H2 column density of the latter component is estimated to be cm-2 across a 10″ 30″ region. According to Eq. (4) this corresponds to a visual extinction mag. However, the surface filling factor of CO emission in this region may be less than 100%. The characteristics of this lukewarm region are very similar to what is expected from PDR-models for high FUV illumination (such as that in the Orion molecular cloud; cf. Fig. 7 of Hollenbach et al. hol09 (2009)). This interpretation is also supported by the best two-component fit of the SED of the thermal dust emission from the central regions of NGC 1365 – one component at K and a necessary second one at K, emitted from % of the total dust mass (Alonso-Herrero et al. alo12 (2012); Tabatabaei et al. tab13 (2013)).
With this information at hand, we assume a cloud temperature K and density (H2) cm-3 in our
RADEX (van der Tak et al. tak07 (2007)) molecular excitation and radiative
transfer model fitting of the 557 GHz o-H2O emission features, each
having an estimated size of only ″ in the
very large Odin antenna beam (, resulting
in a beam filling factor of 1/225). Including the beam
filling correction, we get as input parameters
K and km s-1 for the emission around km s-1 and K and
km s-1 for the emission around km s-1. If we
assume an OPR = 3, the corresponding total ortho- and para-H2O column
densities are RADEX modeled to be (H2O) cm-2 and cm-2, respectively, for
(H2) cm-3, and increasing by an order of magnitude
for the lower cloud density of (H2) cm-3. The
comparison H2 column densities may be roughly estimated from our
SID CO() maps for the velocity ranges to
km s-1 and to 0 km s-1 (Fig. 8) using the scaling
relation
(H2) (CO) cm-2, (5)
where (CO) is the integrated intensity [in K km s-1] (Tabatabaei et al. tab13 (2013); for a discussion of the scaling relation method, see e.g., Hjalmarson & Friberg hja88 (1988)), resulting in (H2) cm-2 and cm-2, respectively, for the two H2O emission regions. For an average cloud density of 105 cm-3, the resulting H2O abundance versus H2 can be calculated as (H2O) (H2O)(H2) for both regions – an abundance increasing by an order of magnitude in case the average density is 104 cm-3. The lower abundance value appears to be consistent with PDR modeling results (Hollenbach et al. hol09 (2009), hol12 (2012)), especially since additional ionization support may exist in terms of cosmic ray focusing by the observed magnetic field alignment (Beck et al. bec05 (2005)). However, substantial contributions to the ground state H2O emission, caused by shock excitation and shock chemistry, are also expected from our modeling of the Herschel SPIRE data presented in Sect. 4.2.2 (see Fig. 9).
4.2.2 Herschel SPIRE results
Before entering a detailed presentation of the multi-transition excitation and radiative transfer analysis of our SPIRE CO and H2O observations (Fig. 3 and Table 1), it may be helpful to examine the spatial distributions of the 557 GHz ground state o-H2O line ( K in the ortho ladder; K vs the para ground state) and the 752 GHz excited state p-H2O line K vs the para ground state), illustrated in Figs. 4 and 6. The two maps show that both lines are strongest in the NE torus peak area. However, it is apparent from Fig. 6 that the 557 GHz line has little or no emission at the SW torus peak, while the 752 GHz excited state transition definitely exhibits emission here (taking into account the beam size of 35″ and the 15″ separation of the observed NE and SW positions). Our subsequent analysis of the CO, as well as the H2O SLEDs, will lead us to the conclusion that shock excitation and shock chemistry must be main players in case of the higher energy lines. Therefore, it is useful to know beforehand that such conditions have indeed been observed in all of the “hot spot” H ii, CO and stellar supercluster regions in the circumnuclear torus, and also in the presumptive synchrotron radiation jet source “F” (see our Table 2; VLT SINFONI high resolution near IR observations by Galliano et al. gal12 (2012) and Fazeli et al. faz19 (2019), to be discussed in some detail in Sect. 4.4).
We now present an analysis of the Herschel SPIRE apodized spectrum obtained toward the NE component of the central torus, which was presented in Fig. 3. As has already been pointed out, the NE component is the dominant one and so of major interest. It is also the component having a velocity field closer to that implied by the Odin H2O profile. We shall first treat the CO lines and then the H2O lines.
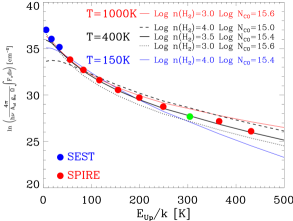
The rotation diagram for the CO lines is presented in Fig. 9(Upper left). The three lowest-level CO lines (blue dots) are obtained from SEST observations presented by Sandqvist et al. (san95 (1995)), Sandqvist (san99 (1999)), and Curran et al. (cur01 (2001)), while the remaining higher-level CO lines (red dots) are from this paper. The results of RADEX analysis applied to these CO lines (also presented in Fig. 9(Upper left)) show that the high CO lines can be best fit by a single kinetic temperature of 400 K and an H2 density of (H2) cm-3, yielding a CO column density of cm-2.
A two-temperature RADEX fit to the CO SLED is presented in Fig. 9(Upper right). The best fit is obtained for an extended cold component with a temperature of K, density (H2) cm-3, yielding a CO column density of cm-2, and a hot component from a more compact region having a temperature of K, density (H2) cm-3, yielding a CO column density of cm-2.
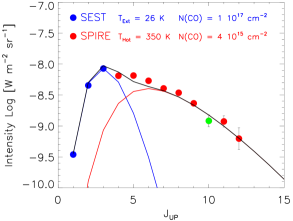
Perhaps it would be more realistic to study the NE region as one involving shocks (see Fig. 9(Lower left)). In this case we have used the C-shock model of Flower & Pineau des Forêts (flo10 (2010)) where we have scaled their values to an equivalent (accumulated) source size of 10″- in order to obtain a best fit. For the low CO lines, we obtain here a slightly warmer extended region with a temperature of K and RADEX values of (H2) cm-3 and cm-2 (represented by the blue curve) and a slow velocity C-type shock with a shock speed of 10 km s-1 and a pre-shock density of (H+2H2) cm-3 (represented by the red curve). This model yields a CO abundance of (CO) .
Our RADEX modeling fit to the intensities of the lower energy lines yields (CO) cm-2 for a homogeneous cloud at a temperature K and density (H2) cm-3. From the mapping of the CO() emission by Sakamoto et al. sak07 (2007)) and our SID CO() deconvolution, it appears that the half power size of the emission region is only about 30″ 10″, which means a beam filling of only 16% in a 40″ beam-size. The resulting CO column density hence becomes cm-2, which for a CO/H2 abundance ratio of means an H2 column density cm-2. According to the scaling relation shown in Eq. (4), this corresponds to a visual extinction of magnitudes. The estimated temperature and density, combined with this visual extinction, most likely tells us (cf. Hollenbach et al. hol09 (2009), hol12 (2012)) that this CO emission must originate in the extended PDR surfaces of the molecular complexes, created by the intense UV illumination from the observed, co-located, newly formed, massive stellar superclusters (Elmegreen et al. elm09 (2009); Galliano et al. gal12 (2012); Fazeli et al. faz19 (2019)).
We now turn our attention to the ortho- and para-H2O lines in the SPIRE spectrum of Fig. 3. RADEX models were performed for two different temperatures, namely 400 and 1000 K, and model values for density (H2) cm-3 – and column density (H2O) cm-2, respectively, were for o-H2O; for p-H2O. None of these models were found to be applicable to the SPIRE H2O data.
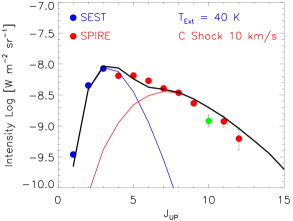
We then attempted water line modeling, using the same slow-velocity C-type shock as above in the CO line analysis, and these results are shown in Fig. 9(Lower right). In this figure the blue and red points and curves represent o-H2O and p-H2O, respectively. The ortho-to-para ratio is assumed to be 3. A shock speed of 10 km s-1 and a pre-shock density (H2) cm-3, nicely matching the SPIRE CO data, do not at all produce a fit to the observed H2O lines. An improvement of the fit is obtained by increasing the pre-shock density by an order of magnitude to (H+2H2) cm-3 and retaining the same shock speed of 10 km s-1. But the best fit is obtained by using the original pre-shock density of (H+2H2) cm-3 and increasing the shock speed to 40 km s-1. It is, however, still somewhat difficult to fit all the para-H2O lines. An approximate H2O abundance for this model is similar to the CO abundance, that is to say, (H2O) = (CO) . In studies of the SPIRE and PACS results for the ULIRGs Mrk 231, NGC 4418, and Arp 220, it has been found that FIR pumping provides an excellent fit to the observed H2O line intensities (Gonzalez-Alfonso et al. gon10 (2010), gon12 (2012), gon14 (2014); cf. Yang et al. yan13 (2013)). The estimated high H2O abundances of here were suggested to result from shock chemistry, (multiple) hot cores, cosmic ray enhancement, XDRs, and, or “undepleted chemistry” where the icy grain mantles were evaporated. In our case of NGC 1365 FIR pumping, paired with an enhanced H2O abundance caused by slow velocity shock sputtering of icy grain mantles (supplemented by any of the above processes), – all expected from observational data – this provides a viable alternative to “our poor man” fast shock modeling. Although no PACS observations of FIR pumping H2O absorption lines are available in case of NGC 1365, we note that the observed intensity of the o-H2O () line, having an upper state energy of 305 K, is much higher than can be reached by the shock modeling (see Fig.9(Lower right)). This strongly suggests that we see the effect of FIR pumping by o-H2O () absorption at 75 m (Gonzalez-Alfonso et al. gon14 (2014)).
4.3 Nuclear gas accretion and outflows
The gas inflow processes from the outer torus region onto the inner torus, nuclear accretion disk, of NGC 1365 were discussed already in the Introduction of this paper. We have in Table 3 collected a number of relevant parameters for the galaxy spiral arm disk, the bar, the bar-driven outer torus region, the inner cold gas torus, the central rapidly spinning SMBH, and the various observed nuclear outflows We have also included in Table 3 some useful comparison parameters for the lens-shaped spiral galaxy NGC 1377, seen edge on, where rather convincing signs of a precessing nuclear bi-polar molecular outflow were observed at ALMA (Aalto et al. aal16 (2016)).
4.3.1 Atomic, molecular and ionic outflows, and a synchrotron radiation jet from the nuclear engine
It was mentioned already in the Introduction, that among the radio hot spots of the circumnuclear ring of gas in NGC 1365, ionized by recent star formation, the outer torus of radius 800 pc, a region “F” with a very steep radio spectrum was “hiding”, see Fig. 7(4) (Sandqvist et al. san95 (1995)). This was further illustrated in our Table 2. The envisioned synchrotron radiation relativistic outflow jet from, and presumably powered by, the nuclear engine, the black hole and its accretion disk, therefore is expected to be be oriented along the rotation axis of the inner circumnuclear molecular gas torus. However, the projected jet orientation instead appears to be along the similar rotation axes of the galaxy, its prominent bar, and the outer molecular gas torus, and along the symmetry axis of the wide-angle ionized gas outflow observed in optical O iii lines, as illustrated in Fig. 7(4) (Sandqvist et al. san95 (1995); Hjelm & Lindblad hje96 (1996); Sandqvist san99 (1999); Lindblad lin99 (1999); Venturi et al. ven18 (2018); see our Table 3). This observational fact is very important in our forthcoming scenario interpretation (Sect. 4.3.2). The observation of a synchrotron radiation jet, having a de-projected size of some 400 pc, depending upon its somewhat uncertain inclination, see Table 3, in fact means that we are probing the radiative acceleration losses in a plasma beam where the electrons are spiraling at relativistic velocities along a strong co-aligned magnetic field. Here it is interesting to point out that the observed magnetic field, which according to the VLA mapping by Beck et al. (bec05 (2005)) is closely aligned with the bar just in the central regions, is turning its direction toward the nuclear engine.
| Object | Rotation | or | Radius | Rotation or | Mass | Period | Remarks | |
| Outflow | Axis | or Size | Outflow Vel. | Dyn.a𝑎aa𝑎aThis paper, Eq.(2). | Gasb𝑏bb𝑏bThis paper, Sect. 4.1. | or Age | ||
| P.A.[°] | Incl.[°] | [kpc/pc] | [ km s-1] | [ ] | [Myr] | |||
| NGC 1365 | ||||||||
| Diskc𝑐cc𝑐cLindblad (lin99 (1999)). | 130 | 50 | 22 | 270 | 360 | 13 | 500 | H i mass |
| Barc,d𝑐𝑑c,dc,d𝑐𝑑c,dfootnotemark: | 50 | 10 | 180 | 13d𝑑dd𝑑dCombes et al. (com19 (2019)), who (in their Table 4) list an inner torus tilt, with an uncertainty of . | 340 | Stellar mass | ||
| Disk | 50 | 10 | 310 | 220 | 9 | 200 | H2 mass | |
| Disk | 2 | 310 | 44 | 2.8 | 40 | |||
| Disk/torusb𝑏bb𝑏bThis paper, Sect. 4.1. | 1 | 230 | 12 | 2.4 | 27 | “Star formation gas ring”, | ||
| Outer torus | 130 | 50 | 800 | 185 | 6 | 27 | with solid body rotation | |
| Outer torus | 500 | 115 | 1.5 | 27 | as visualized in Fig. A.1 | |||
| Nuclear engine: | ||||||||
| Inner torusd𝑑dd𝑑dCombes et al. (com19 (2019)), who (in their Table 4) list an inner torus tilt, with an uncertainty of . | 160 | 63 | 26 | 100 | 0.06 | 0.007 | 1.6 | Note torus axis tiltd𝑑dd𝑑dCombes et al. (com19 (2019)), who (in their Table 4) list an inner torus tilt, with an uncertainty of ., caused by 30° precession angle |
| Black Holed𝑑dd𝑑dCombes et al. (com19 (2019)), who (in their Table 4) list an inner torus tilt, with an uncertainty of . | 0.004 | Rapidly spinning SMBH | ||||||
| Nuclear outflows: | ||||||||
| Radio Jetc,e𝑐𝑒c,ec,e𝑐𝑒c,efootnotemark: | 135 | 20 | 400 | 0.7c? | Table 2; Inclination caused by nuclear engine tilt | |||
| CO outflowf𝑓ff𝑓fThis paper, Table 2 & Sect. 4.3.2. | 135 | 20 | 400 | 70 | 5.9 | Sect. 4.3.1 & ref d); Inclination by nuclear engine tilt | ||
| (80) | (2200) | (23) | (90) | Unlikely inclination alternative; See Sect. 4.3.2 | ||||
| O iii bi-coneg𝑔gg𝑔gHjelm & Lindblad (hje96 (1996)); Lindblad (lin99 (1999)); Venturi et al. (ven18 (2018)). | 130 | 50 | 0.001 | 12 | Hollow, wide angle () ionized gas “fountain” | |||
| H i outflow | 160 | 2000 | 10 | Fig. 7; Desorption/dissociation from icy grains? | ||||
| NGC1377 | ||||||||
| Nuclear diskhℎhhℎhAalto et al. (aal12 (2012)). | 15 | 0 | 29 | 75 | 0.04 | 0.017 | ||
| CO outflowhℎhhℎhAalto et al. (aal12 (2012)). | 15 | 0 | 200 | 140 | 1.4 | Opening angle | ||
| Map areaj𝑗jj𝑗jAalto et al. (aal16 (2016)). | 15 | 0 | 0.16 | Size: | ||||
| Accretion diskj𝑗jj𝑗jAalto et al. (aal16 (2016)). | 15 | 0 | 10 | 110 | 0.03 | 0.018 | 1 | Rotation period |
| Bipolar CO Jetj𝑗jj𝑗jAalto et al. (aal16 (2016)). | 15 | )k𝑘kk𝑘kin Ref. (j) estimated precession angle of CO jet and nuclear engine. | m𝑚mm𝑚minterval depending upon precession angle. | m𝑚mm𝑚minterval depending upon precession angle. | Precession Period: |
According to the CO() SMA mapping by Sakamoto et al. (sak07 (2007)), there is in the outer torus also a “molecular cloud hot spot” co-located with the synchrotron jet source “F”, which has an intensity peak at a velocity that is inconsistent with the expected streaming motion in the torus. If the CO() hot spot at F were a “mirror image” of the one at D – moving along the circumnuclear torus – its line of sight (LOS) velocity, according to Table 2, is expected to be km s-1. However, its observed peak emission LOS velocity is 1590 km s-1, that is, 76 km s-1 “too low” and “blue shifted” versus the systemic velocity by km s-1. This points at the existence of a molecular gas outflow from the nuclear engine, oriented along the direction of the nuclear synchrotron radiation jet. The peak emission is LOS blue-shifted by about 25 km s-1 with respect to the systemic velocity. This suggests the presence of a rather collimated molecular outflow, having a de-projected velocity of about 70 km s-1 in the same direction as the synchrotron jet, and which perhaps is driven by the same launching process (see Table 3). In fact, also Combes et al. (com19 (2019)) propose the possibility of a nuclear outflow, observed in the ALMA CO() velocity field, similar to that found for NGC 613 (Audibert et al. aud19 (2019)). We here compare the CO() profile observed at 2″ resolution in radio source F (Fig. 11 of Sakamoto et al. sak07 (2007)), displaying a pronounced rather narrow peak at 1590 km s-1 on top of a broader range (1500 – 1750 km s-1) pedestal, with our 5″ resolution CO() spectrum in the same direction. This is shown in Fig. 10, where the arrow indicates a narrow feature. The weakness of the presumptive molecular jet emission at km s-1, observed at 5″ resolution may suggest that the extent of this emission is ″, equivalent circular size in the plane of the sky, that is, indicating a collimated, molecular gas outflow of size 4″ ¡ 1″.

.
The envisioned 400 pc size relativistic synchrotron jet and collimated molecular outflow are enshrouded by a kpc size fan- or, rather, cone-shaped ionized gas outflow, revealed by its visual O iii emission (Hjelm & Lindblad hje96 (1996), discussed in considerable detail in the review paper by Lindblad lin99 (1999)). More recently, this hollow wide-angle (100°) outflow of ionized gases has been studied in considerable detail by Lena et al. (len16 (2016)) and Venturi et al. (ven18 (2018)). From their optical high spectral resolution mapping of the central 5 kpc (60″ 60″) region of NGC 1365, at a spatial resolution of 70 pc (0.76″), by means of VLT MUSE (multi-unit spectroscopic explorer), paired with Chandra X-ray data and elaborate analyses, Venturi et al. (ven18 (2018)) revealed the very inhomogeneous and anisotropic structure of the mass outflow rate and the velocity field of this bi-conical, wide angle, kpc size, nuclear outflow of ionized gases, having velocities up to 200 km s-1. Their Fig. 7, displaying the estimated ionized gas mass outflow rate at 5″ (450 pc) resolution, demonstrates very pronounced radial as well as angular variations in the range () /yr. From a consideration of the kinetic energy rate and the momentum rate of the extended outflow of ionized gas and the mass outflow rate available from the AGN, obtained from their Chandra X-ray data, Venturi et al. argue that the extended ionized gas outflow must be momentum powered, that is, driven by the X-ray pressure (i.e., by X-ray photon collisions with the dust component of the gas). The authors also point out that the expected multiple supernova explosions (SNe) in the “star formation ring”, the outer torus in our nomenclature, may also contribute to the powering and temporal variation of the very extended ( kpc), wide angle (°), bi-conical nuclear outflow. This is especially so since the observed outflow extent is as large as the diameter (2 kpc) of the outer torus, while the diameter of the AGN accretion disk (the inner torus) is only 50 pc (see our Table 3). A main reason for the radial variations of the ionized gas may be found in the observed variable nuclear X-ray emission causing (temporal) variations in the outflow launching radiation pressure. We return to the likely cause of the angular variations in Sect. 4.3.2. While SNe-induced multiple “chimney processes” presumably are in action in the outer torus (as modeled by e.g., Norman & Ikeuchi nor89 (1989); Melioli et al. mel09 (2009)), the larger scale “nuclear fountain” scenario may be the main driver (as modeled by e.g., Wada wad12 (2012), wad15 (2015); Wada et al. wad16 (2016)).
In Fig. 7(1) it may be seen that there is an H i absorption ridge emanating from the nucleus, in a south-southeast direction. This H i ridge can also be followed in the four individual maps shown in Fig. 8, implying that the ridge has a very wide velocity dispersion ( km s-1). This H i ridge coincides in position with the southern edge of the O iii cone and may have arisen by the action of collisions of the outflow-driving X-ray photons with the dust grains. This interaction most likely would cause the water ice covering the cold dust grain surfaces to be desorbed and subsequently cause the water vapor to be dissociated into 2H + O. It is here interesting to note that, according to Fig. 7 of Venturi et al. (ven18 (2018)), the mass outflow rates of ionized gas are observed to be especially high along P.A. 135° and 160°, that is, in the direction of the synchrotron radiation and molecular gas jet as well as along the elusive H i absorption ridge just discussed. Here it may be interesting to note that the H i ridge may well be accompanied by a low level wide velocity CO() emission ridge at P.A. °, as hinted in Fig. 7(2).
The very wide velocity dispersion of the H i absorption ridge, mentioned above, with both negative and positive velocity components is perplexing, but not completely surprising. Hjelm & Lindblad (hje96 (1996)) found that the southeastern edge of their O iii cone had also shown a ”split” structure with both negative and positive velocity components in a velocity range similar to the H i ridge (see their observations with slits 6, 7, 10, and 11 in their Fig. 6). This was interpreted as contributions from both the outflow cone and the disk. A first approximation to the H i column density, (H i), in the H i ridge can be obtained from (H i)/ (cm-2K-1), where is the spin temperature, and the optical depth of the H i absorption is ln, (a negative number) and are the intensities of the H i absorption line and continuum, respectively, in mJy/beam (Sandqvist san74 (1974)). The beam for the H i observations is 116 63, and the continuum has been estimated from Fig. 6 of Sandqvist et al. (san95 (1995)) and corrected to the H i resolution. A second approximation has been made using the continuum observations in Fig. 7 of Beck et al. (bec02 (2002)), also adjusted to the H i resolution. The results for two positions in the H i ridge are presented in Table 4.
| Source | Offsets | ||||||||
|---|---|---|---|---|---|---|---|---|---|
| (,) | [mJy/beam] | [ km s-1] | [mJy/beam] | [mJy/beam] | [cm-2K-1] | [cm-2K-1] | |||
| H i ridge top | () | 380 | 5.2 | 14.5 | 0.091 | 0.032 | |||
| H i ridge bottom | () | -0.65 | 340 | 5.2 | 14.5 | 0.13 | 0.045 |
Using the canonical H i spin temperature of 100 K, we may now estimate an H i column density for the H i ridge of a few cm-2. For the maximum H i integrated emission region in Fig. 7, located near the position of the H ii hot spot L4, we determine an H i column density of cm-2, using the conversion factor given by Jörsäter & van Moorsel (jor95 (1995)) – a column density value similar to that found for the +50 km s-1 cloud in the Sgr A complex in the center of our own galaxy (Sandqvist san74 (1974)).
In support of our own forthcoming scenario proposal in Sect. 4.3.2, we now will turn to the very interesting SMA and ALMA results presented by Aalto et al. (aal12 (2012), aal16 (2016)). Their CO() SMA observations at a resolution of 0.6″ of the lenticular spiral galaxy NGC 1377, at a distance of 21 Mpc where 1″ 102 pc, – very similar to the parameters of NGC 1365 – revealed an extended molecular outflow and an orthogonal nuclear disk – outflow extent 200 pc, opening angle of , outflow velocity 140 km s-1 and mass ; dynamical versus molecular nuclear disk masses versus ).
From their analysis of the ALMA CO() observations at 0.2″ resolution, and maximum recoverable structure size of 5″, Aalto et al. (aal16 (2016)) discovered a very collimated molecular jet, counter-jet system of size pc, displaying velocity reversals along the jets with a swing of km s-1. This was interpreted and satisfactorily modeled as a precessing bi-polar jet system, having a precession angle ° around a direction along the plane of the sky, precession period 0.3 – 1.1 Myr, outflow velocity 240 – 850 km s-1, and outflow mass (0.2 – 2) . The outflow rate was estimated to be 10 /yr – a value they considered to be very uncertain. The molecular mass in the entire map was estimated to be . The rotational velocity of an accretion disk of size 10 pc was estimated to be 110 km/s, which implies a rotation period of 1 Myr. This in fact provides a lower limit to the jet precession period, which must be larger than the rotation period of its launching accretion disk. The more relevant physical parameters have been collected in our Table 3, for comparison with our scenario in NGC 1365.
Aalto et al. (aal16 (2016)) propose that their elusive, gaseous precessing jet, counter-jet system is likely to be powered by faint bipolar “radio jets”, that is, by relativistic plasma outflows suffering from energy losses by synchrotron radiation, as was described earlier, or alternatively by an accretion disk-wind similar to those found toward proto-stars. The latter case also includes discussions of analogous MHD models of precessing bi-polar outflows, powered by the accretion onto a proto-star – a jet precession which has been observed, for example, in L1551 IRS5 and IRAS 16293-2422 (Fridlund & Liseau fri94 (1994); Kristensen et al. kri13 (2013)). Aalto et al. (aal16 (2016)) also carefully discuss the various scenarios which may cause the observed molecular jet precession, with at-the-point references. Their favored alternatives are: i) misalignment between the spin orientation of the SMBH and the rotation axis of the surrounding accretion disk, or ii) an accretion inflow of gas having misaligned angular momentum.
4.3.2 Tilted massive inner torus of cold gas – a precessing nuclear engine?
Scrutinizing the various observed and calculated physical parameters collected in Table 3, we note two problematic issues where nature, however, has provided elegant and efficient solutions. The first one is the “angular momentum problem” at the formation of a compact object – in our case a central black hole, while a very similar problem appears in proto-stellar formation – as illustrated by the rotation time column. While the rotation time of the galaxy disk falls in the range Myr, the bar-induced outer torus, having a radius of pc and a cold gas mass of , is rotating almost as a solid body with a revolution time of 27 Myr. This outer torus is encircling a much smaller inner torus, accretion disk of radius 26 pc and estimated cold gas mass of and a rotation time of Myr – in its turn surrounding a rapidly spinning SMBH having a mass of (Combes et al. com19 (2019); Risaliti et al. ris13 (2013)). To overcome the “angular momentum problem” nature has found a solution here to the energy balance problem in terms of MHD launching of a relativistic plasma outflow, which is observable because of its synchrotron radiation loss, and a co-existing collimated molecular gas (CO) outflow. It has also launched the directly observable X-ray emission from the nuclear engine, which in addition is causing the observed very extended wide angle ionized gas outflow by the action of its radiation pressure.
With these facts in mind, we arrive at the second problem in case of NGC 1365. While the symmetry axis of the hollow wide angle ionized gas outflow appears to coincide with the rotation axis of the galaxy disk and the outer torus (P.A. = 130°; Incl. = 50°), the rotation axis of the inner torus, black hole nuclear engine (P.A. = 160°10°; Incl. = 63°10°) according to the model fit of CO() ALMA data by Combes et al. (com19 (2019)), deviates by 30°10° from the common direction. The direction of the synchrotron radiation jet, collimated molecular gas outflow is observationally known only in terms of its P.A. 135°. However, to allow the previously outlined powering scenario of the synchrotron radiation jet, collimated CO outflow, the rotation axis of the nuclear engine must have agreed with the outflow direction at an earlier time. If we consider these facts, the only realistic alternative seems to be that the inner torus is precessing, at an assumed precession angle of 30°, around the common rotation axis of the galaxy disk and the outer torus. The precession period must be larger than the inner torus rotation period of 1.6 Myr and presumably be lower than the rotation period of the outer torus, 27 Myr. The inclination of the synchrotron radiation, CO jet in this scenario must be 50°30°, that is, Incl. = 20°, or 80°, where the former case results in an outflow size of 400 pc, a reasonable outflow velocity of 70 km s-1 and an outflow age of 6 Myr. The other alternative must be considered unlikely because of the resulting very large size and age (see Table 3). Since the rotation axis of the accretion disk must have precessed (in the same direction as the rotation of the outer and inner tori) by about 75% of its period from its launching of the synchrotron jet, molecular outflow to its current position, we may now estimate the precession period of the nuclear engine to be about 8 Myr, which is well below the rotation period of the outer torus, 27 Myr.
This scenario solves not only the launching of the synchrotron, CO jet but may also help to explain the angular mass loss rate inhomogeneity of the wide angle ionized gas outflow observed by Venturi et al. (ven18 (2018)). In addition the proposed inner torus precession scenario provides a natural solution of the problem that the bi-conical outflow is covering a very wide sector (P.A. 80° 180°) even at a radius of 2.5 kpc, which corresponds to a launch time of Myr at an estimated outflow velocity of km s-1 and is hollow, that is, with little or no outflow near the symmetry axis (cf. Hjelm and Lindblad hje96 (1996)). This is not well accommodated by state of the art theoretical modeling of nuclear outflow fountains (e.g., Wada wad15 (2015)). A precession angle of 25 30° and a bi-conical outflow sector of 25° should here be able to do the required job of supporting the observed ionized outflow, created during several precession periods.
At first sight a precession angle as large as 20° 40° may seem unrealistic. However, the ALMA observations of NGC 1377 by Aalto et al. (aal16 (2016)), paired with their careful analysis, lead to a required accretion disk precession angle of 10° 25°. The physical reason for the suggested inner torus precession in NGC 1365 could be “an accretion inflow of gas having misaligned angular momentum”, which is the previously mentioned second alternative for NGC 1377 of Aalto et al. (aal16 (2016)), since the outer torus of NGC 1365 is asymmetric and very inhomogeneous in its mass distribution. As shown in Table 3, the accretion tori of NGC 1365 and NGC 1377 have similar sizes, rotation times and cold gas masses.
4.4 Discussion of the H2O emissions in NGC 1365 versus those in other galaxies
The outer circumnuclear torus region and the nuclar region contain all the ingredients necessary to locally raise the gas-phase water abundance to levels which are several orders of magnitude higher than the quiescent, cold cloud value of versus H2, assuming an ortho-to-para ratio of 3. Here most H2O is likely to reside as water ice on cold grain surfaces (e.g., van der Tak et al. tak10 (2010)).
We have in Table 5 collected the results from our spatially unresolved but spectrally resolved Odin observations of the 557 GHz ground state o-H2O line. There are also the results from spectrally unresolved, but spatially partly resolved, Herschel SPIRE multi-transition H2O and CO mapping observations, for comparison with: i) Odin ground state o-H2O and o-HO results for our Galactic center region, Sgr A (Karlsson et al. kar13 (2013)), ii) Herschel HIFI, SPIRE, and PACS results for the merger NGC 6240 (with galaxy-wide shocks; Meijerink et al. mei13 (2013), Liu et al. liu17 (2017)), and iii) the results from a detailed radiative transfer and excitation analysis of a sample of other galaxies extensively observed by Herschel HIFI, SPIRE, and PACS (Liu et al. liu17 (2017); Gonzalez-Alfonso et al. gon10 (2010), gon12 (2012)).
In addition to the comparisons between galaxies provided in Table 5, we have in an Appendix B included a Table B.1 comparing our estimated H2O abundances in NGC 1365 with more detailed Sgr A results, as well as with observed H2O abundances in a number of well-known types of Galactic molecular cloud regions, where also detailed chemical models are established. For the interested reader a short summary of current chemical models of water formation and destruction is also included in this Appendix.
| Object | Region | Density | Gas / Dust | H2O abundance | Comments |
|---|---|---|---|---|---|
| (cm-3) | Temperature (K) | vs H2 () | |||
| NGC 1365 | absorptiona𝑎aa𝑎afootnotemark: | c𝑐cc𝑐cfootnotemark: | A | ||
| (Barred | emissiona,b𝑎𝑏a,ba,b𝑎𝑏a,bfootnotemark: | c𝑐cc𝑐cfootnotemark: | j,k𝑗𝑘j,kj,k𝑗𝑘j,kfootnotemark: | A | |
| spiral) | shocksb𝑏bb𝑏bfootnotemark: | d𝑑dd𝑑dfootnotemark: | c𝑐cc𝑐cfootnotemark: | n𝑛nn𝑛nfootnotemark: l𝑙ll𝑙lfootnotemark: | B |
| Sgr Ae𝑒ee𝑒eSandqvist et al. (san95 (1995)). | absorption | i𝑖ii𝑖ifootnotemark: | i𝑖ii𝑖ifootnotemark: /15m𝑚mm𝑚mfootnotemark: | 3 | C |
| emission | f𝑓ff𝑓ffootnotemark: | 80f𝑓ff𝑓ffootnotemark: /m𝑚mm𝑚mfootnotemark: | D | ||
| line wings | /m𝑚mm𝑚mfootnotemark: | E | |||
| NGC 6240 | warm emission | 10 | F | ||
| (Mergerg,h𝑔ℎg,hg,h𝑔ℎg,hfootnotemark: ) | shocks | d𝑑dd𝑑dfootnotemark: | 10 | G | |
| Galaxy | absorption | H, J | |||
| samplehℎhhℎhfootnotemark: | cold emission | H | |||
| warm emission | H | ||||
| hot emision | K |
(a) This paper – Odin observations of ground state o-H2O (see text). (b) This paper – Herschel SPIRE mapping observations plus modeling (see text). (c) Dust temperatures from Alonso-Herrero et al. (alo12 (2012)) and Tabatabei et al. (tab13 (2013)). (d) Pre-shock density; The post-shock density becomes an order of magnitude higher. (e) from Odin observations of ground state o-H2O and o-HO, assuming an ortho-to-para ratio of 3 (Karlsson et al. kar13 (2013)). (f) from Walmsley et al. (wal86 (1986)). (g) from Herschel SPIRE oservations (Meijerink et al. mei13 (2013)). (h) from Herschel HIFI, SPIRE and PACS observations (Liu et al. liu17 (2017)). (i) from the Sandqvist et al. (san15 (2015)) Herschel HIFI 487 GHz search for O2. (j) the abundance scales inversely with cloud density (k) lower abundances may be accomodated by PDR models, while the high ones indicate shocks (see Comments). (l) fast shock model abundance (Flower & Pineau de Forêts flo10 (2010)) in an effective accumulated 10″ size area (see Comments). (m) from Sandqvist et al. (san08 (2008)). (n) from slow shock chemistry, in case FIR pumping dominates (Gonzalez-Alfonso et al. (gon10 (2010), gon12 (2012), gon14 (2014)).
4.4.1 Comments to Table 5
NGC 1365:
A) Odin observes very weak ground state o-H2O emission from dense molecular cloud complexes located in the circumnuclear torus region in the velocity range km s-1 – an emission which in a velocity range around 1500 km s-1 suffers from absorption caused by the low excitation, foreground cloud envelopes of the cloud core emission plus the thermal dust continuum background. Taking into account the source size, approximately 15″, and location of maximum emission apparent from the Herschel SPIRE mapping, we find that the integrated H2O intensities observed by Odin and Herschel agree very well, and that the velocity range of the Odin emission is as expected for emission from the NE torus region.
The existence of water absorption by lower excitation cloud envelopes most likely can be ascribed to the PDR chemistry, including grain surface reactions, in action in such regions. The water emission from the massive complexes of cloud cores, co-located with super starburst clusters and H ii regions residing in the NE torus region of NGC 1365 (cf. Elmegreen et al. elm09 (2009)), is bound to originate from a combination of PDR chemistry, including grain surface reactions, quiescent warm molecular cloud ion-molecule chemistry, and also hot cores. There is possibly influence by an increased ionization level caused by cosmic ray focusing by the aligned magnetic field, as mapped by Beck et al. (bec05 (2005)), and locally also by X-ray emission from the star forming superclusters. Outflow and shock chemistry may also contribute to the ground state o-H2O emission (see next Comment).
B) The CO and H2O emissions from the higher energy states appear to be best explained by shock excitation. While the CO-SLED can be nicely matched by a two-component model using K for the lower energy lines and requiring a low velocity ( km s-1) shock at a pre-shock density of cm-3 to reach the observed intensities of the higher energy lines. The H2O-SLED seems to require a high velocity ( km s-1) shock at a pre-shock density of about cm-3, using the shock model by Flower & Pineau de Fôrets (flo10 (2010))( cf. Comment G for the merger NGC 6240). There is probably a requirement also for some radiative Far IR (FIR) excitation, which was used to model the Herschel SPIRE observations of H2O in the ULIRGs Mrk 231, NGC 4418 and Arp 220 by González-Alfonso et al. gon10 (2010), gon12 (2012), as discussed in Sect. 4.2.2.
If FIR excitation were dominating, the required H2O abundance
would be a factor of times lower than the fast shock (40
km s-1) model abundance of versus H2 (Gonzalez-Alfonso et
al. gon10 (2010), gon12 (2012), gon14 (2014); Flower & Pineau de
Forêts flo10 (2010)). This is an abundance level achievable by low velocity
shock chemistry including shock release of icy grain mantles. However,
no PACS observations of the FIR pumping water vapor absorption lines
are available in case of NGC 1365.
Sgr A:
C) This is absorption in the low excitation km s-1 foreground spiral arm. The PDR chemistry, including grain surface reactions, is the likely explanation for the observed water abundance. However, the possible Herschel HIFI detection of the 487 GHz O2 line in this spiral arm tells us that a ( km s-1) Galactic spiral arm density wave shock also may be in action (cf. Sandqvist et al. 2015).
D) The emissions from the warm and dense +20 km s-1, +50 km s-1, and CND (circumnuclear disk, torus) cloud cores are resulting from PDR chemistry, including grain surface reactions, quiescent cloud ion-molecule chemistry, and possibly hot cores.
E) These H2O line wings, not suffering from
self-absorption, associated with the +20 km s-1, +50 km s-1, and CND
clouds must be caused by shock chemistry as well as shock
desorption, sputtering from icy grain mantles.
NGC 6240:
F) This is emission from warm cloud complexes in the merger interface region.
G) This is most likely emission from “galaxy-wide shocks”. Meijerink et
al. (mei13 (2013)) found that the CO-SLED, observed by Herschel
SPIRE, is best modeled by a ( km s-1) shock excitation and
a pre-shock density of cm-3, leading to a
post-shock density of cm-3. They also point out
that the 2 m H2 emission, observed at the merger central region,
requires a shock in the velocity range km s-1 for a pre-shock
density of cm-3. See also the H2O SLED
analysis by Liu et al. (liu17 (2017)) and the discussion of NGC 6240
in their Appendix.
Other galaxies observed by HIFI, SPIRE and PACS aboard Herschel Space Observatory:
H) These results were based upon multi-transition CO and H2O SLEDs as well as dust SED observations by Herschel HIFI, SPIRE, and PACS, paired with extensive radiative transfer and excitation modeling, including collisional as well as radiative excitation, see Liu et al. (liu17 (2017)).
J) Similarly to what is visualized by the Odin 557 GHz ground state o-H2O spectrum of NGC 1365, emission plus absorption is often seen in the observed Herschel HIFI ground state o-H2O spectra, and are even more frequent in the Herschel HIFI 1113 GHz ground state p-H2O spectra (van der Tak et al. tak16 (2016); Liu et al. liu17 (2017)). It may be interesting to note that the 1113 GHz line is not clearly visible and not claimed to be detected in our NGC 1365 SPIRE data.
K) Only for the most infrared luminous galaxies Mrk 231, NGC 4418, and Arp 220, these compact hot gas, dust components were required to fit the observational data. Here the high temperature, possibly caused by shocks, leads to efficient release of H2O from the icy grain surfaces into the gas phase, hence explaining the high gas phase abundance of water. In addition, X-ray emission from the AGN, or from a nuclear star burst, may provide a contribution by XDR chemistry. FIR excitation appears to be very important in these galaxies (Liu et al. liu17 (2017); Gonzalez-Alfonso et al. gon10 (2010), gon12 (2012)).
4.4.2 Some conclusions concerning the H2O emission and absorption regions in galaxies
The ortho and para ground state rotational transitions of H2O at 557 and 1113 GHz often exhibit sharp absorption features caused by lower excitation foreground gas – where the water vapor content of versus H2 is resulting from PDR chemistry – intersecting broad velocity emission from the denser molecular cloud ensemble – caused by a mixture of PDR and “hot core” chemistries and possibly also is influenced by shock sputtering and shock chemistry. These processes all rely upon the release of icy grain mantles and result in average H2O abundances of .
The rotationally excited state H2O emissions, observed by Herschel HIFI and SPIRE, appear to be best explained by a combination of FIR and shock excitation, where FIR excitation is likely to be dominating in the ULIRGs. Shock chemistry and shock release of icy grain mantles are the likely processes causing the estimated very high H2O abundances of , with possible influences from “hot core chemistry” in regions of very extensive star formation.
The FIR H2O lines at shorter wavelengths, observed by Herschel PACS, all have very high critical densities for collisional excitation and therefore are bound to be “FIR pumped”. The very high H2O abundances of , estimated from these observations, are likely to result from efficient release of icy grain mantles, caused by varying combinations of “hot cores” near massive young stars, shock sputtering, and XDR chemistry caused by intense X-ray emission, as well as shock chemistry – all depending upon the environmental conditions in the galaxy in question.
4.5 Methylidyne radical, CH, and its ion CH+ – probable signatures of shocks and intense UV-illumination in the NGC 1365 circumnuclear torus region
We here enter a discussion of the presence of CH as well as CH+ in the circumnuclear torus region, as is revealed by the SPIRE spectrum (Fig. 3 and Table 1) and by our CH and CH+ maps, shown in Fig. 4. While an emission line at 835.1 GHz nicely matches the rotational transition of CH+ in its electronic ground state, CH in its electronic ground state appears in terms of two emission doublets, at 532.7/536.8 GHz and 1470.7/1477.4 GHz, classified as the ( –¿ –¿ ) and ( –¿ –¿ ) transitions, respectively (with quantum states denoted . More details are given in Appendix C, and an energy level diagram can be found in Rangwala et al. ran14 (2014)). These CH transitions are caused by a step-wise internal energy decay of the CH molecular population from the -doubled second lowest () rotationally excited state (at K) to the -doubled lowest () rotationally excited state (at K), and subsequently to the -doubled () CH ground state. Here the rather obvious, and simplest, contributing excitation mechanism would be “direct radiative pumping” causing population transport from the ground state -doublet state to the rotationally excited -doublet state by means of CH absorptions of the thermal dust emission at 2006.8/2010.8 GHz ( m), that is, close to the thermal emission maximum of dust at a temperature of K, as is observed in NGC 1365 (Figs. 1 and 2). However, no proof in terms of such observed 149 m CH absorptions is available in NGC 1365, but appears to have been observed in the () ULIRG, Arp 220, by Herschel PACS, as reported in the SPIRE and HIFI based CH analysis by Rangwala et al. (ran14 (2014)).
Arp 220 is a late-stage merger with two closely located counter-rotating disks and also was included in the multi-line H2O analysis by Liu et al. (liu17 (2017)), where it together with Mrk 231 required a hot and dense gas component to fit the observed H2O-SLED (cf. our Table 5 and its comments). Stepwise collisional CH excitation may also be contributing processes, which then would require the high gas densities and temperatures resulting from the shocks which are observed to be in action in the many hot spots of the outer circumnuclear torus of NGC 1365 (Galliano et al. gal12 (2012); Fazeli et al. faz19 (2019)) and here were crucial for the H2O and CO excitation (see Sect. 4.2.2). Extensive shocks and star formation-induced outflows also are likely to be present in Arp 220, as well as in the IR bright () Seyfert 2 galaxy NGC 1068 (Spinoglio et al. spi12 (2012); Liu et al. liu17 (2017)), which will be our forthcoming CH, CH+ comparison galaxy .
The CH assignment of the striking 532.7/536.8 GHz line doublet requires some carefulness, since unfortunately the laboratory frequencies of the HCN() and HCO+() lines at 531.7 and 535.1 GHz are almost overlapping, considering the poor SPIRE spectral resolution and the broad galaxy spectral lines. However, there are no visible signs of the HCN() and HCO+() lines in our NGC 1365 SPIRE spectrum, which limits their contribution to our CH doublet to be at most about 20 %. This is consistent with the comparatively small contributions from HCN and HCO+ found by Rangwala et al. (ran14 (2014)) in their complementary Herschel HIFI observations of a number of galaxies, including Arp 220.
From the Herschel SPIRE line intensities listed in Table 1, we estimate the upper state column densities of the 533/537 GHz and 1471/1477 GHz CH doublets to be cm-2 and cm-2, for an assumed, accumulated source size of 14″. We can then determine an excitation (population distribution) temperature for these states to be K. This allows us to calculate the total column density in the four lowest rotational states to be cm-2, under the assumption of a common excitation temperature. The estimated excitation temperature is in fact a lower limit since the 533/537 GHz doublet may contain some HCN/HCO+ emission and is at least as high as the kinetic temperature of the quiescent molecular clouds, which suggests influences of FIR pumping and/or efficient collisional excitation in the observed shock regions.
In the same way, we estimate the upper () state column density of CH+ to be cm-2, for an assumed source size of 14″ (Fig. 4). The minimum total CH+ column density is estimated to be cm-2 for excitation temperatures in the range 40 to 100 K (cf. Falgarone et al. 2010b ). However, in view of the intense UV-illumination from newly formed stars, the CH+ column density may well be an order of magnitude larger, approaching that of CH. The reason is formation by the reaction between C+ and vibrot-excited H2, which also causes a large enhancement of the rotationally excited CH+ states, as has been observed in the Orion Bar (Nagy et al. nag13 (2013), nag17 (2017); see also Appendix C). In the case of NGC 1365 we have to rely on the observed existence of multiple vibrot H2 lines in the hot spots of the outer torus region, and the existence of strong UV radiation in these regions of intense star formation (Galliano et al. gal12 (2012); Fazeli et al. faz19 (2019)). For these reasons we may estimate the CH/CH+ abundance ratio to be .
From the simultaneously observed SPIRE maps (Fig. 4), it appears that the H2O and CH+ emissions peak in the NE torus region while the CO and CH emissions are more evenly distributed across the circumnuclear torus. The higher energy CO-SLED is nicely modeled by a low velocity (10 km s-1) shock, which also may satisfactorily explain the required CH excitation as well as its high abundance in denser gas (see Appendix C). The higher velocity (40 km s-1) shock, possibly required to model the H2O-SLED in the NE torus region, paired with the intense UV radiation from the observed massive young stellar superclusters (Galliano et al. gal12 (2012)) may explain the previously discussed possible overabundance of CH+ (Gerin et al. ger16 (2016); Godard et al. god19 (2019); see also Appendix C).
With these uncertainties in mind, we now proceed to estimate the CH and CH+ abundances. Here a comparison H2 column density is available from our multi-transition SPIRE-CO modeling in Sect. 4.2.2. Correcting the model value (CO) cm-2 for the beam filling of a 14″ source size in a 40″ antenna beam, and assuming a CO/H2 abundance ratio of , we arrive at an average of (H2) cm-2 for the shocked gas regions of the outer torus. The CH and CH+ abundances then become (CH) and (CH+) . In the unlikely case that the emissions were originating in the quiescent molecular clouds, these abundances would be lower by a factor of about 30.
Only in NGC 1068, out of the four prototypical AGN or star burst dominated galaxies (NGC 1068, Arp 220, M82 and NGC 253) selected for Herschel CH observations by Rangwala et al. (ran14 (2014)), did both the CH and the CH+ lines appear in emission, similar to our case of NGC 1365. In the other galaxies, CH+ was observed in absorption, presumably from lower excitation foreground gas, while CH was observed in emission (from higher density regions). Our IR luminous comparison galaxy, NGC 1068 ( ), is exhibiting a number of similarities with NGC 1365 ( ), that is, a circumnuclear torus – a prominent “star forming molecular cloud ring” of radius kpc versus kpc in NGC 1365 – and a smaller circumnuclear disk – CND of radius pc versus pc in NGC 1365 – as discussed in more detail by Spinoglio et al. (spi12 (2012)) and Liu et al. (liu17 (2017)).
The CH abundance estimated in NGC 1068 by Rangwala et al. (ran14 (2014)), from the 533/537 GHz doublet alone, is versus H2. The CH/CH+ abundance ratio is found to be , just as in NGC 1365, however in both cases somewhat uncertain values because of lacking observations of the molecular excitation. The NGC 1068 abundances were nicely accommodated by XDR physics, chemistry in the CND, driven by the X-ray emission from the AGN. A similar inner torus generated XDR emission of CH and CH+ is likely to exist also in NGC 1365. However, here the dominant parts of the CH and CH+ emissions are located to the UV-illuminated shock regions of the outer torus, as is strongly indicated by our observed emission maxima at the NE torus FIR and molecular gas mass peak. In the absence of Herschel Space Observatory, improved knowledge of the CH and CH+ molecular population distributions in NGC 1365, as well as in NGC 1068, could here be achieved by spectrally resolved Sofia limited mapping observations of the CH doublet at 2 THz and the CH+ () transition at 1669 GHz.
In this context the results from Herschel PACS observations of multiple OH+, H2O+, and H3O+ absorption lines in the ULIRGs, NGC 4418 and Arp 220, by Gonzalez-Alfonso et al. (gon13 (2013)) are useful to contemplate, since the importance of an observed molecular population distribution is emphasized. It turned out that in the single case of Arp 220 the pure inversion, metastable state lines of H3O+ revealed a very high population distribution temperature of K, indicating hot gas or “formation pumping”. There, excess energy from the H3O+ formation process leaves the resulting molecule in a high rotational temperature molecular state distribution). The population distributions of OH+ and H2O+ did not show such an anomaly. These results are very important for the understanding of the molecular formation processes in question. However, no OH+, H2O+ or H3O+ signals can be identified in our NGC 1365 SPIRE spectrum (Fig. 3 and Table 1).
In the light of our current discussion of CH and CH+ observations and their modeling interpretations, and including the results from the very recent modeling of UV irradiated molecular shocks by Godard et al. (god19 (2019)), inspired by the ALMA discovery of CH+() emission and absorption lines from a number of lensed star burst galaxies at a redshift of (Falgarone et al. fal17 (2017)) – we are inclined to believe that the CH and CH+ emission lines observed from the circumnuclear torus region of NGC 1365 are signposts of shock action in this region, presumably penetrated by intense UV light and molecular outflows caused by the observed extensive star formation.
5 Summary and conclusions
We have used the Odin satellite to observe the central region of the barred spiral galaxy NGC 1365 in the 557 GHz H2O line. After a total of 81 hours of ON-source integration time, we have obtained a marginal detection of this water vapor line at a velocity resolution of 5 km s-1. We have combined these observations with Herschel PACS and SPIRE observations of two positions in the galaxy’s nucleus, obtained from the Herschel Science Archive, and produced simultaneously observed SPIRE images of the distribution of o-H2O, p-H2O, CO, CH, CH+, and N ii.
The water vapor emission is predominantly located in the shocked 15″ (1.3 kpc) region of the northeastern (NE) component of the molecular torus surrounding the nucleus. Here, several compact radio sources, hot-spot H ii regions, as well as co-located very massive molcular cloud complexes, and young stellar superclusters have been observed – all of which triggered by the rapid bar-driven inflow into the circumnuclear torus, causing cloud-cloud collisions and shocks. The two ground state H2O emission components, detected in the Odin spectrum, have approximate velocities of –150 and –40 km s-1 with respect to the systemic velocity of the galaxy, while an intersecting absorption appears at a velocity of –100 km s-1, which agrees with kinematic studies of the bar-driven circumnuclear torus gas flow in the vicinity of the NE component. For the absorbing gas region, we find an H2O fractional abundance of , which is well accomodated by PDR chemistry. In the presumably denser emission regions, the H2O abundance appears to increase but may still be understood in terms of PDR chemistry taking place in this region of strong UV radiation from the young super star clusters. However, part of the ground state H2O emission may also be caused by shock excitation and chemistry, as will be discussed next.
Model studies of the multi-transition SPIRE CO and H2O observations toward the NE component reveal the presence of a slow-velocity C-type shock with a shock speed of 10 to 40 km s-1 and an H2 pre-shock density of 104 cm-3, where the lower velocities are sufficient to model the observed CO spectral line energy distribution (SLED). The observed H2O SLED requires the higher shock velocities, which are also sufficient to drive the vibrational excitation of H2. In addition, FIR pumping may be required to satisfactorily explain the H2O SLED. A model abundance versus H2 of 10-4 was reached for CO as well as for H2O. If the H2O excitation were dominated by FIR pumping, the required H2O abundance is lower by a factor of and is most likely caused by slow velocity shock chemistry (as discussed in Sect. 4.2.2 and Appendix B ).
While the H2O and CH+ emissions seem to be concentrated near the NE torus component, the CO and CH emissions appear to be more evenly distributed between the NE and the SW torus component, as revealed by the SPIRE images. These relative distributions may reflect the fact that the eastern bar-driven gas inflow into the NE torus region is much more massive than the corresponding gas inflow from the western bar into the SW torus region. In the case of CH we estimate an abundance of . The estimated CH+ abundance of in the NE torus region is likely to be a lower limit because of (here unconfirmed) formation via the abundant vibrationally and rotationally excited H2 in this shock and UV irradiated region. Such a CH+ abundance enhancement has indeed been observed in the Orion Bar (See Appendix C).
We have made a statistical image deconvolution (SID) of our single dish SEST observations of the CO() emission in the nuclear region of NGC 1365, yielding an angular resoltuion of 5″, complementing recent ALMA observations. These SID observations yield dynamical masses of and inside radii of 1 and 2 kpc, respectively, where the gas mass amounts to % in the inner region and % in the region inside 2 kpc.
We discuss a co-located collimated CO jet, a relativistic radio jet and a wide-angle inhomogeneous ionized O iii gas cone outflow from the nuclear engine. Our VLA H i absorption analysis reveals an H i ridge extending from the nucleus in a south-southeast direction, coinciding with the southern edge of the O iii cone. With an H i column density of a few cm-2, this ridge may have been created by the action of outflow-driving X-ray photons colliding with dust grains, causing water ice from the dust grains to be desorbed and dissociated into 2H + O. A precessing nuclear engine appears to be required to accomodate the various outflow components, and is also consistent with the ALMA observations by Combes et al. (com19 (2019)) of a tilted massive inner gas torus or accretion disk.
Acknowledgements.
First of all we wish to thank Per Olof Lindblad for many valuable discussions and his numerous comments on the manuscript of this paper. We also wish to thank the anonymous referee for the careful reading of the manuscript and the many constructive comments, which much improved our paper. For valuable contributions in the late-stage preparation of the Odin satellite observing program and its successful operation, we wish to thank H.-G. Floren at Stockholm Observatory, M. Battelino and B. Jakobsson at OHB Sweden, G. Persson at Onsala Space Observatory and S.-O. Silverlind at the Swedish Space Corporation in Esrange.References
- (1) Aalto, S., Hüttemeister, S., Scoville, N. Z., & Thaddeus, P. 1999, ApJ, 522, 165
- (2) Aalto, S., Muller, S., Sakamoto, K, et al. 2012, A&A, 546, A68
- (3) Aalto, S., Costagliola, F., Muller, S., et al. 2016, A&A, 590, A73
- (4) Alloin, D., Edmunds, M. G., Lindblad, P. O., & Pagel, B. E. J. 1981, A&A, 101, 377
- (5) Alonso-Herrero, A., Sanchez-Portal, M., Ramos Almeida, C., et al. 2012, MN, 425, 311
- (6) Arce, H. G., Shepherd, D., Gueth, F., et al. 2007, Molecular Outflows in Low- and High-Mass Star-forming Regions, in Protostars and Planets V, ed. B. Reipurth, D. Jewitt, & K. Keil, (University of Arizona Press, Tucson), 245
- (7) Armijos-Abendano, J., Martin-Pintado, J., Requena-Torres, M. A., et al. 2019, arXiv1902.05098
- (8) Audibert, A., Combes, F., García-Burillo, S., et al. 2019, A&A, 632, A33
- (9) Beck, R., Shoutenkov, V., Ehle, M., et al. 2002, A&A, 391, 83
- (10) Beck, R., Fletcher, A., Shukurov, A., et al. 2005, A&A, 444, 739
- (11) Bergin, E. A., Melnick, G. J., & Neufeld, D. A. 1998, ApJ, 499, 777
- (12) Black, J. H., & Dalgarno, A. 1973, ApL, 15, 79
- (13) Blandford, R. D., & Begelman, M. C. 1999, MNRAS 303, L1
- (14) Bohlin, R. C., Savage, B. D., & Drake, J. F. 1978, ApJ, 224, 132
- (15) Combes, F., Garcia-Burillo, S., Audibert, A., et al. 2019, A&A, 623, A79
- (16) Curran, S. J., Polatidis, A. G., Aalto, S., & Booth, R,. S. 2001, A&A, 368, 824
- (17) Elmegreen, B. G., Galliano, E., & Alloin, D. 2009, ApJ, 703, 1297
- (18) Falgarone, E., Godard, B., Cernicharo, J., et al. 2010a, A&A, 521, L15
- (19) Falgarone, E., Ossenkopf, V., Gerin, M., et al. 2010b, A&A, 518, L118
- (20) Falgarone, E., Zwaan, M. A., Godard, B., et al. 2017, Nature, 548, 430
- (21) Farquhar, P. R. A., Millar, T. J., & Herbst, E. 1994, MNRAS, 269, 641
- (22) Fazeli, N., Busch, G., Valencia-S., M., et al. 2019, A&A, 622, 128
- (23) Flower, D. R. & Pineau des Forêts, G. 2003, MNRAS, 343, 390
- (24) Flower, D. R. & Pineau des Forêts, G. 2010, MNRAS, 406, 1745
- (25) Flower, D. R., Le Bourlot, J., Pineau des Forêts, G., & Cabrit, S. 2003, MNRAS, 341,70
- (26) Fridlund, C.V.M.; & Liseau, R. 1994, A&A, 292, 631
- (27) Frisk, U., Hagström M., Ala-Laurinaho, J., et al. 2003, A&A, 402, L27
- (28) Galliano, E., Alloin, D., Pantin, E., et al. 2005, A&A, 438, 803
- (29) Galliano, E., Alloin, D., Pantin, E., et al. 2008, A&A, 492, 3
- (30) Galliano, E., Kissler-Patig, M., Alloin, D., & Telles, E. 2012, A&A, 545, A10
- (31) Garcia-Burillo S., Combes, F., Usero, A., et al. 2014, A&A, 567, A125
- (32) Gerin, M., de Luca, M., Goicoechea, J. R., et al. 2010, A&A, 521, L16
- (33) Gerin, M., Neufeld, D. A., & Goicoechea, J. R. 2016, ARA&A, 54, 181
- (34) Godard, B., & Cernicharo, J. 2013, A&A, 550, A8
- (35) Godard, B., Pineau des Forêts, G., Lesaffre, P., et al. 2019, A&A, 622, A100
- (36) Goldsmith, P. F., & Langer, W. D. 1978, ApJ, 222, 881
- (37) González-Alfonso, E., Fischer, J., Isaak, K., et al. 2010, A&A, 518L, 43
- (38) González-Alfonso, E., Fischer, J., Graciá-Carpio, J., et al. 2012, A&A, 541, A4
- (39) González-Alfonso, E., Fischer, J., Bruderer, S., et al. 2013, A&A, 550, A25
- (40) González-Alfonso, E., Fischer, J., Aalto, S., & Falstad, N. 2014, A&A, 567, A91
- (41) Herbst, E., & Leung, C. M. 1986a, MNRAS, 222, 689
- (42) Herbst, E., & Leung, C. M. 1986b, ApJ, 310, 378
- (43) Hjalmarson, Å.; & Friberg, P. 1988, ASIC, 241, 65
- (44) Hjalmarson, Å., Sume, A., Elldér, J., et al. 1977, ApJS, 35, 263
- (45) Hjalmarson, Å., Frisk, U., Olberg, M., et al. 2003, A&A, 402, L39
- (46) Hjalmarson, Å., Bergman, P., Biver, N., et al. 2005, AdSpR, 36, 1031
- (47) Hjelm, M., & Lindblad, P.O. 1996, A&A, 305, 727
- (48) Hollenbach, D., Kaufman, M. J., Bergin, E. A., & Melnick, G. J. 2009, ApJ, 690, 1497
- (49) Hollenbach, D., Kaufman, M. J., Neufeld, D., Wolfire, M., & Goicoechea, J. R. 2012, ApJ, 754, 105
- (50) Irvine, W. M., Goldsmith, P. F., & Hjalmarson, Å. 1987, ASSL, 134, 561
- (51) Jörsäter, S., & van Moorsel, G. A. 1995, AJ, 110, 2037
- (52) Karlsson, R., Sandqvist, Aa., Hjalmarson, Å., et al. 2013, A&A, 554, A141
- (53) Kristen, H., Jörsäter, S., Lindblad, P. O., & Boksenberg, A. 1997, A&A, 328, 483
- (54) Kristensen, L. E., Ravkilde, T. L., Field, D., Lemaire, J. L., & Pineau des Forêts, G. 2007, A&A 469, 561
- (55) Kristensen, L. E., Klaassen, P.D., Mottram, J.C., Schmalzl, M., & Hogerheijde, M. R. 2013, A&A, 549, L6
- (56) Königl, A., & Pudritz, R. E. 2000, Disk Winds and the Accretion-Outflow Connection, in Protostars and Planets IV, ed. V. Mannings, A. P. Boss, & S. S. Russell, (University of Arizona Press, Tucson), 759
- (57) Langer, W. D., Goldsmith, P. F., & Pineda, J. L. 2016, A&A, 590, 43
- (58) Lena, D., Robinson, A., Storchi-Bergmann, T., et al. 2016, MNRAS, 459, 4485
- (59) Lin, C. C., & Shu, F. H. 1964, ApJ, 140, 646
- (60) Lindblad, P. O. 1960, Stockholms observatoriums annaler, 21, bd 3
- (61) Lindblad, P. A. B., Lindblad, P. O., & Athanassoula, E. 1996, A&A, 313, 65
- (62) Lindblad, P. O., Hjelm, M., Högbom, J., et al. 1996, A&AS, 120, 403
- (63) Lindblad, P. O. 1999, A&AR, 9, 221
- (64) Liu, L., Weiss, A., Perez-Beaupuits, J. P., et al. 2017, ApJ, 846:5
- (65) Madore, B. F., Freedman, W. L., Silbermann, N., et al. 1998, Nat, 395:3, 47
- (66) Meijerink, R. & Spaans, M. 2005, A&A, 436, 397
- (67) Meijerink, R., Spaans, M., & Israel, F. P. 2007, A&A, 461, 793
- (68) Meijerink, R., Kristensen, L. E., Weiss, A., et al. 2013, ApJ, 762L, 16
- (69) Melioli, C., Brighenti, F., D’Ercole, A., & de Gouveia Dal Pino, E. M. 2009, MNRAS, 399, 1089
- (70) Melnick, G. J., Tolls, V., Neufeld, D. A., et al. 2008, ApJ, 683, 876
- (71) Melnick, G. J., Tolls, V., Neufeld, D. A., et al. 2010, A&A, 521, L27
- (72) Mitchell, G. F. 1984, ApJS, 54, 81
- (73) Morris, P.W.; Gupta, H.; Nagy, Z.; et al. 2016, ApJ, 829, 25
- (74) Nagy, Z.; van der Tak, F.F.S.; Ossenkopf, V.; et al. 2013, A&A, 550, A96
- (75) Nagy, Z.; Choi, Y.; Ossenkopf-Okada, V.; et al. 2017, A&A, 559, A22
- (76) Nayakshin, S. 2014, MNRAS, 441,1380
- (77) Neill, J. L., Wang, S., Bergin, E. A., et al. 2013, ApJ, 770, 142
- (78) Neufeld, D. A., Lepp, S., & Melnick, G. J. 1995, ApJS, 100, 132
- (79) Nilsson, A., Hjalmarson, Å., Bergman, P., & Millar, T. J. 2000, A&A, 358, 257
- (80) Norman, C. A., & Ikeuchi, S. 1989, ApJ, 345, 372
- (81) Olofsson, A. O. H., Olofsson, G., Hjalmarson, Å., et al. 2003, A&A, 402, L470
- (82) Persson, C. M., Olofsson, A. O. H., Koning, N., et al. 2007, A&A, 476, 807
- (83) Persson, C. M., Olberg, M., Hjalmarson, Å., et al. 2009, A&A, 494, 637
- (84) Persson, C. M., Maoli, R., Encrenaz, P., et al. 2010, A&A, 515, A72
- (85) Pfenniger, D., & Norman, C. 1990, ApJ, 363, 391
- (86) Pinol Ferrer, N., Lindblad, P. O., & Fathi, K. 2012, MNRAS, 421, 1089
- (87) Rangwala, N., Maloney, P. R., Glenn, J., et al. 2014, ApJ, 788, 147
- (88) Risaliti, G., Harrison, F. A., Madsen, K. K., et al. 2013, Nature, 494, 449
- (89) Rodgers, S. D., & Charnley, S. B. 2001, ApJ, 546, 324
- (90) Roberts, W. W. Jr., & Stewart, G. R. 1987, ApJ, 314, 10
- (91) Rydbeck, G. 2008, ApJ, 675, 1304
- (92) Rydbeck, G., Hjalmarson, Å., & Rydbeck, O.E.H. 1985, A&A, 144, 282
- (93) Rydbeck, O. E. H., Elldér, J., & Irwine, W. M. 1973, Nature 246, 466
- (94) Rydbeck, O. E. H., Kollberg, E., Hjalmarson, Å., et al. 1976, ApJS, 31, 333
- (95) Sakamoto, K., Ho, P. T. P., Mao, R.-Q., Matsushita, S., & Peck, A. B. 2007, ApJ, 654, 782
- (96) Sandqvist, Aa. 1974, A&A, 33, 413
- (97) Sandqvist, Aa. 1999, A&A, 343, 367
- (98) Sandqvist, Aa., Jörsäter, S., & Lindblad, P. O. 1995, A&A, 295, 585
- (99) Sandqvist, Aa., Larsson, B., Hjalmarson, Å., et al. 2008, A&A, 482, 849
- (100) Sandqvist, Aa., Larsson, B., Hjalmarson, Å., et al. 2015, A&A, 584, A118
- (101) Schinnerer, E., Weiß, A., Aalto, S., & Scoville, N. Z. 2010, ApJ, 719, 1588
- (102) Scoville, N. Z., Sanders, D. B., & Clemens, D. P. 1986, ApJ, 310, L77
- (103) Shu, F. H., Milone V., & Roberts, W.W.Jr. 1973, ApJ, 183, 819
- (104) Snell, R. L., Howe, J. E., Ashby, M. L., et al. 2000, ApJ, 539, L101
- (105) Spinoglio, L., Pereira-Santaella, M., Busquet, G., et al. 2012, ApJ, 758, 108
- (106) Stacey, G. J., Lugten, J. B., & Genzel, R. 1987, ApJ, 313, 859
- (107) Sundelius, B., Thomasson, M., Valtonen, M.J., & Byrd, G.G. 1987, A&A, 174, 67
- (108) Swinyard, B. M., Ade, P., Baluteau, J.-P., et al. 2010, A&A, 518, L4
- (109) Tabatabaei, F. S., Weiss, A., Combes, F., et al. 2013, A&A, 555, A128
- (110) Takahashi, H., Holenbach, D.J., & Silk, J. 1985, ApJ, 292, 192
- (111) Toomre, A. 1964, ApJ, 139, 1217
- (112) Turner, B. E. 1988, ApJ 329, 425
- (113) Turner, B. E., & Zuckerman, B. 1974, ApJ, 187L, 59
- (114) van der Tak, F. F. S., Black, J. H., & Schöier, F.L. 2007, A&A, 468, 627
- (115) van der Tak, F. F. S., Marseille, M. G., Herpin, F., et al. 2010, A&A, 518, L107
- (116) van der Tak, F. F. S., Weiss, A., Liu, L., & Güsten, R. 2016, A&A, 593, A43
- (117) van Dishoeck, E. F., & Blake, G. A. 1998, ARA&A, 36, 31
- (118) van Dishoeck, E. F., Herbst, E., & Neufeld, D. A. 2013, ChRv, 113, 9043
- (119) Venturi, G. M., Nardini, E., Marconi, A., et al. 2018, A&A, 619, A74
- (120) Wada, K. 2012, ApJ, 758, 66
- (121) Wada, K. 2015, ApJ, 812, 82
- (122) Wada, K., Schartmann, M., & Meijerink, R. 2016, ApJ, 828, L19
- (123) Walmsley, C. M., Güsten, R., Angerhofer, P., et al. 1986, A&A, 155, 129
- (124) Whiteoak, J. B., Gardner, F. F., & Höglund, B. 1980, MNRAS, 190, 17
- (125) Wiesemeyer, H., Güsten, R., Menten, K. M., et al. 2018, A&A, 612, 37
- (126) Wilson, C. D., Mason, A., Gregersen, E., et al. 2003, A&A, 402, L59
- (127) Wirström, E. S., Bergman, P., Olofsson, A. O. H., et al. 2006, A&A, 453, 979
- (128) Yang, C., Gao, Y., Omont, O., et al. 2013, ApJ, 771, L24
- (129) Zhao, Y., Lu, N., Xu, C. K., et al. 2016, ApJ, 819, 69
- (130) Ziurys, L. M., & Turner, B. E. 1985, ApJ, 292L, 25
Appendix A VLA H i and SEST SID CO () position-velocity maps
Position-Velocity (P-V) maps of our VLA H i and SEST SID CO () observations, oriented parallel to the major axis of NGC 1365, are presented in Fig. A.1.
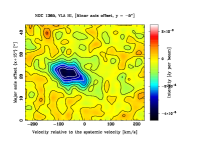
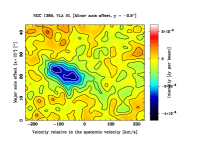
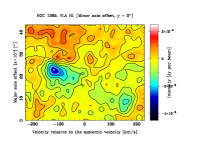
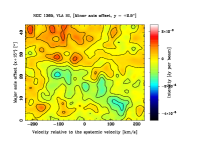

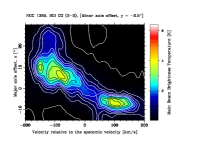
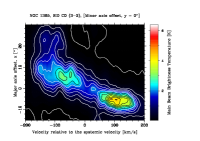
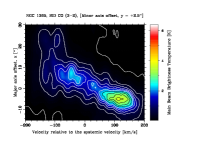
Appendix B On interstellar water chemistry
B.1 Water abundances in NGC 1365 vs Galactic prototype regions
In Table B.1 we compare our current NGC 1365 H2O abundance estimates with recent Odin results for the Galactic Center Sgr A region (Karlsson et al. kar13 (2013)), and with Odin and Herschel HIFI results for the local Orion molecular cloud (to demonstrate observationally determined H2O abundances caused by the PDR, warm cloud core, Hot Core, bipolar outflow and shock chemistries which are likely to be present also in the central regions of NGC 1365). For comparison we also list Herschel and Odin/SWAS results for the cold dense cores of the Galactic molecular clouds DR 21 and W 3 and for the S 140 PDR interface region.
| Source | Region | Abundance vs H2 [] | |
|---|---|---|---|
| (distance) | (kinetic temperature) | Odin ∗*∗*footnotemark: | Herschel |
| NGC 1365 a𝑎aa𝑎afootnotemark: | absorption (20 K) | ||
| (18.6 Mpc) | warm emission ( K) | s𝑠ss𝑠sfootnotemark: | |
| shocks (350 K) | u𝑢uu𝑢ufootnotemark: t𝑡tt𝑡tfootnotemark: | ||
| Sgr A d𝑑dd𝑑dfootnotemark: | +50 km s-1 Cloud (60 K) | 5 | |
| (8.7 kpc) | Red wing of +50 km s-1 Cloud e𝑒ee𝑒efootnotemark: | 130 | |
| CND (150 K) f𝑓ff𝑓ffootnotemark: | 9 | ||
| Red wing of CND e𝑒ee𝑒efootnotemark: | 760 | b𝑏bb𝑏bfootnotemark: | |
| +20 km s-1 Cloud (60 K) | 3 | 4c𝑐cc𝑐cfootnotemark: | |
| Red wing of +20 km s-1 Cloud e𝑒ee𝑒efootnotemark: | 110 | ||
| 30 km s-1 arm g𝑔gg𝑔gfootnotemark: | 4 | ||
| Orion KL m𝑚mm𝑚mfootnotemark: | PDR interface region (70 K) | 9 h,iℎ𝑖h,ih,iℎ𝑖h,ifootnotemark: | |
| (450 pc) | 2′ south core (75 K) | 11 h,iℎ𝑖h,ih,iℎ𝑖h,ifootnotemark: | |
| Compact Ridge (115 K) | 280 j𝑗jj𝑗jfootnotemark: | 260 k𝑘kk𝑘kfootnotemark: | |
| Hot Core (200 K) | 1200 j𝑗jj𝑗jfootnotemark: | 1000 l,k𝑙𝑘l,kl,k𝑙𝑘l,kfootnotemark: | |
| Low velocity outflow | 290 j𝑗jj𝑗jfootnotemark: | 480 k𝑘kk𝑘kfootnotemark: | |
| High velocity outflow (vs all H2) | 2200 j𝑗jj𝑗jfootnotemark: | ||
| 7000 l𝑙ll𝑙lfootnotemark: | |||
| High velocity outflow (vs shocked H2] | 10000 hℎhhℎhfootnotemark: | ||
| 28000 j𝑗jj𝑗jfootnotemark: | |||
| DR 21 | Cool dense core (23 K) | 0.1 n,o𝑛𝑜n,on,o𝑛𝑜n,ofootnotemark: | |
| (1.7 kpc) | Foreground cloud (10 K) | 2 n,o𝑛𝑜n,on,o𝑛𝑜n,ofootnotemark: | |
| Low velocity outflow | 280 n,o𝑛𝑜n,on,o𝑛𝑜n,ofootnotemark: | ||
| W3 IRS 5 | Cool dense core (40 K) | 0.2 p𝑝pp𝑝pfootnotemark: | |
| (2.3 kpc) | |||
| S 140 | Clumpy PDR interface with dark cloud (55 K) | 5/0.1 q,r𝑞𝑟q,rq,r𝑞𝑟q,rfootnotemark: | |
| Low velocity outflow | 40 q𝑞qq𝑞qfootnotemark: |
(∗) based upon ortho-H2O, HO and HO () observations; (a) this paper; (b) from Herschel mapping of the CND/Sgr A* by Armijos-Abendano et al. (arm19 (2019)); (c) from Herschel mapping of the +20 km s-1 Cloud by Armijos-Abendano et al. (arm19 (2019)); (d) from Karlsson et al. (kar13 (2013)), assuming an ortho-to-para ratio of 3; (e) outflow/shock; (f) Circumnuclear Disk (torus) surrounding the Sgr A* black hole; (g) foreground spiral arm; (h) Olofsson et al. (olo03 (2003)); (i) Wirström et al. (wir06 (2006)); (j) Odin spectral scan, Persson et al. (per07 (2007)); (k) Herschel/HIFI spectral scan, Neill et al. (nei13 (2013)); (l) Melnick et al. (mel10 (2010)); (m) mapped in detail by Odin, Hjalmarson et al. (hja05 (2005)); (n) based upon para-H2O ( observations, van der Tak et al. (tak10 (2010)); (o) assuming an ortho-to-para ratio of 3; (p) from Odin mapping by Wilson et al. (wil03 (2003)) in close agreement with SWAS results by Snell et al. (sne00 (2000)); (q) clump/interclump values; (r) from Odin mapping by Persson et al. (per09 (2009)). (s) the lower abundance estimates appear at higher densities and can be accommodated by PDR models, while the high abundances (at a density of cm-3) would indicate that the existing shocks also contribute to the observed ground state H2O emission. (t) shock model abundance (Flower & Pineau des Forêts flo10 (2010)) in an effective (accumulated) 10″ size area of the circumnuclear torus (see Sect. 4.4). (u) caused by slow velocity shock chemistry in the case of (here unconfirmed) dominant FIR excitation (Gonzalez-Alfonso et al. gon10 (2010), gon12 (2012), gon14 (2014)).
B.2 Water chemistry in cold and warm regions
To make our discussion of the interstellar H2O chemistry going on in the central regions of NGC 1365 more to the point, we here provide a very simplified summary of the main formation and destruction routes, for cases where the theoretical models are well established (for details we refer to the extensive review paper by van Dishoeck et al. dis13 (2013)) and where a sample of relevant observed H2O abundances have been listed in Table B.1.
B.2.1 Low temperature gas-phase water chemistry
The oxygen chemistry is initiated by cosmic-ray (CR) ionization of
H2 which rapidly leads to the formation of the trihydrogen ion
(H). Next step is
H + O =¿ OH+ + H2 ; H2O+ + H (1)
followed by
OH+ + H2 = H2O+ + H (2)
and, subsequently,
H2O+ + H2 = H3O+ + H (3)
followed by dissociative recombination,
H3O+ + e- =¿ H2O + H (17%), (4)
but also
(83%) OH + H2 ; OH + 2H ; O + H2 + H.
At low temperatures the main loss of gaseous H2O is via accretion (adsorption, “sticking”) onto cold dust grain surfaces (where water ice has been observed to be a main constituent). Only at grain temperatures of 100 K, or higher, the H2O molecules are efficiently desorbed (evaporated) from the icy grain surfaces. While the just (crudely) described ion-molecule reaction scheme, for a standard Galactic CR flux, is capable of producing a gas-phase H2O abundance (H2O) versus H2, the “freeze out” on cold grain surfaces may reduce this abundance by several orders of magnitude, as is illustrated in Table B.1 by the observed values of in the DR 21 and W 3 molecular cloud cores.
The expected gas-phase H2O abundance is closely related to the H production. An increase of the CR flux leads to a faster chemistry, and also results in higher H and H2O abundances (cf. Farquhar et al. far94 (1994); Nilsson et al. nil00 (2000), on-line Figs. 16 and 21). In NGC 1365 we have already envisioned a probable CR focusing by the observed magnetic field aligned along the bar. Alternatively, X-ray ionization of H2, rapidly leading to enhanced H abundance, also would do the same job. X-ray emission has indeed been observed in NGC 1365, especially in the nuclear region (from the central AGN, black hole region; see Lindblad lin99 (1999)). Theory for XDR (X-ray Dominated Region) physics, chemistry has been developed by Meijerink & Spaans (mei05 (2005)) and has been applied to galaxy nuclei by Meijerink et al. (mei07 (2007)). Also an increased UV flux from one or more newly formed massive stars, influencing the surface layers of their mother molecular clouds and a developing H ii region also is bound to produce an enhanced H2O abundance (theory by e.g, Hollenbach et al. hol09 (2009), hol12 (2012), who also study the influences of increased CR ionization). In Table B.1 we have listed observed H2O abundances of in the Orion PDR (Photon Dominated Region) interface layer between the molecular cloud and the M 42 H ii region, and in the S 140 PDR. The water abundances of , observationally estimated for the DR 21 foreground cloud and the Sgr A 30 km s-1 arm, both seen in absorption, also are likely results of PDR chemistry, but now in lower density regions of low visual extinction where the general Galactic background UV radiation can penetrate.
B.2.2 Ice chemistry
In parallel with the low temperature gas-phase chemistry, there are also ongoing grain surface reactions. In addition to the formation of H2, which requires a third body for its efficient formation, there are also a number of reactions (collisions) between atoms and molecules sticking on the grain surfaces, and jumping between the potential wells on the surface, hence forming ices containing H2O, CH3OH, NH3, CO, CO2, and CH4. To contribute to the gas-phase chemistry, these surface-sticking species need to be desorbed (evaporated, i.e., converted from solid state to gas-phase constituents). This desorption will require a grain temperature increase, which may be caused by absorption of the strong UV light from nearby newly formed stars, which is the case in PDR chemistry (Hollenbach et al. hol09 (2009)) as well as in Hot Core chemistry (Rodgers & Charnley rod01 (2001)). According to Table B.1 the observed H2O abundances are as high as and in the high density Orion Hot Core (where K) and Compact Ridge (where K) regions, respectively.
B.2.3 High temperature water chemistry
Detachment of ice layers of grain-sticking molecules may also be caused by shocks, as may be the case in low velocity bi-polar outflows from young stars, supernova shocks and Galactic density wave shocks (cf. Flower & Pineau des Forêts flo03 (2003); Melnick et al. mel08 (2008)). In Table B.1 we list observed gas-phase H2O abundances of a few in the Orion and DR 21 low velocity outflows, and similar values for the red wing emissions from the Sgr A molecular cloud cores.
In addition to the evaporation of ices we also have to consider some
key high temperature gas phase reactions, that is,
O + H2 = OH + H (5)
and subsequently
OH + H2 = H2O + H. (6)
Shock heating and compression in this way may result in very high post
shock gas-phase H2O abundances (cf. e.g., Bergin et al. ber98 (1998); Flower
et al. flo003 (2003); Kristensen et al. kri07 (2007); Flower & Pineau
de Forêts flo10 (2010)), as illustrated in Table B.1 by an
observationally determined (H2O) versus shocked H2 approaching in the Orion high velocity outflow, where (almost) all
elemental oxygen has been “locked-up” in gas-phase water. Here we
should again remember that outflow driven shock excitation of H2 has been observed by Galliano et al. (gal12 (2012)) in some of the
circumnuclear torus hot spots of NGC 1365 (i.e., massive stellar
clusters with their associated massive star forming gas clouds).
Appendix C Summary of the molecular physics and the interstellar chemistry of CH and CH+
An energy level diagram for CH is provided by Rangwala et al. (ran14 (2014)) and more detailed ones may be found in Rydbeck et al. (ryd76 (1976)) and Turner (tur88 (1988)). The rotational levels of the light weight CH molecule appear in the submm/FIR range and show a doublet spectral line pattern caused by the splitting of the individual rotational state energies into -doublets, resulting from the relative orientations of the orbital momentum axis of the unpaired electron and the molecular rotation axis (being parallel or orthogonal, denoted as + or – parity). Magnetic hyperfine interaction further splits the -doublet state energies, which was crucial for the identification of the interstellar radio transitions of CH, but causes overlapping lines and even difficult blends of emission and absorption at submm and FIR wavelengths. The observed doublet pattern of the rotational lines is the result of the quantum mechanical selection rule that a state parity change is required for an electric dipole transition to take place.
CH, CH+, and CN were the first interstellar molecules to be identified (in 1937-1941), via their absorption lines of the visual light from background stars (see the review by Gerin et al. ger16 (2016)). The interstellar detection of the radio signals at GHz from the three hyperfine transitions within the -doubled CH ground state was a matter of searches across a wide frequency range, since the frequencies were only very crudely known from molecular quantum mechanics applied to optical spectroscopy (Rydbeck et al. ryd73 (1973); Turner & Zuckerman tur74 (1974)). Subsequently the three CH hyperfine transitions were extensively observed and analyzed, and it was shown that these lines were weak masers (amplifying any background emission) in molecular cloud cores, cold dark clouds as well as in lower density spiral arm clouds (Rydbeck et al. ryd76 (1976); Hjalmarson et al. hja77 (1977)). The CH abundance versus H2 was observed to decrease (from to ) with increasing cloud density, which may well be expected in regions where this reactive radical is consumed in the formation of more complex molecules, and also is consistent with more recent interstellar chemistry modeling (e.g., Herbst & Leung 1986 a,b). The lower satellite line of CH at 3264 MHz displayed an interesting anomaly in that its intensity rapidly increased with increasing FIR continuum emission, which was explained as “FIR pumping” and resulted from the parity structure of the -doubled rotational states (Rydbeck et al. ryd76 (1976)). Subsequently CH detections in external galaxies could also be done, using the very sensitive maser receiver from Onsala Space Observatory installed on the Australian Parkes 64-m radio telescope (Whiteoak et al. whi80 (1980)).
The first astronomical observation of CH in the far-infrared was performed by Stacey et al. (sta87 (1987)). Using NASA’s Kuiper Airborne Observatory they were able to detect the ground state -doublet to the rotationally excited -doublet state transitions of CH as an absorption line doublet at m (2006.8/2010.8 GHz) against the FIR thermal dust emission of Sgr B2. These transitions are “always” expected to be observed in absorption since their critical densities for collisional excitation are ¿ 1010 cm-3. Stacey et al. estimate the CH abundance versus H2 to be for the Sgr B2 (denser) molecular cloud and for the (lower density) absorbing clouds in the 3 kpc arm and the expanding molecular ring. They also conclude that the enhanced 3264 MHz CH emission from the Sgr B2 molecular cloud must be primarily a FIR excitation effect. Recently much more detailed, higher spectral and spatial resolution, 2 THz CH absorption doublet studies toward a number of Galactic molecular clouds have been performed from SOFIA (the Stratospheric Observatory for Infrared Astronomy; Wiesemeyer et al. wie18 (2018)).
The lowest rotationally excited CH () state, only 25.7 K above the ground state, was detected by means of the very large 1000 foot (300 m) Arecibo and Green Bank 300 foot (91 m) telescopes in a number of molecular cloud cores, in terms of four hyperfine transitions within the -doublet at MHz, all seen in absorption (Ziurys & Turner ziu85 (1985); Turner tur88 (1988)). An interesting conclusion was that the CH abundance versus H2 was as high as in regions of density cm-3 – an abundance which was too high to be consistent with chemical models for dense quiescent clouds, but instead pointed at the action of shock chemistry. In fact, molecular outflows (causing shocks) have been observed in the regions considered. The results from the (early) modeling of low velocity shocks ( km s-1) in dense (104 cm-3) gas clouds by Mitchell (mit84 (1984)) is a useful guideline here – and may be so also in our case of NGC 1365.
The detection of the CH 533/537 GHz transition doublet in the directions of several massive star-formation regions relied on Herschel HIFI observations, and revealed intriguing blends of absorptions from lower density (diffuse) spiral arm foreground clouds and emission from the molecular cloud cores (Gerin et al. ger10 (2010)). Thanks to the hyperfine splitting, nowadays known from laboratory spectroscopy, paired with molecular quantum mechanics the emission/absorption line pattern could be deconvolved. The CH abundance vs H2 in the foreground clouds was determined to be in clouds having densities in the range cm-3 – an abundance consistent with the results from decades of optical CH absorption line observations, and precisely modeled by PDR chemistry (originating from Black & Dalgarno bla73 (1973); see Gerin et al. ger10 (2010) and Gerin et al. ger16 (2016) for a discussion and references). From their SOFIA observations and a careful analysis of the CH absorption line doublet at m (from the ground state, just as the 533/537 GHz transitions) Wiesemeyer et al. (wie18 (2018)) confirm this conclusion, that is, that CH may be used as a reliable tracer of H2 columns and not only in lower density (diffuse) clouds but also in denser high mass star formation regions. This is contrary to the previously mentioned expectations from chemical models for dense quiescent clouds (e.g., Herbst & Leung 1986 a,b) and suggests influences of shock chemistry (caused by bipolar outflows) in the denser star forming clouds (as was concluded already by Turner tur88 (1988), based upon his detailed analysis of the MHz CH absorption line data).
The Herschel HIFI detections by Falgarone et al. (2010a ) of the CH+(0), and 13CH+(), absorption lines at 835 and 830 GHz in the directions of the same star-formation regions also showing CH absorptions, confirmed the long standing problem that the observed CH+ abundance versus H2 , i.e. similar to that of CH and several orders of magnitude higher than the predictions by UV-driven steady state PDR chemistry models. So-called turbulent dissipation models, where the activation energy ( K), needed for the endothermic reaction C+ + H2 = CH+ + H, is drawn from dissipation of turbulence, appear to provide the solution of this dilemma (TDR; Falgarone et al. 2010a ; see Gerin et al. ger16 (2016) for a discussion and further references). In their Herschel HIFI observations of CH+ toward the massive star-formation region DR 21 molecular cloud ridge – one of the most powerful molecular outflows seen in vibrationally excited H2 – another CH+ surprise appeared, in terms of a strong broad CH+() emission line from the cloud core, together with the expected deep absorption features from the DR 21 molecular ridge and foreground gas (Falgarone et al. 2010b ). The broad emission was satisfactorily interpreted by means of a state-of-the-art C-shock model in dense, UV-illuminated gas (Falgarone et al. 2010b ), while the absorptions were consistent with TDR modeling results (Falgarone et al. 2010a ).
The importance of intense UV-illumination for the CH+ formation in dense molecular cloud PDR surfaces became very clear from the Herschel observations of CH+ in the Orion Bar (Nagy et al. nag13 (2013), nag17 (2017)) and the mapping of CH+ and CH in an extended region including Orion KL as well as the Orion Bar (Morris et al. mor16 (2016)). In the Orion Bar the CH+ ( and ) emission lines turned out to be markedly broader than other molecular lines ( km s-1 vs km s-1, as observed by HIFI), and the strong higher energy lines observed by PACS (up to at an upper state energy of 838 K) and indicate a kinetic temperature of K. This very high rotational excitation of CH+ together with the line broadening are clear signs of “formation pumping”, where the activation energy of 4600 K, required for the endothermic reaction C+ + H2 = CH+ + H to take place, is supplied by vibrationally (and rotationally) excited H2, caused by the intense UV-illumination in the observed regions. The H2 excited state excess energy here will cause the high rotational excitation of CH+ as well as line broadening by additional translational CH+ motion (as discussed in detail by Nagy et al. nag13 (2013) and theoretically modeled by Godard and Cernicharo god13 (2013); see also Gerin et al. ger16 (2016) for discussions and references). In the Orion Bar the observed CH+ population distribution leads to a column density 40 times larger than the “minimum” column density calculated from the CH+() emission line, assuming a “reasonable” excitation temperature in the range K, and hence an estimated CH+ abundance larger than that of CH (Table 2 of Nagy et al. nag17 (2017)). This CH+ formation scenario is favored also for the extended Orion molecular cloud surface where (some) CH also may result from dielectronic recombination of CH+ (Morris et al. mor16 (2016)).