Bee Cluster 3D: A system to monitor the temperature in a hive over time
Olivier Besson1 *,
Hervé Mugnier2,
Aurélien Neveux2,
Gaëlle Rey2,
Sully Vitry2.
1 University of Neuchâtel, CH-2000 Neuchâtel, Switzerland
2 Mind Technology, F-74166 Saint-Julien-en-Genevois, France
All authors contributed equally to this work.
* Corresponding author: Olivier Besson
Institute of mathematics,
University of Neuchâtel
11, Rue Emile Argand
CH-2000 Neuchâtel,
Switzerland
E-mail address: olivier.besson@unine.ch
Abstract
A new system, Bee Cluster 3D, allowing the study of the time evolution of the 3D temperature distribution in a bee hive is presented. This system can be used to evaluate the cluster size and the location of the queen during winter. In summer, the device can be used to quantify the size of the brood nest and the breeding activity of the queen. The system does not disturb the activity of the colony and can be used on any hive. This electronic system was developed to be non-intrusive, miniaturized, and energy autonomous.
Keywords
3D temperature distribution time evolution in a hive, winter loss of colonies, brood nest time evolution, bee cluster time evolution .
1 Introduction
Beekeepers know that the temperature distribution in a bee hive is an important parameter for colony development, see also (Abou-Shaara et al., 2017; Barter, 2016; Basile et al., 2008; Lensky, 1964; Dietman et al., 2014; Tautz et al., 2007) and included references.
Various temperature measurement and observation methods have been developed, see, e.g.,(Dunham, 1931). A detailed history of these observations is presented in (Meikle et al., 2015) and the included references. Recently, (Barter, 2016; Niewiatowski et al., 2016; Stalidzans et al., 2013; Becher et al., 2009) developed new data-logging systems. These systems have few sensors, so they cannot provide a 3D representation of the hive temperature.
A new methodology to measure the real-time temperature distribution in a bee hive is presented in this paper. The sensor locations provide a 3D representation of this distribution and enable investigation of:
-
•
the density, the morphology and the size of the bee cluster in the hive;
-
•
the quality, the size, and the distribution of the brood nest;
-
•
the location of the queen in winter.
Moreover, the system can be used to evaluate the colony health status and:
-
•
to know the temperature distribution in the hive as a function of time;
-
•
to have a primary indicator of winter loss of colonies, with a study of risk factors;
-
•
to study the influence of the materials used (e.g., wood, polyester) on heat loss.
Owing to the fine mesh on each frame, the Bee Cluster 3D system can measure thermoregulation in the colony, providing a 3D thermal image with the following advantages.
-
•
The system is non-intrusive in the sense that it is not necessary to open the hive to perform measurements.
-
•
The system is non-invasive because the sensors merge into the the wax frame.
-
•
The information is transmitted in real time.
-
•
The system is energy self-sufficient and is designed for field use.
In general, the presented innovation covers the development of a multi-sensor modular system featuring real-time information about hive development. This system is integrated into a "plug and play" sensor architecture that feeds data to a network database.
This database can be connected to mathematics and vision software on a computer, smartphone, or tablet PC or to a dedicated interface.
From a technical perspective, the main advantage of the Bee Cluster 3D system is the integration of the sensors into the wax frame, enabling natural development of the colony. This integrations allows the beekeeper to work in the hive and avoid disconnection and connection of the lines and manipulation of the frames.
2 Materials and Methods
2.1 System
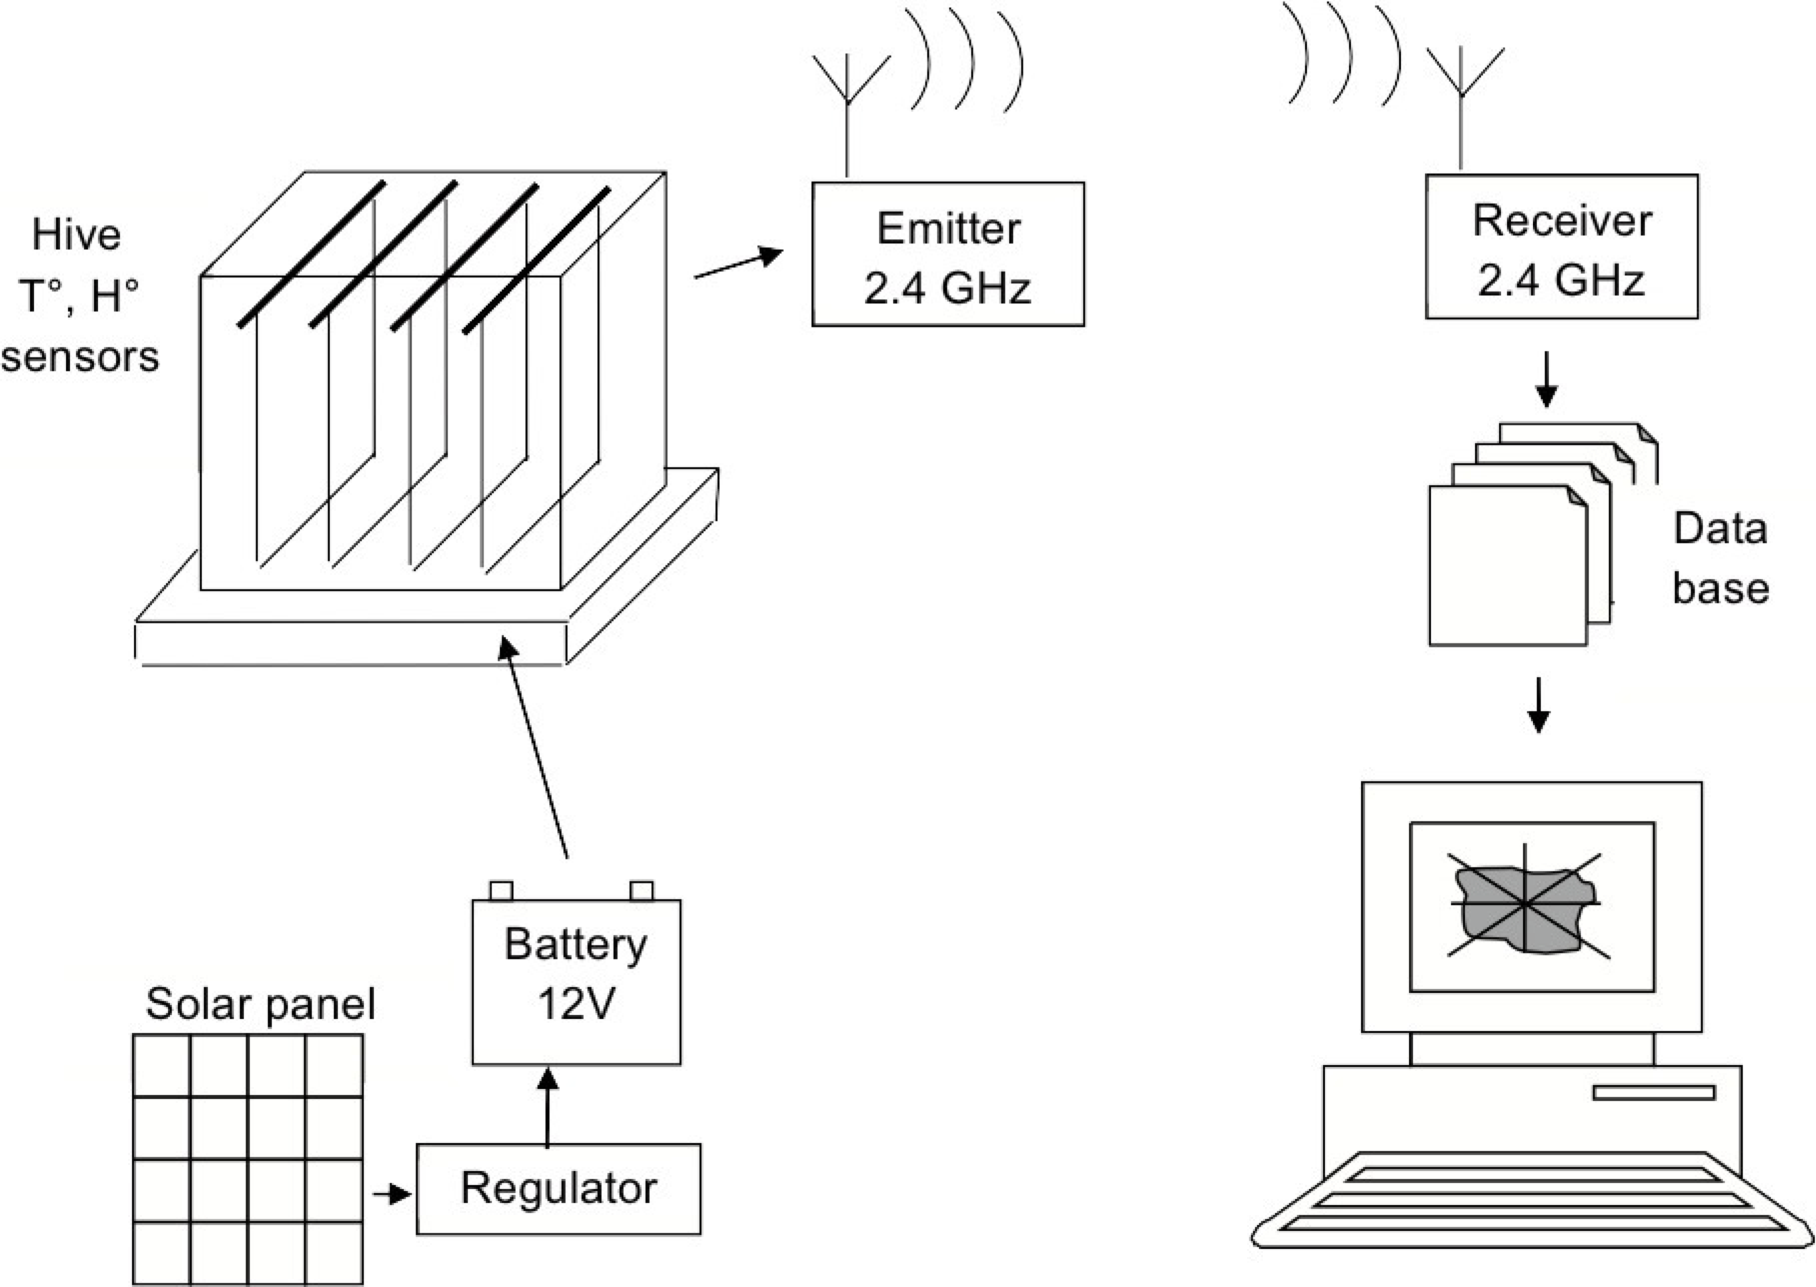
An overview of the data acquisition system is presented in figure 1. The system consists of the equipped hive, the recording frames, a power supply system, a data transmitting/receiving component, and a computer for the database.
2.2 Equipment
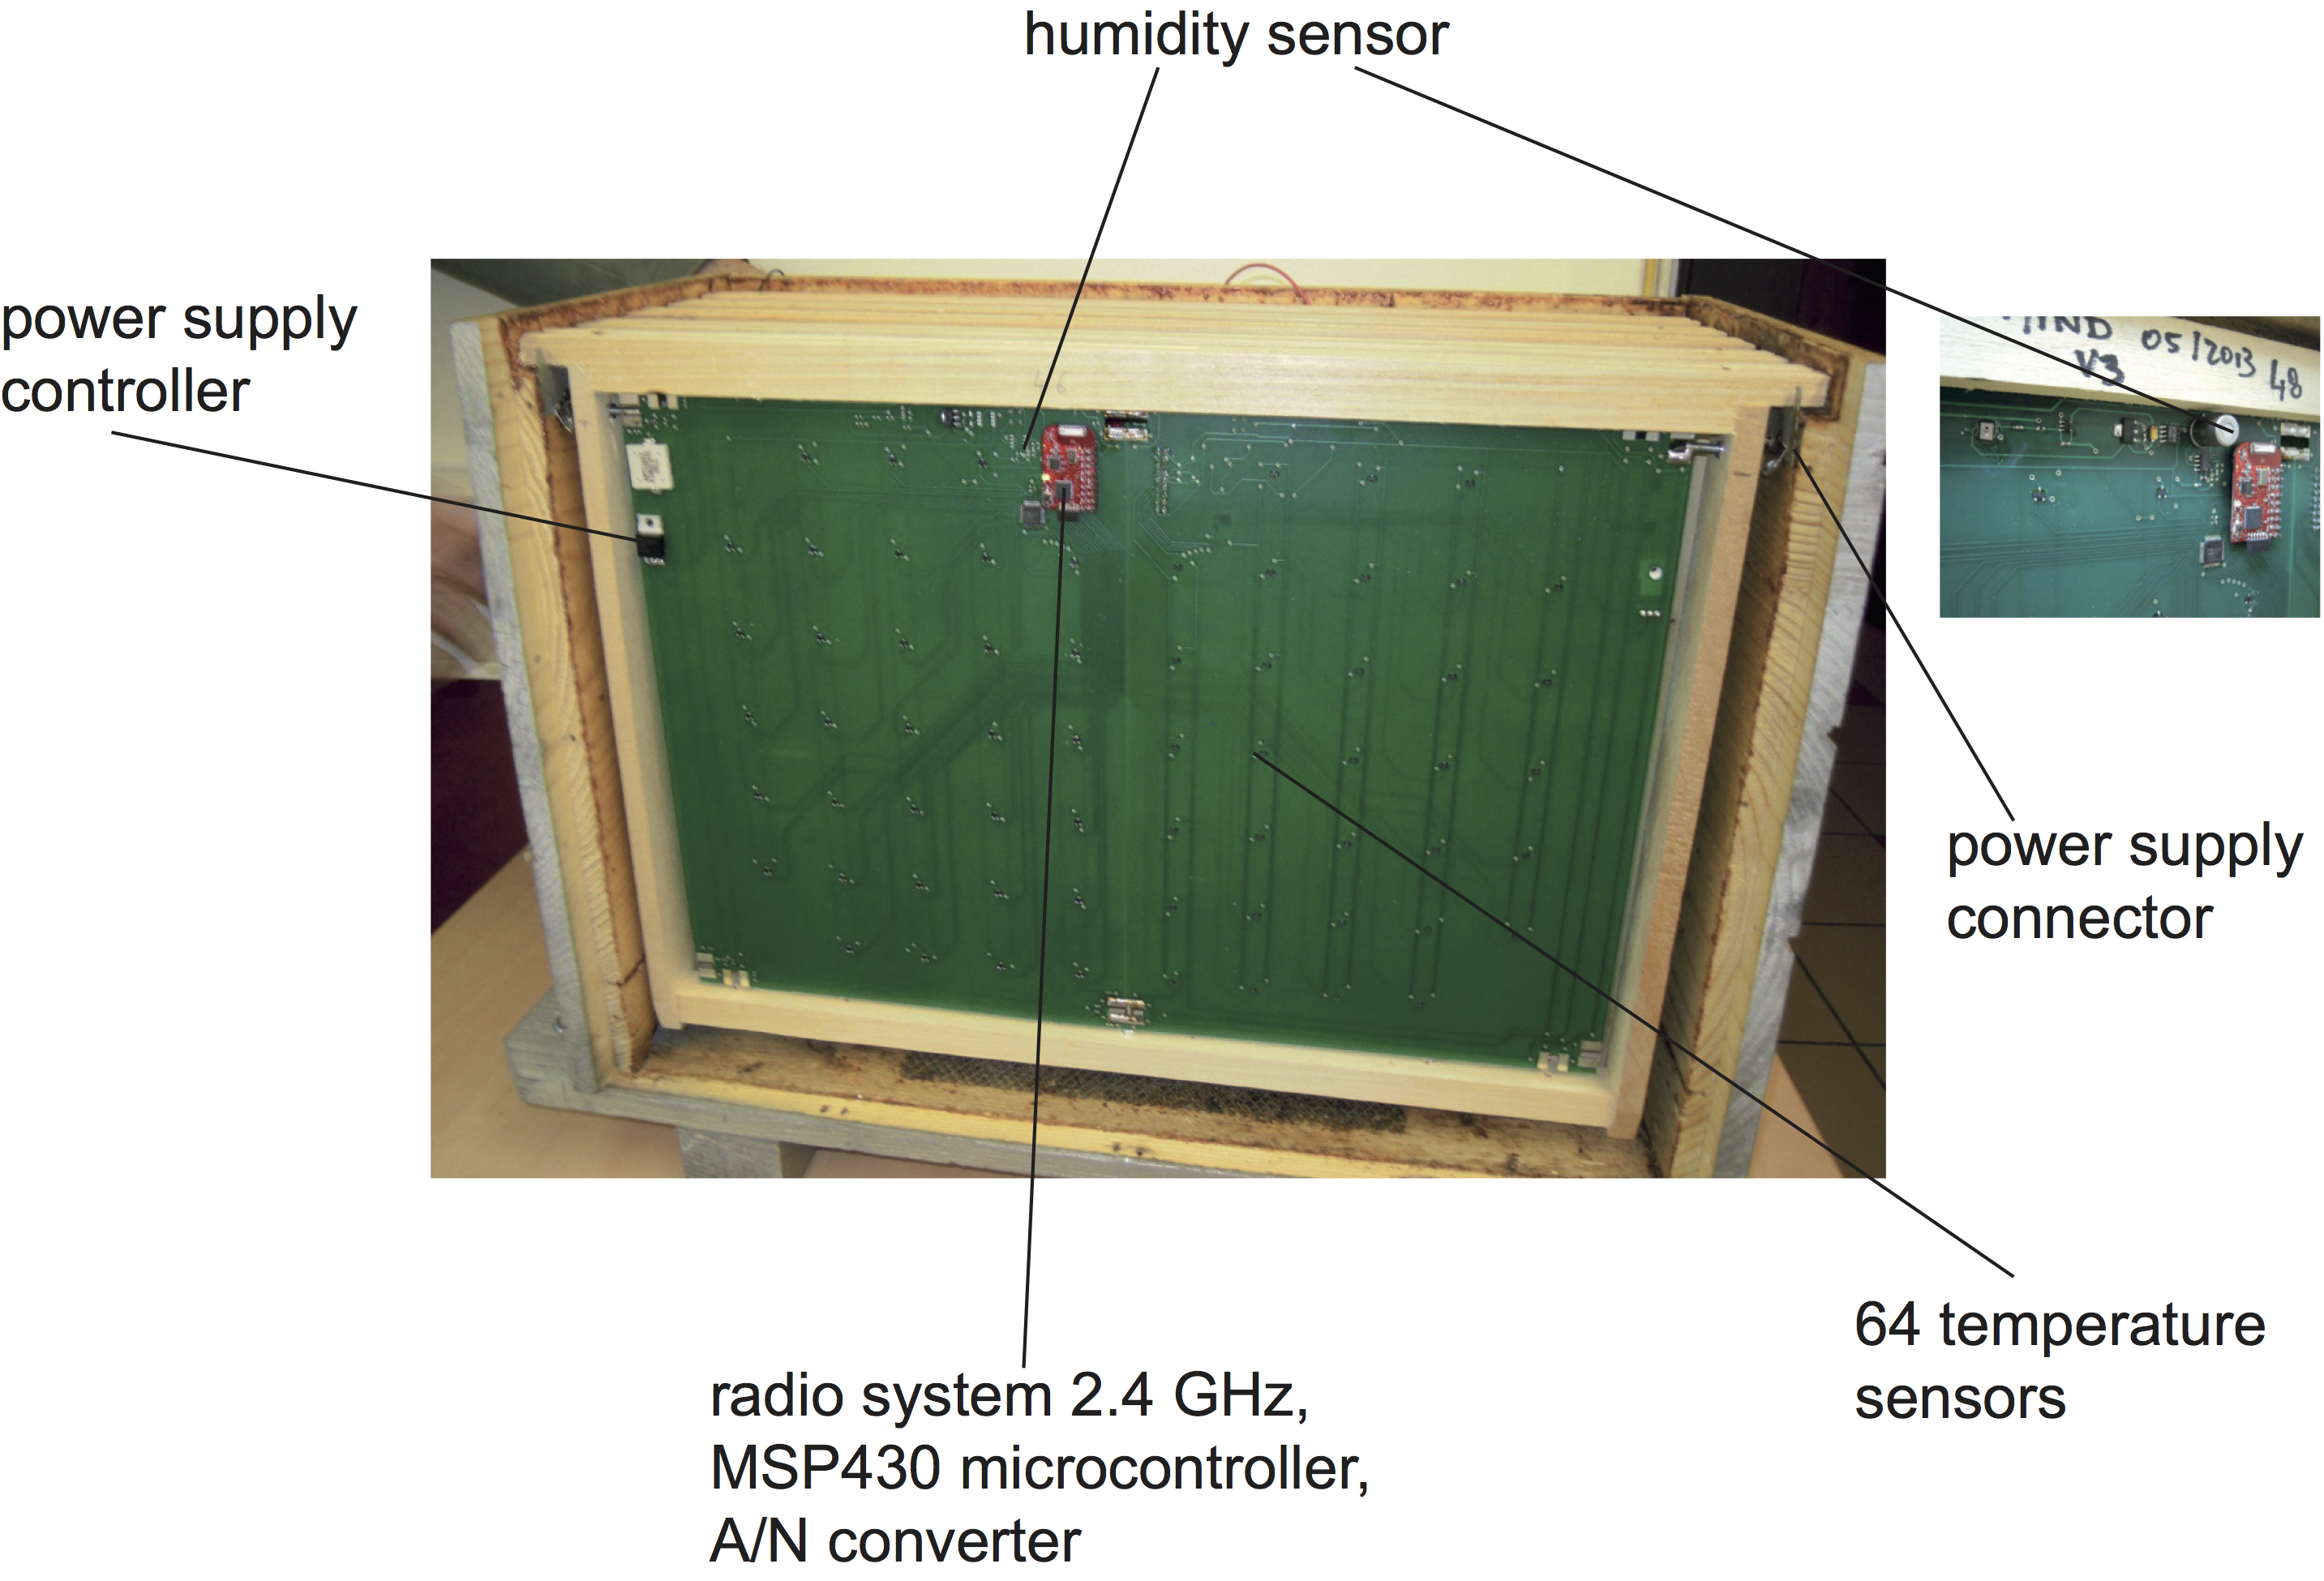
The main data collecting components are the frames equipped with sensors. A frame without wax is shown in figure 2. It is equipped with
-
•
64 heat sensors with a spacing of 3 cm and an accuracy of .
-
•
2 humidity sensors with an accuracy of .
-
•
A power management module.
-
•
A module for the electronic data processing and the radio system.
-
•
Electric power supplied by the connection to the frame rack.
From an energy perspective, the system was designed to be low power consuming. The data recording is performed with a Raspberry Pi nano-computer.
-
•
The energy consumption is 1 mW per frame.
-
•
The Raspberry Pi nano-computer consumes 5 W.
-
•
Data logging is performed every 5 minutes; this parameter may be modified.
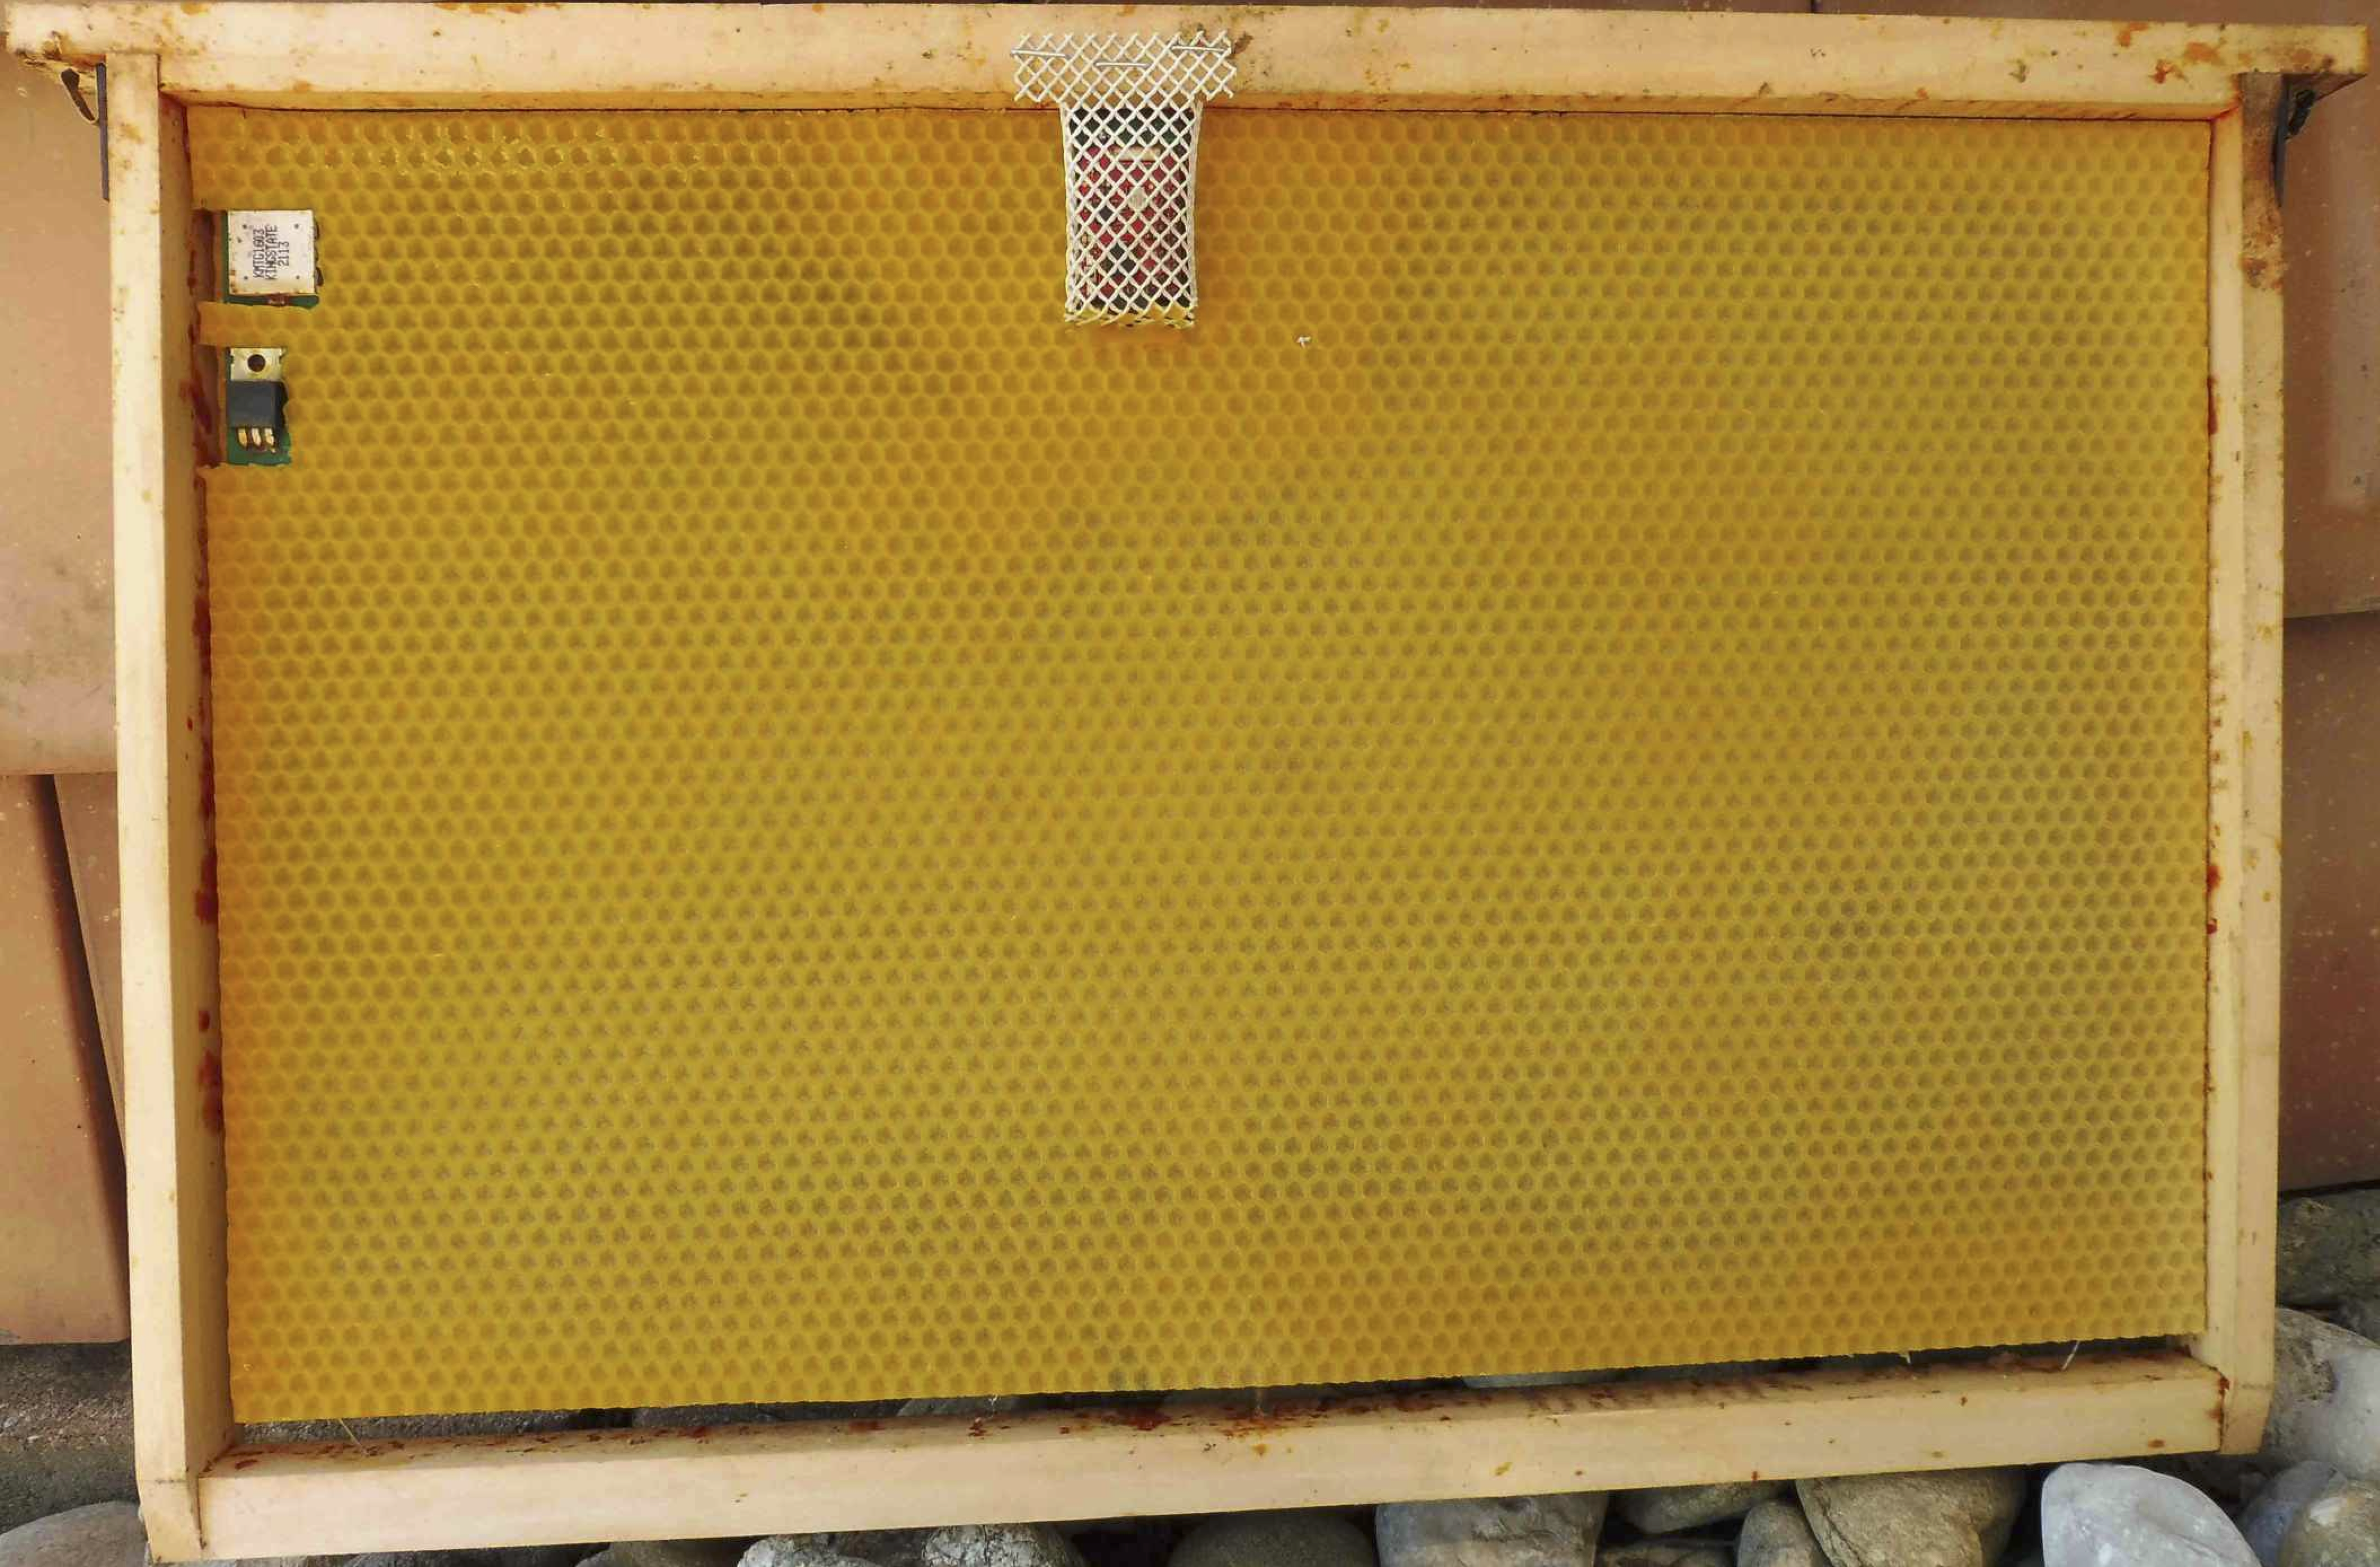
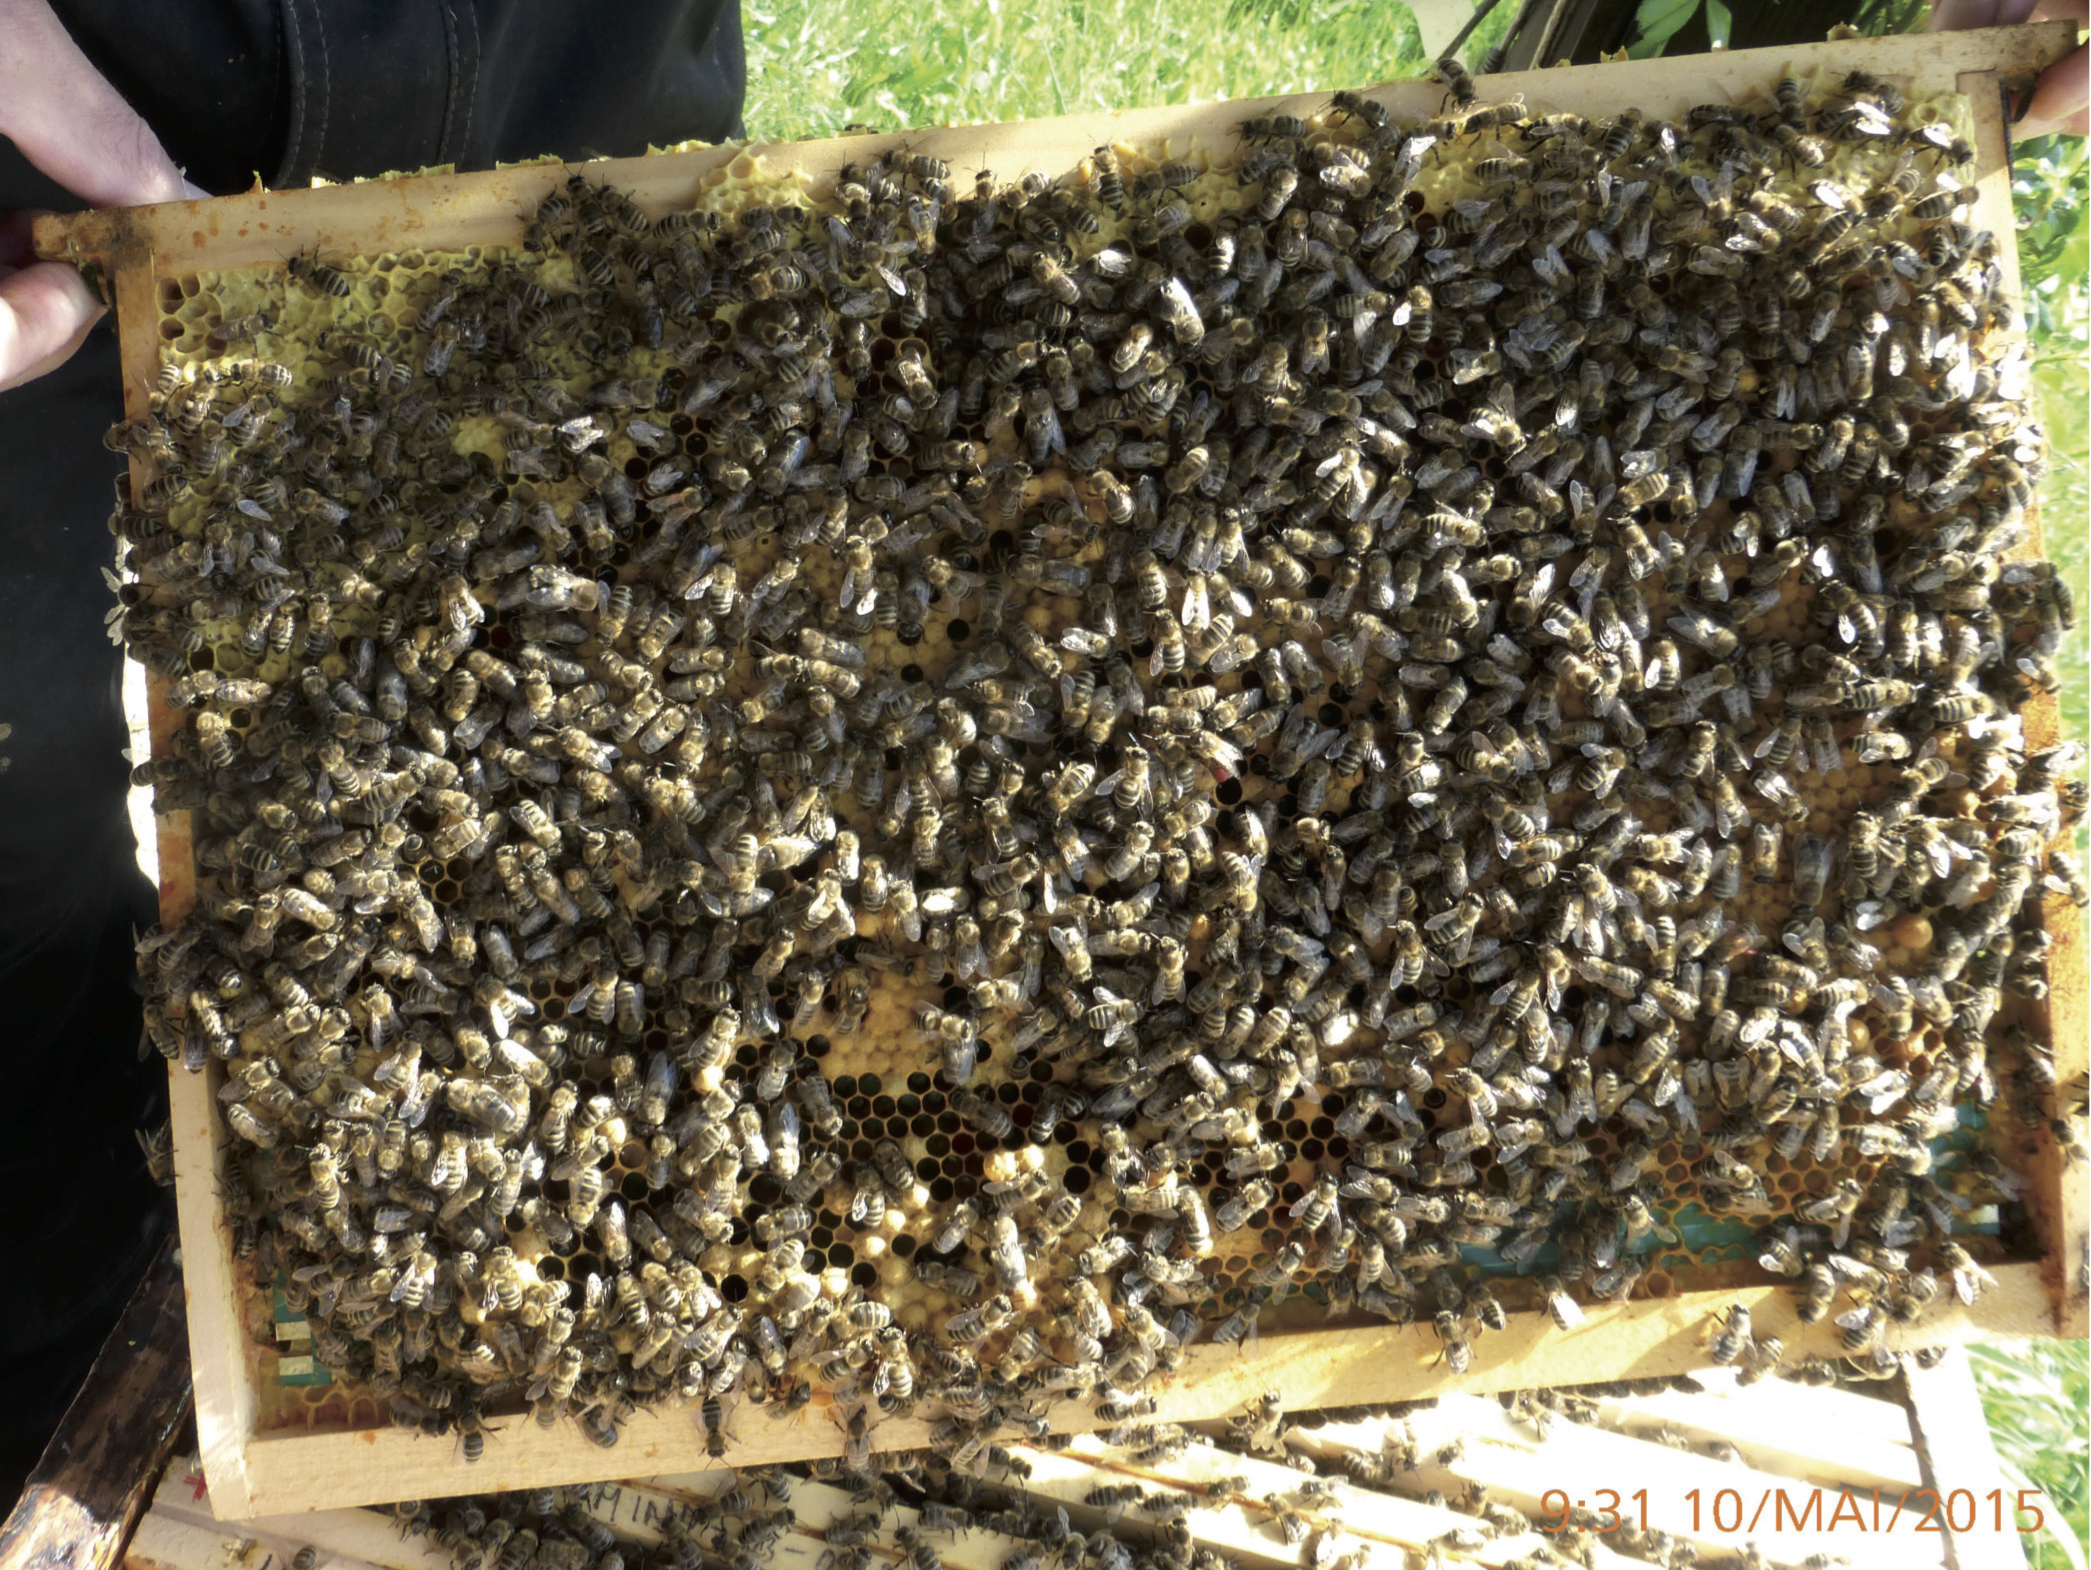
To be fully operational, the instrumented frames must be built by bees, which requires the use of wax comb foundations glued to each face of the electronic board with acrylic glue.
A frame with a wax comb foundation and a built frame are presented in figure 3, resp. 4. A non-metallic grid can be added to protect the radio system.
3 Results
The results presented in this section were obtained during the winter of 2014-2015 and the spring of 2015. The observed hive was formed during autumn of 2014 as a 4-frame store. During the winter, the hive had 4 frames, and new frames were introduced during the spring of 2015.
Our measurements enabled the following observations
-
•
During the winter period, the maximum temperature remained greater than 30∘C in a small, slowly moving region. This region corresponds to the location of the queen.
-
•
During spring, the activity of the queen resulted in an increase of the brood nest.
-
•
Our measurements provide an estimate of the evolution of the number brood cells.
Table 1 contains the temperature extrema observed from August 22, 2014 to September 29, 2015, both in the hive and in a covered space near the hive.
This table shows that the maximum temperature remained above C throughout the winter. As will be seen in section 3.1, a small volume in the hive remained warmer than C.
| Date | Hive temperature | External temperature | |||
|---|---|---|---|---|---|
| From | To | Minimum | Maximum | Minimum | Maximum |
| 22/08/2014 | 31/08/2014 | 15.90 | 37.60 | ||
| 31/08/2014 | 05/09/2014 | 17.80 | 40.20 | ||
| 21/09/2014 | 25/09/2014 | 12.60 | 36.50 | ||
| 30/09/2014 | 08/10/2014 | 17.70 | 36.80 | 13.30 | 26.30 |
| 08/10/2014 | 16/10/2014 | 14.30 | 35.90 | 12.00 | 25.30 |
| 08/12/2014 | 14/12/2014 | 0.10 | 33.40 | 1.10 | 25.00 |
| 14/12/2014 | 21/12/2014 | 1.30 | 35.00 | 2.70 | 15.50 |
| 29/12/2014 | 04/01/2015 | -4.00 | 33.30 | -2.60 | 11.80 |
| 11/01/2015 | 18/01/2015 | -2.60 | 33.50 | -0.90 | 13.90 |
| 18/01/2015 | 25/01/2015 | -0.60 | 33.20 | -4.70 | 16.10 |
| 26/01/2015 | 31/01/2015 | -1.60 | 33.70 | 0.40 | 6.30 |
| 31/01/2015 | 06/02/2015 | -3.10 | 33.00 | -1.60 | 8.10 |
| 08/02/2015 | 14/02/2015 | -3.70 | 33.60 | -1.20 | 11.10 |
| 14/02/2015 | 20/02/2015 | -1.90 | 34.50 | 0.10 | 9.70 |
| 02/03/2015 | 06/03/2015 | 1.30 | 35.30 | ||
| 06/03/2015 | 15/03/2015 | -1.20 | 35.80 | ||
| 15/03/2015 | 23/03/2015 | 3.50 | 36.70 | ||
| 23/03/2015 | 30/03/2015 | 5.80 | 37.70 | 1.90 | 18.30 |
| 30/03/2015 | 06/04/2015 | 6.20 | 37.70 | 2.10 | 18.70 |
| 06/04/2015 | 13/04/2015 | 6.20 | 42.30 | 2.70 | 23.80 |
| 16/04/2015 | 24/04/2015 | 14.20 | 43.00 | 6.00 | 24.20 |
| 24/04/2015 | 02/05/2015 | 22.00 | 42.40 | ||
| 02/05/2015 | 10/05/2015 | 27.00 | 37.50 | ||
| 17/05/2015 | 22/05/2015 | 22.50 | 38.00 | ||
| 22/05/2015 | 10/06/2015 | 23.20 | 37.90 | ||
| 10/06/2015 | 19/06/2015 | 25.20 | 37.20 | ||
| 19/06/2015 | 21/06/2015 | 26.50 | 37.30 | ||
| 29/06/2015 | 02/07/2015 | 21.10 | 37.80 | ||
| 23/07/2015 | 24/07/2015 | 15.40 | 37.90 | ||
| 28/07/2015 | 03/08/2015 | 23.50 | 36.70 | ||
| 03/08/2015 | 05/08/2015 | 18.60 | 37.90 | ||
| 26/08/2015 | 03/09/2015 | 11.80 | 37.80 | ||
| 03/09/2015 | 09/09/2015 | 14.20 | 39.40 | ||
| 26/09/2015 | 29/09/2015 | 15.80 | 38.30 | ||
Detailed results are presented in the following sections. In part 3.1, the results obtained during the winter of 2014-2015 are given. Section 3.2 is devoted to the spring of 2015. The study of the brood evolution is analyzed via graphic localization and by estimating the number of brood cells on each frame in the hive.
3.1 Winter temperature distribution in a hive
As already mentioned, throughout the winter, the maximum temperature in the hive remains above 30∘C in the small region where the queen is located. However, the temperature in other parts of the hive can be below 0∘C, as shown in table 1.
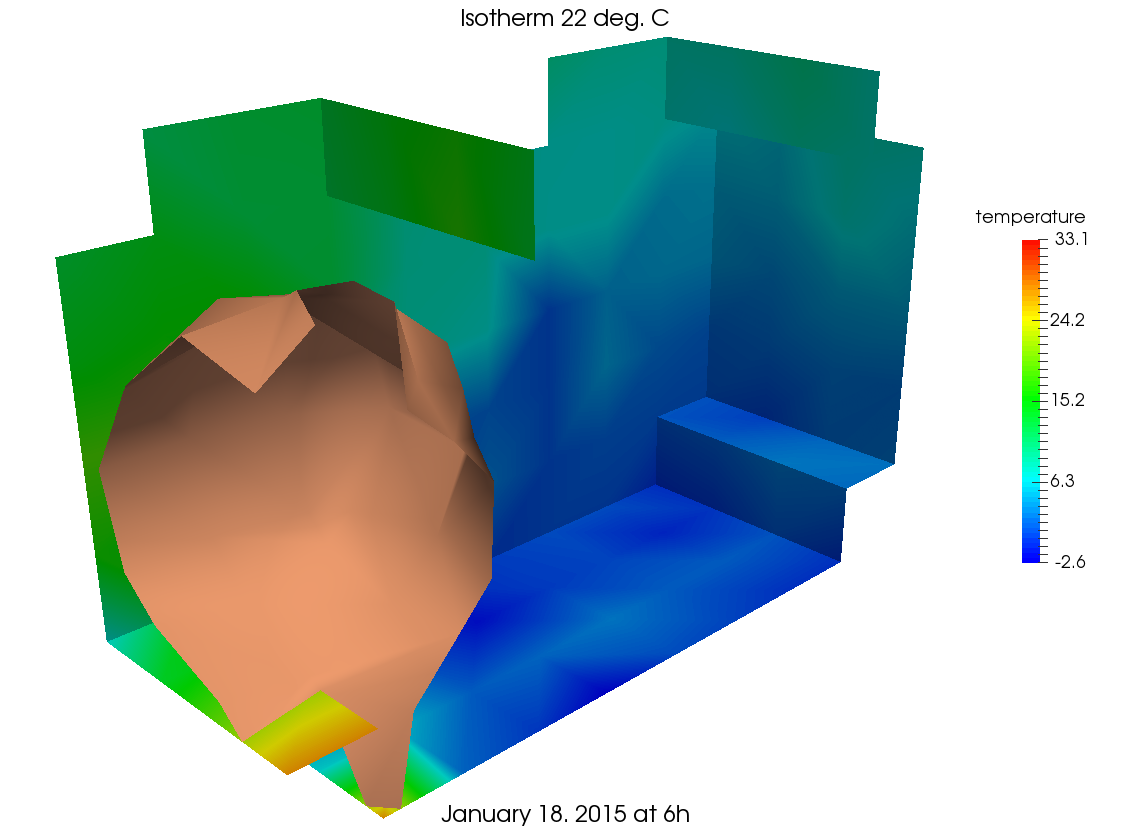
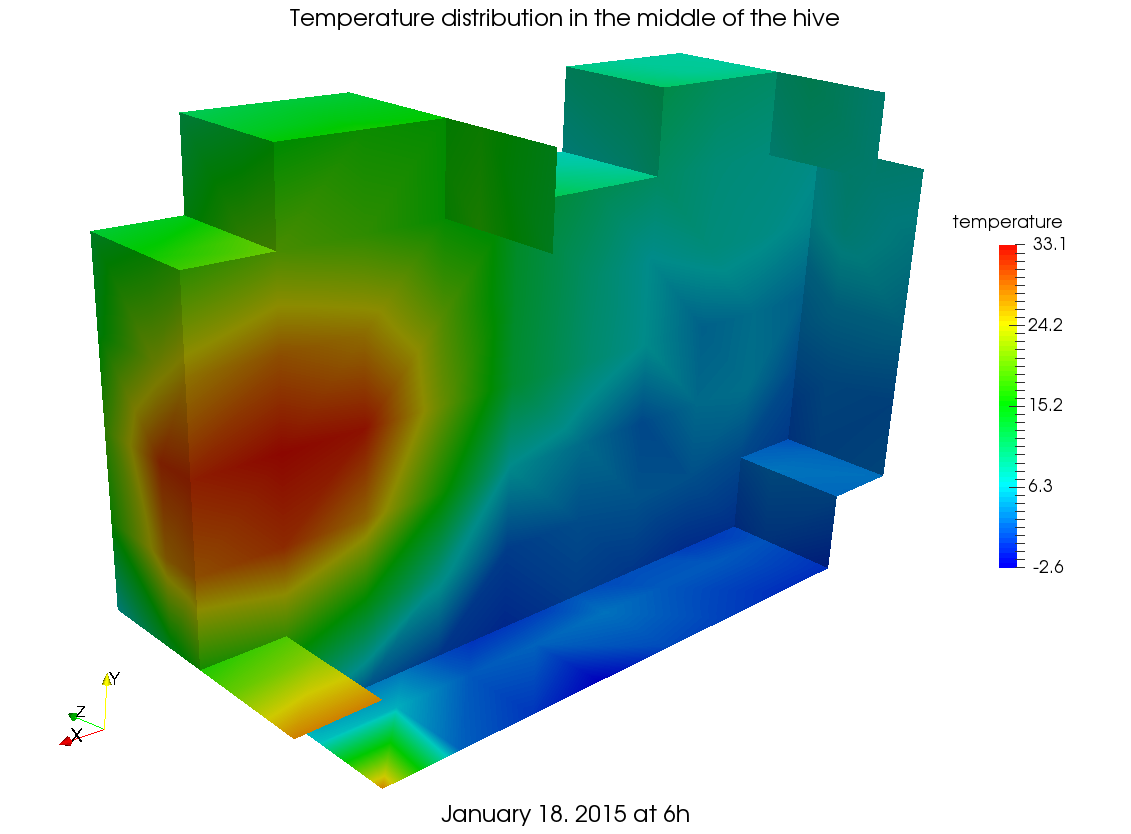
The three following figures show the temperature distributions in the hive on January 18, 2015 at 6 AM. Note that the temperature extrema in the hive are -2.6∘C and 33.1∘C. All the winter observations are similar to those presented below. As usual during winter, the bee cluster is located in the front of the hive.
Figure 5 shows the location of the 30∘C isotherm surface in the hive; the queen is located inside this surface.
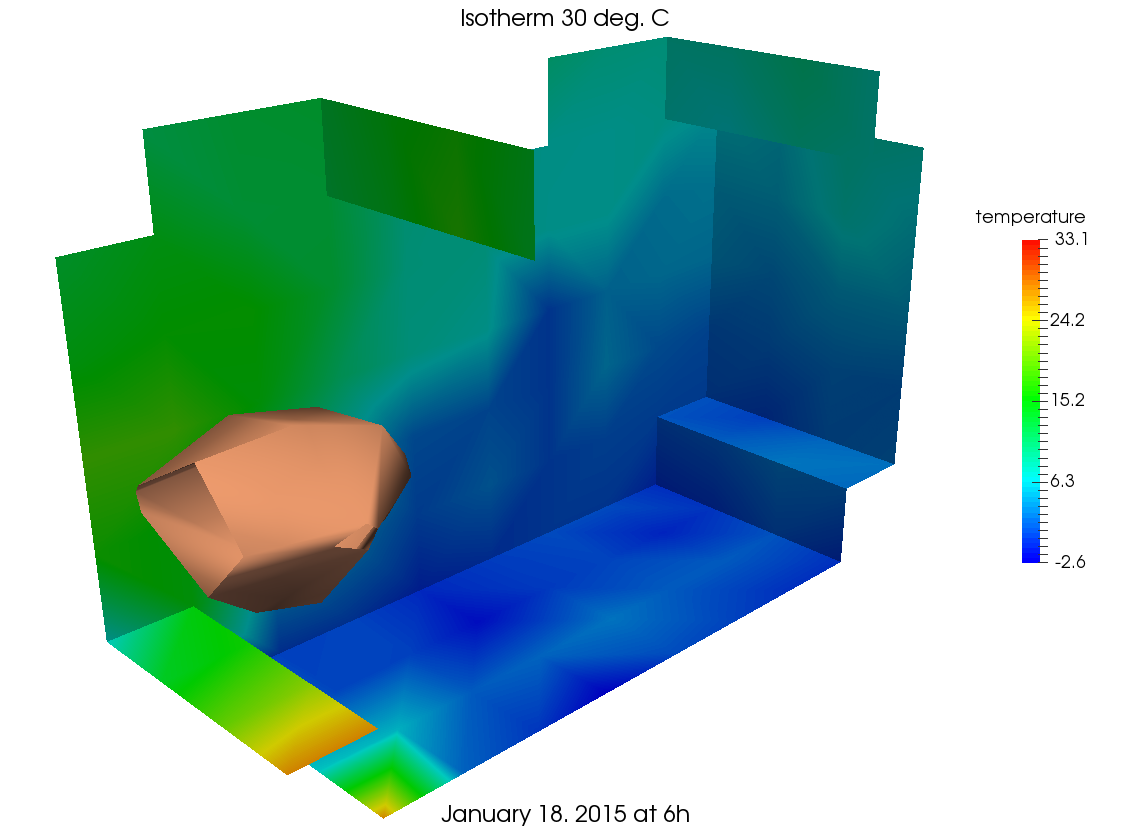
Figure 6 shows the 22∘C isotherm surface. The bee cluster is included in this surface.
Finally, Figure 7 shows the temperature distribution of a slice in the middle of the hive.
3.2 Brood development
Brood development in hives occurs in the spring. The Bee Cluster 3D system can be used to precisely follow this evolution via a graphical representation of the volume of the brood nest and by quantifying the number of brood cells on each frame.
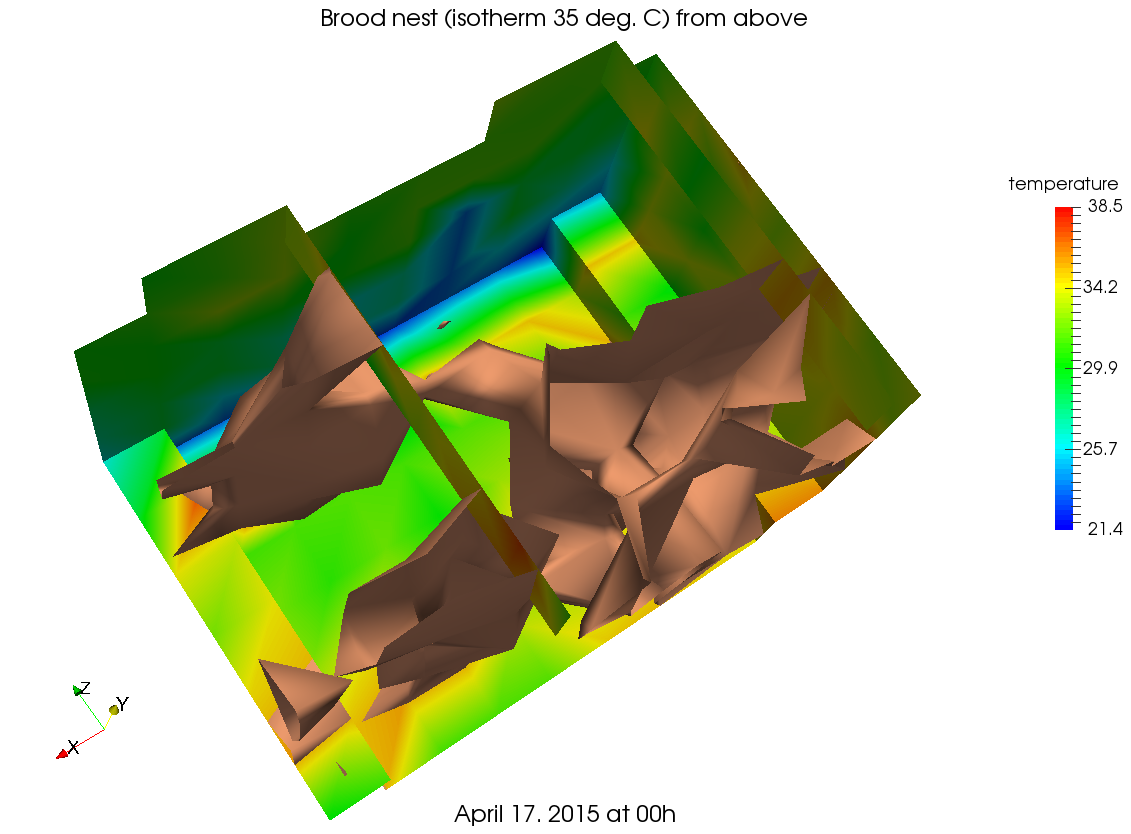
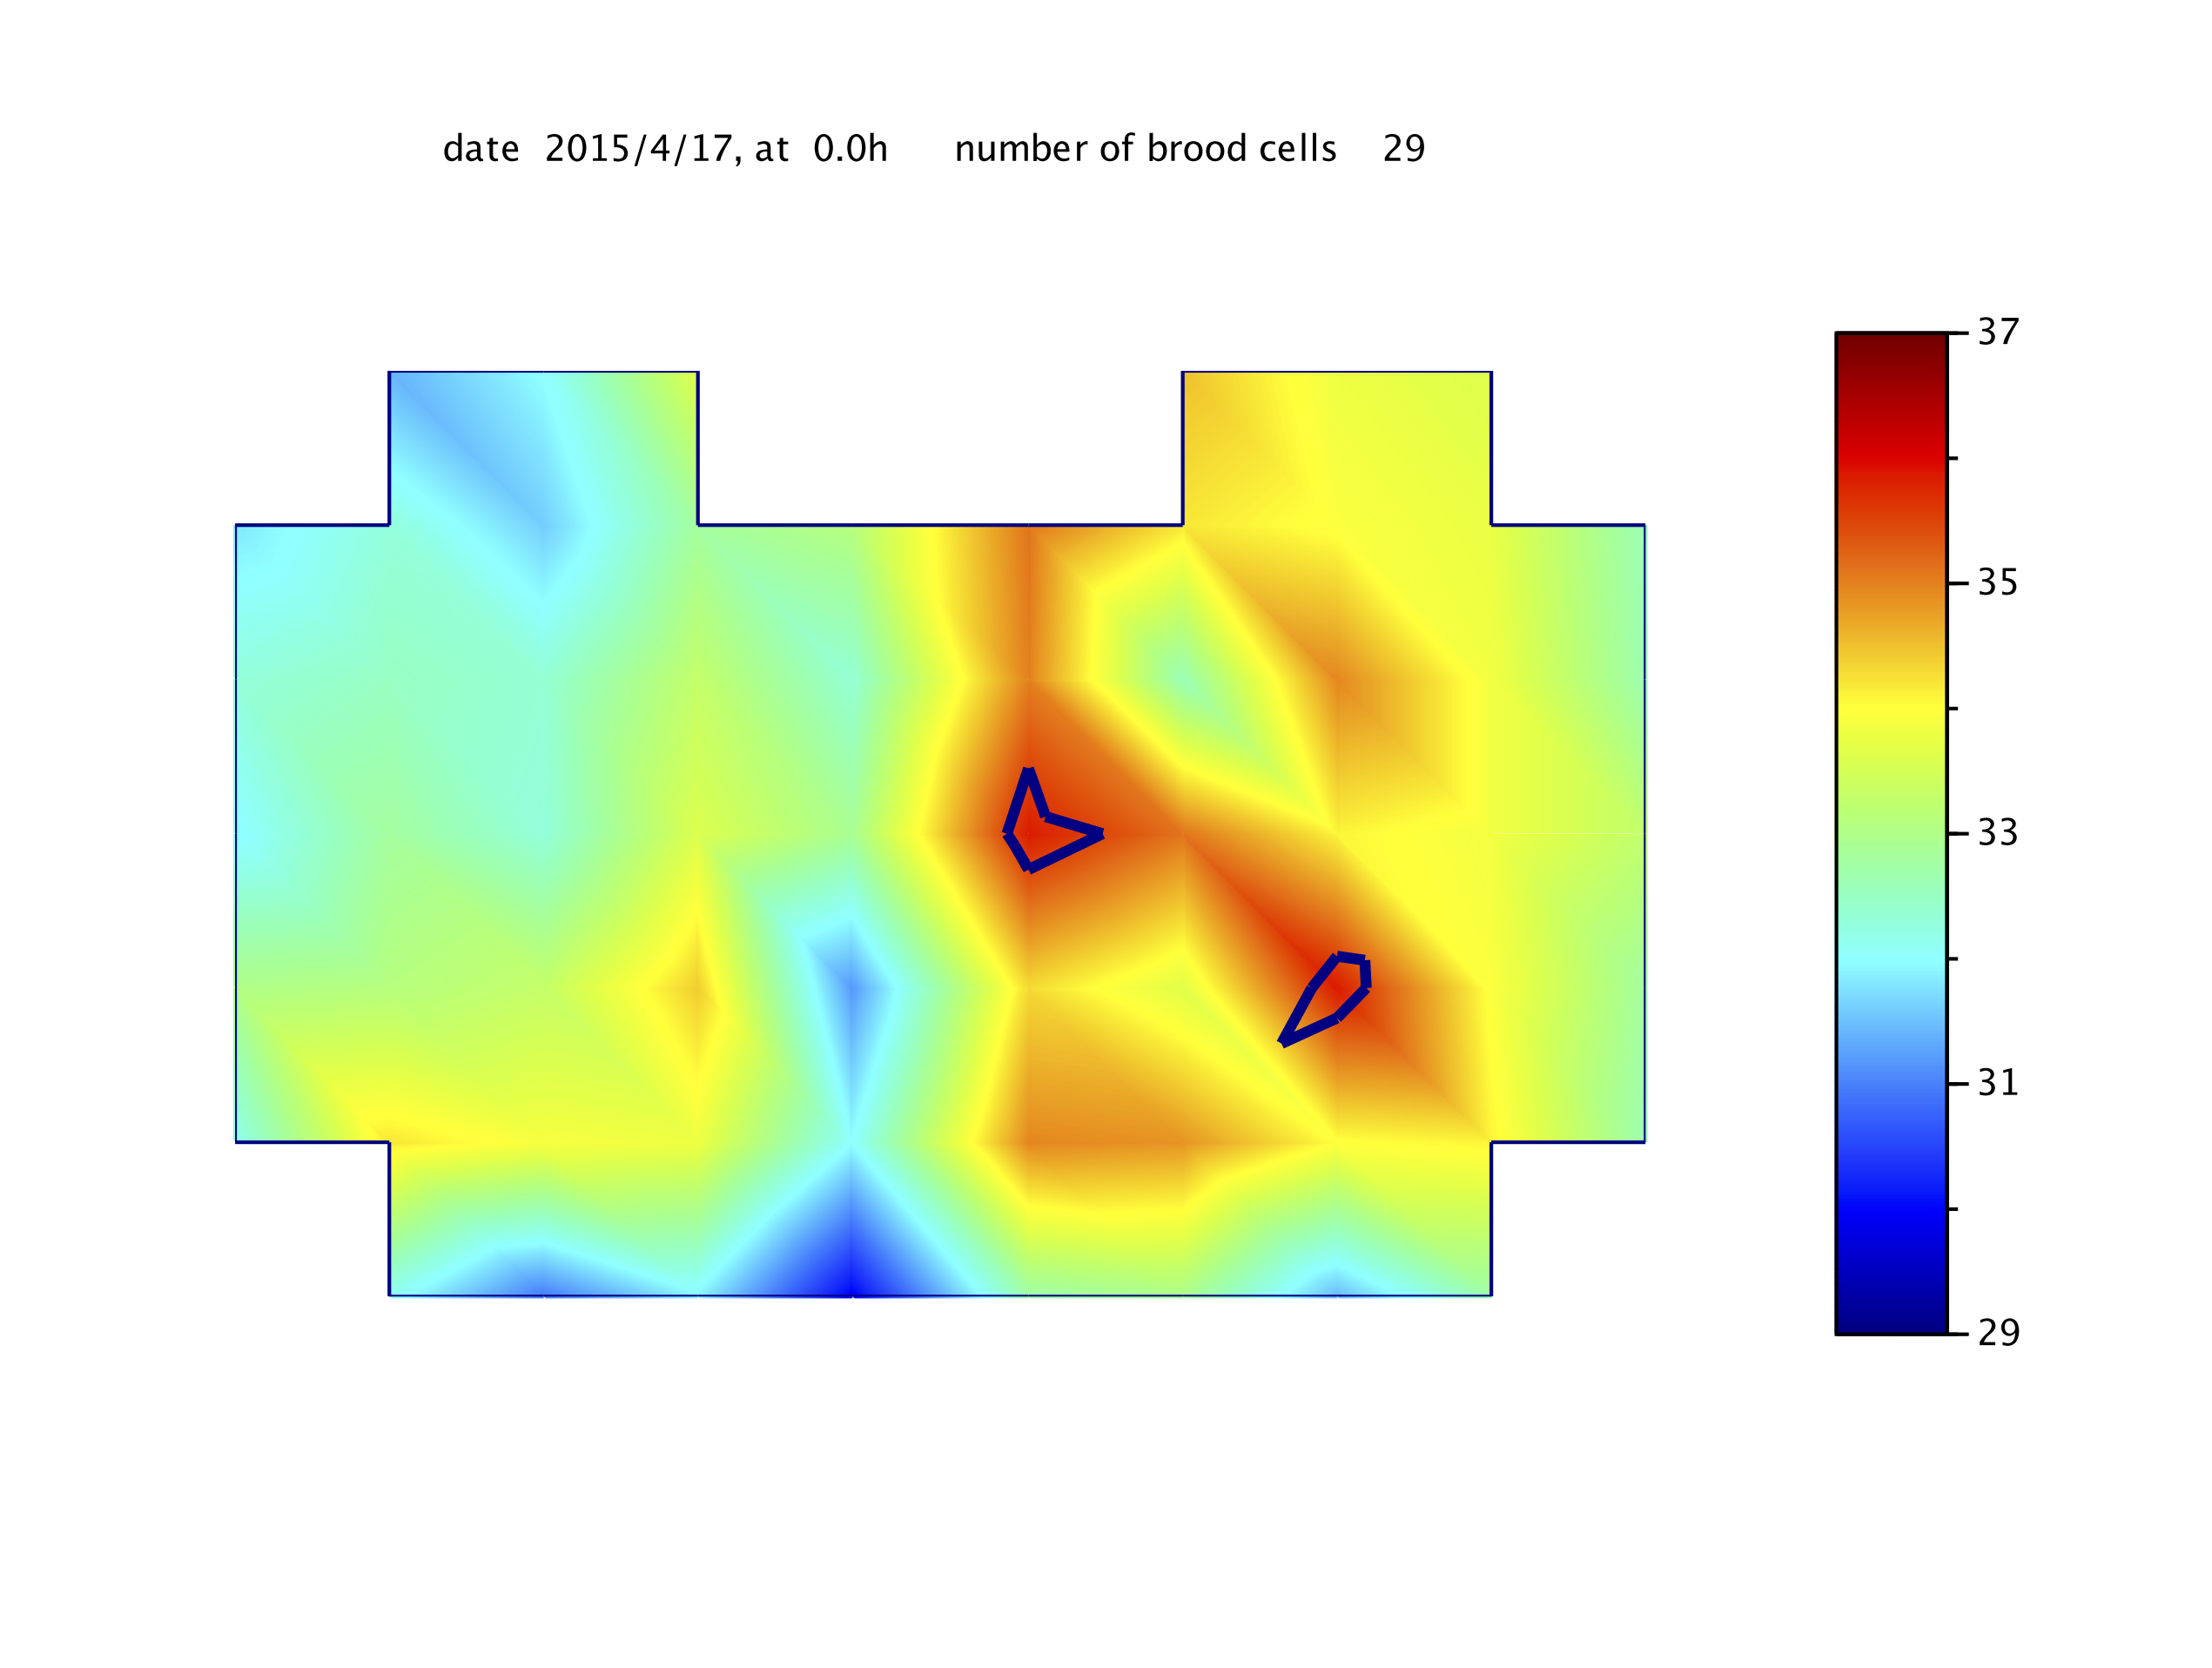
In this section, observations made on the hive equipped with the Bee Cluster 3D system are presented for April 17, 2015. During this period, the hive had seven frames, numbered 1 to 7.
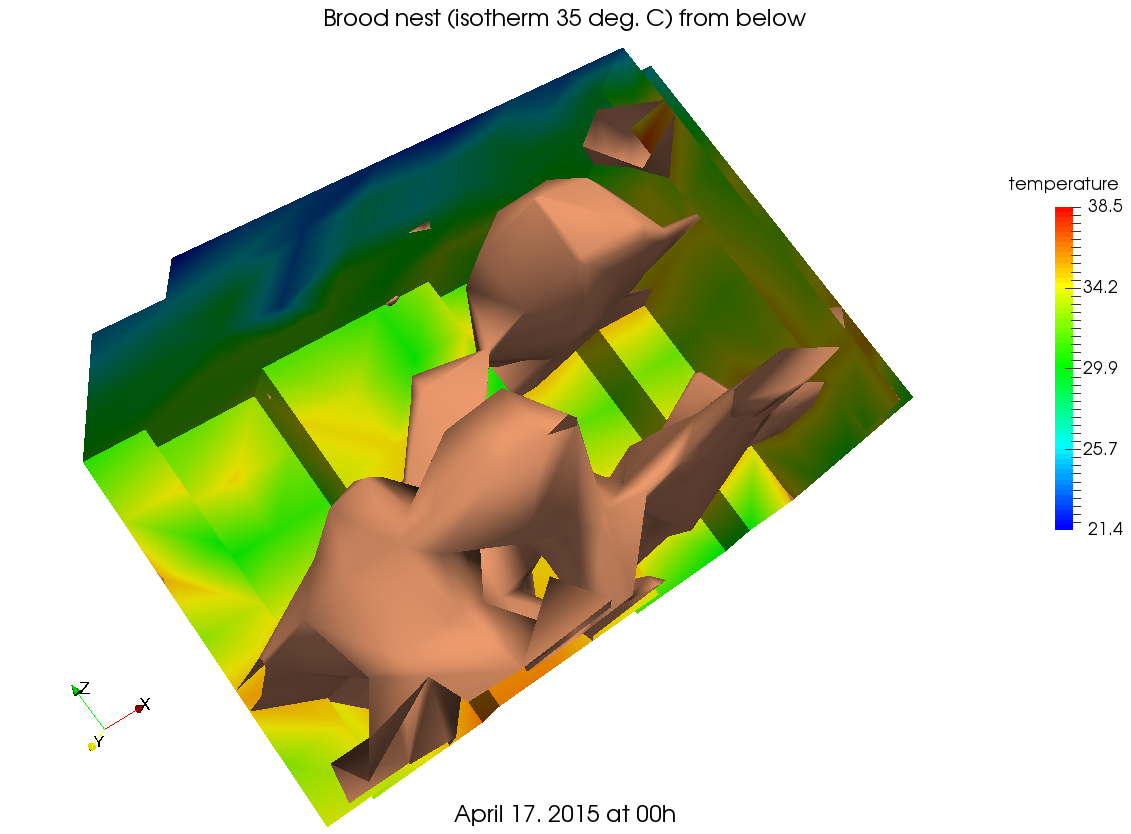
Figures 8 and 9 show images of the brood nest from above and below, respectively. These representations are the 35∘C isotherm surface in the hive.
As already mentioned, the total number of brood cells in the hive can be estimated in real time. For this process, the brood quantity on each frame is obtained along with an estimate of the area of the surface delimited by an C-isotherm curve, where is given by the user. Then, the number of brood cells is given by the formula
| (1) |
where is the number of cells, is the area occupied by the brood cells, and is the area of one cell. is given by
| (2) |
where is the diameter of the inscribed circle, and is the circumscribed circle of a cell. The factor in formula (1) accounts for the fact that a frame has two faces.
In the following examples, we use the following parameters:
-
•
-
•
The number of brood cells on each frame, calculated with the preceding method, is given in table 2.
| Frame | Number of brood cells |
| 1 | 890 |
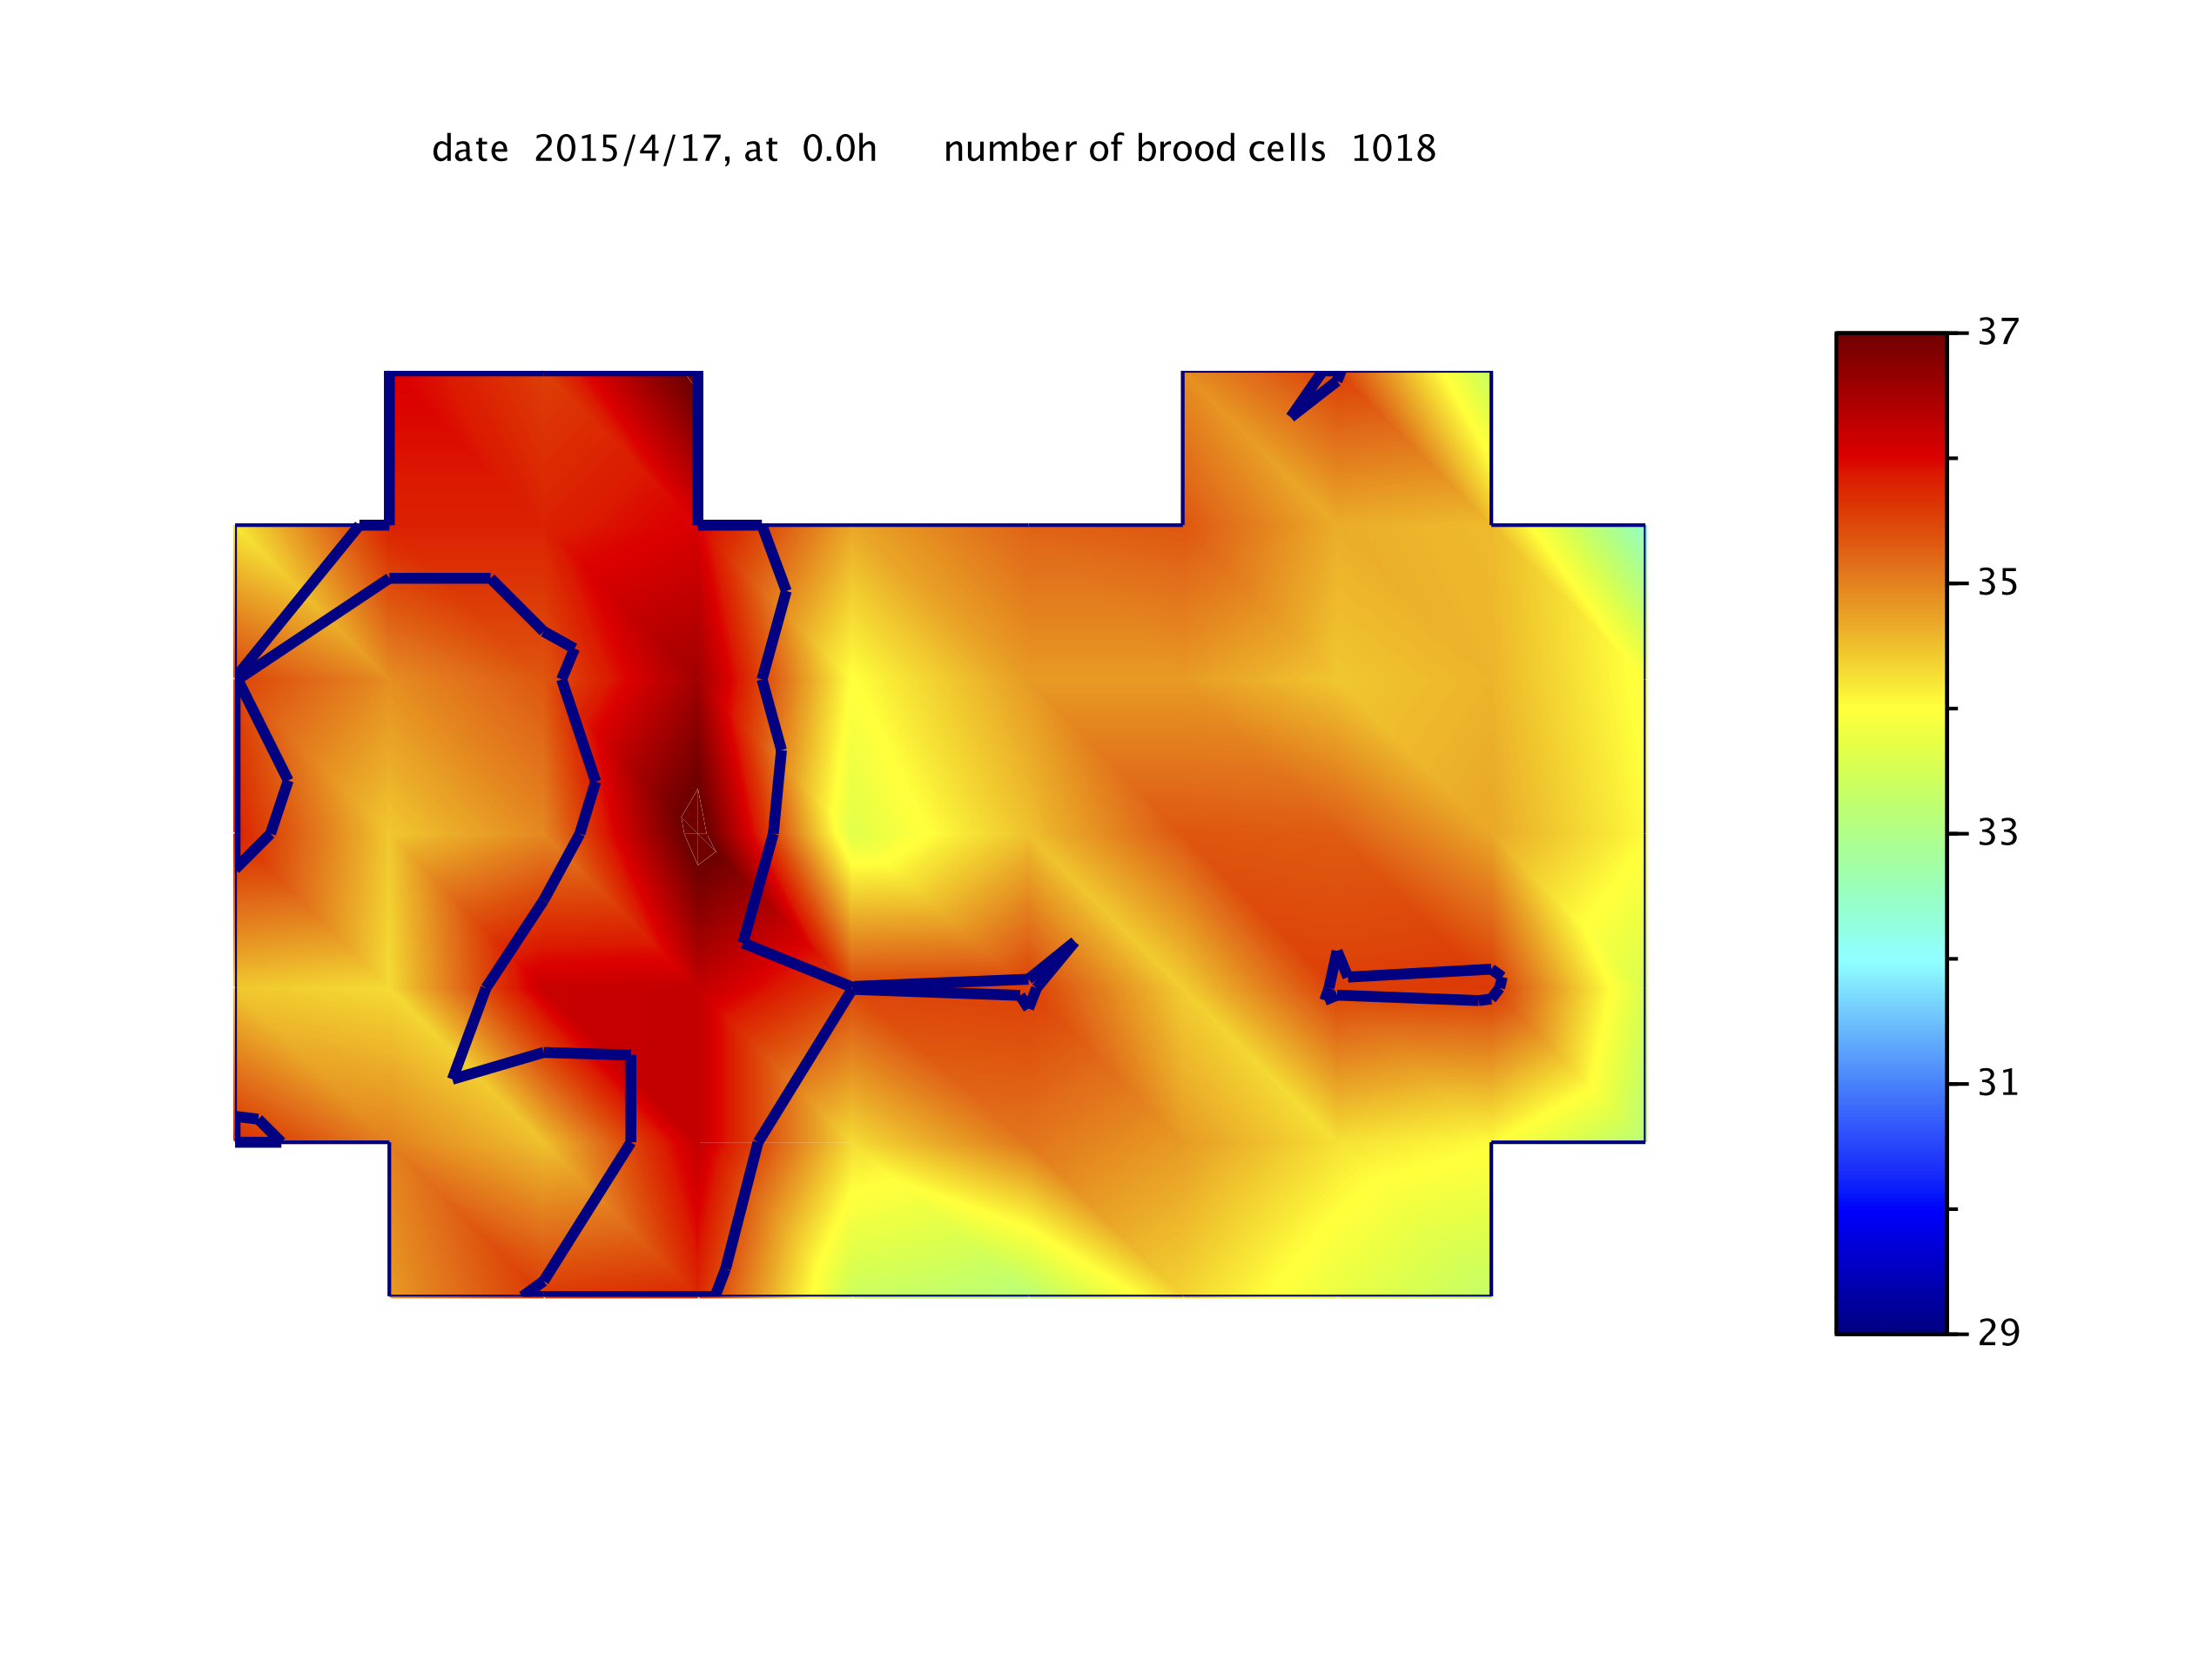
| 2 | 1018 |
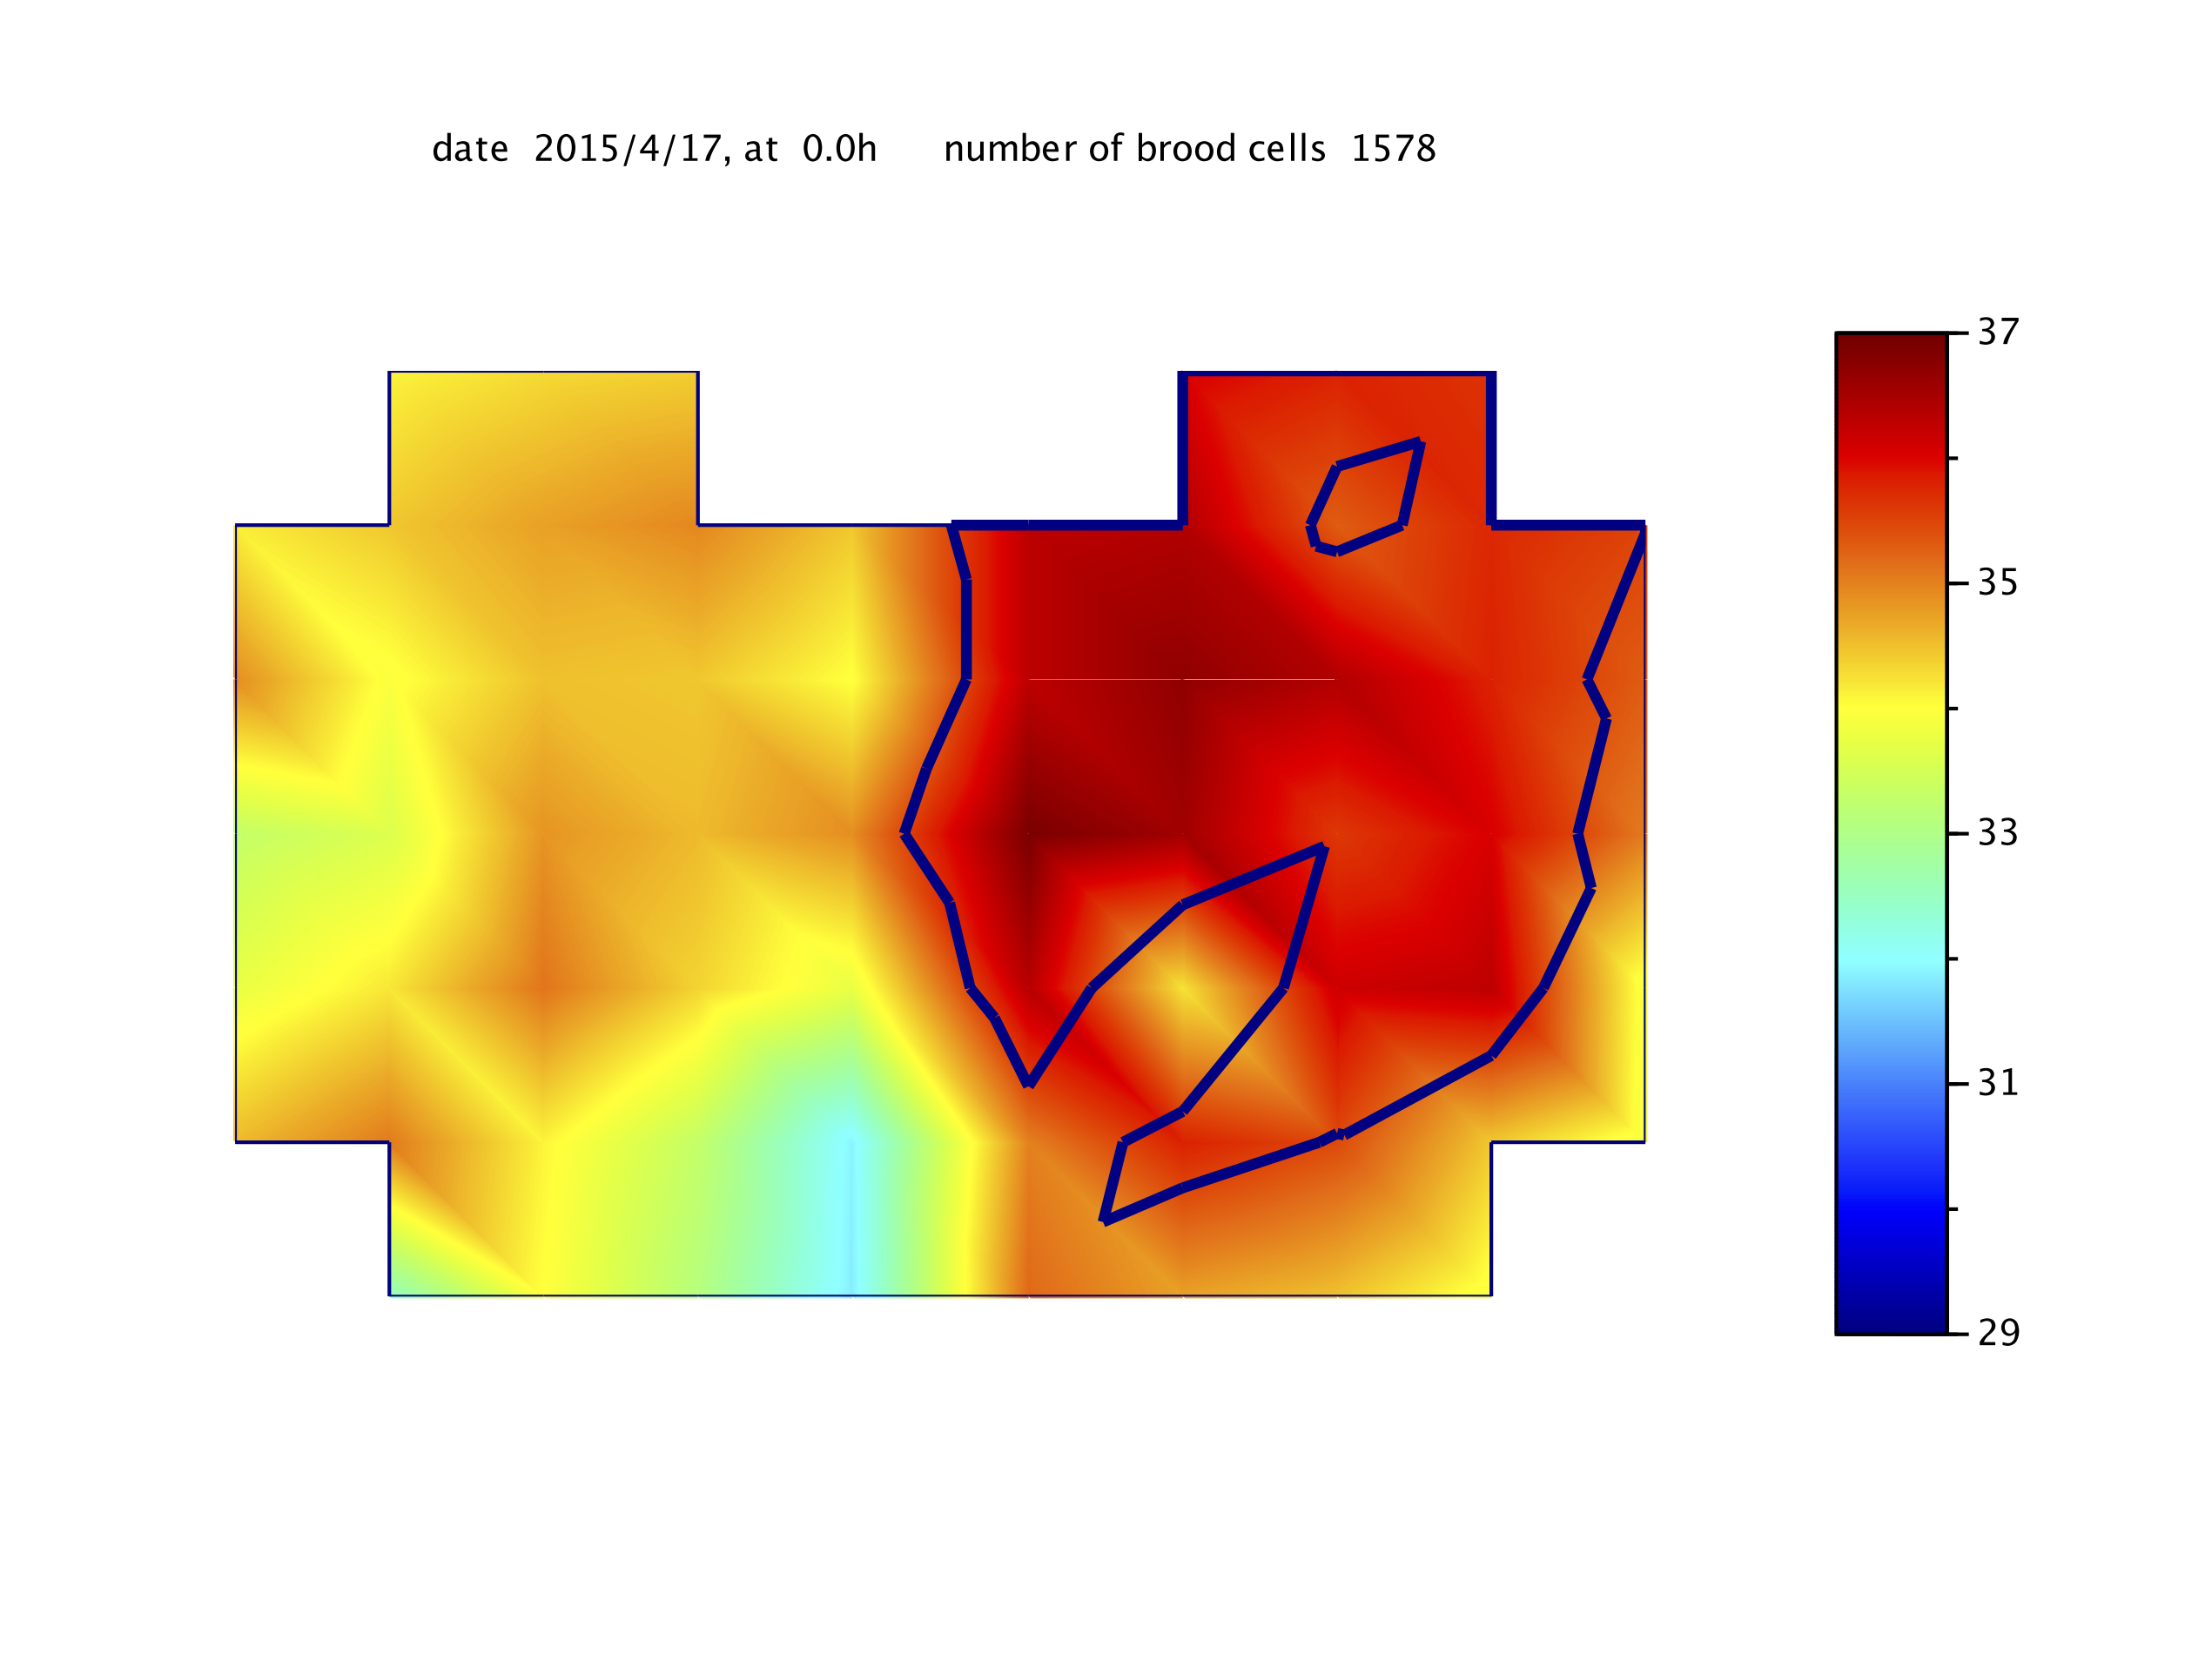
| 3 | 1578 |
| 4 | 29 |
| 5 | 550 |
| 6 | 0 |
| 7 | 0 |
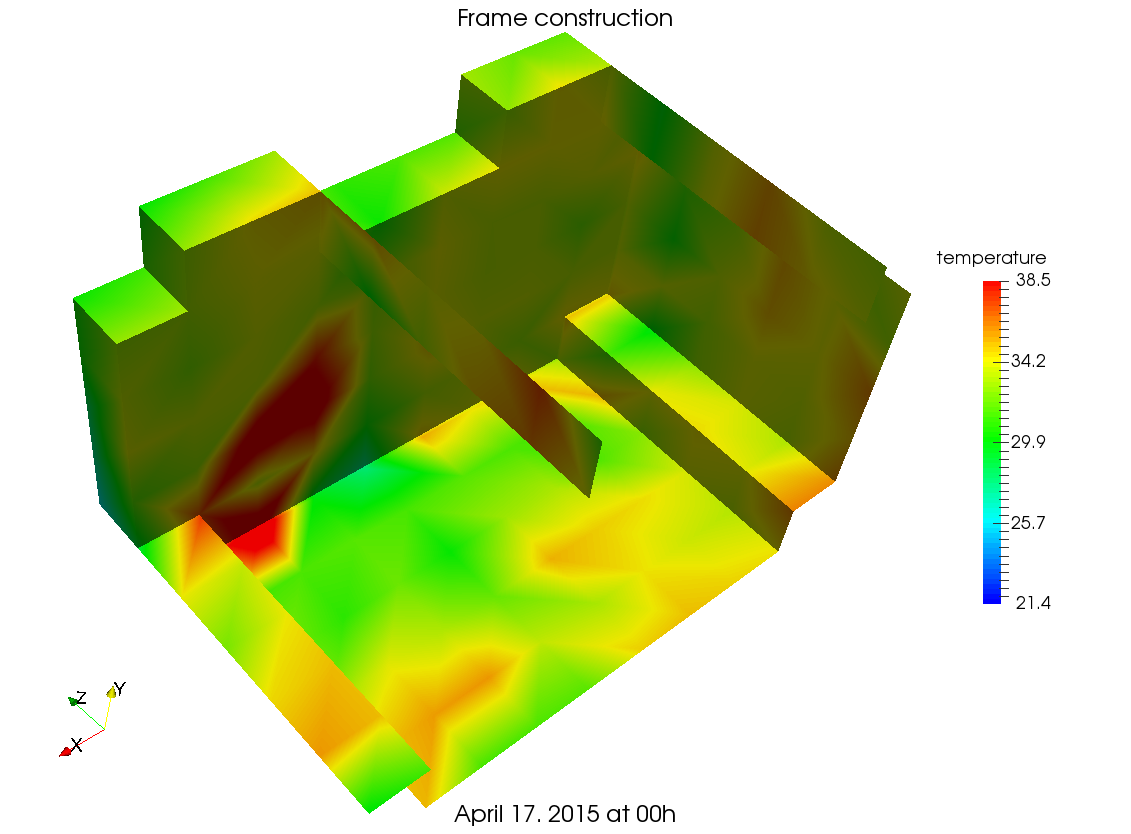
Note that frame 6 has no brood cells because this frame was introduced one day previously. Figure 10 shows the activity of the bees building this frame. Note that the maximum temperature on this frame is 42∘C.
The following figures show the temperature distributions on the frames and the 35.5∘C isotherm curve.

4 Conclusion
A new method to continuously monitor the temperature on the frames in a bee hive has been presented. The fine mesh on each frame gives a precise 3D representation of the temperature in the hive.
The main advantages of this Bee Cluster 3D system are the following.
-
•
The system is non-intrusive in the sense that it is not necessary to open the hive to perform measurements.
-
•
The system is non-invasive since the sensors merge into the the wax frame.
-
•
The information is transmitted in real time.
-
•
The system is energy self-sufficient and is designed for field use.
The presented innovation covers the development of a multi-sensor modular system integrated into a ”plug and play” architecture.
It can be used by any beekeeper because the equipped frames can be manipulated as normal.
Our results show that in a small region of the hive, the temperature remains above 30∘C throughout the winter, even if the external temperature is below 0∘C. The queen is located in this region.
The Bee Cluster 3D system also provides very useful information concerning the development of the brood nest.
The authors declare no conflicts of interest. This research did not receive any specific grant from funding agencies in the public, commercial, or not-for-profit sectors.
References
- Abou-Shaara et al. (2017) Abou-Shaara H.F. et al. (2017) A review of impacts of temperature and relative humidity on various activities of honey bees. Insect. Soc.; 64(4): 455–463.
- Barter (2016) Barter B. (2016) Measuring Hive Temperature as an Indication of Hive Health. Bee Certain, http://bee-certain.com/.
- Basile et al. (2008) Basile R. et al. (2008) Trophallactic activities in the honeybee brood nest – Heaters get supplied with high performance fuel. Zoology; 111: 433–441.
- Becher et al. (2009) Becher M.A., Moritz R.F.A. (2009) A new device for continuous temperature measurement in brood cells of honeybees (Apis mellifera). Apidologie 40: 577–584.
- Dunham (1931) Dunham W.E. (1931) Hive Temperatures for each Hour of a Day. The Ohio Journal of Science; 31(3): 181–188.
- Lensky (1964) Lensky Y. (1964) Les régulations thermiques dans la ruche en été. Ann. Abeille; 7(1): 23–45.
- Meikle et al. (2015) Meikle W.G., Holst N. (2015) Application of continuous monitoring of honeybee colonies. Apidologie 46: 10–22.
- Niewiatowski et al. (2016) Niewiatowski J. et al. (2016) Issues and Problems with Measuring the Temperature in the Hive. Challenges in Automation, Robotics and Measurement Techniques: Proceedings of AUTOMATION-2016, March 2-4, 2016, Warsaw, Poland. Springer International Publishing. Volume 440 of the series Advances in Intelligent Systems and Computing pp 797–805.
- Dietman et al. (2014) Dietman V. et al. (2014) L’apiculture - une fascination, Volume 2. Druckerei Appenzeller Volksfreund, SAR.
- Stalidzans et al. (2013) Stalidzans E., Berzonis A. (2013) Temperature changes above the upper hive body reveal the annual development periods of honey bee colonies. Computers and Electronics in Agriculture 90: 1–6.
- Tautz et al. (2007) Tautz J., Heilmann H.R. (2007) Phänomen Honigbiene. Springer Spektrum.