Statistical properties of the well deformed 153,155Sm nuclei and the scissors resonance
Abstract
The Nuclear Level Densities (NLDs) and the -ray Strength Functions (SFs) of 153,155Sm have been extracted from (d,p) coincidences using the Oslo method. The experimental NLD of 153Sm is higher than the NLD of 155Sm, in accordance with microscopic calculations. The SFs of 153,155Sm are in fair agreement with QRPA calculations based on the D1M Gogny interaction. An enhancement is observed in the SF for both 153,155Sm nuclei around 3 MeV in excitation energy and is attributed to the M1 Scissors Resonance (SR). Their integrated strengths were found to be in the range 1.3 — 2.1 and 4.4 — 6.4 for 153Sm and 155Sm, respectively. The strength of the SR for 155Sm is comparable to those for deformed even-even Sm isotopes from nuclear resonance fluorescence measurements, while that of 153Sm is lower than expected.
I Introduction
The stable samarium isotopic chain provides an excellent opportunity to systematically investigate the evolution of nuclear structure effects, from the semi-magic and near spherical 144Sm to the highly-deformed 154Sm isotope. As the nuclear shape changes, statistical quantities such as the Nuclear Level Density (NLD) and -ray Strength Function (SF) are expected to change and provide evolutionary information across the isotopic chain. Furthermore, the behavior of resonance modes, such as the Scissors Resonance (SR), Pygmy Dipole Resonance (PDR), and the Low-Energy Enhancement (LEE), can be tracked.
The strength of the SR is sensitive to the ground state deformation Richter (1990); Margraf et al. (1993); Goriely et al. (2016); Goriely and Plujko (2019). The SR was first predicted in 1978 by Lo Iudice and Palumbo Iudice and Palumbo (1978) before it was observed experimentally a few years later Bohle et al. (1984). Even-even nuclei were initially considered to be the best experimental candidates to exhibit strong SR modes. However, it soon became apparent that this mode should also present in odd-even and odd-odd systems, although its intensity may be fragmented significantly, making it more difficult to detect Enders et al. (1997); Heyde et al. (2010). Since then, many heavy deformed even-even and odd-mass rare-earth nuclei have been systematically investigated. So far, the SR mode has been experimentally observed in vibrational and rotational Heyde et al. (2010), as well as in -soft nuclei Linnemann et al. (2003); von Garrel et al. (2006) and has also been observed in the actinide region Margraf et al. (1990); Guttormsen et al. (2012, 2013, 2014); Tornyi et al. (2014); Laplace et al. (2016); Zeiser et al. (2019), as well as in the rare-earth mass region Voinov et al. (2001); Melby et al. (2001); Siem et al. (2002); Guttormsen et al. (2003); Krtička et al. (2004); Agvaanluvsan et al. (2004); Nyhus et al. (2010); Baramsai et al. (2015); Simon et al. (2016); Renstrøm et al. (2018); Goriely and Plujko (2019).
A range of different experimental techniques have been used to investigate the low-energy SR. These include ground state absorption experiments such as inelastic electron scattering Bohle et al. (1984), nuclear resonance fluorescence (NRF) Kneissl et al. (1996) and average resonance capture (ARC) Kopecky et al. (2017), as well as -decay experiments such as radiative neutron capture Krtička et al. (2004); Baramsai et al. (2015) and the Oslo method Schiller et al. (2000); Larsen et al. (2011), which extracts information from ion scattering or transfer reactions. In general, -decay experiments have yielded larger SR strengths than the ground state absorption experiments. Summaries of experimental techniques to measure SFs can be found in Goriely et al. Goriely et al. (2019).
Recent measurements of the SF in the actinides Guttormsen et al. (2012); Laplace et al. (2016); Tornyi et al. (2014) have uncovered that the SR exhibits a pronounced double-hump structure, seemingly independent of whether the nucleus has an even or odd number of neutrons. The splitting has also been observed, albeit weaker, in the transitional nucleus 181Ta Angell et al. (2016); Brits et al. (2019). It is suggested that the splitting of the SR may be due to the isovector spin-scissors mode Balbutsev et al. (2018), or due to triaxiality Iachello (1981). The splitting in the SR has not been reported for any of the rare-earth nuclei studied with the NRF technique Pietralla et al. (1998), with the Oslo method Voinov et al. (2001); Melby et al. (2001); Siem et al. (2002); Guttormsen et al. (2003); Agvaanluvsan et al. (2004); Nyhus et al. (2010); Simon et al. (2016); Renstrøm et al. (2018) or other techniques Krtička et al. (2004); Baramsai et al. (2015); Goriely and Plujko (2019).
The SFs of the isotopes 148,149Sm were measured, and analyzed with the Oslo method, almost two decades ago and a weak structure was identified to possibly be due to the SR, called a pygmy at the time Siem et al. (2002). With data already available on these two weakly deformed isotopes, together with the recent measurements of 151,153Sm Simon et al. (2016) (also analyzed with the Oslo method), it is interesting to extend the investigation towards more deformed Sm nuclei where the SR is expected to be more prominent.
In this paper, the measurement of the NLDs and SFs for the odd-even 153,155Sm extracted with the Oslo method from the 152,154Sm(d,p) reactions are reported. The integrated strength of the SR in both isotopes are extracted and compared to previous experimental data. In Sec. II the experimental setup is presented and Sec. III provides a brief overview of the Oslo method and the normalization procedures used, as well as the measured NLDs and SFs. Section IV investigates the presence of the SR in Sm isotopes and its integrated strength. Discussion follows in Sec. V and a brief summary in Sec. VI.
II Experimental Setup
Two experiments were performed at the Oslo Cyclotron Laboratory (OCL) at the University of Oslo using self-supporting 152Sm (enriched to 98.3%) and 154Sm (enriched to 98.7) targets with thicknesses of 2.9 and 3.2 mg/cm2, respectively. Deuteron beams of 13.5 MeV and 13 MeV were used to populate excited states in 153,155Sm. The SiRi particle telescope Guttormsen et al. (2011) and CACTUS scintillator Guttormsen et al. (1990) arrays were used to detect charged particles and -rays in coincidence.
The - SiRi particle-telescope consisted of eight 130 m thin, segmented silicon detectors and eight 1550 m thick silicon detectors. These were placed at backward angles to reduce detection of elastically scattered events and covered a polar angular range of with respect to the beam direction. The energy resolution, as determined from the elastic peaks, is 130 keV. The CACTUS array consisted of 26 and 24 NaI(Tl) detectors for the 153Sm and 155Sm measurements, respectively. The crystals were positioned 22 cm from the target, covering solid angles of 17 and 15 of sr, respectively. CACTUS has an energy resolution of 7 FWHM for a 1.332 MeV -ray transition.
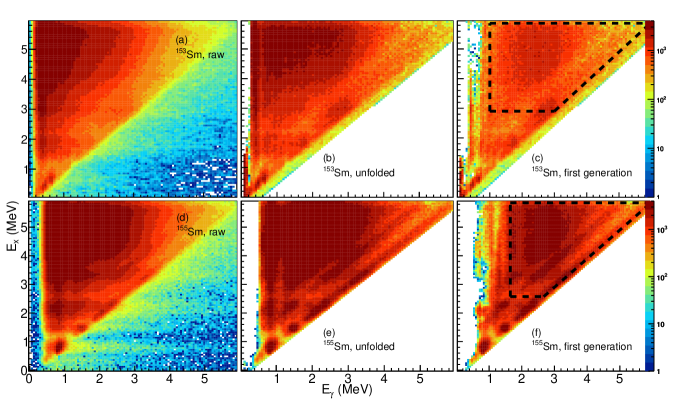
The detectors provided a start signal and the NaI(Tl) detectors a stop signal for the time-to-digital converters, enabling event-by-event sorting for the -particle coincidence data. Calibration of the SiRi and CACTUS detectors was achieved using distinct -ray transitions of 29Si obtained from 28Si(d,p) calibration runs which provided well-resolved particle and -ray peaks. During offline analysis, charged-particle- coincidence events were extracted within a prompt time gate of 20 ns. Equivalently wide time gates were used to remove the majority of randomly correlated events from the prompt particle- events. The excitation energy () versus -ray energy () matrices were constructed from the particle- coincidence events and are shown in Fig. 1 (a) and (d). The Oslo method Schiller et al. (2000); Larsen et al. (2011) is applied on these matrices to extract simultaneously the NLDs and the SFs up to the neutron-binding energies () through several iterative methods, discussed in the next section. The analysis in this work was performed using the Oslo method software version 1.1.2 Guttormsen et al. (2018).
III Data Analysis
III.1 The Oslo Method
The -ray spectra, extracted for each bin, were unfolded with the iterative procedure of Ref. Guttormsen et al. (1996) and then corrected for the known NaI(Tl) response functions remeasured in 2012 Campo et al. (2016), in order to obtain the full-energy -ray spectra. At this point, the first-generation -ray method Guttormsen et al. (1987) is used to extract the primary -rays from the decay cascades in each bin. The raw matrices (a) and (d), the unfolded matrices (b) and (e), and the resulting first generation -ray matrices (c) and (f), P(, ), are summarized in Fig. 1. The diagonals where = represent all direct decays to the ground state.
For 153Sm, the region used for extraction of the NLD and SF was from = 0.96 MeV to and including the = diagonal, and from = 2.88 MeV up to = 5.69 MeV. For 155Sm, the limits were from = 1.65 MeV to and including the = diagonal, and from = 2.49 MeV up to = 5.73 MeV. They were chosen to exclude regions characterized by discrete transitions at low excitation energies. The regions in Fig. 1 (c) and (f) that correspond to 1 MeV have low statistics due to over-subtraction of discrete and strong -ray transitions. This energy region is therefore also excluded from further analysis.
The NLDs and SFs of 153,155Sm were extracted simultaneously from the (,) matrix, using the ansatz Tveter et al. (1996); Midtbø et al. :
| (1) |
where is the level density at the final to which the nucleus decays. The parameter is the -ray transmission coefficient, and assuming the generalized Brink-Axel Hypothesis Brink (1957); Axel (1962), it is only dependent on the -ray energy. It is also assumed in Eq. (1) that the -decay pattern from any initial excitation energy is independent of whether the nucleus was populated into this excitation energy directly from a nuclear reaction or by -ray decays from higher-lying states Bohr and Mottelson (1969); Henden et al. (1995). A minimization is performed, between the experimental (,) and a theoretical (,) in which and are treated as free parameters Schiller et al. (2000):
| (2) |
The transformation parameters , and correspond to physical solutions and are deduced from external experimental data to get the solution to Eq. (1). At this point, the features in the NLDs and -ray transmission coefficients are fixed, except for the slopes and absolute values. Note that the resulting and functions do not depend on the initial parameters used in the iterative procedure.
III.2 Normalization of the NLDs
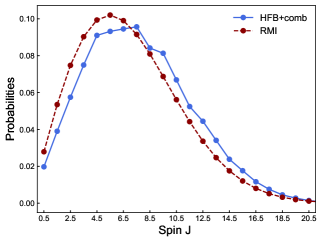
The extracted NLD is normalized to the known experimental discrete states NND (2019) at 1 MeV and extrapolated to the NLD, , at the neutron-binding energy (), determining its slope and absolute value. The level density is determined from the average wave neutron-resonance spacing Capote et al. (2009), using Eq. (28) of Ref. Schiller et al. (2000). The parameters used for the normalization are listed in Tab. 1. Due to the unavailability of experimental data on the spin and parity distribution at , the Rigid Moment of Inertia formula (RMI) which assumes equiparity von Egidy and Bucurescu (2006) and the Hartree-Fock-Bogoliubov plus Combinatorial (HFB+comb) Goriely et al. (2008) models were utilized to model the distributions. The RMI and HFB+comb spin distributions at are shown in Fig. 2 for 153Sm.
The HFB+comb model is a global microscopic approach to calculate the energy- and - dependent NLD Goriely et al. (2008). The HFB+comb model can be renormalized to match the known experimental discrete states and the average wave neutron-resonance spacing , as detailed in Ref. Goriely et al. (2008).
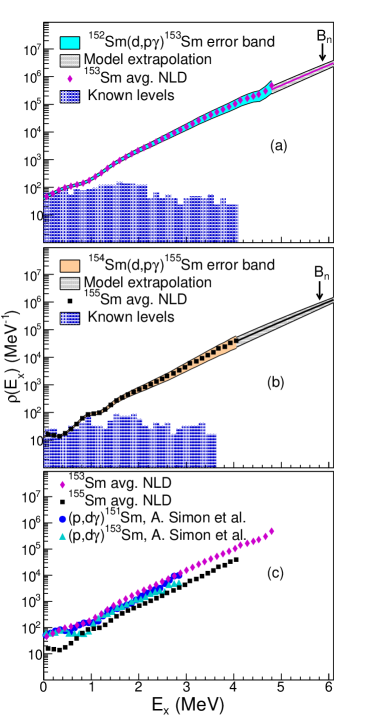
Figures 3 (a) and (b) present the extracted NLDs for 153,155Sm. At low the NLDs follow closely the experimental discrete states NND (2019). The NLD-bands represent the standard deviation of the level densities as a result of the statistical errors stemming from the Oslo method Schiller et al. (2000); Larsen et al. (2011), as well as systematic errors. The systematic errors take into account the variations of slope and absolute value due to normalizing using the HFB+comb (upper limit) and RMI (lower limit) as well as from varying within its uncertainties and varying a reduction factor which is used to scale the width of the spin distribution at . The data points in Fig. 3 (a) and (b) represent the average of the upper and lower limits with the statistical error bars. It is important to distinguish between statistical and systematic errors because the statistical errors are small and they limit the possibility of fluctuations between neighboring points. As can be seen in Fig. 3, the extracted experimental NLD is not available up to due to the exclusion of transitions below the Eγ-cutoff discussed in Sec. III.1. In order to bridge the gap between the highest data point and , an extrapolation is performed using the Fermi Gas (upper limit) Egidy et al. (1988); von Egidy and Bucurescu (2006) and Constant Temperature (lower limit) Ericson (1959); Gilbert and Cameron (1965) models.
In Fig. 3 (c) the NLDs of 153,155Sm are compared to the NLDs of (p,dSm from Ref. Simon et al. (2016) and are shown to be in reasonable agreement. Note that the level density is decreasing significantly from 153Sm to 155Sm. This will be discussed in Sec. V.
| Isotope | ||||||||||
|---|---|---|---|---|---|---|---|---|---|---|
| (MeV) | (MeV-1) | (MeV) | (MeV) | (eV) | (MeV-1) | (MeV-1) | (meV) | |||
| 153Sm | 5.868 | 18.5 | -0.66 | 0.57 | 6.0(6)a | 41.0(28)b | 1.77(36)a | 2.52(49) | 60.0c(37)d(110)e | |
| 155Sm | 5.807 | 18.0 | -0.56 | 0.55 | 6.1(6)a | 112(15)b | 0.66(16)a | 0.80(17) | 74c(11)d(13)e |
aCalculated with the rigid moment of inertia formula of von Egidy and Bucurescu von Egidy and Bucurescu (2006).
bTaken from Ref. Mughabghab (2018).
cWeighted average, , calculated from the resonances listed in Ref. Mughabghab (2018), using , where .
dUncertainty propagation calculated using .
eStandard deviation of the weighted average calculated using , where is the number of non-zero weights.
The (d,p) reaction may populate a limited spin range due to its low-angular momentum transfer. This again influences the primary -ray spectra . A slope correction of the SF might therefore be necessary in particular for sub-Coulomb barrier reactions Guttormsen et al. (2012, 2013, 2014); Tornyi et al. (2014); Laplace et al. (2016); Zeiser et al. (2019); Ingeberg et al. (2020). To verify whether such a correction is necessary, the distribution populated by the (d,p) reaction has been investigated with the statistical nuclear reaction code TALYS (v1.95) Koning and Rochman (2012) for the deuteron absorption compound reaction formation assuming isotropic emission. The non-elastic breakup, in which the neutron is absorbed by the target in a two-step (direct deuteron breakup + neutron absorption) mechanism has been investigated, as a function of the excitation energy of the residual nucleus following the Green’s function transfer formalism of Refs. Potel et al. (2015, 2017). The results indicate low non-elastic breakup cross sections ( 2 - 3 mb/sr MeV) for , and the deuteron-fusion proton-evaporation dominates, leading to a broad spin distribution. Therefore, the discrepancy in the populated spin range is considered small and no slope correction was performed.
III.3 Normalization of the SFs
The -ray transmission coefficient, , of multipolarity and electromagnetic character (electric, , or magnetic, ) is transformed to the total experimental SF through the relationship Capote et al. (2009):
| (3) |
assuming dominance of dipole transitions for statistical -ray decays. This assumption is strongly supported by data, see e.g. Ref. Kopecky and Chrien (1987). The absolute normalization parameter in Eq. (3) is determined using the experimental average total radiative width at . The corresponding parameters obtained and used for the normalization are summarized in Tab. 1. The value of was obtained by calculating the weighted average of the resonance widths listed in Ref. Mughabghab (2018).
Using the total average radiative width, the parameter is determined by Kopecky and Uhl (1990); Schiller et al. (2000):
| (4) |
where is the target spin (0 for 152,154Sm) and the function is the relative probability of a given spin at excitation energy . In order to calculate the integral in Eq. (4), a log-linear function for the SF is fitted for -energies between 0 and and from , where and represent -ray energies for the lowest and highest data point, respectively. For the RMI, a function approximating the spin distribution is implemented Bethe (1936); Ericson (1959):
| (5) |
with
| (6) |
where is the level density parameter, is the total back-shift parameter and the spin-cutoff parameter, , is a modeled variable related to the width of the distribution. However, in the HFB+comb model the explicit probability for each spin is given, as illustrated in Fig. 2. Therefore, the relevant spin probabilities required for Eq. (4) are directly obtained from the tables Koning and Rochman (2012), while correcting for the excitation-energy shift used to normalize the NLDs.
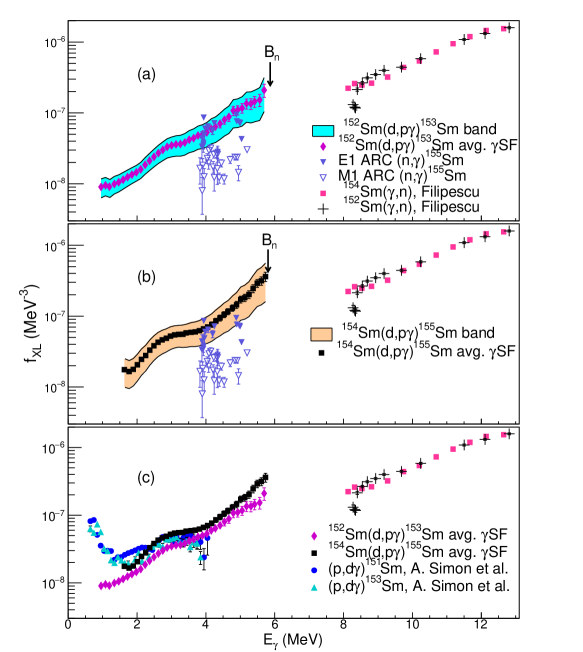
The extracted experimental SFs of 153,155Sm are shown in Fig. 4. As in the case of the NLDs, the SF-bands include both statistical and systematic errors. Here, the systematic errors also take into account the uncertainty of the parameter. The average of the limits and the statistical errors are shown as data points within the error bands. In Fig. 4, the 153,155Sm experimental SFs are compared to the experimental Giant Electric Dipole Resonance (GEDR) data from 152,154Sm(,n) photo-nuclear (-absorption) data Filipescu et al. (2014), as there is no GEDR data on 153,155Sm. The SFs from this work appear steep in comparison to the available GEDR data, possible explanations are discussed in Sec. V. The present data are further compared to and (n,)155Sm data measured in average resonance capture (ARC) experiments Kopecky et al. (2017). The cross sections are transformed to SFs using the relation Axel (1962):
| (7) |
where the factor = 8.674.
Finally, in Fig. 4 (c), the SFs of 153Sm and 155Sm are compared to each other as well as to the SFs of 151,153Sm from Ref. Simon et al. (2016). Several points of interest emerge from this comparison, such as the absolute value difference between the 153Sm and 155Sm from the current experiment. Previous measurements on close lying nuclei give consistently similar absolute values for the SFs. This apparent deviation is discussed in Sec. V. Comparing the results for 153Sm from Ref. Simon et al. (2016) and from the present work there are clear differences. Given that both data sets were analyzed using the Oslo method it is important to understand the differing features. Firstly, there seems to be a large discrepancy at -energies below 2 MeV, where the (p,dSm data indicate a strong LEE, while the (d,pSm keeps trending downward. Secondly, the SR appears to be significantly more pronounced in the (p,dSm data. This will be explored below after the strengths are extracted and compared.
IV The Scissors Resonance
Experiments using the Oslo method can only extract the SR built on excited states in the quasi-continuum, whereas NRF measurements can only extract SR built on the ground state. From the SF, the integrated reduced transition strength for magnetic dipole transitions, , is obtained by determining the shape of the resonance and numerically integrating over the distribution using the Standard Lorentzian Function (SLo) Brink (1957); Axel (1962); Capote et al. (2009), in the energy range relevant to the SR:
| (8) |
where the factor MeV2.
| Isotope | Deformation | Energy range | Ref. | Technique | ||
|---|---|---|---|---|---|---|
| AX | [MeV] | [MeV] | [] | |||
| 153Sm | 0.26 | Full Rangea | 2.89(0) | 1.27 — 2.13 | Present Exp. | Oslo method |
| 153Sm | 0.26 | 2.0 — 4.0 | 2.89(0) | 1.09 — 1.85 | Present Exp. | Oslo method |
| 155Sm | 0.27 | Full Rangea | 2.98(8) | 4.40 — 6.44 | Present Exp. | Oslo method |
| 155Sm | 0.27 | 2.0 — 4.0 | 2.98(8) | 3.58 — 5.30 | Present Exp. | Oslo method |
| 144Sm | 0.08 | 2.0 — 4.0 | 3.97(4) | 0.28(0) | Ziegler et al. Ziegler et al. (1990) | NRF |
| 148Sm | 0.18 | 2.0 — 4.0 | 3.07(3) | 0.51(1) | Ziegler et al. Ziegler et al. (1990) | NRF |
| 150Sm | 0.21 | 2.0 — 4.0 | 3.13(3) | 0.97(10) | Ziegler et al. Ziegler et al. (1990) | NRF |
| 151Sm | 0.22 | 0.0 — 5.0 | 3.00(2) | 7.80(340) | Simon et al. Simon et al. (2016) | Oslo method |
| 152Sm | 0.24 | 2.0 — 4.0 | 2.99(3) | 2.35(20) | Ziegler et al. Ziegler et al. (1990) | NRF |
| 153Sm | 0.26 | 0.0 — 5.0 | 3.00(2) | 7.80(200) | Simon et al. Simon et al. (2016) | Oslo method |
| 154Sm | 0.27 | 2.0 — 4.0 | 3.20(3) | 2.65(30) | Ziegler et al. Ziegler et al. (1990) | NRF |
aEquation 8 was integrated from 0 to 20 MeV. This equates to an unrestricted range, as including higher energies did not alter the tabulated value to a significant digit.
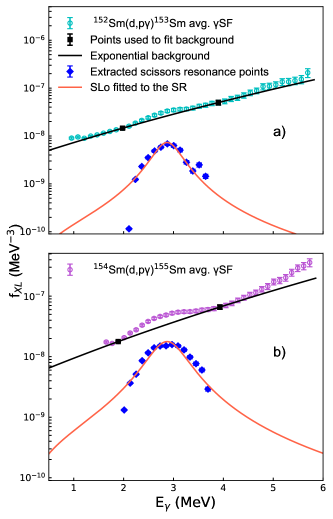
Several fitting methods were explored, such as including the GEDR data and fitting a collection of SLo peaks, or making a model of an exponential background plus one SLo-peak. However, none of the methods converged successfully and required many of the parameters to be fixed. Therefore a less sophisticated, but transparent method was chosen. To extract the strength of the SR an exponential function was fitted by two points in the experimental SFs, to approximate the background in the vicinity of the resonance, as shown in Fig. 5. It is deemed reasonable that the background is of exponential shape, as all conventional empirical models for the GEDR are of Lorentzian type, where the tail can be approximated by an exponential for a small energy interval. This background was then extracted from the data. An SLo was subsequently fitted to the extracted points, with statistical errors as weights in the fit. A fit was performed on the upper and lower limit of the SF, as well as for the average as shown in Fig. 5. The integrated was found numerically from Eq. (8), and the resulting strengths are listed in Tab. 2. Due to the extraction method, a range of the SR strength is given instead of a recommended value with uncertainties. The energy centroid is consistent across the different fits and is also given with its small uncertainties in Tab. 2.
V Discussion
In the current experiments, the NLD and SF of the deformed even-odd 155Sm below , were measured for the first time, as well as that of 153Sm in the energy range 4 MeV.
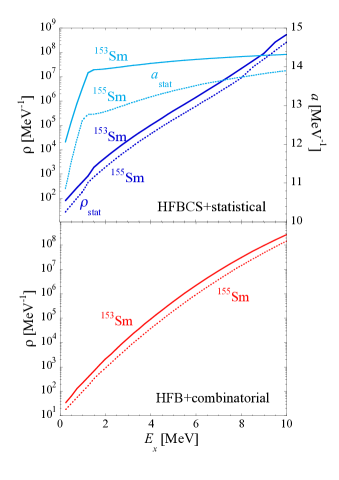
It is interesting to note in Fig. 3 (c) that even though the 153,155Sm NLDs have similar slopes, the 153Sm level density is higher than that of 155Sm, which is counter-intuitive. As more neutrons are added and deformation increases, it may be expected that there should be more levels in 155Sm compared to 153Sm. The same behavior has also been observed in neodymium isotopes Ay et al. (2016); Guttormsen et al. (2020) where the lighter, spherical or less deformed isotopes exhibit higher NLDs than the more deformed, heavier isotopes. This phenomenon is consistent with the microscopic description of the NLDs obtained within the combinatorial (HFB+combinatorial) Goriely et al. (2008) and statistical (HFBCS+statistical) Demetriou and Goriely (2001) models which are compared to the experimental data for the even-odd 153,155Sm isotopes, in Fig. 6.
The same feature of a lower NLD for 155Sm is seen to be predicted by both microscopic models. Also shown in Fig. 6 are the energy-dependent level density parameters obtained within the microscopic statistical approach Demetriou and Goriely (2001). The parameter is a measure of the single-particle level density at the Fermi surface and is consequently sensitive to shell and pairing effects. The difference between 153Sm and 155Sm NLDs is essentially due to stronger shell plus pairing effects in 155Sm in comparison with 153Sm leading to a smaller single-particle level density in 155Sm at the Fermi energy. This structure effect is also found in the ground-state microscopic energy predicted by most macroscopic-microscopic mass models Wender (2000); Möller et al. (2016) which give a maximum microscopic energy within the Sm neighboring isotopes for and a lower value for 155Sm compared to 153Sm.
The 153,155Sm SFs show pronounced strength, which is localized at mean excitation energies of about MeV, a feature observed in most deformed rare-earth nuclei. The analytical technique used to extract the SFs, the Oslo method Schiller et al. (2000); Larsen et al. (2011), cannot reveal fine structures in the -spectra. However, the observed resonances at 3 MeV are believed to be due to the 1 SR, which is consistent with other observations in this mass region. High resolution measurements (see Ref. Heyde et al. (2010) and references therein) have shown that these resonances are due to 1 transitions between high- orbitals and dominated by states when excited directly from a ground state Richter (1990). The increase in the integrated SR strength from 153Sm to 155Sm is not entirely consistent with previous experimental findings and theoretical descriptions Heyde et al. (2010). Considering that the deformation is comparable for the two nuclei the strengths should be comparable as well. A possible explanation might be that the reported calculated deformation for 155Sm is underestimated and therefore an experiment to measure both 153,155Sm deformation is highly desirable.
In contrast to what was observed for the actinides Guttormsen et al. (2012); Tornyi et al. (2014); Laplace et al. (2016), the SR in the odd-even rare-earth 153,155Sm SF does not exhibit any double-hump structure.
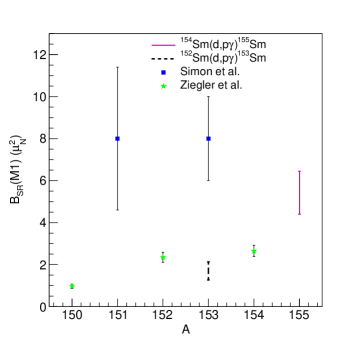
Fig. 7 compares the present integrated with the experimental NRF values and those of Ref. Simon et al. (2016) extracted with the Oslo method analysis. Given the comparable deformation parameters in Tab. 2, the for (d,pSm is in reasonable agreement with the measurements of Ziegler et al. Ziegler et al. (1990) on 152,154Sm when extracted over the same energy region, while the for (d,pSm is lower than that of the neighbouring nuclei. Also the for (d,pSm is in excellent agreement with measurements of the other rare-earth nuclei extracted with the Oslo Method Voinov et al. (2001); Melby et al. (2001); Siem et al. (2002); Guttormsen et al. (2003); Agvaanluvsan et al. (2004); Nyhus et al. (2010); Simon et al. (2016); Renstrøm et al. (2018). The results for 151,153Sm Simon et al. (2016) (also listed in Tab. 2) are significantly higher than those from both the 150,152,154Sm NRF values and the present measurements.
This follows predictably from the discussion in Sec. (III.3) where the SR appears much more pronounced in the SFs of (p,dSm data. To explain this, and the LEE discrepancy, it is important to highlight the differences in the analyses performed. One difference between how the two data sets were analyzed is the region of extraction of the NLDs and SFs from the primary -ray matrices, as the (p,dSm data were extracted for as low as 0.645 MeV and from = 2.525 MeV to = 4.045 MeV. Depending on the statistical nature of the nucleus at these energies, the resulting SFs might be inconsistent. There might also be some residual transitions at low -energies in the primary -ray matrices for the (p,d)153Sm data that lead to the differences in the SFs below 2 MeV. Importantly, the approaches for extracting the SR are different, for (p,dSm a fit for the energy region Eγ = 0 - 11 MeV is performed. Lastly, the highest data points for the SFs of (p,dSm have high uncertainties and are located at -energies which could give the appearance of a large SR and depending on the reliability of the last data points, the slopes could be in sharp contrast.
In previous measurements, the has proven to be less fragmented and stronger in even-even nuclei than in even-odd nuclei Heyde et al. (2010); Pietralla et al. (1998). The strength seen in (,’) experiment for odd-even cases can differ to a great extent. However, the unobserved strength can be estimated from a fluctuation analysis of the data, see Ref. Enders et al. (1997). If this is taken into account, the same accumulated strengths as in the even-even cases and the same dependence on deformation is found. Different types of experiments and theoretical calculations that extract the over the same energy region, yield similar strengths as shown for Dy isotopes Renstrøm et al. (2018). The present 155Sm measurement is in reasonable agreement whereas 153Sm appears to contract these findings. When the extraction performed here is limited by the same integration limits in Eq. (8), the 153Sm value is found to be significantly lower (higher limit of 1.9 ) than measurements of the other rare-earth nuclei extracted with the Oslo Method Renstrøm et al. (2018) and that of the neighboring even-even deformed 154Sm isotope of Ref. Ziegler et al. (1990).
A steep increase in the SF of 155Sm above MeV might be an indication of a PDR. This excessive strength is also observed in the SF of 153Sm, as shown in Fig. 5. However, it is not possible to determine the electromagnetic nature of the resonance from Oslo method-type experiments and therefore information from other experiments such as NRF Kneissl et al. (1996) or inelastic proton scattering measurements Tamii et al. (2009); Neveling et al. (2011) is crucial. The LEE is not seen in the SFs of 153,155Sm for the energy range under investigation. This may be due to the current experimental conditions, which limit the extraction of useful data below 1 and 1.6 MeV, respectively. This is in contrast to the (d,p)151,153Sm data shown in Fig. 4.
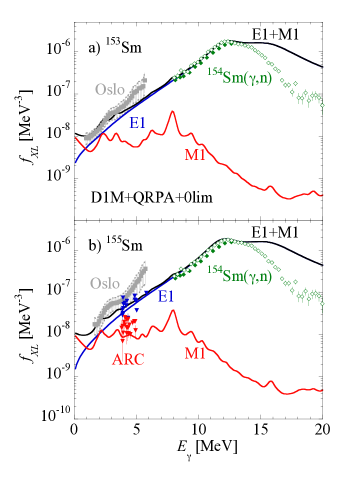
Finally, we compare in Fig. 8 the D1M+QRPA+0lim , and SF with available experimental data, i.e. the present Oslo data, ARC data known separately for and strengths in 155Sm, and the SF extracted from photoneutron cross section of the neighboring 154Sm isotope. The D1M+QRPA+0lim model corresponds to axially deformed Gogny-HFB plus quasi-particle random phase approximation (QRPA) predictions obtained with the D1M interaction. The model has been complemented by phenomenological shell-model-inspired and LEE contributions to describe the de-excitation strength function Goriely et al. (2018, 2019). As seen in Fig. 8, the D1M+QRPA+0lim predictions are in rather good agreement with data, especially for 153Sm. In the 155Sm case, the total calculated SF remains somewhat lower than the one found with the Oslo method though the agreement with ARC data is good. For both Sm isotopes, the large SF around 5 MeV cannot be explained by the D1M+QRPA+0lim model. Due to the phenomenological inclusion of an LEE, the D1M+QRPA+0lim model can reproduce rather well the low-energy points found by the Oslo method below and around 2 MeV.
VI Summary
The NLD and the SF of the deformed even-odd 153,155Sm have been measured with the reaction (d,p) below at the Oslo Cyclotron Laboratory (OCL) using the Oslo method. A pronounced resonance, the SR, was observed for both nuclei. The SR integrated strengths, in 153,155Sm were determined to be in the range 1.3 — 2.1 and 4.4 — 6.4 , respectively. These values are comparable to those of neighboring nuclei for 155Sm and somewhat smaller in 153Sm.
The experimental NLD of 153Sm is found by the Oslo method to be larger than that of 155Sm, a counter-intuitive pattern that is confirmed by microscopic models and explained by stronger pairing plus shell effects in 155Sm. QRPA calculations based on the D1M Gogny interaction are also found to predict the 153,155Sm SF in fairly good agreement with the Oslo data, though the large strength around 5 MeV is not be described by the model.
Acknowledgments
The authors thank the cyclotron team at the University of Oslo for providing high-quality experimental conditions. This work is based on the research supported in part by the National Research Foundation of South Africa (Grant No. 118846, 92600, 90741 and 92789) and by the IAEA under Research Contract 20454. This work was partially supported by the Fonds de la Recherche Scientifique - FNRS, the Fonds Wetenschappelijk Onderzoek - Vlaanderen (FWO) under the EOS Project No O022818F and the U.S. Department of Energy under Contract DE-AC52-07NA27344. The authors gratefully acknowledge funding from the Research Council of Norway (NFR) project grant No. 263030 (A.G., S.S., F.Z. and V.W.I.), project grant No. 262952 (G.M.T.) and by the Deutsche Forschungsgemeinschaft (DFG) under Grant No. SFB 1245, project ID 279384907 (P.v.N.-C.). A.C.L. gratefully acknowledges support by the European Research Council through ERC-STG-2014 under grant agreement No. 637686.
References
References
- Richter (1990) A. Richter, Nuclear Physics A 507, 99 (1990).
- Margraf et al. (1993) J. Margraf, R. D. Heil, U. Kneissl, U. Maier, H. H. Pitz, H. Friedrichs, S. Lindenstruth, B. Schlitt, C. Wesselborg, P. von Brentano, R.-D. Herzberg, and A. Zilges, Physical Review C 47, 1474 (1993).
- Goriely et al. (2016) S. Goriely, S. Hilaire, S. Péru, M. Martini, I. Deloncle, and F. Lechaftois, Physical Review C 94 (2016), 10.1103/physrevc.94.044306.
- Goriely and Plujko (2019) S. Goriely and V. Plujko, Physical Review C 99 (2019), 10.1103/physrevc.99.014303.
- Iudice and Palumbo (1978) N. L. Iudice and F. Palumbo, Physical Review Letters 41, 1532 (1978).
- Bohle et al. (1984) D. Bohle, A. Richter, W. Steffen, A. Dieperink, N. L. Iudice, F. Palumbo, and O. Scholten, Physics Letters B 137, 27 (1984).
- Enders et al. (1997) J. Enders, N. Huxel, P. von Neumann-Cosel, and A. Richter, Physical Review Letters 79, 2010 (1997).
- Heyde et al. (2010) K. Heyde, P. von Neumann-Cosel, and A. Richter, Reviews of Modern Physics 82, 2365 (2010).
- Linnemann et al. (2003) A. Linnemann, P. von Brentano, J. Eberth, J. Enders, A. Fitzler, C. Fransen, E. Guliyev, R.-D. Herzberg, L. Käubler, A. Kuliev, P. von Neumann-Cosel, N. Pietralla, H. Prade, A. Richter, R. Schwengner, H. Thomas, D. Weisshaar, and I. Wiedenhöver, Physics Letters B 554, 15 (2003).
- von Garrel et al. (2006) H. von Garrel, P. von Brentano, C. Fransen, G. Friessner, N. Hollmann, J. Jolie, F. Käppeler, L. Käubler, U. Kneissl, C. Kohstall, L. Kostov, A. Linnemann, D. Mücher, N. Pietralla, H. H. Pitz, G. Rusev, M. Scheck, K. D. Schilling, C. Scholl, R. Schwengner, F. Stedile, S. Walter, V. Werner, and K. Wisshak, Physical Review C 73 (2006), 10.1103/physrevc.73.054315.
- Margraf et al. (1990) J. Margraf, A. Degener, H. Friedrichs, R. D. Heil, A. Jung, U. Kneissl, S. Lindenstruth, H. H. Pitz, H. Schacht, U. Seemann, R. Stock, C. Wesselborg, P. von Brentano, and A. Zilges, Physical Review C 42, 771 (1990).
- Guttormsen et al. (2012) M. Guttormsen, L. A. Bernstein, A. Bürger, A. Görgen, F. Gunsing, T. W. Hagen, A. C. Larsen, T. Renstrøm, S. Siem, M. Wiedeking, and J. N. Wilson, Physical Review Letters 109 (2012), 10.1103/physrevlett.109.162503.
- Guttormsen et al. (2013) M. Guttormsen, B. Jurado, J. N. Wilson, M. Aiche, L. A. Bernstein, Q. Ducasse, F. Giacoppo, A. Görgen, F. Gunsing, T. W. Hagen, A. C. Larsen, M. Lebois, B. Leniau, T. Renstrøm, S. J. Rose, S. Siem, T. Tornyi, G. M. Tveten, and M. Wiedeking, Physical Review C 88 (2013), 10.1103/physrevc.88.024307.
- Guttormsen et al. (2014) M. Guttormsen, L. A. Bernstein, A. Görgen, B. Jurado, S. Siem, M. Aiche, Q. Ducasse, F. Giacoppo, F. Gunsing, T. W. Hagen, A. C. Larsen, M. Lebois, B. Leniau, T. Renstrøm, S. J. Rose, T. G. Tornyi, G. M. Tveten, M. Wiedeking, and J. N. Wilson, Physical Review C 89 (2014), 10.1103/physrevc.89.014302.
- Tornyi et al. (2014) T. G. Tornyi, M. Guttormsen, T. K. Eriksen, A. Görgen, F. Giacoppo, T. W. Hagen, A. Krasznahorkay, A. C. Larsen, T. Renstrøm, S. J. Rose, S. Siem, and G. M. Tveten, Physical Review C 89 (2014), 10.1103/physrevc.89.044323.
- Laplace et al. (2016) T. A. Laplace, F. Zeiser, M. Guttormsen, A. C. Larsen, D. L. Bleuel, L. A. Bernstein, B. L. Goldblum, S. Siem, F. L. B. Garotte, J. A. Brown, L. C. Campo, T. K. Eriksen, F. Giacoppo, A. Görgen, K. Hadynska-Klek, R. A. Henderson, M. Klintefjord, M. Lebois, T. Renstrøm, S. J. Rose, E. Sahin, T. G. Tornyi, G. M. Tveten, A. Voinov, M. Wiedeking, J. N. Wilson, and W. Younes, Physical Review C 93 (2016), 10.1103/physrevc.93.014323.
- Zeiser et al. (2019) F. Zeiser, G. M. Tveten, G. Potel, A. C. Larsen, M. Guttormsen, T. A. Laplace, S. Siem, D. L. Bleuel, B. L. Goldblum, L. A. Bernstein, F. L. B. Garrote, L. C. Campo, T. K. Eriksen, A. Görgen, K. Hadynska-Klek, V. W. Ingeberg, J. E. Midtbø, E. Sahin, T. Tornyi, A. Voinov, M. Wiedeking, and J. Wilson, Physical Review C 100 (2019), 10.1103/physrevc.100.024305.
- Voinov et al. (2001) A. Voinov, M. Guttormsen, E. Melby, J. Rekstad, A. Schiller, and S. Siem, Physical Review C 63 (2001), 10.1103/physrevc.63.044313.
- Melby et al. (2001) E. Melby, M. Guttormsen, J. Rekstad, A. Schiller, S. Siem, and A. Voinov, Physical Review C 63 (2001), 10.1103/physrevc.63.044309.
- Siem et al. (2002) S. Siem, M. Guttormsen, K. Ingeberg, E. Melby, J. Rekstad, A. Schiller, and A. Voinov, Physical Review C 65 (2002), 10.1103/physrevc.65.044318.
- Guttormsen et al. (2003) M. Guttormsen, A. Bagheri, R. Chankova, J. Rekstad, S. Siem, A. Schiller, and A. Voinov, Physical Review C 68 (2003), 10.1103/physrevc.68.064306.
- Krtička et al. (2004) M. Krtička, F. Bečvář, J. Honzátko, I. Tomandl, M. Heil, F. Käppeler, R. Reifarth, F. Voss, and K. Wisshak, Physical Review Letters 92 (2004), 10.1103/physrevlett.92.172501.
- Agvaanluvsan et al. (2004) U. Agvaanluvsan, A. Schiller, J. A. Becker, L. A. Bernstein, P. E. Garrett, M. Guttormsen, G. E. Mitchell, J. Rekstad, S. Siem, A. Voinov, and W. Younes, Physical Review C 70 (2004), 10.1103/physrevc.70.054611.
- Nyhus et al. (2010) H. T. Nyhus, S. Siem, M. Guttormsen, A. C. Larsen, A. Bürger, N. U. H. Syed, G. M. Tveten, and A. Voinov, Physical Review C 81 (2010), 10.1103/physrevc.81.024325.
- Baramsai et al. (2015) B. Baramsai, F. Bečvář, T. Bredeweg, R. Haight, M. Jandel, J. Kroll, M. Krtička, G. Mitchell, J. O’Donnell, R. Rundberg, J. Ullmann, S. Valenta, and J. B. Wilhelmy, EPJ Web of Conferences 93, 01037 (2015).
- Simon et al. (2016) A. Simon, M. Guttormsen, A. C. Larsen, C. W. Beausang, P. Humby, J. T. Burke, R. J. Casperson, R. O. Hughes, T. J. Ross, J. M. Allmond, R. Chyzh, M. Dag, J. Koglin, E. McCleskey, M. McCleskey, S. Ota, and A. Saastamoinen, Physical Review C 93 (2016), 10.1103/physrevc.93.034303.
- Renstrøm et al. (2018) T. Renstrøm, H. Utsunomiya, H. T. Nyhus, A. C. Larsen, M. Guttormsen, G. M. Tveten, D. M. Filipescu, I. Gheorghe, S. Goriely, S. Hilaire, Y.-W. Lui, J. E. Midtbø, S. Péru, T. Shima, S. Siem, and O. Tesileanu, Physical Review C 98 (2018), 10.1103/physrevc.98.054310.
- Kneissl et al. (1996) U. Kneissl, H. Pitz, and A. Zilges, Progress in Particle and Nuclear Physics 37, 349 (1996).
- Kopecky et al. (2017) J. Kopecky, S. Goriely, S. Péru, S. Hilaire, and M. Martini, Physical Review C 95 (2017), 10.1103/physrevc.95.054317.
- Schiller et al. (2000) A. Schiller, L. Bergholt, M. Guttormsen, E. Melby, J. Rekstad, and S. Siem, Nuclear Instruments and Methods in Physics Research Section A: Accelerators, Spectrometers, Detectors and Associated Equipment 447, 498 (2000).
- Larsen et al. (2011) A. C. Larsen, M. Guttormsen, M. Krtička, E. Běták, A. Bürger, A. Görgen, H. T. Nyhus, J. Rekstad, A. Schiller, S. Siem, H. K. Toft, G. M. Tveten, A. V. Voinov, and K. Wikan, Physical Review C 83 (2011), 10.1103/physrevc.83.034315.
- Goriely et al. (2019) S. Goriely, P. Dimitriou, M. Wiedeking, T. Belgya, R. Firestone, J. Kopecky, M. Krtička, V. Plujko, R. Schwengner, S. Siem, H. Utsunomiya, S. Hilaire, S. Péru, Y. S. Cho, D. M. Filipescu, N. Iwamoto, T. Kawano, V. Varlamov, and R. Xu, The European Physical Journal A 55 (2019), 10.1140/epja/i2019-12840-1.
- Angell et al. (2016) C. Angell, R. Hajima, T. Shizuma, B. Ludewigt, and B. Quiter, Physical Review Letters 117 (2016), 10.1103/physrevlett.117.142501.
- Brits et al. (2019) C. P. Brits, K. L. Malatji, M. Wiedeking, B. V. Kheswa, S. Goriely, F. L. B. Garrote, D. L. Bleuel, F. Giacoppo, A. Görgen, M. Guttormsen, K. Hadynska-Klek, T. W. Hagen, S. Hilaire, V. W. Ingeberg, H. Jia, M. Klintefjord, A. C. Larsen, S. N. T. Majola, P. Papka, S. Péru, B. Qi, T. Renstrøm, S. J. Rose, E. Sahin, S. Siem, G. M. Tveten, and F. Zeiser, Physical Review C 99 (2019), 10.1103/physrevc.99.054330.
- Balbutsev et al. (2018) E. B. Balbutsev, I. V. Molodtsova, and P. Schuck, Physical Review C 97 (2018), 10.1103/physrevc.97.044316.
- Iachello (1981) F. Iachello, Nuclear Physics A 358, 89 (1981).
- Pietralla et al. (1998) N. Pietralla, P. von Brentano, R.-D. Herzberg, U. Kneissl, N. L. Iudice, H. Maser, H. H. Pitz, and A. Zilges, Physical Review C 58, 184 (1998).
- Guttormsen et al. (2011) M. Guttormsen, A. Bürger, T. Hansen, and N. Lietaer, Nuclear Instruments and Methods in Physics Research Section A: Accelerators, Spectrometers, Detectors and Associated Equipment 648, 168 (2011).
- Guttormsen et al. (1990) M. Guttormsen, A. Atac, G. Løvhøiden, S. Messelt, T. Ramsøy, J. Rekstad, T. F. Thorsteinsen, T. S. Tveter, and Z. Zelazny, Physica Scripta T32, 54 (1990).
- Guttormsen et al. (2018) M. Guttormsen, F. Zeiser, J. E. Midtbø, Vetle W. Ingeberg, and Ann-Cecilie Larsen, “oslocyclotronlab/oslo-method-software: Oslo method v1.1.2,” (2018).
- Guttormsen et al. (1996) M. Guttormsen, T. Tveter, L. Bergholt, F. Ingebretsen, and J. Rekstad, Nuclear Instruments and Methods in Physics Research Section A: Accelerators, Spectrometers, Detectors and Associated Equipment 374, 371 (1996).
- Campo et al. (2016) L. C. Campo, F. L. B. Garrote, T. K. Eriksen, A. Görgen, M. Guttormsen, K. Hadynska-Klek, M. Klintefjord, A. C. Larsen, T. Renstrøm, E. Sahin, S. Siem, A. Springer, T. G. Tornyi, and G. M. Tveten, Physical Review C 94 (2016), 10.1103/physrevc.94.044321.
- Guttormsen et al. (1987) M. Guttormsen, T. Ramsøy, and J. Rekstad, Nuclear Instruments and Methods in Physics Research Section A: Accelerators, Spectrometers, Detectors and Associated Equipment 255, 518 (1987).
- Tveter et al. (1996) T. S. Tveter, L. Bergholt, M. Guttormsen, E. Melby, and J. Rekstad, Physical Review Letters 77, 2404 (1996).
- (45) J. E. Midtbø, F. Zeiser, E. Lima, A.-C. Larsen, G. M. Tveten, M. Guttormsen, F. L. B. Garrote, A. Kvellestad, and T. Renstrøm, 1904.13248 .
- Brink (1957) D. Brink, Nuclear Physics 4, 215 (1957).
- Axel (1962) P. Axel, Physical Review 126, 671 (1962).
- Bohr and Mottelson (1969) A. Bohr and B. Mottelson, Nuclear Structure, Vol. 1 (New York, 1969).
- Henden et al. (1995) L. Henden, L. Bergholt, M. Guttormsen, J. Rekstad, and T. Tveter, Nuclear Physics A 589, 249 (1995).
- NND (2019) Data extracted from NuDat database on the National Nuclear Data Center, Brookhaven National Laboratory, USA, as of September 2019 (2019).
- Capote et al. (2009) R. Capote, M. Herman, P. Obložinský, P. Young, S. Goriely, T. Belgya, A. Ignatyuk, A. Koning, S. Hilaire, V. Plujko, M. Avrigeanu, O. Bersillon, M. Chadwick, T. Fukahori, Z. Ge, Y. Han, S. Kailas, J. Kopecky, V. Maslov, G. Reffo, M. Sin, E. Soukhovitskii, and P. Talou, Nuclear Data Sheets 110, 3107 (2009).
- von Egidy and Bucurescu (2006) T. von Egidy and D. Bucurescu, Physical Review C 73 (2006), 10.1103/physrevc.73.049901.
- Goriely et al. (2008) S. Goriely, S. Hilaire, and A. J. Koning, Physical Review C 78 (2008), 10.1103/physrevc.78.064307.
- Egidy et al. (1988) T. V. Egidy, H. Schmidt, and A. Behkami, Nuclear Physics A 481, 189 (1988).
- Ericson (1959) T. Ericson, Nuclear Physics 11, 481 (1959).
- Gilbert and Cameron (1965) A. Gilbert and A. G. W. Cameron, Canadian Journal of Physics 43, 1446 (1965).
- Mughabghab (2018) S. F. Mughabghab, in Atlas of Neutron Resonances (Elsevier, 2018) pp. 89–822.
- Ingeberg et al. (2020) V. W. Ingeberg, S. Siem, M. Wiedeking, K. Sieja, D. L. Bleuel, C. P. Brits, T. D. Bucher, T. S. Dinoko, J. L. Easton, A. Görgen, M. Guttormsen, P. Jones, B. V. Kheswa, N. A. Khumalo, A. C. Larsen, E. A. Lawrie, J. J. Lawrie, S. N. T. Majola, K. L. Malatji, L. Makhathini, B. Maqabuka, D. Negi, S. P. Noncolela, P. Papka, E. Sahin, R. Schwengner, G. M. Tveten, F. Zeiser, and B. R. Zikhali, The European Physical Journal A 56 (2020), 10.1140/epja/s10050-020-00070-7.
- Koning and Rochman (2012) A. Koning and D. Rochman, Nuclear Data Sheets 113, 2841 (2012).
- Potel et al. (2015) G. Potel, F. M. Nunes, and I. J. Thompson, Physical Review C 92 (2015), 10.1103/physrevc.92.034611.
- Potel et al. (2017) G. Potel, G. Perdikakis, B. V. Carlson, M. C. Atkinson, W. H. Dickhoff, J. E. Escher, M. S. Hussein, J. Lei, W. Li, A. O. Macchiavelli, A. M. Moro, F. M. Nunes, S. D. Pain, and J. Rotureau, The European Physical Journal A 53 (2017), 10.1140/epja/i2017-12371-9.
- Filipescu et al. (2014) D. M. Filipescu, I. Gheorghe, H. Utsunomiya, S. Goriely, T. Renstrøm, H.-T. Nyhus, O. Tesileanu, T. Glodariu, T. Shima, K. Takahisa, S. Miyamoto, Y.-W. Lui, S. Hilaire, S. Péru, M. Martini, and A. J. Koning, Physical Review C 90 (2014), 10.1103/physrevc.90.064616.
- Kopecky and Chrien (1987) J. Kopecky and R. Chrien, Nuclear Physics A 468, 285 (1987).
- Kopecky and Uhl (1990) J. Kopecky and M. Uhl, Physical Review C 41, 1941 (1990).
- Bethe (1936) H. A. Bethe, Physical Review 50, 332 (1936).
- Möller et al. (2016) P. Möller, A. Sierk, T. Ichikawa, and H. Sagawa, At. Data Nucl. Data Tables 109-110, 1 (2016).
- Ziegler et al. (1990) W. Ziegler, C. Rangacharyulu, A. Richter, and C. Spieler, Physical Review Letters 65, 2515 (1990).
- Demetriou and Goriely (2001) P. Demetriou and S. Goriely, Nuclear Physics A 695, 95 (2001).
- Ay et al. (2016) K. O. Ay, M. Ozgur, E. Algin, M. Guttormsen, F. L. B. Garrote, L. C. Campo, A. Görgen, T. W. Hagen, V. W. Ingeberg, B. V. Kheswa, M. Klintefjord, A. C. Larsen, J. E. Midtbo, V. Modamio, T. Renstrom, S. J. Rose, E. Sahin, S. Siem, G. M. Tveten, and F. Zeiser, Journal of Physics: Conference Series 766, 012027 (2016).
- Guttormsen et al. (2020) M. Guttormsen, Y. Alhassid, W. Ryssens, K. O. Ay, M. Ozgur, E. Algin, A. C. Larsen, F. L. B. Garrote, L. C. Campo, T. Dahl-Jacobsen, A. Görgen, T. W. Hagen, V. W. Ingeberg, B. V. Kheswa, M. Klintefjord, J. E. Midtbø, V. Modamio, T. Renstrøm, E. Sahin, S. Siem, G. M. Tveten, and F. Zeiser, “Strong enhancement of level densities in the crossover from spherical to deformed neodymium isotopes,” (2020), arXiv:2012.01902 [nucl-ex] .
- Wender (2000) S. Wender, ed., Proceedings of the 10th International Symposium on Capture Gamma-Ray Spectroscopy and Related Topics, Vol. 529 (AIP Conference Proceedings, 2000).
- Tamii et al. (2009) A. Tamii, Y. Fujita, H. Matsubara, T. Adachi, J. Carter, M. Dozono, H. Fujita, K. Fujita, H. Hashimoto, K. Hatanaka, T. Itahashi, M. Itoh, T. Kawabata, K. Nakanishi, S. Ninomiya, A. Perez-Cerdan, L. Popescu, B. Rubio, T. Saito, H. Sakaguchi, Y. Sakemi, Y. Sasamoto, Y. Shimbara, Y. Shimizu, F. Smit, Y. Tameshige, M. Yosoi, and J. Zenhiro, Nuclear Instruments and Methods in Physics Research Section A: Accelerators, Spectrometers, Detectors and Associated Equipment 605, 326 (2009).
- Neveling et al. (2011) R. Neveling, H. Fujita, F. Smit, T. Adachi, G. Berg, E. Buthelezi, J. Carter, J. Conradie, M. Couder, R. Fearick, S. Förtsch, D. Fourie, Y. Fujita, J. Görres, K. Hatanaka, M. Jingo, A. Krumbholz, C. Kureba, J. Mira, S. Murray, P. von Neumann-Cosel, S. O'Brien, P. Papka, I. Poltoratska, A. Richter, E. Sideras-Haddad, J. Swartz, A. Tamii, I. Usman, and J. van Zyl, Nuclear Instruments and Methods in Physics Research Section A: Accelerators, Spectrometers, Detectors and Associated Equipment 654, 29 (2011).
- Goriely et al. (2018) S. Goriely, S. Hilaire, S. Péru, and K. Sieja, Physical Review C 98 (2018), 10.1103/physrevc.98.014327.
- Carlos et al. (1974) P. Carlos, H. Beil, R. Bergère, A. Leprêtre, A. D. Miniac, and A. Veyssière, Nuclear Physics A 225, 171 (1974).