User Ex Machina : Simulation as a Design Probe in Human-in-the-Loop Text Analytics
Abstract.
Topic models are widely used analysis techniques for clustering documents and surfacing thematic elements of text corpora. These models remain challenging to optimize and often require a “human-in-the-loop” approach where domain experts use their knowledge to steer and adjust. However, the fragility, incompleteness, and opacity of these models means even minor changes could induce large and potentially undesirable changes in resulting model. In this paper we conduct a simulation-based analysis of human-centered interactions with topic models, with the objective of measuring the sensitivity of topic models to common classes of user actions. We find that user interactions have impacts that differ in magnitude but often negatively affect the quality of the resulting modelling in a way that can be difficult for the user to evaluate. We suggest the incorporation of sensitivity and “multiverse” analyses to topic model interfaces to surface and overcome these deficiencies.
Code and Data Availability: https://osf.io/zgqaw
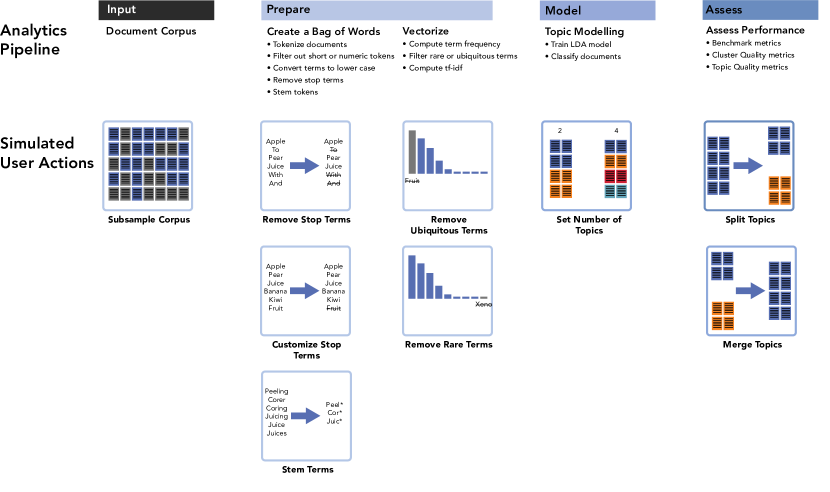
The eight user actions modeled in our pipeline, divided by whether they are actions that occur in the input, preparation, modelling, or assessing stages. These actions are described non-graphically later in section 3 of the paper.
1. Introduction
Entire domains of scholarship are dedicated to the semantic analysis of text. Attempts to support and augment these processes of human interpretation and summarization computationally have often struggled with the degree to which human agency should shape or control the algorithmic output. On one extreme there are positions such as the quote often ascribed to Frederick Jelinek (Hirschberg, 1998) that “every time I fire a linguist, the performance of the speech recognizer goes up,” suggesting that the role of human expertise may be somewhat limited, and perhaps even counter-productive in the face of algorithmic complexity and performance beyond the capacity of the usual interpreters of texts. On the other hand, the opaque, biased, and brittle approaches of computational and statistical models (O’Neil, 2016) has led to calls for explainable AI (XAI) and human-in-loop machine learning (HILML).
Text corpora are often of such size and complexity that we cannot read or analyze all the texts therein. Computational “distant reading” (Moretti, 2005) approaches such as topic modelling can allow us to form an impression of the content or important patterns in text corpora without reading every document. Human agency in building, interpreting, and communicating the results of these text models is an important component of their use (Correll and Gleicher, 2012). The specific role of this human agency can take many forms: Lee et al. (Lee et al., 2019) propose three potential levels of autonomy in model-building, from entirely user-driven exploration of the model space, to a “cruise control” level where the user provides periodic coarse guidance while the system adapts the fine-grain details, all the way up to full “autopilot” where the system has full control over the model output. Likewise, Heer (Heer, 2019) suggests a hybrid approach where automated methods “augment” (but do not remove agency) from human analytical decisions. However, despite human agency in their creation, resulting models for text analytics may be brittle, difficult to interpret, or fail to capture semantic information of relevance to the reader. How these text analytics models are built versus how they are interpreted may be at odds (Chang et al., 2009), resulting in “folk theories” of algorithmic performance that may or may not not reflect realities of algorithmic performance or structure (DeVito et al., 2018).
We view the combination of the purported utility of human guidance in text analytics, the fragility and instability of existing corpus linguistic tools, and the potential for resulting models to be misinterpreted, as a provocation to question how disruptive human actions may be to text models. As an example of this issue, a user could perform an action that is, from their perspective, a minor adjustment or correction based on domain knowledge that could entirely reconfigure the topic space. In such a case, it is difficult for the user to remain oriented when performing future analytic tasks with the corpus, or be able to judge whether or not their action had a positive impact on the model. A measure of user impact could be in terms familiar to evaluators of statistical models (such as complexity, accuracy, or precision), or it could be disruption in more human terms (the semantic content of particular topics, or the visual or textual summaries of those topics). There are likewise failures in the other direction: a user might perform an action that they believe will “fix” a consistent problem with the topic model output, but that results in irrelevant or superficial changes. Without a fuller understanding of the impact of user actions from a both algorithmic and human-centric standpoint, we risk producing steerable or supervised systems that are frustrating to use and interpret, and may not even produce the hoped-for gains in accuracy, agency, and interpretability.
In this paper, we investigate, through simulations, how efforts to steer or update topic models impact the resulting “truthiness,” coherence, and interpretability of the altered model. Our agenda is to determine to what degree topic models as they are commonly employed for content analysis can meaningfully respond to human actions, and the degree to which the resulting changes are robust and reliable from a human-centered standpoint: in short, we wish to perform a human-centered sensitivity analysis of topic modelling. We focus on potential user actions throughout the text analytics pipeline, from the way that words are prepped and modelled, to specific interactions with the model output (see Figure 1). The contributions of this work are:
-
•
A text analytics pipeline capable of simulating potential user actions at various stages of topic modelling, including data preparation, modelling, and performance assessment.
-
•
A holistic assessment of the impact of these actions, in terms of established benchmarks like topic and cluster quality metrics as well as in terms of impact on the resulting summary visualizations.
-
•
Recommendations for future designers of human-in-the-loop text analytics systems.
We deploy our simulation approach using datasets with known and absent ground-truth labels to measure the impact of user actions on model performance. We found that user actions have a range of impact, some modifying model performance very little and others causing more substantive changes. We also found that user actions that impact data preparation resulted in the largest changes in model performance, although these changes may or may not be reflected in resulting visualizations of the model. Our results demonstrate the importance of giving the user agency to introduce changes across the text analytics pipeline and for designers of human-in-the-loop text analytics systems to communicate the impact of these actions through data visualization. We call on designers to: surface the provenance and data flow choices of inputs to topic models (not just visualizations of the output of such models), alert users to potentially disruptive impacts of their decisions, and to guide through the simultaneous exploration of multiple analytic “paths.”
2. Related Work
Many text analytics systems are designed to support human agency, whether this agency takes the form of human-driven “interaction” with (Brown et al., 2012) or “supervision” of (Mao et al., 2012) text models. For instance, the iVisClassifier (Choo et al., 2010) system allows users to supervise the clustering of text corpora, while tools like TextTonic (Paul et al., 2019) and Dis-Function (Brown et al., 2012) afford user-driven fine-grained steering of a clustering and layout by, for instance, “pinning” important words, or dragging points the user believes to be misplaced to better locations. However, there are many degrees of freedom in how text models are built, from preparation to analysis to visualization. All of these decisions could potentially benefit from human intervention: Smith et al. (Smith et al., 2018) note that, though there are costs of human interaction with topic models such as latency and unpredictability, these costs can be qualitatively offset by increased perceived ownership, trust, or performance.
We focus specifically on the case of topic modelling for text analytics as a candidate for human interactions with the algorithm, and visual explanations of the resulting model. We assume that the analyst is interested in viewing an overview of a corpus, composed of clusters of texts. We assume that membership in these clusters is driven by topics generated from a topic model. Our objective was to determine how potential human interactions might shape the resulting topic clusters in terms of accuracy, interpretability, and resiliency. Our results build upon prior considerations of topic modelling as a tool for content analysis, potential user interactions with text models, and sensitivity analyses of visual analytics designs and algorithms.
2.1. Topic Modelling
A common task in text analytics is determining the themes of a large text corpus: what are the texts in a corpus generally about, and which texts are about which topics? Beyond functioning as a way of analyzing the content of a corpus per se, a topic model can be useful for searching for particular documents, orienting oneself in an unfamiliar text dataset, or performing data cleaning tasks (such as filtering out irrelevant or mislabeled documents). Latent dirichlet allocation (LDA) (Blei et al., 2003) is a common statistical approach to topic modelling. The corpus is assumed to be made up of a predetermined number of topics. Each topic is a probability distribution across all of the tokens (usually words) in the corpus. Texts (reduced to a “bag-of-words” vectorization) are then taken to be distributions across topics, as though one were drawing words out of a weighted sample of different topic boxes, each of which contains its own collection of words. By analyzing the words that are prominent in topics, and analyzing the topics that are prominent in texts, the analyst can get a picture of the content and composition of a corpus.
2.1.1. Topic Model Visualization
A full scope of text visualization techniques, even just those subset of text visualization techniques meant for content analysis, is outside of the scope of this paper (consult Kucher et al. (Kucher and Kerren, 2015) for a survey). We instead focus on visualization techniques directly related to topic models, or the challenge of visualizing different clusters of semantic content in text corpora. We note here that our survey of methods is biased towards those where the topic models are both a tool for structuring the text corpora but also objects of inquiry themselves. Many visualizations may not expose the inner structure of the topics at all, leaving it as a black box that is used to determine cluster membership or pairwise document distances. We identify two common clusters of designs of topic model visualizations:
Topic Matrices: assessing the utility of methods like LDA often involves examining the contribution of each word to a topic, or each text to a topic, or some other pairwise comparison of values. Tools like Termite (Chuang et al., 2012a) and Serendip (Alexander et al., 2014) present this information in the form of matrices of topic information. Since there may be many topics, words, and texts under consideration, a key design challenge is how to make the resulting matrix usable and interpretable by humans. Saliency metrics are often used to drive ordering or filtering of these matrices, combined with operations like roll-up and drill-down. The assumption is that the viewer may only be able to see a small fraction (say, the distribution of the top tokens across the top topics) of the matrix at once.
2D Spatializations: other visualization tools use topic models or other measures of text distance to power a resulting “spatialization” (Tory et al., 2007; Wise et al., 1995) or “landscape” (Chalmers, 1993) of the corpus. Adjutant (Crisan et al., 2019) and the Stanford Dissertation Browser (Chuang et al., 2012c) both present the user with a two-dimensional projection of the corpus, with explicitly identified clusters that are meant to represent topics of interest. While 2D planes (Crisan et al., 2019) and graphs (Cao et al., 2010) are standard spatializations, radial or polar views of text are also common. DocuBurst (Collins et al., 2009a), TopicPie (Yang et al., 2016), PhenoLines (Glueck et al., 2018) and VISTopic (Yang et al., 2017) all employ radial views of texts or corpora. These radial views are often based around a hierarchical spatialization or organization of texts, with “core” topics or tokens afforded greater size or centrality than peripheral or finer grained topics. A particular challenge with spatializations is that the space itself can have important semantic or analytic connotations (Liu et al., 2019): for instance, the location of one of Shakespeare’s plays in a scatterplot can be interpreted as encoding information about genre (Hope and Witmore, 2010).
These two design categories simplify information by reducing the vast amounts of data produced at the term, text, and corpus level into something more manageable for humans to review. These visualizations focus on just a subset of the data in topic models, or rely on multiple coordinated views (Alexander et al., 2014; El-Assady et al., 2018a) to present additional facets or levels of detail. However, visualizations are also sensitive to text analytics algorithms and their parameter configuration. For example, the designers of Termite (Chuang et al., 2012a) found that the utility of their visualization was highly dependent on the metrics they employed to order words. Parallel Tag Clouds (Collins et al., 2009b) likewise concern themselves with how words should be ordered in their texts. Choices of dimensionality reduction (Chuang et al., 2012c) and automatic topic labeling algorithms (Chuang et al., 2012b) can likewise impact how topics in a corpora are interpreted by the viewer. In our analysis, we explore how simulated user actions impact the two categories of text visualizations.
2.1.2. Topic Model Comparison
LDA and many other topic modelling algorithms are probabilistic and there are stochastic elements to their output (Steyvers and Griffiths, 2007); even on the same corpus, a topic model may differ from run to run, producing substantially different or even contradictory analyses of the same corpus (Roberts et al., 2016). Even without this concern, there are many degrees of freedom (the selection of the number of topics, the pre-processing of texts, the creation of the bag-of-words model) that can result in differing outputs (both in terms of the model itself, and the visualization of the model). As such, there is an interest in visually comparing two or more topic models. Alexander & Gleicher (Alexander and Gleicher, 2016) treat the topic model comparison task as motivation for a design exercise, creating matrix based views as well as “buddy plots” that allow the viewer to see how individual texts shift in topic space across models. Our interest in this space is more specific, however; we are concerned with comparing many topic models simultaneously, investigating the sensitivity of different parameter settings on these models, and comparing these models to an existing ground truth when available. As such, we selected three designs as inspiration:
TopicCheck (Chuang et al., 2015) uses a matrix of small multiples to assess the stability of a topic model algorithm across runs. Columns are different runs of the model, and rows are different “groups” of highly similar topics. By observing “gaps” in the matrix (where particular topics did not persist across runs), the viewer can gain some sense of the stability of a particular algorithm on the given corpus.
Resonant with our research questions, El-Assady et al. (El-Assady et al., 2018a) employ a per-parameter comparison of topic models, allowing the user to gauge the potential impact of different weightings on the resulting topics. Their use case, where the analyst interactively explores the parameter space and iteratively refines the output model, closely matches our vision of a “steerable” topic model system.
Lastly, Chuang et al. (Chuang et al., 2013) employ a matrix visualization with marginal bar charts to compare the results of a topic model with “latent” concepts (what would be the “ground truth topics” in our scenario). Of particular interest in their design are latent concepts that are “missing” (not covered by any of the generated topics), “repeated” (covered by multiple topics), and likewise generated topics that are “fused” (containing multiple latent concepts) or “junk” (not corresponding to any of the latent concepts).
As with the visualization techniques for individual topic models, the comparison of two or more topic models is also highly sensitive to the choice of specific metrics employed.
2.1.3. Topic Model Metrics
Many diagnostic measures for topic models have been proposed, often relying on the probabilistic or information theoretic properties of the topics themselves. Topics, as vectors in a high-dimensional token-space, can be compared via standard vector difference measures. Beyond euclidean distance, cosine similarity (Jacobi et al., 2016), Jensen-Shannon similarity (Fothergill et al., 2016), and KL-divergence (Chuang et al., 2013) have all been used to measure distances between topics. These metrics are employed to quantify more abstract concepts such as the coherence of topics, the distance between topics, or the relation of these topics to ground truth latent concepts. As topics and bag-of-words texts are both vectors of tokens with associated weights, these metrics can also be used to measure the coherency of topics: e.g., El-Assady et al. (El-Assady et al., 2018a) use a Ranked Weighted Penalty Function to both measure the distance between two topics, and the coherency of the texts within that topic.
Within topics, there is a challenge in measuring the centrality or saliency or particular tokens. These saliency metrics are often used to order words within a topic (so that a final visual or textual summary can include the top most important tokens, rather than the unwieldy full list of all tokens with non-zero value) or to label particular topics with descriptive phrases. Chuang et al. (Chuang et al., 2012b) find that naïve orderings based on, e.g., term frequency may not surface the tokens in a topic that are the most effective summaries of the topic’s contents. They also find that more complex metrics such as the measure used by other text visualization systems (Collins et al., 2009b) may not adequately capture how humans summarize texts. The choice of word-ranking metric can have large impacts on the resulting visualization (Chuang et al., 2012a), and therefore the resulting analyses based on those visualizations.
There are also human-centric metrics for assessing the coherence and utility of topics. Fang et al. (Fang et al., 2016) employ word embedding models to measure cluster coherence via the semantic similarity of its top words. Chang et al.(Chang et al., 2009) propose the “word intrusion” and “topic instrusion” tasks as human-derived metrics for topic models, corresponding to the reliability and ease at which humans can detect extraneous words or topics from a list. Recognizing the cost of having to gather data from human subjects, Lau et al. (Lau et al., 2014) attempt to construct algorithmic measures that emulate human performance at these word intrusion tasks. Most relevant to our work, Kumar et al. (Kumar et al., 2019) compute a “control” metric based on elicited or simulated priors about document ranks to measure the impact of different simulated actions on topic model outputs.
These differing approaches to human-interpretable topic metrics may often disagree with each other, be expensive to compute, or require human input or independently trained models to be feasible. We limit our simulated analyses to more standard vector distance metrics for reasons of computational efficiency, but we acknowledge that one metric is unlikely to suffice to capture the full picture of how a particular topic is perceived.
2.1.4. Topic Cluster Metrics
In our specific use case, a topic model is used to generate a membership function for document clusters. As such, an analyst might be interested in the the quality of the resulting clusters. We considered two categories of metrics: benchmark metrics, where there is some “ground truth” labeling of latent topics or clusters against which to compare, and cluster metrics, where we are comparing clusters (for instance, before and after a user action) against themselves.
When there are ground truth concepts available, the quality of clusters can be assessed via measures like the purity and entropy of a cluster (Zhao and Karypis, 2004) (the degree to which a cluster contains only documents from a single ground truth topic, and the informational content of a topic with respect of ground truth topics, respectively). Chuang et al. (Chuang et al., 2013) also measure cluster quality via a binary categorization procedure of mapping ground truth topics to clusters. We employ a similar mapping approach to generate standard measures like accuracy and precision.
Even when there are no ground truth labels available, it is still possible to measure the compactness, self-similarity, or distinctiveness of a particular cluster through distance metrics. Huang (Huang, 2008) explores a variety of different cluster distance metrics such as Jaccard Similarity, cosine similarity, and KL-Divergence as inputs to standard clustering systems, while Wang et al. (Wang et al., 2017) perform similar topic model-driven cluster analysis via the silhouette coefficient and the Cophenetic correlation coefficient. A common pattern across these works is that differing distance metrics have differing patterns of performance across different text corpora, with no clear “winner” (a situation common across the problem of clustering in general (Jain et al., 1999)); we use these results to justify the collection of multiple related distance metrics where possible. We describe the subset of benchmark and cluster metrics we implemented in our simulation work in §3.1.1 and §3.1.2, respectively.
2.2. Sensitivity Analyses of Visual Analytics

An initial pie chart of topic membership in a corpus contrasted with two resulting pie charts showing the corpus state after human actions that can indicate algebraic visualization failures. Either large visual change as a result of a trivial user action, or small visual change as a result of a significant user action.
There are many potential actions that an analyst can take over the course of analysis. For instance, an analyst looking at text data could plausibly make decisions about which texts to include or exclude from the corpus, whether or not to remove stop words or common words, and whether or not to stem or group words before the first chart is drawn or analysis is run. Each of these decisions could result in a dramatically different final analysis or visualization. This “garden of forking paths” problem (Pu and Kay, 2018) for visual analytics is often portrayed as an issue of reliability or replicability of findings. An emerging challenge in visual analytics is therefore how to capture and visualize the data flow that led to a particular experimental outcome (Freire, 2012), or the visualize the robustness of a conclusion across a “multiverse” of different analytical paths (Dragicevic et al., 2019; Kale et al., 2019; Liu et al., 2020). While the lack of exploration of data prep flows and hyperparameters (and its resulting impact on the model) has been identified as a “troubling trend” in machine learning generally (Lipton and Steinhardt, 2019), this issue of reliability across highly variable methods is particularly vital in text analytics, where existing statistical tools are often thought of as fragile or sensitive in the face of the semantic complexity of text corpora. For instance, Da (Da, 2019) claims that for scholarship based on text analytics, “what is robust is obvious… and what is not obvious is not robust”: that after one removes the scholastic conclusions from text analytics that are properties of idiosyncratic selections of datasets or choices of methods, the only remaining reliable conclusions are often so obvious or bland as to be uninteresting.
While our simulations are rooted in these sorts of sensitivity analyses, large changes in, say, accuracy or cluster coherence due to changes in the model are not intrinsically dangerous or user-unfriendly. Actions that result in large changes or sensitivities to the model might be perfectly acceptable if the user is aware that they are undertaking a disruptive action. We wanted to capture that sensitivity and reliability are contextual, and so we rely on the principles of Algebraic Visualization Design (Kindlmann and Scheidegger, 2014) (AVD). Following AVD, we hold that user expectations of the visualization of the model are met when small or large changes to the data result in commensurately small or large changes to the resulting output. In cases where there is an algebraic violation (say, an action that the user perceives as a minor adjustment to the text pipeline results in fundamentally different topics, or a user intends to induce a total reclassification of texts but merely shuffles around existing categories) as in Figure 2, then the designers of topic modelling tools might wish to signal or otherwise alert the user to this mismatch.
Simulations (whether headless or based on particular interfaces) are especially useful in the AVD regime, as they allow the direct manipulation of inputs (data changes) and a direct measuring of outputs (visual or representational changes). For instance, Correll et al. (Correll et al., 2018) use simulation of data quality issues to highlight visual designs that may not robustly or reliably surface important properties in distributions. More generally, McNutt et al. (McNutt et al., 2020) propose the use of simulation results to automatically detect potentially misleading or unstable insights from visualization. An insight that is highly sensitive to particular conditions may not be reliable or generalizable. This work on using simulation to detect commensurate changes in data and model output inform our methods.
3. A Human-in-the-Loop Text Analytics Pipeline
In this section we describe the text analytics pipeline that we use to assign documents to topics and elicit user input (Figure 1). First, we describe the overall text analytics pipelines, including the three types of metrics (benchmark, cluster, and topic) that we collect to assess the performance of the pipeline. Next, we describe how user actions are incorporated into the text analytics pipeline. We also describe the ways that we simulate these actions and compute their impact relative to an initial baseline run.
3.1. A Pipeline for Document Classification and Topic Elicitation
We implemented a fairly standard pipeline that models documents as a bag of words and uses Latent Dirchlet Allocation (LDA) for topic elicitation and document classification. A single simulation ‘run’ of the LDA pipeline represents some specific set of parameter configurations, for example, the number of topics provided to an LDA model or whether or not to stem tokens. The baseline run refers to the default pipeline and parameter configurations (tailored to a particular dataset, as described in our results), whereas all subsequent runs refer to some simulated user action. We break down the steps of our pipeline into three stages: data preparation, model building, and performance assessment.
The data preparation stage takes a corpus of text documents and creates of bag of words model for each document. A baseline run of the pipeline tokenizes and processes text into 1-grams, filtering out short or numeric tokens, removes stop terms, and finally stems tokens. We compute the term frequency (tf) and term frequency inverse document frequencies (tf-idf) statistics to create the document-term matrix for the model stage. In the baseline run we do not remove rare or ubiquitous terms by default.
The model stage trains a LDA Model with a set of default parameters. The default setting for the total number of topics is 10, but if the user has ground truth labels for their data then the total number of topics can be automatically derived from the label vector. Once the model is trained, we compute the topic assignment for documents. The LDA algorithm produces a posterior distribution of topic membership for each document and we use the argmax function to assign each document to one final topic. We can also extract the posterior distribution for the term-topic relationship.
Our last stage is performance assessment. We compute a set of benchmark, cluster, and topic metrics. We provide more details on the calculation of these metrics in the subsequent subsections §3.1.1 to §3.1.3, but provide a high-level overview here. Benchmark metrics compare the performance of the current run against some baseline. Benchmark metrics assess the accuracy and precision of the document classification. Cluster metrics how well documents are grouped together into clusters via assessments of cluster homogeneity, completeness, variance, and the document silhouette. Finally, topic metrics assess the distribution of terms across topics.
While topic quality measures are the norm in the visualization literature (see §2.1.3), studies have not previously examined the utility of benchmark and cluster metrics for examining or steering human-in-the-loop actions. These latter metrics depend on having some ground truth dataset to compare against and thus have been overlooked, however we see useful ways that these metrics can be used with or without an a priori ground truth label. When ground truth labels are known, we can compute both the magnitude and direction (i.e. improve model quality or not) of change introduced by a user action. When ground-truth labels are not available, it is possible to use the predicted labels from the baseline run and to measure only the magnitude of change introduced by a user action. This approach is reasonable as prior research has shown that default parameters are highly influential in visualization design, often to the potential detriment of understanding (Conti et al., 2005; Correll et al., 2018). Users may not often change default model parameters and may use the initial classification results as a kind of default run.
This pipeline is implemented in Python using primarily the scikit-learn (Pedregosa et al., 2011) and nltk (Bird et al., 2009) packages. The code is available online at https://osf.io/zgqaw. We have implemented the pipeline in a modular way that enables those that wish to expand on our approach to incorporate new user actions and even pipeline steps.
3.1.1. Benchmark Metrics
Given some document labels we compute benchmark metrics. As LDA is an unsupervised method, and the relation between the topics generated by LDA and any a prior document labels is not straightforward; it often up to the user to infer the semantic content or relation between topics. We automatically derive this topic correspondence when computing accuracy and precision metrics. We define and calculate these metrics in a slightly different way here compared to supervised settings. Accuracy is a measure of how many documents with a common ground truth class are assigned to a common predicted topic. We provide details for this computation in Algorithm 1. We compute the accuracy for each ground-truth class, as well as an average and weighted average for the entire run. Precision is a measure of how many documents of a common class are assigned to a common predicted topic and the purity of the predicted topic. We compute precision via the F-1 and Fowlkes-Mallows Index (FMI) metrics as shown in Algorithm 2.
3.1.2. Cluster Metrics
Cluster quality metrics evaluate how well documents are grouped together. We use the term cluster to emphasize that the quality of the resulting topics, as expressed by the term distributions across topics, is not under consideration, only the grouping of documents. We compute overall quality of the classification via homogeneity, completeness, variance, and silhouette. The former three metrics require a document classification label, whereas the silhouette metric does not. Homogeneity is a score between 0 and 1 that measures how many predicted clusters contain data points of a single class; results closer to 1 indicate better homogeneity. Completeness is an overall assessment of whether all documents in some ground truth class belong to a single cluster: it also produces a score between 0 and 1. Variance is a harmonic mean between homogeneity and completeness. Homogeneity, completeness, and variance are computed at the level of each run only, rather than for each ground-truth class as can be done for accuracy and precision. The silhouette co-efficient is a measure of similarity of documents within a common cluster relative to documents in other clusters. The resulting silhouette co-efficient values ranges from -1 to 1, with a score of 1 meaning that a document is nearly identical to others within the same cluster.
3.1.3. Topic Model Metrics & Visual Analysis
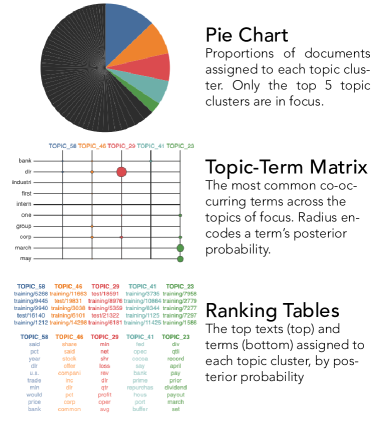
The three views we created of the state of a corpus state with respect to the topic model: a pie chart of document membership in topics, a term-topic matrix of token loadings in topics, and ranking tables of the top N documents and tokens associated with a subset of topics.
Topic quality metrics concern the term-topic relationship. A simple way to summarize this relationship is to observe the top terms across topics according to the posterior probability computed by LDA. We summarize the diversity of topics by computing the KL-divergence, Jensen-Shannon similarity, and cosine similarity. We excluded some of the more complex bespoke algorithms mentioned in §2.1.3 for reasons of performance, complexity, or specificity to particular corpora or models (e.g. a particular word embedding model, or a dataset of human-generated responses).
Under the assumption that only a subset of topic information will be visible in a particular view, we also perform a visual comparison of topics through an exemplar topic dashboard, inspired by existing commonly used visualizations (see §2.1.1). Figure 3 shows an example view constructed for this purpose. Rather than a fully-functional interactive system, these views are meant to act as “fruit flies for visualization” (Rensink, 2014) and provide a useful proxy for illustrating the practical magnitude of changes in human terms. First, we use a pie chart to convey the number of documents contained in each topic cluster. Second, we show a term-topic matrix view (Figure 2) of the distribution of the top ten terms across the five largest topic clusters. These top-ten terms are established by summing and ranking the occurrence of these terms across topics. We use a circle mark with a variable size to encode the posterior distribution for each term across topics. Finally, we show the list of top five documents and top ten terms per topic clusters. This visual analysis allows us to make claims related to the algebraic relationships between actions and visualizations (see Figure 2 for examples).
3.2. User Actions
At the heart of our simulation is a list of simulated user actions that correspond to either analytical choices made prior to model generation, and/or attempts to “steer” a model towards a more useful state. Here we summarize the user actions that we anticipate would be commonly carried out through some kind of interactive user interface. We make no assumptions about the elements of the user interface or visual encodings that users would interact with to carry out an action, for example, adjusting a slider to increase or decrease the number of topics. Instead, we focus on the effect the user interface manipulations would have on an underlying text analysis pipeline relative to an initial set of results produced without that particular user input. In Figure 1 we show where user actions are incorporated into our LDA pipeline, we elaborate on how these user actions are incorporated in the subsequent subsection.
3.2.1. Pipeline Updating and Retraining Assumptions
We make the assumption that each individual user action, as opposed to a set of user action taken in sequence, triggers the rerunning of the corresponding pipeline step. For example, adding new stop terms requires running the text analysis pipeline from data pre-processing forward, whereas joining clusters together only re-computes the metrics but does not re-run the entire pipeline. We consider the choice of when and how to update a machine learning pipeline to be a design decision that is complimentary but broader in scope than our current research that seeks to explore nuanced user actions in detail. Moreover, this design choice can serve as a confound in our analysis because it obscures which action, or type of user action, had the largest impact on changing the result. That being said, our present simulation approach can be expanded to support inquiries about updating or retraining procedures in the future.
3.2.2. Refinement Implementation Choices
There are many potential user actions one could envision impacting a topic model. Lee et al. (Lee et al., 2017), in an interview with topic model users, identify a list commonly requested actions such as adding or removing words, removing documents, and splitting topics. Building on this work, Smith et al. (Smith et al., 2018) propose a list of actions for human in the loop topic models. While we use this list to motivate our implemented refinements, and attempt to maintain at least the spirit of these requested actions, a limitation of this prior work was that it only considered the types of refinements that users wanted to engage with, and did not go further to determine how those actions should be instantiated in a machine learning process. For example, when a user wishes to remove a word from a topic (the modal requested topic model refinement), how should LDA respond? There are several ways. E.g., we could add the word to our list of stop terms or we could modify the probabilities for the topic-term distribution; in both circumstances we would have to retrain the model from scratch. Another alternative is to avoid retraining the model and instead provide only superficial changes so that the user has a sense of control but the topic model does not meaningfully incorporate the modifications– many topic model systems do take this approach. Similarly, there are many actions that could have aesthetic impact (such as reordering or relabeling topics, or hiding irrelevant topics), and ought to be considered from the standpoint of the UX of a human-in-the-loop topic modeller, and could potentially impact the perceived trustworthiness or utility of a particular topic model, but that would not impact the underlying topic model structure in any concrete way.
Our work attempts to bridge the gap between users’ desired refinements and the ways that they could be practically incorporated into a machine learning regimen. More recent work by Kumar et al. (Kumar et al., 2019) does begin to explore how user actions could be incorporated into topic model priors, but we believe that priors can have only so much influence on a model outcome, and that there are potential areas of impact across the entire LDA pipeline, rather than just manipulation of priors. We focus on different places in the LDA pipeline where we thought incorporation of user actions made sense, from preparation and modelling to performance assessment, and we similarly made decisions about when the LDA pipeline (not just the model) should be rerun. Through this process we found that, in many ways, machine learning models are not well equipped to incorporate user input, as the language of hyper parameters does not necessarily map directly to user intent: different kinds of topic modelling algorithms can result in different affordances for user interaction and modification at different stages. Our decision to implement a standard LDA pipeline closed of some of these avenues (for instance, a hierarchical topic model would present a different notion of merging or splitting of topics than our pipeline). While we acknowledge the limitations of our particular pipeline as instantiated, we have attempted to craft our pipeline to be as modular and extensible as possible to afford experimentation with other kinds of actions and algorithms.
3.3. Simulating User Actions
As per our rationale in subsubsection 3.2.2, we build upon a set of interactions for topic modelling proposed by Smith et. al. (Smith et al., 2018) and categorize actions according to their impact our text analytics pipelines. In Figure 1 we summarize the user actions that we investigate.
Preparation-related user actions are those that trigger a re-start of the entire pipeline because they fundamentally change the distribution of terms or texts. These actions include:
-
•
The choice to remove stop terms
-
•
Adding or removing stop terms to an existing list
-
•
The choice to stem terms or not
-
•
Removing rare words or ubiquitous words via an occurrence threshold
-
•
Removing texts from the document corpus
These actions are interpreted in different ways by our LDA pipeline. The decision to remove stop terms or to stem terms are binary yes/no decisions that primarily impact which terms are used by the model, as well as the distribution of these terms across documents. When choosing to remove stop terms, a user can also exclude terms from a default list of English stop terms or they can add terms to an existing list. To simulate these actions, we carry out approximately 30 iterations where a random number of stop terms are either excluded or included relative to the default list. Removing rare or ubiquitous terms requires the user to supply a numeric threshold value ranging between 0 to 100%. For removing rare terms, we defined a set of thresholds (0.01%, 1%, 2.5%, 5%, and 10%) where any term with a term frequency less than the threshold value is removed. For removing rare terms, we defined set of threshold values (99%, 95%, 90%, 75%, 60%, 50%) where any term with a term frequency greater than the threshold is removed. Finally, a user can choose to remove documents from a corpus, for example if they find some texts irrelevant and don’t wish them to be considered when constructing the LDA model. We simulate this action by specifying a percentage of documents(5%, 20%, 25%, 40%,50%) to remove from the corpus. For these last three types of user actions we selected a fixed set of thresholds in lieu of sampling because it allows us to more efficiently explore the space of possible and reasonable user choices.
Model-related user actions require a retraining of the LDA model; this impacts the final document-topic distributions as well as term-topic distribution. The most salient parameter to LDA is the number of final topics to generate. We generate a distribution of potential topic numbers that ranges from 2 to at most 25% of the total number of documents in a corpus (or a maximum of 100 clusters, whichever is smaller). We sample uniformly from this distribution 30 times to simulate a user action of modifying the LDA parameters.
Assessment-related user actions are those that modify the document-topic and term-topic distribution but do not require a retraining of the LDA model. One such action we simulate is splitting a single topic into two sub-clusters. We randomly select at most 30 cluster to split in two. A user may also wish to merge one or more cluster together. To simulation this action, we randomly select a total of N topic clusters (where ) to merge together. After clusters are split or merged, we not only modify the predicted labels for documents but the topic membership probabilities as well. These modifications are used to recompute the benchmark, topic, and cluster metrics.
3.3.1. Data Collection and Analysis
Each simulation run produces data pertaining the run, documents, predicted topics, and ground truth labels (where present). For runs, we capture the specific user action, its impact, and the resulting overall benchmark, cluster, and topic metrics. For each document we capture its probability of assignment to a topic in addition to its final topic assignment; for simplicity we only output document-topic membership probabilities that are greater than 0.001. For each topic we output the top 100 documents and terms and their probability of assignment to each topic. We use this data to compare performance across runs, but also to compare topics within a simulation run.
We use descriptive statistics to summarize the changes in benchmark, cluster, and topic metrics over time. Finally, we compute a summary of a run ’s impact compared to a baseline run , , as the normalized distance between the two runs across our metrics:
| (1) |
We use the final value of to rank the overall impact of user actions across our simulation runs. , where indicates that the result is identical to the baseline run across all of our metrics. The data and analysis results are available in our online repository: https://osf.io/zgqaw/.
3.3.2. Further Extensions & Improvements
We report on a very simple model of user action in this paper, both to avoid a combinatorial explosion of data but also to allow a fully automated simulation pipeline. For instance, it is likely that users will engage in a sequence of multiple actions upon being given a topic model in an initial state rather than just a single action as in our current reported data. While our pipeline does support simulation of concatenated actions, building up a coherent and computationally tractable way of modelling and reporting on an entire multiverse of different pipelines of concatenated user actions remains future work. Similarly, many of our simulated actions are applied to random topics or texts. User actions are likely based on both model properties (for instance, being more likely to split a larger topic cluster than a smaller one) and domain knowledge (for instance, having an ontology in mind and altering the topic clusters to fit this ontology). modelling the likeliest user actions is likewise an area out of the scope of this paper (in Kumar et al. (Kucher and Kerren, 2015) it requires an explicit modelling of user priors, as opposed to the random preferences of “bad users”), and would require followup analyses of log data and specific user goals that are likely high dependent on context.
4. Results
In this section we describe the application of our text analytics pipeline with the Reuters-21578 dataset that is widely used in the machine learning literature. Due to limitations of space, we relegate the analysis of additional datasets to the online materials; we briefly summarize key findings from these data in §4.3.
4.1. Reuters-21578
4.1.1. Dataset Description
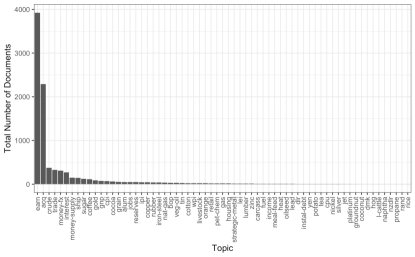
A histogram of which documents are associated with which ground truth topics in the Reuters-21578 dataset. The distribution is extremely skewed and long-tailed: nearly 4000 documents are associated with the most popular topic, but most of the other topics have far fewer associated documents.
The Reuters-21578 dataset is routinely used as a benchmark for text categorization algorithms (Lewis, 1997). The dataset comprises 10,788 documents that have been manually assigned to one or more of a possible set of 90 topics. We limit our analysis to documents that have only one topic assigned to them, which is 9,160 (84%) of all documents. We use this set of labels as our ground truth to assess the performance of our unsupervised text analytics pipeline. The distribution of documents (Figure 4) across the ground truth topics varies from as few as a single document per topic to a maximum of 3,923 documents per topic.
4.1.2. Dataset Specific Pipeline Optimization
In this study we have attempted to calibrate the initial set of pipeline parameters to the dataset rather than rely on naïve defaults. For example, the scikit-learn default for the total number of topics to produce is 10 and the token vectorizer similarly has a set of defaults. We modify these default parameters through a combination of a prior knowledge and experimentation in order to generate our baseline results. We use the Reuters-21578 dataset to primarily showcase our results: in this dataset we know the actual number of ground truth topics and so set the LDA parameters accordingly (although we experimented with other possible parameters at other stages of our pipeline).
We used the benchmark metrics, described in subsubsection 3.1.1 to guide our calibration process. The full compliment of parameter settings and other considerations are available in our online materials. We refer to this dataset-calibrated pipeline as the baseline run. Importantly, our objective in calibrating the LDA pipeline was not to create a perfectly tuned algorithm, but instead a reasonable baseline from which we measured the impact of user actions; we argue that it was useful to leave room for a user actions to potentially further optimize this baseline.
4.1.3. Benchmark and Cluster Metrics Capture Different Effects of User Actions

Box plots showing the impact of our simulated actions on our quantitative quality metrics. For most metrics the impact is small, but some actions like removing rare words or documents appear to result in consistent decreases in accuracy.
In Figure 5 we show the distribution of results from 167 simulation runs, each with a different potential user action. We show the performance of the default run as a red line; the extent of deviation from this red line shows how much of an impact a potential user’s change has.
First, we observe that different individual metrics measure the degree of change differently. Accuracy appears to be the most sensitive compared to other metrics that vary less. A reminder that the calculation of accuracy here is not identical to the calculation of accuracy in supervised settings, but instead a measure of how many documents with a ground truth class appear in a common cluster (see §3.1.1). The calculation of accuracy is thus tightly coupled to the size and composition of different cluster, whereas other metrics are more robust across different cluster distributions and sizes. A large deviation in accuracy is indicative that there are likely large changes in cluster membership, which may or may not be reflected by the more global qualities of clusters measured by the other metrics. We can summarize these changes holistically according to an action impact score, (see §3.3.1) and by directly visualizing how different models classify documents (Figure 6). By ranking the resulting values, we establish that removing rare terms is one of the most impactful (or disruptive) actions a user can take, whereas removing ubiquitous terms is one of the least impactful. This finding was not altogether surprising: the distribution of terms across documents in generally sparse and so long as the threshold for ubiquitous terms remains above some reasonable level, this action is unlikely to result in the removal of all that many terms by count. Removing rare terms is more impactful not only because the matrix is already sparse but because it will substantially change the feature space of the LDA model. Surprisingly, changing the number of topics did not result in as large of change as anticipated. In order to see a large impact, the user would need to configure LDA to run with substantially different parameters, for example as few as 7 when the we know there are roughly 65 topics. We suspect that this relative insensitivity is because changing the number of topics does not alter the feature space, only the distribution of those features in topics.
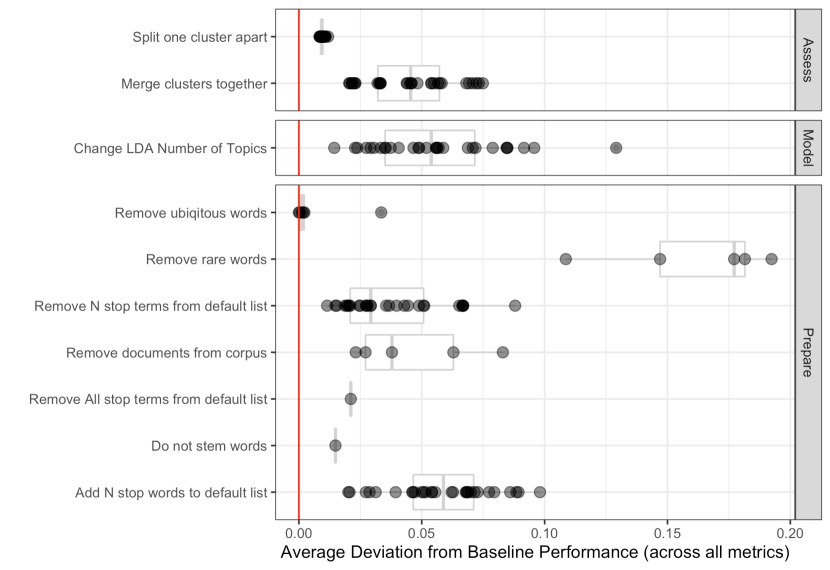
Dot plots with boxplot overlay of the impact of user actions as defined by a weighted sum of all of our existing quantitative metrics. Removing rare words had the most consistent holistic impact, while others like splitting clusters and removing ubiquitous words had very little impact.
In Figure 7 we examine how documents in different ground-truth topics are assigned to predicted topics within the highest and lowest impact () simulation run. We use a nested tree map which shows the predicted topics (separated by thick white lines) and with those the ground truth composition. First, it is noticeable that the low impact user action( Figure 7A) allocates many documents into a single predicted topic whereas the high impact user action of removing rare terms results in many smaller topic clusters. The second difference is that average cluster membership probability, indicated by color, is generally higher amongst the high impact run compared to the low impact results.
While our tree map visualizations are very different, they do not necessarily indicate an improvement in the overall cluster quality; they’re both potentially sub-optimal results but for different reasons. The properties of the dataset are a strong indicator for why this is. The Reuters dataset is imbalanced, with two comparatively large topic clusters. The influence of these two dominant clusters is difficult to impact using only a limited set of parameters afforded to them. However, it may not be immediately obvious to the user that this is a desirable thing to do. Moreover, these findings strongly suggest that the impact of user actions is also dependent on the characteristics of the dataset itself. This observation provokes us to reflect on our own pipeline and assess whether we have given users the necessary levers and waypoints to make meaningful and impactful through their human-in-the-loop interactions.
We include additional analyses of our metrics, including topic-based metrics such as KL-divergence, Jensen-Shannon similarity, and cosine similarity, in our online materials.
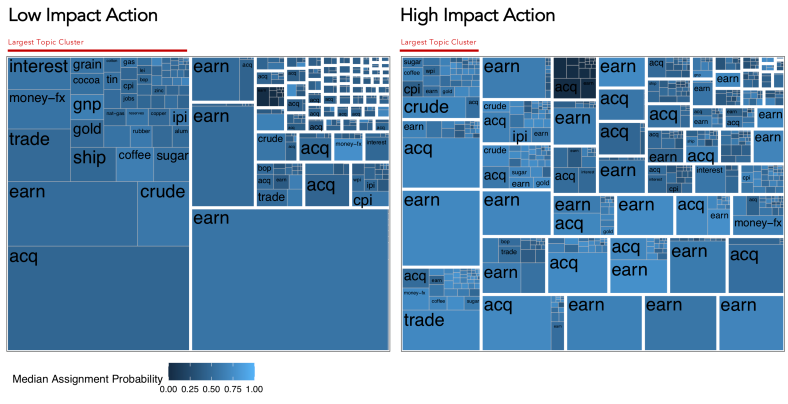
Two nested treemaps of high impact and low impact actions. The low impact action maintains a structure of one dominant topic containing a long-tailed distribution of ground truth topics. The high impact action ha a more uniform distribution of documents across topics, with no one topic clearly dominating.
4.2. Visual Analysis
While our simulation focused on how user actions impact holistic measures of topic model utility and interpretability, in many practical systems the analyst may only have access to a “snapshot” of the topic model at a particular instance. These visualizations often either present an overview of the entire corpus in terms of topic membership or detailed per-topic information. The former is limited in the amount of detailed changes that can be noticed (an analyst may not notice small changes in proportions of documents belonging to particular topic clusters), and the latter is limited by the amount of the complexity that can be shown at once: term-topic matrices, for instance, often only show a small number of “top” tokens or topics, as it is infeasible to provide information about tens of thousands of tokens in detail in one view, and rely on interactivity or different ordering metrics to opportunistically surface different parts of the dataset (Alexander et al., 2014). These abstractions and summarizations can result in the potential for AVD “failures” (Kindlmann and Scheidegger, 2014) (see Figure 2) or visualization “mirages” (McNutt et al., 2020), where either important updates to the model fail to be represented in a salient way in the resulting visualization, or the visualization of a model may be highly altered visually without much change to the underlying topics or classification accuracy.
In Figure 8 we show how high- and low-impact actions might be represented by a simple visualization system with a radial view of topic membership and a term-by-topic matrix view, both common summaries for individual topic models (§2.1.1). We use the score to select user actions that have low, middling, and high impact on the results of the topic modelling and document classification.
We visualize this impact through a sample design meant to emulate views that are common in standard topic model visualization systems (see §3.1.3 for more details). The lowest impact simulation is a user action that removes ubiquitous terms that occur in more that 75% of documents in a corpus, with an value very close to . Forgoing token stemming produces some impact, with . The user action with the largest impact is increasing the threshold at which rare terms are removed, with ; in this simulated action, the user opts to remove terms that occur in fewer than 10% of documents.
Comparing these actions to a baseline run we see that many visual and textual components of the summaries are highly variable across runs: for instance, the actual numeric label of a topic, e.g. “TOPIC_” is likely to change even if the identity of the topic in terms of posterior probabilities across documents or terms is similar. Likewise, since the posterior probabilities in the (sparse) term-topic matrix are quite small and variable, the actual subset of the matrix that is visualized can vary wildly. A selection criteria that takes into account ranking or joint probabilities (as in our case, where terms are selected for inclusion in the matrix based on the extent to which they appear in the top 100 most probable words across all of the top topics of interest) can result in reordered, mismatched, or even entirely disjoint sets of corpus-wide “top” words across runs, even between actions that do not otherwise create large difference in performance or text classifications.
However, other parts of the visualization remain unchanged unless dramatic changes to the model occur. For instance, the top words of individual top topics often were very similar across runs, perhaps changing order but not identity. Only extreme actions unreflective of common practice (such as deleting large percentages of rare words) were sufficient to produce large changes in top tokens for our large topics. Similarly, the overall distribution of documents is often qualitatively similar (a dominant topic and then a long tail of rarer topics) no matter the action simulated. Many of our actions (such as reducing the number of topics, or removing ubiquitous words, or merging topics together) were more likely to impact the tails of this assignment distribution, and so might be subtle or invisible in a visual, corpus-level overview.
Overall, we see that even a rudimentary summary of user impact, such as our score, surfaces a range of possible states in a human-in-the-loop process. Knowledge of these states allows both users and designers to consider resulting visual changes for cluster (Figure 7) and topic (Figure 8) quality. It would be fruitful future work to further evaluate how users interpret the impact of their own actions, and to what extent their perceptions aligns with existing performance and quality metrics. Our study here sets the foundation for such research by constructing the means to surface to users the impact of their actions.
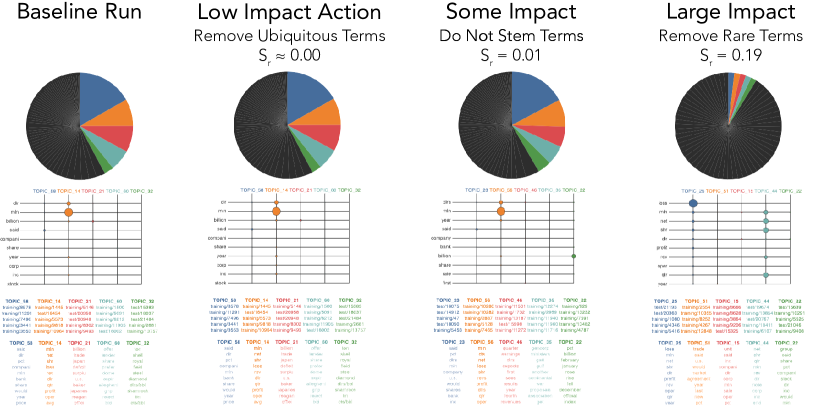
Four examples of visualizations of topic models: a baseline run before any actions are taken, and low impact, some impact, and large impact actions. The low impact action looks nearly visually identical to the baseline, whereas the large impact action has many differences, such as more uniform topic allocations and very different top terms and topics.
4.3. Additional Datasets
In the online materials we produce a similar set of results using the the COVID-19 Open Research Dataset Challenge (CORD-19). CORD-16 is a set of research publications made available by the Allen Institute for AI in partnership with other non-profit, academic, and governmental organizations. Initially released in March of 2020 it has been updated multiple times and has grown to encompass more than 200,000 documents with over 100,000 full texts. Here we examine a subset of 10,000 documents considering only titles and abstracts to make the analysis comparable to the Reuters-21578 dataset. Unlike the Reuters-21578 dataset, the CORD-19 dataset does not have any ground truth labels. Instead, we use these data to demonstrate how it is possible to use the predicted topic results from the baseline run as a ground truth to evaluate subsequent user actions. We show that the , which measures the magnitude of deviations from some baseline default run, is informative irrespective of whether an a priori ground truth labels exist. Indeed, the primary advantage of having a ground truth label is that is allows us to make judgements about the direction of change as well, specifically whether the overall model was improved or not. We did see in the Reuters-21578 that many of the user actions we simulated had a negative impact of model performance, but we could not make such an assessment for the CORD-19 data. When we consider individual user actions, we found that in the CORD-19 dataset removing ubiquitous terms had the largest impact with respect to the baseline run performance. We suspect this is because the CORD-19 dataset has much more related content compared to the documents in the Reuters-21578 dataset. However, the results from the CORD-19 confirm that user actions directly impact the feature space, which is part of data preparation, had large impacts. We also found that user actions appear to provoke larger changes in the CORD-19 dataset compared to the Reuters data. These findings underscore how important the characteristics of the initial dataset are not only on model performance but on the impact of user actions. Moreover, they demonstrate the utility of even a rudimentary metric like our score to surface these differences.
5. Discussion
We condense our findings down to a set of three important results:
The outsized influence of pre-processing steps in the resulting topic model. Many existing human-in-the-loop systems focus on manipulating a model once it has been generated (by e.g. adjusting clusters or providing classification feedback). However, the changes we observed from these sorts of manipulations were often times limited, whereas actions impacting the data model and the textual inputs into the topic model were much more influential.
The often subtle or poorly predicted impact of actions on the resulting topics, especially as they are commonly visualized with only a handful of topics or tokens “in focus” in a given time. Often actions would have to be extreme in degree (beyond what we would expect from “reasonable” tweaking of parameters) to reliably produce impacts that were visually apparent, while others would reliably produce large changes even at the lower levels of the parameters we tested.
The damaging impact of unprincipled actions on our various metrics related to accuracy and coherence. While many of our actions had impacts on our various quality and performance metrics, in nearly all cases this impact was negative. This points to either the reasonableness of our “default” parameters, or, perhaps more likely given the differing “defaults” we have observed in other topic modelling work and the unconstrained nature of our simulated actions, that random actions not motivated by a specific observed deficiency in the model are unlikely to have positive outcomes.
5.1. Implications for Design
Our findings above point to three potential implications for designers of future human-in-the-loop topic modelling systems (see Figure 9):
The need to surface provenance and data flow information. Given the complexities and degrees of freedom involved in processing text, differing options such as how to tokenize, stem, and filter texts are often not visualized in systems. These actions are either taken via smart defaults from the system, or left as options to power users hidden behind command line interfaces or low level libraries. These preparation-related actions were the most influential in our simulations, and we believe deserve additional consideration when visualizing topic models. Focusing on just user actions after the data preparation state such as cluster manipulation may be just an example of “rearranging deck chairs on the Titanic:” a large portion of the descriptive success or failure of the model may have already been decided by earlier, hidden decisions. The lack of provenance visualization has been portrayed as an ethical concern in current visualization practices (Correll, 2019). In topic modelling this deficiency is also a practical and pragmatic concern: without knowing how texts were prepared, it is difficult to compare or interpret topic models, especially across different states.
The need to alert users to the potential impact of their actions on the model. It was not clear to us, a priori, which actions would have large impacts on the resulting model (hence our lack of strong stated hypotheses to this effect); our suspicions were guided by point experiences and folklore. We expect that many potential analysts using topic models are in a similar situation. This lack of accurate intuitions, combined with the potential lack of visibility of the effects of actions, can create potential mismatches (algebraic or otherwise) in what the user intends to happen as the result of an action, and what actually results in the topic model. This suggests that designers of systems should employ testing or other regimes to flag potential mismatches, and surface these results to the users. We believe that our metrics and simulation pipeline provide natural support to this sort of user experience: the system could proactively calculate the impact of an action, and report the scale of this impact to the user. At the very least, we would caution designers from providing only one view of the topic model at a time: one individual perspective of a topic model (such as top terms, or top documents) may not suffice to reliably present what has changed or remained the same after a user action.
The need to guide users to help them decide amongst potential actions, or to explore (potentially analytically fruitful) paths not taken. El-Assady et al. (El-Assady et al., 2018b) is an example of what this sort of guidance might look like in a text analytics context: the system proposes optimizations based on speculative execution of particular branches of the parameter space. The direct exposure of the “forking paths” (Pu and Kay, 2018) or “multiverse” (Liu et al., 2020) of analyses could allow users to take ownership of the model while still being cognizant of changes to model structure or performance. A human-in-the-loop system need not simulate the entire complex parameter space, but, as in Lee et al.’s (Lee et al., 2019) “cruise control” metaphor, be guided by the user to particular areas, and then perform local exploration of parameter space to find areas with the best outcomes. In such a regime, it is also possible that designers will need to more tightly integrate uncertainty information into their topic model visualizations, as topic and text data could shift in ways that the model might be unable to predict.
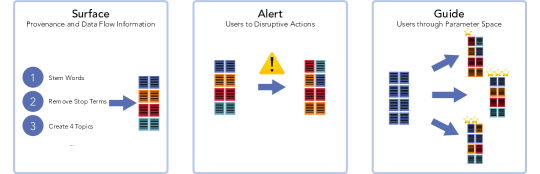
Abstract diagrams of our three categories of design recommendations. They are labeled: 1. Surface provenance and data flow information, 2. alert users to disruptive actions, and 3. guide users through parameter space.
5.2. Limitations & Future Work
Our simulations were relatively modest in scope, exploring the impact of only one individual action at a time. In a fully expressive human-in-the-loop topic modelling system, users would likely undertake a series of actions as they iteratively refine the data model and resulting topics. Simulating these actions requires both a concatenation of actions, and a more purposeful selection of tokens, topics, and texts upon which to operate. These actions are unlikely to be commutative, and thus the simulation of complex chains of user actions presents a combinatorial and analytical challenge. How this challenge is managed depends largely on how and when a pipeline or model is updated in response to a user action. Similarly, while we have deployed our simulation pipeline across multiple datasets, in this work we report mainly on one dataset. Although the score we use in our analysis appears able to transfer to other datasets, we already show here that impact of individual user actions is still dataset dependent. We encourage readers to examine the effects of user actions on their own datasets and caution against generalizing our findings to all possible text corpora. We have provided our pipeline as a means to do so and have developed it in such a way to extend to more complex and sequential user actions.
We see three immediate open avenues for future exploration. The first is to refine our results in order to construct and validate summary scales or metrics that can capture the many ways in which a topic model can change as a result of user actions. There are many potentially richer metrics to measure the coherency and user surprise engendered by a particular topic model. Richer models of impact would provide us with more confidence in making our proposed interventions (for instance, usefully alerting users to disruptive changes). On the other hand, a single (or a small set) of holistic, well-validated, informative, topic model change metrics would afford more streamlined communication between the user and the system, and provide guidance between alternative model choices even in unsupervised or partially-supervised settings.
Secondly, judging from our visual analyses, the connection between metric impact and human judgments or perception of that impact as instantiated in particular visualization tools is unclear. In future work, we intend on conducting human subjects experiments to anchor our suppositions about “noticeable” or “important” actions to human judgments, both in terms of our summary metrics but also in terms of our AVD analyses. More rigorous and human-centric analyses of impact could suggest more “robust” or “defensive” visualizations of topic models, or more proactive or collaborative topic modelling user experiences.
Lastly, we hope that this work points to the potential of simulation work to augment existing practices around more traditional user studies. Within the constraints of a short term user study, participants may only be able to explore a small portion of a total interaction space. Simulating these actions could be used to identify scenarios and settings in need of particular attention from follow-on user studies, or provide reasonable approximations in areas where user data are missing. Simulations could even be used to create models of the users’ mental models directly (as per the call in Kumar et al. (Kumar et al., 2019) to include informed priors in human-in-the-loop topic models), allowing a better channel of communication between human and algorithm.
5.3. Conclusion
In this work we use simulation as a design probe to explore the impact of potential user actions on an abstract human-in-the-loop topic modelling pipeline. We find that user actions are unevenly disruptive to these models, in ways that are not adequately captured by existing topic model visualizations or interactive systems. Our findings are important for designers who wish to leverage human knowledge and agency in their systems. Moreover, we believe that these results point to new and exciting research opportunities to realize the potential of human-in-the-loop text analytics through new metrics, visualization strategies, and user experiences.
Acknowledgements.
We would like to acknowledge our colleagues at Tableau and elsewhere who provided early feedback and motivating examples for this work: Zoë, Eric Alexander, Michael Arvold, Dan Cory, Kate Mann, Zach Morrissey, Britta Nielsen, Vidya Setlur, and Maureen Stone. We also thank the reviewers for their feedback.References
- (1)
- Alexander and Gleicher (2016) Eric Alexander and Michael Gleicher. 2016. Task-Driven Comparison of Topic Models. IEEE Transactions on Visualization and Computer Graphics 22, 1 (Jan. 2016), 320–329. https://doi.org/10.1109/TVCG.2015.2467618
- Alexander et al. (2014) Eric Alexander, Joe Kohlmann, Robin Valenza, Michael Witmore, and Michael Gleicher. 2014. Serendip: Topic model-driven visual exploration of text corpora. In 2014 IEEE Conference on Visual Analytics Science and Technology (VAST). 173–182. https://doi.org/10.1109/VAST.2014.7042493
- Bird et al. (2009) Steven Bird, Ewan Klein, and Edward Loper. 2009. Natural Language Processing with Python (1st ed.). O’Reilly Media, Inc.
- Blei et al. (2003) David M Blei, Andrew Y Ng, and Michael I Jordan. 2003. Latent Dirichlet Allocation. Journal of Machine Learning Research 3, Jan (2003), 993–1022.
- Brown et al. (2012) Eli T. Brown, Jingjing Liu, Carla E. Brodley, and Remco Chang. 2012. Dis-function: Learning distance functions interactively. In 2012 IEEE Conference on Visual Analytics Science and Technology (VAST). 83–92. https://doi.org/10.1109/VAST.2012.6400486
- Cao et al. (2010) Nan Cao, Jimeng Sun, Yu-Ru Lin, David Gotz, Shixia Liu, and Huamin Qu. 2010. Facetatlas: Multifaceted visualization for rich text corpora. IEEE Transactions on Visualization and Computer Graphics 16, 6 (2010), 1172–1181. https://doi.org/10.1109/TVCG.2010.154
- Chalmers (1993) Matthew Chalmers. 1993. Using a landscape metaphor to represent a corpus of documents. In European Conference on Spatial Information Theory. Springer, 377–390.
- Chang et al. (2009) Jonathan Chang, Jordan Boyd-Graber, Sean Gerrish, Chong Wang, and David M. Blei. 2009. Reading tea leaves: how humans interpret topic models. In Proceedings of the 22nd International Conference on Neural Information Processing Systems (NIPS’09). Curran Associates Inc., Vancouver, British Columbia, Canada, 288–296. https://www.aclweb.org/anthology/N15-1018.pdf
- Choo et al. (2010) Jaegul Choo, Hanseung Lee, Jaeyeon Kihm, and Haesun Park. 2010. iVisClassifier: An interactive visual analytics system for classification based on supervised dimension reduction. In 2010 IEEE Symposium on Visual Analytics Science and Technology. IEEE, 27–34.
- Chuang et al. (2013) Jason Chuang, Sonal Gupta, Christopher Manning, and Jeffrey Heer. 2013. Topic Model Diagnostics: Assessing Domain Relevance via Topical Alignment. In International Conference on Machine Learning. 612–620. http://proceedings.mlr.press/v28/chuang13.html ISSN: 1938-7228 Section: Machine Learning.
- Chuang et al. (2012a) Jason Chuang, Christopher D. Manning, and Jeffrey Heer. 2012a. Termite: visualization techniques for assessing textual topic models. In Proceedings of the International Working Conference on Advanced Visual Interfaces (AVI ’12). Association for Computing Machinery, Capri Island, Italy, 74–77. https://doi.org/10.1145/2254556.2254572
- Chuang et al. (2012b) Jason Chuang, Christopher D. Manning, and Jeffrey Heer. 2012b. Without the clutter of unimportant words: Descriptive keyphrases for text visualization. ACM Transactions on Computer-Human Interaction 19, 3 (Oct. 2012), 1–29. https://doi.org/10.1145/2362364.2362367
- Chuang et al. (2012c) Jason Chuang, Daniel Ramage, Christopher Manning, and Jeffrey Heer. 2012c. Interpretation and trust: designing model-driven visualizations for text analysis. In Proceedings of the 2012 ACM annual conference on Human Factors in Computing Systems - CHI ’12. ACM Press, Austin, Texas, USA, 443. https://doi.org/10.1145/2207676.2207738
- Chuang et al. (2015) Jason Chuang, Margaret E. Roberts, Brandon M. Stewart, Rebecca Weiss, Dustin Tingley, Justin Grimmer, and Jeffrey Heer. 2015. TopicCheck: Interactive Alignment for Assessing Topic Model Stability. In Proceedings of the 2015 Conference of the North American Chapter of the Association for Computational Linguistics: Human Language Technologies. Association for Computational Linguistics, Denver, Colorado, 175–184. https://doi.org/10.3115/v1/N15-1018
- Collins et al. (2009a) Christopher Collins, Sheelagh Carpendale, and Gerald Penn. 2009a. Docuburst: Visualizing document content using language structure. In Computer Graphics Forum, Vol. 28. Wiley Online Library, 1039–1046. https://doi.org/10.1111/j.1467-8659.2009.01439.x
- Collins et al. (2009b) Christopher Collins, Fernanda B Viegas, and Martin Wattenberg. 2009b. Parallel tag clouds to explore and analyze faceted text corpora. In 2009 IEEE Symposium on Visual Analytics Science and Technology. IEEE, 91–98.
- Conti et al. (2005) Gregory Conti, Mustaque Ahamad, and John Stasko. 2005. Attacking information visualization system usability overloading and deceiving the human. In Proceedings of the 2005 Symposium on Usable Privacy and Security. 89–100.
- Correll (2019) Michael Correll. 2019. Ethical dimensions of visualization research. In Proceedings of the 2019 CHI Conference on Human Factors in Computing Systems. 1–13. https://doi.org/10.1145/3290605.3300418
- Correll and Gleicher (2012) Michael Correll and Michael Gleicher. 2012. What shakespeare taught us about text visualization. In IEEE Visualization Workshop Proceedings: The 2nd Workshop on Interactive Visual Text Analytics: Task-Driven Analysis of Social Media Content.
- Correll et al. (2018) Michael Correll, Mingwei Li, Gordon Kindlmann, and Carlos Scheidegger. 2018. Looks good to me: Visualizations as sanity checks. IEEE Transactions on Visualization and Computer Graphics 25, 1 (2018), 830–839. https://doi.org/10.1109/TVCG.2018.2864907
- Crisan et al. (2019) Anamaria Crisan, Tamara Munzner, and Jennifer L. Gardy. 2019. Adjutant: an R-based tool to support topic discovery for systematic and literature reviews. Bioinformatics 35, 6 (March 2019), 1070–1072. https://doi.org/10.1093/bioinformatics/bty722
- Da (2019) Nan Z Da. 2019. The computational case against computational literary studies. Critical inquiry 45, 3 (2019), 601–639.
- DeVito et al. (2018) Michael A DeVito, Jeffrey T Hancock, Megan French, Jeremy Birnholtz, Judd Antin, Karrie Karahalios, Stephanie Tong, and Irina Shklovski. 2018. The algorithm and the user: How can HCI use lay understandings of algorithmic systems?. In Extended Abstracts of the 2018 CHI Conference on Human Factors in Computing Systems. ACM, panel04. https://doi.org/10.1145/3170427.3188404
- Dragicevic et al. (2019) Pierre Dragicevic, Yvonne Jansen, Abhraneel Sarma, Matthew Kay, and Fanny Chevalier. 2019. Increasing the transparency of research papers with explorable multiverse analyses. In Proceedings of the 2019 CHI Conference on Human Factors in Computing Systems. 1–15. https://doi.org/10.1145/3290605.3300295
- El-Assady et al. (2018a) Mennatallah El-Assady, Rita Sevastjanova, Fabian Sperrle, Daniel Keim, and Christopher Collins. 2018a. Progressive Learning of Topic Modeling Parameters: A Visual Analytics Framework. IEEE Transactions on Visualization and Computer Graphics 24, 1 (Jan. 2018), 382–391. https://doi.org/10.1109/TVCG.2017.2745080
- El-Assady et al. (2018b) Mennatallah El-Assady, Fabian Sperrle, Oliver Deussen, Daniel Keim, and Christopher Collins. 2018b. Visual analytics for topic model optimization based on user-steerable speculative execution. IEEE Transactions on Visualization and Computer Graphics 25, 1 (2018), 374–384. https://doi.org/10.1109/TVCG.2018.2864769
- Fang et al. (2016) Anjie Fang, Craig Macdonald, Iadh Ounis, and Philip Habel. 2016. Using word embedding to evaluate the coherence of topics from Twitter data. In Proceedings of the 39th International ACM SIGIR conference on Research and Development in Information Retrieval. 1057–1060.
- Fothergill et al. (2016) Richard Fothergill, Paul Cook, and Timothy Baldwin. 2016. Evaluating a topic modelling approach to measuring corpus similarity. In Proceedings of the Tenth International Conference on Language Resources and Evaluation (LREC’16). 273–279.
- Freire (2012) Juliana Freire. 2012. Making computations and publications reproducible with VisTrails. Computing in Science & Engineering 14, 4 (2012), 18–25.
- Glueck et al. (2018) Michael Glueck, Mahdi Pakdaman Naeini, Finale Doshi-Velez, Fanny Chevalier, Azam Khan, Daniel Wigdor, and Michael Brudno. 2018. PhenoLines: Phenotype Comparison Visualizations for Disease Subtyping via Topic Models. IEEE Transactions on Visualization and Computer Graphics 24, 1 (Jan. 2018), 371–381. https://doi.org/10.1109/TVCG.2017.2745118
- Heer (2019) Jeffrey Heer. 2019. Agency plus automation: Designing artificial intelligence into interactive systems. Proceedings of the National Academy of Sciences 116, 6 (2019), 1844–1850.
- Hirschberg (1998) J Hirschberg. 1998. Every time I fire a linguist, my performance goes up, and other myths of the statistical natural language processing revolution. Invited talk. In Fifteenth National Conference on Artificial Intelligence (AAAI-98).
- Hope and Witmore (2010) Jonathan Hope and Michael Witmore. 2010. The Hundredth Psalm to the Tune of” Green Sleeves”: Digital Approaches to Shakespeare’s Language of Genre. Shakespeare Quarterly 61, 3 (2010), 357–390.
- Huang (2008) Anna Huang. 2008. Similarity measures for text document clustering. In Proceedings of the Sixth New Zealand Computer Science Research Student Conference (NZCSRSC2008), Christchurch, New Zealand, Vol. 4. 9–56.
- Jacobi et al. (2016) Carina Jacobi, Wouter Van Atteveldt, and Kasper Welbers. 2016. Quantitative analysis of large amounts of journalistic texts using topic modelling. Digital Journalism 4, 1 (2016), 89–106.
- Jain et al. (1999) Anil K Jain, M Narasimha Murty, and Patrick J Flynn. 1999. Data clustering: a review. ACM computing surveys (CSUR) 31, 3 (1999), 264–323.
- Kale et al. (2019) Alex Kale, Matthew Kay, and Jessica Hullman. 2019. Decision-making under uncertainty in research synthesis: Designing for the garden of forking paths. In Proceedings of the 2019 CHI Conference on Human Factors in Computing Systems. 1–14. https://doi.org/10.1145/3290605.3300432
- Kindlmann and Scheidegger (2014) Gordon Kindlmann and Carlos Scheidegger. 2014. An algebraic process for visualization design. IEEE Transactions on Visualization and Computer Graphics 20, 12 (2014), 2181–2190. https://doi.org/10.1109/TVCG.2014.2346325
- Kucher and Kerren (2015) Kostiantyn Kucher and Andreas Kerren. 2015. Text visualization techniques: Taxonomy, visual survey, and community insights. In 2015 IEEE Pacific Visualization Symposium (PacificVis). IEEE, 117–121.
- Kumar et al. (2019) Varun Kumar, Alison Smith-Renner, Leah Findlater, Kevin Seppi, and Jordan Boyd-Graber. 2019. Why Didn’t You Listen to Me? Comparing User Control of Human-in-the-Loop Topic Models. In Proceedings of the 57th Annual Meeting of the Association for Computational Linguistics. 6323–6330.
- Lau et al. (2014) Jey Han Lau, David Newman, and Timothy Baldwin. 2014. Machine reading tea leaves: Automatically evaluating topic coherence and topic model quality. In Proceedings of the 14th Conference of the European Chapter of the Association for Computational Linguistics. https://www.aclweb.org/anthology/E14-1056.pdf
- Lee et al. (2019) Doris Jung Lin Lee, Stephen Macke, Doris Xin, Angela Lee, Silu Huang, and Aditya G Parameswaran. 2019. A Human-in-the-loop Perspective on AutoML: Milestones and the Road Ahead. Bulletin of the IEEE Computer Society Technical Committee on Data Engineering 42, 2 (2019), 59–70.
- Lee et al. (2017) Tak Yeon Lee, Alison Smith, Kevin Seppi, Niklas Elmqvist, Jordan Boyd-Graber, and Leah Findlater. 2017. The Human Touch: How Non-Expert Users Perceive, Interpret, and Fix Topic Models. International Journal of Human-Computer Studies 105 (2017), 28–42.
- Lewis (1997) David Lewis. 1997. Reuters-21578 Text Categorization Test Collection, Distribution 1.0. http://www.daviddlewis.com/resources/testcollections/reuters21578/
- Lipton and Steinhardt (2019) Zachary C Lipton and Jacob Steinhardt. 2019. Troubling trends in machine learning scholarship. Queue 17, 1 (2019), 45–77.
- Liu et al. (2019) Yang Liu, Eunice Jun, Qisheng Li, and Jeffrey Heer. 2019. Latent space cartography: Visual analysis of vector space embeddings. In Computer Graphics Forum, Vol. 38. Wiley Online Library, 67–78. https://doi.org/10.1111/cgf.13672
- Liu et al. (2020) Yang Liu, Alex Kale, Tim Althoff, and Jeffrey Heer. 2020. Boba: Authoring and visualizing multiverse analyses. IEEE Transactions on Visualization and Computer Graphics (2020). https://doi.org/10.1109/TVCG.2020.3028985
- Mao et al. (2012) Xian-Ling Mao, Zhao-Yan Ming, Tat-Seng Chua, Si Li, Hongfei Yan, and Xiaoming Li. 2012. SSHLDA: a semi-supervised hierarchical topic model. In Proceedings of the 2012 Joint Conference on Empirical Methods in Natural Language Processing and Computational Natural Language Learning (EMNLP-CoNLL ’12). Association for Computational Linguistics, Jeju Island, Korea, 800–809.
- McNutt et al. (2020) Andrew McNutt, Gordon Kindlmann, and Michael Correll. 2020. Surfacing Visualization Mirages. In Proceedings of the 2020 CHI Conference on Human Factors in Computing Systems. 1–16. https://doi.org/10.1145/3313831.3376420
- Moretti (2005) Franco Moretti. 2005. Graphs, maps, trees: abstract models for a literary history. Verso.
- O’Neil (2016) Cathy O’Neil. 2016. Weapons of math destruction: How big data increases inequality and threatens democracy. Broadway Books.
- Paul et al. (2019) Celeste Lyn Paul, Jessica Chang, Alex Endert, Nick Cramer, David Gillen, Shawn Hampton, Russ Burtner, Ralph Perko, and Kristin A Cook. 2019. TexTonic: Interactive visualization for exploration and discovery of very large text collections. Information Visualization 18, 3 (July 2019), 339–356. https://doi.org/10.1177/1473871618785390
- Pedregosa et al. (2011) F. Pedregosa, G. Varoquaux, A. Gramfort, V. Michel, B. Thirion, O. Grisel, M. Blondel, P. Prettenhofer, R. Weiss, V. Dubourg, J. Vanderplas, A. Passos, D. Cournapeau, M. Brucher, M. Perrot, and E. Duchesnay. 2011. Scikit-learn: Machine Learning in Python. Journal of Machine Learning Research 12 (2011), 2825–2830.
- Pu and Kay (2018) Xiaoying Pu and Matthew Kay. 2018. The Garden of Forking Paths in Visualization: A Design Space for Reliable Exploratory Visual Analytics: Position Paper. In 2018 IEEE Evaluation and Beyond-Methodological Approaches for Visualization (BELIV). IEEE, 37–45.
- Rensink (2014) Ronald A Rensink. 2014. On the prospects for a science of visualization. In Handbook of Human Centric Visualization. Springer, 147–175.
- Roberts et al. (2016) Margaret E Roberts, Brandon M Stewart, and Dustin Tingley. 2016. Navigating the local modes of big data. Computational Social Science 51 (2016).
- Smith et al. (2018) Alison Smith, Varun Kumar, Jordan Boyd-Graber, Kevin Seppi, and Leah Findlater. 2018. Closing the Loop: User-Centered Design and Evaluation of a Human-in-the-Loop Topic Modeling System. In 23rd International Conference on Intelligent User Interfaces (Tokyo, Japan) (IUI ’18). Association for Computing Machinery, New York, NY, USA, 293–304. https://doi.org/10.1145/3172944.3172965
- Steyvers and Griffiths (2007) Mark Steyvers and Tom Griffiths. 2007. Probabilistic topic models. Handbook of latent semantic analysis 427, 7 (2007), 424–440.
- Tory et al. (2007) Melanie Tory, David Sprague, Fuqu Wu, Wing Yan So, and Tamara Munzner. 2007. Spatialization design: Comparing points and landscapes. IEEE Transactions on Visualization and Computer Graphics 13, 6 (2007), 1262–1269. https://doi.org/10.1109/TVCG.2007.70596
- Wang et al. (2017) Bo Wang, Maria Liakata, Arkaitz Zubiaga, and Rob Procter. 2017. A hierarchical topic modelling approach for tweet clustering. In International Conference on Social Informatics. Springer, 378–390.
- Wise et al. (1995) James A Wise, James J Thomas, Kelly Pennock, David Lantrip, Marc Pottier, Anne Schur, and Vern Crow. 1995. Visualizing the non-visual: Spatial analysis and interaction with information from text documents. In Proceedings of Visualization 1995 Conference. IEEE, 51–58.
- Yang et al. (2016) Yi Yang, Jian Wang, Weixing Huang, and Guigang Zhang. 2016. TopicPie: An Interactive Visualization for LDA-Based Topic Analysis. In 2016 IEEE Second International Conference on Multimedia Big Data (BigMM). IEEE, Taipei, Taiwan, 25–32. https://doi.org/10.1109/BigMM.2016.25
- Yang et al. (2017) Yi Yang, Quanming Yao, and Huamin Qu. 2017. VISTopic: A visual analytics system for making sense of large document collections using hierarchical topic modeling. Visual Informatics 1, 1 (March 2017), 40–47. https://doi.org/10.1016/j.visinf.2017.01.005
- Zhao and Karypis (2004) Ying Zhao and George Karypis. 2004. Empirical and theoretical comparisons of selected criterion functions for document clustering. Machine Learning 55, 3 (2004), 311–331.