The Connection between Mergers and AGN Activity in Simulated and Observed Massive Galaxies
Abstract
We analyze a suite of high-resolution zoom-in cosmological hydrodynamic simulations of massive galaxies with stellar masses , with the goal of better understanding merger activity among AGN, AGN activity in merging systems, SMBH growth during mergers, and the role of gas content in triggering AGN. Using the radiative transfer code Powderday, we generate HST-WFC3 F160W mock observations of central galaxies at redshift ; convolve each image with a CANDELS-like PSF; stitch each image into a real CANDELS image; and identify mergers within the synthetic images using commonly adopted non-parametric statistics. We study the connection between mergers and AGN activity in both the simulations and synthetic images and find reasonable agreement with observations from CANDELS. We find that AGN activity is not primarily driven by major mergers (stellar mass ratio 1:4) except in a select few cases of gas-rich mergers at low redshifts . We also find that major mergers do not significantly grow the central SMBHs, indicating major mergers do not sustain long-term accretion. Moreover, the most luminous AGN in our simulations erg s are no more likely than inactive galaxies erg s to be found in merging systems. We conclude that mergers are not the primary drivers of AGN activity in the simulated massive galaxies studied here.
keywords:
> (galaxies:) quasars: general – galaxies: interactions – galaxies: active1 Introduction
Supermassive black holes (SMBHs) are thought to be ubiquitous within massive galaxies (Magorrian et al., 1997; Kormendy & Ho, 2013). However, it is still a mystery why gas accretion rates onto these SMBH are low to negligible in some galaxies and extremely high in others. In order to power the most luminous quasars, nearly the whole gas content of a massive galaxy must be funneled onto the black hole in a few hundred million years, or roughly a dynamical time (Hopkins et al., 2008a). The primary mechanism that triggers episodes of rapid accretion, which give rise to the observational signatures of active galactic nuclei (AGN), is still unclear. Galaxy interactions offer a compelling candidate for a number of reasons. Mergers and interactions can dissipate angular momentum and channel gas into galactic nuclei (Barnes & Hernquist, 1991; Springel et al., 2005a; Gabor et al., 2016; Blumenthal & Barnes, 2018). This may simultaneously funnel gas onto the central SMBH and drive star formation in the bulge, helping to explain tight observed correlations between SMBH and galaxy bulge properties (Gebhardt et al., 2000; Ferrarese & Merritt, 2000; Marconi & Hunt, 2003; Häring & Rix, 2004).
Furthermore, major mergers can transform rotation-supported disk-dominated galaxies into pressure-supported spheroid-dominated galaxies, while AGN feedback may efficiently heat and drive gas out of the galaxy, leading to the quenching of star formation. Thus, a link between mergers and AGN triggering could explain the observed correlation between spheroid-like morphologies and kinematics, and old stellar populations (Somerville & Davé, 2015; Kormendy & Ho, 2013, and references therein). It has been shown using empirical and semi-analytic models that, under the ansatz that mergers trigger AGN activity, the observed merger rate can account for the observed evolution of the AGN luminosity function (Hopkins et al., 2006, 2008a), as well as the observed growth rate of quenched, spheroid dominated galaxies (Hopkins et al., 2006, 2008b; Somerville et al., 2008; Brennan et al., 2015).
However, there are numerous other possible mechanisms for fueling accretion onto black holes and, thereby AGN activity. Alternative mechanisms that can funnel gas towards the centres of galaxies have been identified, including secular processes such as bar instabilities (Kormendy & Kennicutt, 2004; Hirschmann et al., 2012) and violently unstable and/or clumpy disks (Dekel et al., 2009; Bournaud et al., 2011; Mullaney et al., 2012). In addition, recycled gas from the evolution of stars in the galaxy’s nucleus can fuel significant AGN activity (Ciotti & Ostriker, 1997, 2007). Cooling flows from the hot halo are another proposed fueling mechanism (Nulsen & Fabian, 2000). Recent work using high-resolution simulations of massive ellipticals has highlighted the importance of cooling flows fueled by stellar evolution in generating AGN outbursts (Gan et al., 2019; Pellegrini et al., 2020; Gan et al., 2020).
Observations do not clearly show the connection between AGN and galaxy mergers. Many observational studies, using a variety of techniques, find mergers to be correlated with AGN activity (e.g. Sanders et al., 1988; Koss et al., 2012; Satyapal et al., 2014). Many studies have shown that AGN have a higher interaction fraction of mergers (or interaction) than non-AGN control samples in the local universe (e.g. Koss et al., 2010; Cotini et al., 2013) and intermediate redshift range (e.g. Bessiere et al., 2012). Other studies showed that galaxies exhibiting merger features have higher AGN fractions than non-interacting control samples in the local universe (Ellison et al., 2011; Weston et al., 2017; Ellison et al., 2019), and intermediate redshift range (Silverman et al., 2011; Lackner et al., 2014). On the other hands, many observational studies find that mergers do not correlate with AGN activity (De Robertis et al., 1998; Li et al., 2008; Schawinski et al., 2012). Especially at high redshifts, the AGN-merger connection appears to be weak – specifically, many observational studies have not found a difference in the merger fraction between AGN and mass-matched non-AGN samples (Kocevski et al., 2012; Mechtley et al., 2016; Marian et al., 2019). A study comparing X-ray selected AGN and inactive galaxies in the intermediate redshift range of found a similar trend (Grogin et al., 2005; Gabor et al., 2009; Cisternas et al., 2011; Villforth et al., 2014). Even at low redshifts, many studies did not find differences in interaction and/or merger fractions between active and inactive galaxies (e.g. Reichard et al., 2009; Sabater et al., 2015). Studies supporting an AGN-merger connection typically find the most luminous AGN () are preferentially found in disturbed systems (Treister et al., 2012; Glikman et al., 2015; Goulding et al., 2018). Further, AGN with significant obscuration are more likely than unobscured AGN to be found in galaxies showing evidence of interactions or merging (Glikman et al., 2015; Fan et al., 2016; Weston et al., 2017; Goulding et al., 2018; Donley et al., 2018).
Simulations draw similar mixed conclusions on the AGN-merger connection. Studies using hydrodynamic simulations of binary mergers of idealized galaxies demonstrated clear triggering of gas inflows to the nucleus and resulting starburst and AGN activity (Springel et al., 2005b; Di Matteo et al., 2005; Hopkins et al., 2005; Choi et al., 2012). Dubois et al. (2015) find that mergers are the dominant mechanism for AGN fueling within their zoom-in cosmological simulation of halo at . Once a galaxy grows above stellar mass threshold, they found that galaxies can confine nuclear inflows from mergers and sustain BH accretion. McAlpine et al. (2020) find an over-abundance of luminous AGN in disturbed systems with within the Eagle cosmological hydrodynamic simulation (Schaye et al., 2015; Crain et al., 2015), with AGN activity peaking immediately after galaxy coalescence. However, they also find the majority of SMBH growth does not occur during mergers.
Some simulations find that mergers are difficult to disentangle from smooth gas accretion, as these processes tend to occur together in cosmological simulations. Bellovary et al. (2013) trace the origins of gas particles accreted by SMBHs in cosmological zoom simulations and find SMBHs are not preferentially fueled by either smoothly-accreted or merger-accreted gas. Similarly, Menci et al. (2014) use semi-analytic models to investigate disk instabilities in AGN, finding that mergers and disk instabilities are viable candidates as the dominant fueling mechanism.
Finally, other simulations find mergers are not the primary mode by which AGN are triggered. Steinborn et al. (2018) find that merger fractions in the Magneticum Pathfinder cosmological simulation are three times higher within AGN hosts than inactive galaxies. However, they find merging systems make up less than of AGN hosts, hence mergers play a minor role in driving the overall AGN population. Hirschmann et al. (2012) show that semi-analytic models where SMBH growth is driven by mergers can reproduce the AGN luminosity function at intermediate redshifts and luminosities, but an additional accretion mode via disc instabilities is required in order to fully reproduce the number densities of the most luminous AGN.
There are a number of explanations for the confusing status of the question of whether mergers play a vital role in AGN activity and BH growth. First, selecting AGN is not a straightforward task. AGN emission spans a broad range of wavelengths, and the radiation can originate from many different phenomena, including the accretion disk, dust obscuring structures, and jets. Second, identifying galaxy mergers is also not a straightforward task. Mergers have been commonly identified by visual inspection (Bridge et al., 2007; Jogee et al., 2009; Darg et al., 2010; Kartaltepe et al., 2015; Rosario et al., 2015), close pairs (Lackner et al., 2014; Mundy et al., 2017; Mantha et al., 2018), non-parametric morphological diagnostics (Conselice et al., 2003; Lotz et al., 2004; Pawlik et al., 2016; Nevin et al., 2019), and statistical learning techniques (Hocking et al., 2018; Goulding et al., 2018; Ackermann et al., 2018; Snyder et al., 2019). Each method may be particularly sensitive or insensitive to certain merger stages or may be limited by the availability of data. Few previous studies have attempted to select both mergers and AGN in the same way in an observational sample and a cosmological simulation in order to robustly determine whether the AGN-merger connection seen in current simulations is consistent with observations.
In this work, we analyze a set of zoom-in cosmological simulations to better understand the connection between mergers and AGN activity. In particular, we aim to answer whether 1) AGN are more likely to be found in disturbed or merging galaxies than a control sample, and 2) mergers/disturbed galaxies are more likely to host AGN. Studying high-resolution galaxy simulations in a cosmological context allows us to better understand how AGN may be triggered by mergers, how SMBHs grow during periods of merger activity, and how gas content plays into SMBH fueling. To select mergers in the same way as observers do, we mock-observe the simulations and generate noise-added images similar to HST-WFC3 F160W images. By comparing both intrinsic and synthetic merger statistics, we hope to understand better the role of observational selection effects in this problem. We compute a standard suite of non-parametric morphological statistics on both the synthetic images and the real CANDELS images and use machine learning to identify selection criteria that more accurately and robustly identify true mergers in the simulations.
In Section 2, we summarize the basic physical ingredients of the cosmological zoom-in simulations used in this study. In Section 3, we detail the pipeline for generating synthetic images, adding noise, and measuring morphological parameters. We also detail the training and testing of an automated classifier for identifying mergers from synthetic images. In Section 4, we explore how merger statistics vary for AGN versus inactive galaxies. We also explore how mergers influence AGN activity, how they impact overall SMBH growth, and what role gas plays in the fueling of AGN.
2 Simulation
We use the cosmological zoom-in simulations of massive galaxy formation presented in Choi et al. (2017). Here we give a brief summary of the code basics, physics, and feedback models we use in the simulation, but we refer the readers to Choi et al. (2017) for a detailed description of the simulations.
2.1 Simulation properties
The SPHGal (Hu et al., 2014) code, a modified version of the parallel smoothed particle hydrodynamics (SPH) code GADGET-3 (Springel, 2005), was used to run the simulations. SPHGal includes many improvements to overcome the numerical fluid-mixing problems of classical SPH codes, such as a density-independent pressure-entropy SPH formulation and an improved artificial viscosity implementation (see Hu et al., 2014, for details). The initial conditions are drawn from Oser et al. (2010) with the cosmological parameters of WMAP3 (Spergel et al., 2007, , , , , , and ). In this work, we use cosmological zoom-in hydrodynamic simulations of massive halos adopting the fiducial model of Choi et al. (2017). The total masses of the central halos at are , and stellar masses are . The baryonic (star and gas particle) mass resolution is , and the dark matter particle resolution is . The comoving gravitational softening lengths are for the gas and star particles and for the dark matter particles. Halos are identified on the fly within the zoom-in simulation using a friends-of-friends algorithm at regular time intervals.
The simulations include chemical evolution, metal cooling, and diffusion. The chemical evolution of 11 different species, H, He, C, N, O, Ne, Mg, Si, S, Ca, and Fe, are traced explicitly for star and gas particles with the chemical yields adopted respectively from Iwamoto et al. (1999); Woosley & Weaver (1995); Karakas (2010) for Type I, Type II SNe and AGB stars. In addition, the simulations include a redshift-dependent UV/X-ray cosmic microwave background from Haardt & Madau (2001), and the cooling rate from Wiersma et al. (2009) for optically thin gas in ionization equilibrium. Finally, the metal diffusion model is adopted from Aumer et al. (2013), and allows the metal-enriched gas particles to mix their metals with neighbouring gas particles via turbulent diffusion.
2.2 Star Formation and Stellar Feedback
The star formation rate is calculated as where , and are the stellar and gas densities, and local dynamical time for gas particle respectively, with the star formation efficiency set to . The simulation stochastically forms star particles in high-density regions where the gas density exceeds a density threshold, . The critical threshold density and temperature are cm-3 and K and is the gas particle mass at the fiducial resolution.
The simulations include the stellar feedback model of Núñez et al. (2017), which consists of the winds from young massive stars, UV heating within Strömgren spheres of young stars, the three-phase supernova feedback from type I and type II SNe, and metals and outflows from low-mass AGB stars.
Before the moment of the SN explosion, the young stellar particles inject the same amount of mass and momentum as those of type II SN explosions evenly spread in time to the surrounding ISM via winds from young massive stars. Their ionizing radiation also gradually heats the neighbouring gas particles to K within a Strömgren radius (Strömgren, 1939).
The SNe model assumes that a single SN event ejects mass in an outflow with a velocity to the surrounding ISM when star particles explode as SNe. Each neighbouring gas particle is affected by one of the three successive phases of SN depending on the physical distance from the SN particle: (i) momentum-conserving free expansion phase, (ii) energy-conserving Sedov-Taylor phase where SN energy is transferred with 30% as kinetic and 70% as thermal, and (iii) the snowplow phase where radiative cooling becomes dominant. Then, both kinetic and thermal energy modes dissipate with distance from the SN in the pressure-driven snowplow phase of SN remnants.
Even after a SN event, old stellar particles keep distributing energy, momentum, and metals via AGB winds. The outflowing wind velocity of AGB stars is assumed to be , following the typical observed outflowing velocities of AGB driven winds (e.g. Nyman et al., 1992).
In this model, various mass-loss events such as winds from young stars, SNe, and AGB stars provide recycled gas, which can fuel late star formation and also AGN activity by feeding the central supermassive black holes (e.g. Ciotti et al., 2010). With an assumed Kroupa (2001) IMF, over 30% of the total mass in stellar particles returns to the ISM within Gyr of evolution.
2.3 Black Hole Physics and AGN Feedback
In the simulations, the black holes are treated as collisionless sink particles and seeded with a mass of in newly formed dark matter halos with mass above . The black hole can grow via mergers with other black holes and direct gas accretion. Two black holes merge when they are within their local SPH smoothing lengths, and their relative velocities are less than the local sound speed. The rate of the gas infall onto the black hole is estimated with a Bondi-Hoyle-Lyttleton parameterization (Hoyle & Lyttleton, 1939; Bondi & Hoyle, 1944; Bondi, 1952): , where , , and are respectively the gas density, the sound speed and the velocity of the gas relative to the black hole. The simulations also include the soft Bondi criterion introduced in Choi et al. (2012) to prevent the unphysical infall of gas outside the Bondi radius. This model statistically limits the accretion to the gas within the Bondi radius.
Black hole modelling also includes the mechanical and radiative AGN feedback model described in Choi et al. (2012, 2015). In this model, the BH imparts mass and momentum to the surrounding gas in a manner that mimics observed AGN-driven outflows (e.g. Arav et al., 2020). As AGN winds carry a mass, only a fraction of inflowing gas mass will accrete onto the black hole as where , and are the outflowing/inflowing mass rate and the mass accretion rate to the black hole respectively. The model assumes a constant AGN-driven wind velocity of , and the wind energy is calculated as , where the feedback efficiency parameter is set to to reproduce the present day relation (Choi et al., 2017). Then the mass flux and momentum flux carried by the AGN-driven winds are calculated as and . In short, when the inflow of gas feeds the central black hole, it launches fast winds carrying a momentum flux of . The direction of the wind is set to be parallel or anti-parallel to the angular momentum vector of each gas particle accreted by the black hole to mimic a wind perpendicular to the disk plane.
The heating and associated radiation pressure effect from moderately hard X-ray radiation ( keV) from the accreting black hole are also included. Heating and radiation pressure follow the AGN spectrum and Compton/photoionization heating prescription from Sazonov et al. (2004, 2005), including the associated radiation pressure directed away from the black hole. In these simulations, super-Eddington gas accretion occasionally occurs as the accretion rate onto the black holes is not artificially capped at the Eddington rate. Instead, the simulations include an Eddington force acting on electrons in gas particles, directed radially away from the black hole so that the corresponding feedback effects can reduce the gas inflow.
3 Methods
We now walk through the various methods used throughout this paper. Throughout our analysis, we refer to “intrinsic” properties, which are extracted directly from the simulations, and “synthetic” properties, which are calculated from the mock-observed images.
We focus on galaxies within the redshift range where CANDELS can well-resolve massive galaxies (Barro et al., 2019), mergers are common (e.g, O’Leary et al., 2021), and AGN are common within CANDELS (e.g, Kocevski et al., 2012). For each halo, we select the snapshots spanning our redshift range of interest, yielding snapshots. We further select snapshots where the halo-finder can accurately track the main halo, paring the total down to simulation snapshots. Using a friends-of-friends algorithm on gas + star particles, we identify stellar companions surrounding the main galaxy. Next, we measure the intrinsic properties of mergers and AGN activity within the simulation snapshots. We then use those snapshots to generate mock observations and measure morphological parameters from each mock observation. Finally, we train a machine learning classifier on the intrinsic merger information to measure merger information from the mock observations. This classifier allows us to reasonably compare mergers derived from the mock observations and those intrinsic to the simulation.
Throughout our analysis, we compare to CANDELS data from Kocevski et al. (2012); Rosario et al. (2015) out to , which include galaxy morphologies measured in the F160W band from the EGS, UDS, GOODS-S, and GOODS-N fields. X-ray follow-up in all but the UDS CANDELS fields comes from publicly available Chandra point-source catalogues. They use the 4 Ms (Xue et al., 2011) and 2 Ms (Xue et al., 2016) point-source catalogues for GOODS South and North, and the 800 ks catalogue (Nandra et al., 2015) for EGS. For UDS, they use a 600 ks source catalogue from the X-UDS survey (Kocevski et al., 2018). We also compile stellar masses from catalogues for GOODS South and UDS (Santini et al., 2015), EGS (Stefanon et al., 2017), and GOODS North (Barro et al., 2019). When directly comparing to CANDELS, we mass-match CANDELS galaxies to match our simulated stellar masses.
3.1 Identifying Intrinsic Mergers
Observations of AGN within merging systems find the most luminous AGN in the latest stages of major mergers (Ellison et al., 2013; Koss et al., 2018). If galaxy mergers fuel AGN activity, we expect a time delay between companion coalescence and the start of AGN activity. The observability timescales of merger features have been found to be between Gyr (Lotz et al., 2010; Ji et al., 2014), though Mantha et al. (2018) find that observability timescales evolve with redshift.
We identify mergers in the simulation using a close pairs method similar to Ferreira et al. (2020), in which stellar companions above a stellar mass ratio, , fall within some 3D physical distance, , of the primary galaxy’s centre. Furthermore, we impose the additional criteria that companions have low 3D velocities relative to the main galaxy km s-1 (Mantha et al., 2018; Ventou et al., 2019). Starting at in each zoom, we trace the primary halo’s merger tree backward in cosmic time and search for snapshots where a companion meets our merging criteria. We label snapshots where at least one valid close pair is found as the central snapshot of the merger event, . Then, all earlier+later snapshots within a chosen timescale are also marked as part of the merger event.
In this work, we calculate mass ratios by taking the stellar mass of companions at the time close pairs are identified. However, Rodriguez-Gomez et al. (2015) find that calculating mass ratios based on companion stellar mass prior to infall helps mitigate the various effects of merging on stellar mass (e.g., through stripping or induced star formation). Although our method better matches how close pairs are identified by observers and side-steps the complexities of tracing the stellar progenitor history, our method is also impacted by the companion-finder’s ability to correctly measure companion stellar masses at small separations. We expect the number of detectable minor mergers to be significantly reduced relative to some other merger identification methods. As such, we limit our explored mass ratios to only major mergers, . According to our definition of major merger, 21 simulated galaxies out of 29 have at least one major merger event in their lifetime.
In determining a pair separation, we analyzed common separations from the literature (Lotz et al., 2010; Bignone et al., 2017). However, maximum separations much smaller than kpc capture very few mergers, likely because the time between simulation snapshots is too long (between Myr).
In choosing a merging timescale, we first set a fiducial timescale of Myr from the central snapshot as in Ferreira et al. (2020). We then explored various other timescales, including shorter/longer ranges, asymmetric ranges, and redshift-dependent ranges (Mantha et al., 2018). However, 1) the fiducial timescale produces merger fractions similar to observations (see Section 4.1.1), and 2) other timescales all performed equally well or worse in our automated classifier. Therefore, we omit results using these other time ranges for clarity and only show results for a merging timescale of Myr.
The parameters we explore in this work are summarized as follows:
-
•
,
-
•
kpc,
-
•
Myr.
3.2 Synthetic Image Generation
3.2.1 Radiative Transfer
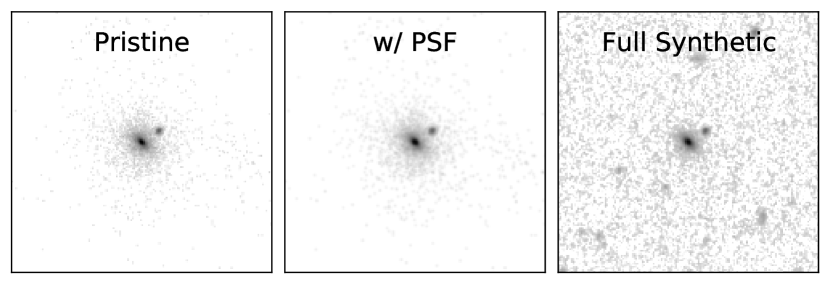
We generate noiseless, high-resolution images from our galaxy simulation data using the open-source radiative transfer (RT) code Powderday (Narayanan et al., 2021), which combines dust RT from Hyperion (Robitaille, 2011) with stellar population synthesis models from FSPS (Conroy et al., 2009; Conroy & Gunn, 2010), and uses yt (Turk et al., 2011) as the underlying simulation loader. Each star particle is assigned a spectral energy distribution (SED) according to its mass, age, and stellar metallicity, with an underlying Kroupa (2001) initial mass function. Similarly, each black hole particle is assigned an empirical Hopkins et al. (2007) SED according to its bolometric luminosity. These SEDs are then projected through the interstellar medium to generate broadband Å mm galaxy SEDs. We use Powderday to form a dust grid with a constant dust-to-metal ratio of and a Draine (2003) Milky Way dust model, then generate galaxy SEDs as well as filter-convolved photometric images. Each of our galaxy snapshots is “observed" at orientations randomly selected with respect to the galaxy and run through Powderday. This process generates total images and SEDs, properly redshifted to the cosmic time of the snapshot. We then convolve the output SEDs with the HST-WFC3 F160W filter at an image resolution of pixels. Each image has a physical scale of kpc, yielding pixel sizes of pc. Every star and gas particle within the viewing window, including those from companion galaxies, is included in the RT. The angular size does not strongly change between , so we keep a constant image size at all redshifts. We apply a cosmological surface brightness dimming by a factor of to each image, in the original units of erg s-1 cm-2 nm-1 Sr-1.
3.2.2 Simulation of mock HST images
To convert our ideal sky images into HST-like synthetic images, we follow a process similar to Snyder et al. (2015b); Snyder et al. (2019) by convolving with a point-spread function (PSF) and then introducing noise. The pc pixel size of the ideal sky images is approximately arcsec at , similar to the WFC3-IR mosaic pixel sizes ( arcsec) of the CANDELS drizzled images, and we choose PSF parameters to approximate the quality of those data products (Koekemoer et al., 2011; Grogin et al., 2011).
We first convolve each pristine image with a Gaussian PSF with full-width at half-maximum of arcsec, corresponding to the arcsec core PSF of HST-WFC3 in the F160W filter. Then, we add source shot noise to each pixel of the PSF-convolved images.
Next, we inject each of our PSF-convolved + noise-added images into a randomly selected CANDELS image. We use a modified version of the RealSim package (Bottrell et al., 2019) to generate what they label “fully realistic images". They find that convolving synthetic images into real fields dramatically improves the performance of automated merger classifiers. We follow a similar prescription to Bottrell et al. (2019):
-
1.
Randomly select a CANDELS field, choosing from the EGS, UDS, COSMOS, and GOODS-S fields. We omit GOODS-N because of its different F160W photometric resolution.
- 2.
-
3.
Generate a deblended segmentation map for the F160W image, within a cutout centreed on the selected galaxy.
-
4.
Randomly select an injection site within the cutout, with the restriction that the centre of the injected image does not land on another object in the segmentation map.
-
5.
Inject the mock image at the selected site, and extract the final synthetic image cutout.
Figure 1 illustrates each step of the synthetic image generation pipeline for a randomly selected image.
3.3 Observational Merger Classifiers
Using mock observations, we measure morphological statistics commonly used to identify mergers. We calculate the Gini and statistics (Abraham et al., 2003; Lotz et al., 2004), as well as the asymmetry and concentration statistics (Conselice et al., 2003) using the statmorph package (Rodriguez-Gomez et al., 2019). We train an automated machine learning classifier with these morphological parameters as features to reproduce the intrinsic merger statistics.
Before measuring morphological statistics, we background subtract each of our images and generate deblended segmentation maps using photutils. We first estimate the background by iteratively measuring the 3 clipped median pixel flux until convergence. Then, we measure the morphologies of sources with at least connected pixels above the background.
3.3.1 Morphological Measurements
We measure non-parametric morphological statistics designed to detect the presence of disturbance or multiple nuclei. We use statmorph to calculate , , , and , among other statistics. Images that fail any morphological fit are automatically flagged by statmorph, which we discard for purity. Approximately % of images are flagged and discarded, leaving us with synthetic images with valid morphological fits.
Gini’s coefficient, , measures the inequality among pixel flux values and is normalized such that it ranges from 0 (all pixels contain equal flux) to 1 (one pixel contains all flux). is location-independent and hence is able to detect multiple bright nuclei but is sensitive to which pixels are selected for measurement. Building off the original construction in Glasser (1962), Lotz et al. (2004) find that can be robustly calculated for galaxies above signal-to-noise :
| (1) |
where all pixels are rank-ordered by absolute flux values , and is the mean absolute flux value.
The statistic calculates the second-order moment of the brightest quintile of pixel flux values, relative to the total second-order moment, within the segmentation map (Lotz et al., 2004):
| (2) |
where
| (3) |
and , are the galaxy centre coordinates defined to minimize .
The statistic is typically defined:
| (4) |
where and are the circular aperture radii containing % and % of the galaxy flux within the Petrosian radius. The aperture centre is determined by the point that minimizes the statistic:
| (5) |
where and are the pixel fluxes for the image and image rotated by , respectively. is the average background asymmetry. The pixel flux values within are included in the computation.
Following Snyder et al. (2019), we rotate the space to define two simplifying diagnostics relative to the locus of points found in Lotz et al. (2008), the bulge statistic and the merger statistic :
| (6) |
where (Snyder et al., 2015b). , which extends parallel to the locus of points, is less sensitive than to the effects of dust and mergers, which tend to move galaxies perpendicular to the locus of points. instead extends perpendicular to the locus of points:
| (7) |
where (Snyder et al., 2015a). Positive values tend to identify multiple cores (high ) and starbursts (high ).
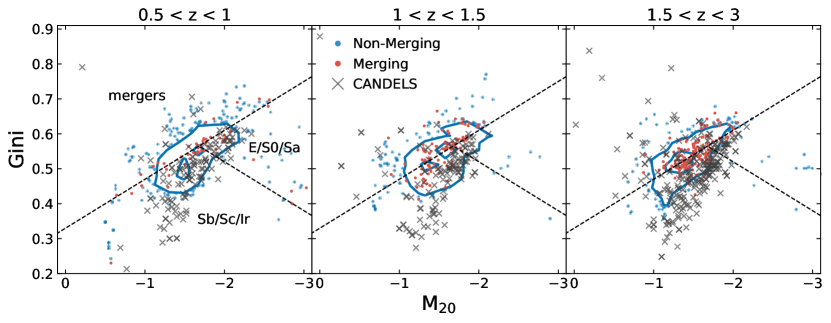
Figure 2 shows the distribution of the data from the synthetic images in space in bins of redshift. Our morphologies tend to lie on or below the Lotz et al. (2008) dividing line between mergers and non-mergers and exhibit slightly higher values of relative to CANDELS galaxies. The merger dividing line corresponds with the line of . At high redshift, disk-dominated galaxies are more prevalent than bulge-dominated galaxies ( versus , respectively). At low redshift, disk-dominated galaxies become rarer than buldge-dominated ( versus , respectively). The fraction of galaxies merging according to simple cuts on varies between . In CANDELS, disk-dominated galaxies are always more prevalent than bulge-dominated ( versus ), highlighting that our cosmological zoom simulations are not cosmologically representative.
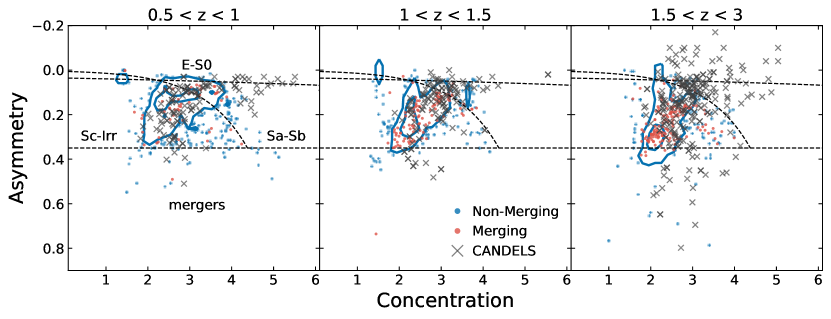
Figure 3 compares our morphologies to mass-matched CANDELS galaxies in asymmetry-concentration space. We include Bershady et al. (2000) divisions between bulge- and disk-dominated galaxies and merging systems. Between of synthetic morphologies lie within late-type regions, quite different from the of CANDELS galaxies. Mergers identified through a single cut in asymmetry make up a small fraction of the sample between , different from CANDELS’ . Despite these differences, synthetic image morphologies occupy similar regions of asymmetry-concentration space as CANDELS.
Notably, in both space and space, true mergers are not strongly morphologically distinct from non-mergers. These distributions illustrate why flat cuts on a single morphological diagnostic will not strongly distinguish mergers, and why a machine learning classifier may be necessary to identify mergers.
3.3.2 A new automated method to select mergers
Simple cuts on have been found to separate many systems with bright nuclei and bright tidal tails, which together can indicate recent or ongoing merger activity (Lotz et al., 2004). Similarly, simple cuts on asymmetry have been found to identify highly disturbed systems out to (Conselice et al., 2003). However, we find that simple cuts on synthetic image morphologies do not accurately identify intrinsic mergers. Instead, we pursue an automated approach to merger classification, which gives more accurate merger classifications.
There are a number of approaches to automated merger classification based on either the multidimensional space of morphological diagnostics or the image pixel values themselves. Nevin et al. (2019) perform linear discriminant analysis on a seven-dimensional morphological diagnostic parameter space to generate a classifier that robustly classifies major and minor mergers separately, but not together. Both Goulding et al. (2018) and Snyder et al. (2019) use a random forest ensemble learning method to classify mergers based on a number of parametric and non-parametric diagnostics, including those described in this work. Such approaches allow for direct comparisons with diagnostic-based observations at the potential cost of missing merger-relevant features not present within the diagnostics. Other studies such as Huertas-Company et al. (2018, 2019); Bottrell et al. (2019); Ferreira et al. (2020); Ćiprijanović et al. (2020); Bickley et al. (2021) use deep-learning methods to robustly identify morphological features from image pixel values themselves, at the cost of large training set size requirements and greater difficulty in direct comparisons with other work.
We choose a random forest (RF) ensemble learning method for classifying mergers from our synthetic images. RFs are a non-parametric method that generates decision trees to subdivide the multidimensional parameter space. At each step of a given tree, a feature subdivision is chosen by identifying the subdivision with the largest reduction in entropy. RFs benefit from their ability to be trained on high-level summary statistics rather than full astronomical images. However, as with many other methods, they require careful tuning of the many hyperparameters.
When trained on unbalanced training sets, random forests may also present biases towards the majority class. Since intrinsic mergers are rare relative to non-mergers, we perform a random undersampling of the majority class (non-mergers) to bring the two classes into balance. Results change little when we instead apply random oversampling of the minority (mergers) class. However, these sampling techniques are not perfect, and any ML classifier will suffer in classification precision when trained on strongly imbalanced data.
We use the Scikit-learn package (Pedregosa et al., 2011) to train and test a RF classifier on the non-parametric morphological statistics extracted from our synthetic images (, , , and ) as well as redshift. We label each image with a True or False binary classification based on the given intrinsic merger definition. For simplicity, we show results for a single intrinsic merger definition that performed the best (major pairs with separations of at most kpc). Other intrinsic merger definitions exhibit worse classification performance. We train the RF on the images from a random subset of of the galaxies, then test classifications, and report results on images from the remaining, untouched of galaxies. Splitting the training/test sets in this way ensures that correlations between subsequent snapshots of the same galaxy do not leak from the training set into the test set. We use the Imbalanced-learn package (Lemaître et al., 2017) to perform random oversampling of the minority class during the bagging step within the cross-validation pipeline. Oversampling is performed on the training folds, and then the classifier is scored on the non-oversampled validation fold. We use -fold cross-validation with decision trees up to a maximum depth of layers, up to features used per split, and up to minimum samples per leaf. The tuned classifier reaches a maximum tree depth of layers, parameters per split, and a minimum of samples required to be at a leaf node. The RF outputs the classification probability for each image, which we transform into a classification prediction.
In order to map classification probabilities to binary classifications, we must first define common classification measures:
-
•
True Positive (TP): True mergers selected by classification.
-
•
False Positive (FP): Non-mergers selected by classification.
-
•
True Negative (TN): Non-mergers rejected by classification.
-
•
False Negative (FN): True mergers rejected by classification.
Using these measures we also define the True Positive Rate (or recall):
| (8) |
the False Positive Rate:
| (9) |
and the Positive Predictive Value (or precision):
| (10) |
A classifier that perfectly includes mergers and excludes non-mergers would hence have a , , and . We select a classification probability threshold using the statistic, which identifies the probability threshold at which:
| (11) |
is maximized. The statistic attempts to strike a balance between precision and recall. Scoring based on precision and recall is especially important in unbalanced data sets like ours, which has fewer intrinsic mergers than non-mergers.
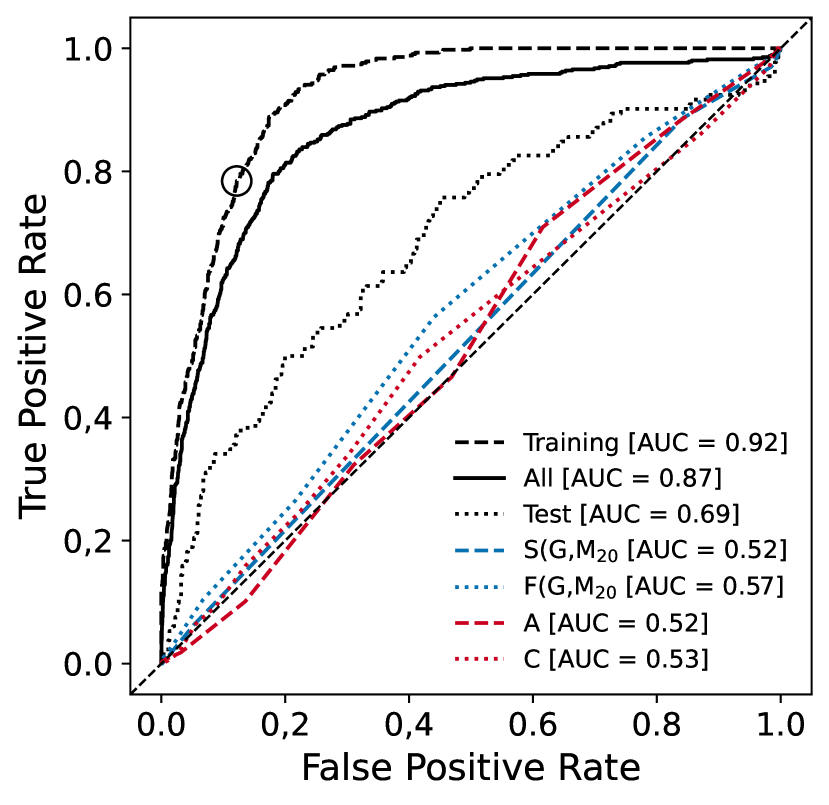
Figure 4 shows the Receiver Operating Characteristics (ROC) curve for the RF-trained classifier, which measures the diagnostic ability of the classifier as the decision boundary changes. We show the ROC curve and AUC values for the training set as well as the total data set, marking the maximal probability threshold on the validation set with a circle. We also include the ROC curves for classification based solely on sliding , , asymmetry, and concentration thresholds. The AUC value for the all data is 0.87 and the AUC value for the test data is 0.69. Considering the ROC curve on the test dataset, the RF classifier has reasonable discrimination performance. Most importantly, the RF classifier outperforms the simple classifiers, whereas the simple classifiers perform slightly better than a random selection.
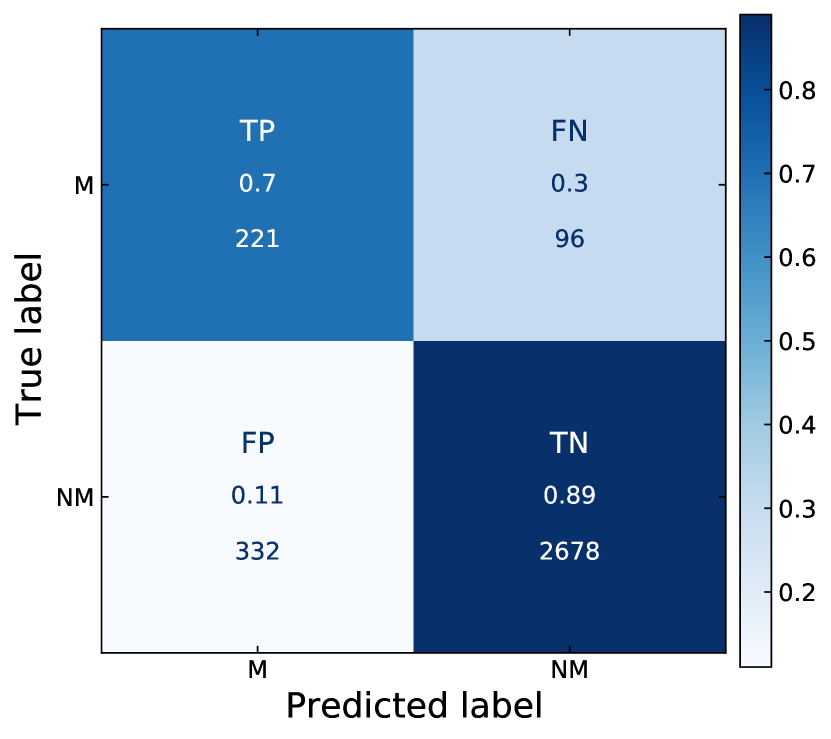
Figure 5 shows the confusion matrix for the tuned classifier applied to the full data set. In each classification bin, we include the number of images as well as the fraction of true mergers/non-mergers (i.e., the fraction of images in each row) that fall within each bin. Notably, the classifier falsely identifies many non-mergers as mergers, lowering the precision.
Classifying mergers in this way has a few drawbacks. Foremost, the precision of the RF classifier is low, where only % of positive classifications are true positives. As seen in the confusion matrix, although of true mergers are correctly identified, of non-mergers are falsely classified as mergers. Our synthetic images have been specifically generated to emulate CANDELS-like observations, and our observational merger diagnostics likely perform differently at different image resolutions or depths. Hence our classifier likely does not generalize well outside of the specific mock observation environment.
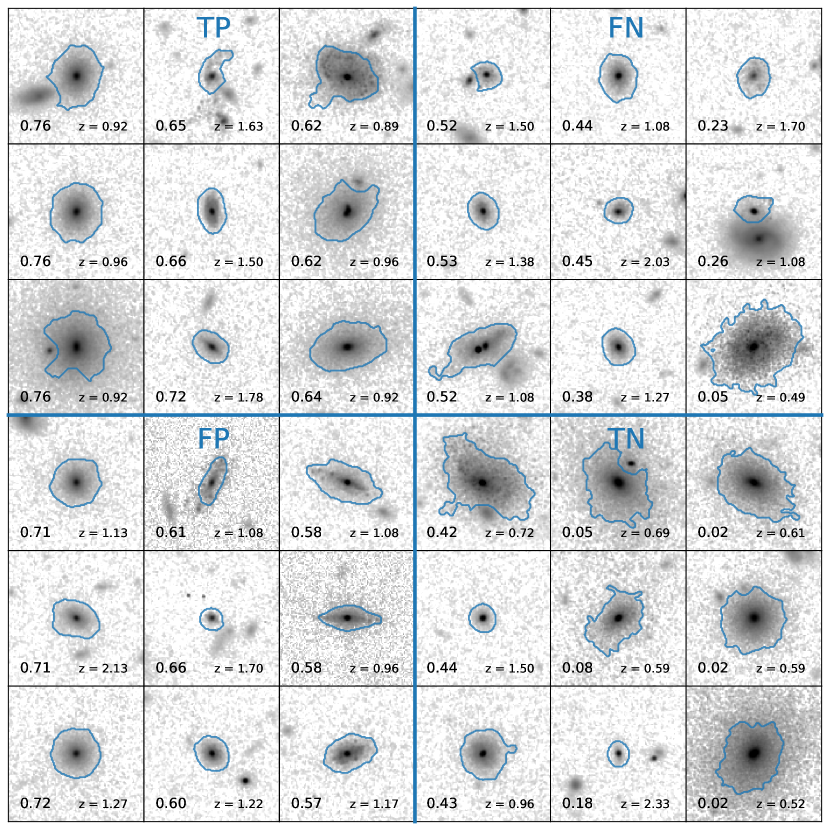
Figure 6 shows randomly selected synthetic images after classification, along with the deblended segmentation maps used for morphological analysis. Each image is cropped to a physical scale of kpc and indicates the target object redshift along with the classification probability. We include segmentation maps to aid the eye in identifying where deblending may have contributed to false classification.
4 Results
We now search for any connection between mergers and triggering of AGN activity by 1) analyzing properties of intrinsic mergers, 2) analyzing properties of mergers classified from the synthetic images, and 3) comparing intrinsic, classified, and observational merger statistics. When we examine intrinsic mergers in our following analysis, we only focus on widely separated ( kpc) pairs with a major companion () and low relative velocities ( km s-1). Snapshots within Myr of are also marked as mergers.
A vital aspect of our analysis is accurately estimating the luminosities of our SMBHs. We assume a piecewise expression for bolometric luminosity that depends on the Eddington ratio, , such that radiatively inefficient BHs have reduced luminosities:
where is the accretion rate of the SMBH, and we choose (Churazov et al., 2005; Hirschmann et al., 2014; Habouzit et al., 2019). We also adjust our AGN luminosities to account for AGN variability on timescales below the simulation resolution limit. Hickox et al. (2014) find that models, where AGN spend more time at low luminosities fractionally, are able to reproduce observed relationships between AGN luminosity and star formation rate. We adopt their fiducial model, which follows a Schechter function of the form:
| (12) |
where is a relative luminosity, , and . For each of our galaxies, we sample the distribution and extract a new . Including short-timescale variability adds additional variance to our AGN luminosities, with a longer tail towards dim SMBHs.
Throughout our analysis, we frequently compare the properties of galaxies to the properties of appropriately chosen control galaxies. There are many ways to choose control galaxies, including selecting based on redshift, galaxy physical properties, or environment. In this work, we select according to stellar mass, redshift, and an additional criterion based on the quantity we wish to explore. For example, in studying the prevalence of mergers in AGN, our sample of AGN with bolometric luminosities erg s-1 is paired with inactive control galaxies with erg s-1. In general, to generate a control sample, we first choose suitable control criteria, then select control galaxies within a factor of of the target galaxy’s stellar mass from snapshots within Myr of the target galaxy’s snapshot. Each target galaxy is paired with control galaxies. We find that strengthening or relaxing any of these criteria does not strongly affect results, though it can influence the scale of our uncertainties in cases where few suitable control galaxies are found.
4.1 Properties of Intrinsic Mergers
We begin by exploring the properties of intrinsic mergers obtained from the simulation. We examine the merger fractions predicted by the simulation, the role of mergers in fueling SMBH growth, and the role of gas content in potentially triggering AGN activity.
4.1.1 True merger statistics
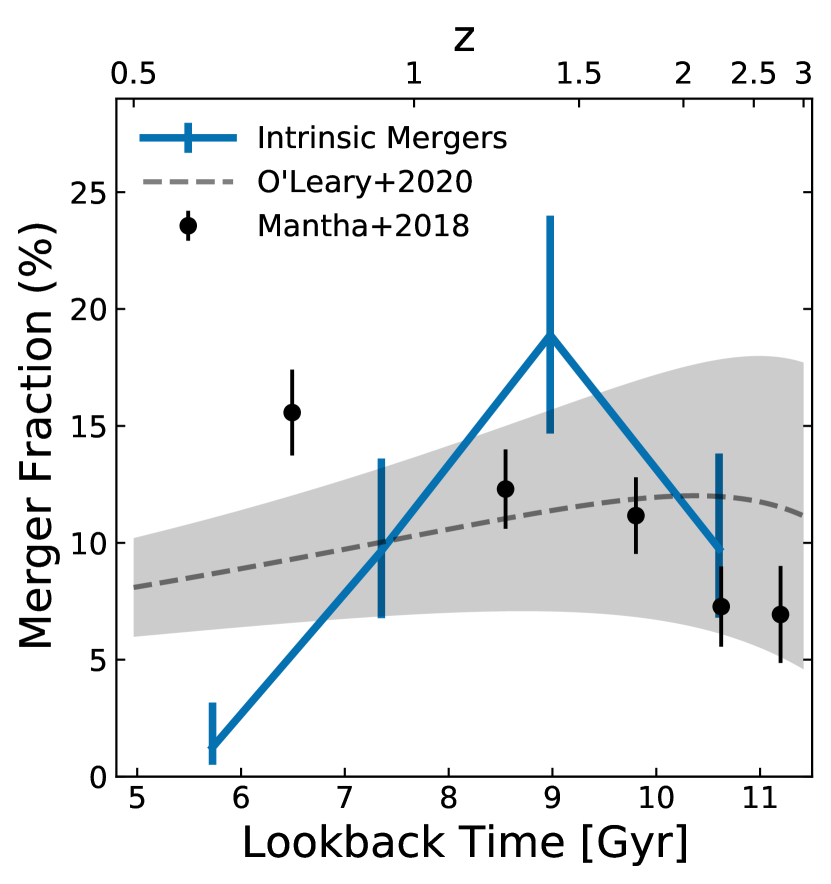
In Figure 7 we compare the time evolution of merger fraction among our halos. We compare with Mantha et al. (2018) companion fractions of massive galaxies () with major companions (1:4) out to a projected kpc, obtained from all five CANDELS fields with corrections for projection effects. We also compare with predicted companion fractions of massive central galaxies () with major (1:4) stellar companions out to a projected kpc from the empirical model of O’Leary et al. (2021). Following Cameron (2011), we calculate the % binomial confidence interval given the number of mergers identified by each definition, in each time bin.
Intrinsic merger fractions are similar to merger fractions from both Mantha et al. (2018) and O’Leary et al. (2021) at all but the lowest redshift bin, where merger fractions are lower in the simulation. Close pairs are most common between . It is worth noting that, although our merger fractions are similar to literature values, 1) our sample of halos is not cosmologically representative, and 2) the merger fractions obtained from the simulations are sensitive to the choice of merging timescale chosen. Timescales longer than Myr will yield more mergers by definition, and hence increase the merger fraction at all times.
4.1.2 Impact of mergers on SMBH growth
An additional goal of our analysis is understanding how important mergers are to the total growth of SMBHs. By tracing the growth histories of the central SMBHs and identifying times when the host galaxy has undergone a merger, we can determine the fraction of total SMBH growth attributable to merger activity.
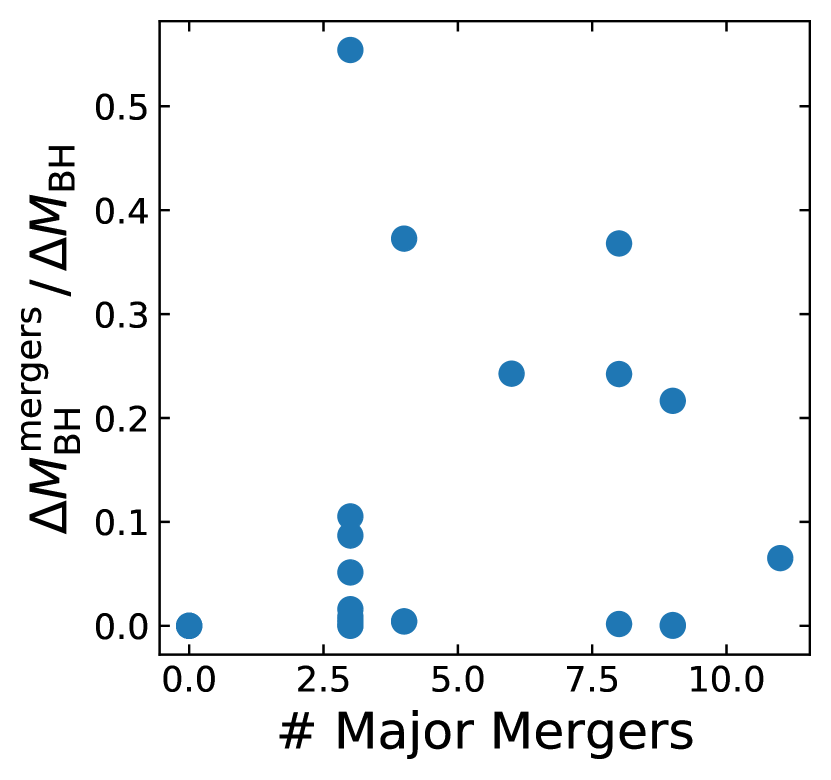
More time spent in a merging state does not guarantee increased accretion onto SMBHs. Figure 8 shows the fraction of SMBH mass growth between that occurred during periods of major mergers, as a function of total number of snapshots containing a major merger. Here, is the mass grown by the central SMBH during major mergers between , while is the total SMBH mass growth between . The number of major mergers a galaxy undergoes does not correlate with increased growth onto the central SMBH. Further, only one SMBH had the majority of its growth occur during periods of major merger activity, yet the host galaxy only underwent one major merger event.
4.1.3 Role of gas content
We now explore the role of gas content in the ignition of AGN via galaxy interactions. If mergers occur when there is little gas in the central galaxy, it is expected that they would not trigger significant BH growth or AGN activity. On the other hand, gas-rich mergers may be capable of efficiently funneling gas onto the central SMBH (e.g, Blumenthal & Barnes, 2018).
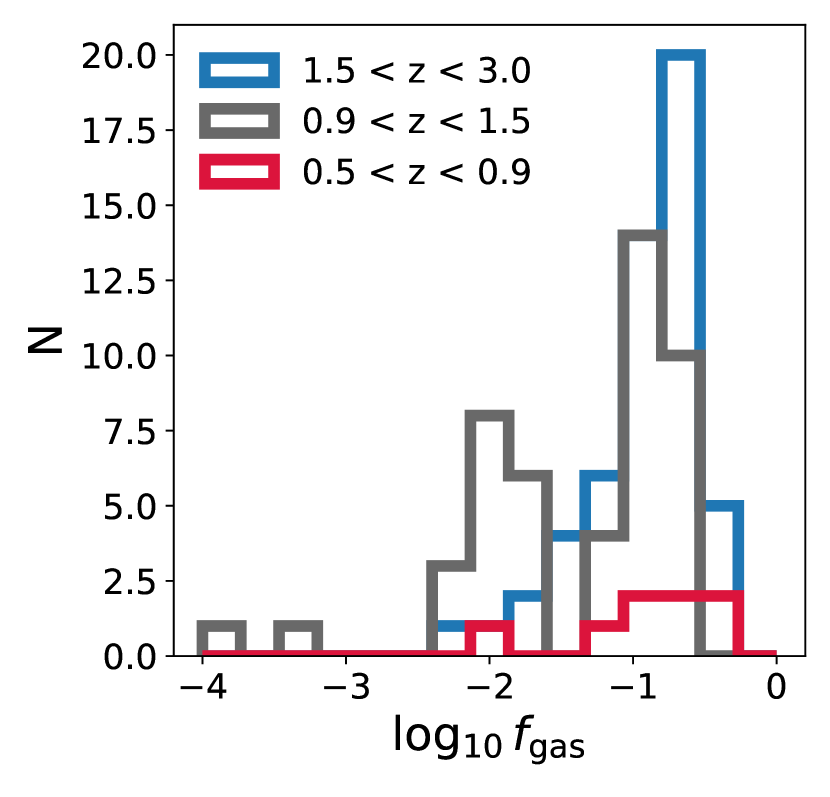
Figure 9 illustrates the gas fraction within the central galaxy for every snapshot containing a major merger, in bins of redshift between . We define the gas fraction by the fraction of all baryons contained in gas:
| (13) |
where is the gas mass within the central galaxy. Each redshift bin is chosen to contain equal numbers of simulation timesteps between .
Major mergers are most gas-poor during the period of greatest merger activity, between . Although our galaxies on average become less gas-rich with time, the few major mergers occurring between are surprisingly gas-rich . Hence if gas content plays an important role in triggering AGN, it is either the abundant gas-rich mergers between , or the few gas-rich mergers between , that would be most likely to trigger AGN.
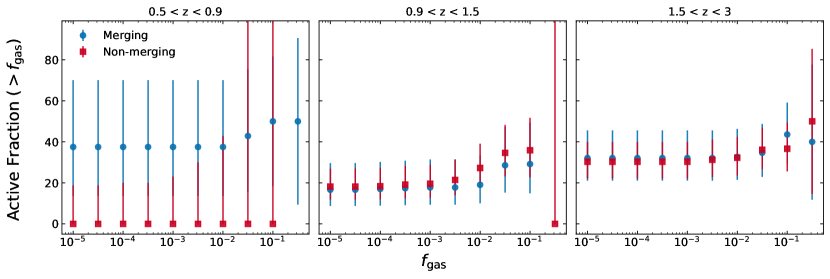
Next we show how the fraction of active galaxies varies with gas fraction. Figure 10 shows the AGN fraction for central galaxies more gas-rich than a given threshold, binned by redshift. We define AGN by a cut on bolometric luminosity, erg s-1. For each merger, we select two non-merging control galaxies. The fraction of AGN in merging systems above is consistent with that of non-merging systems, regardless of gas fraction. In the lowest redshift bin there are only total AGN, all of which are found in the total merging systems.
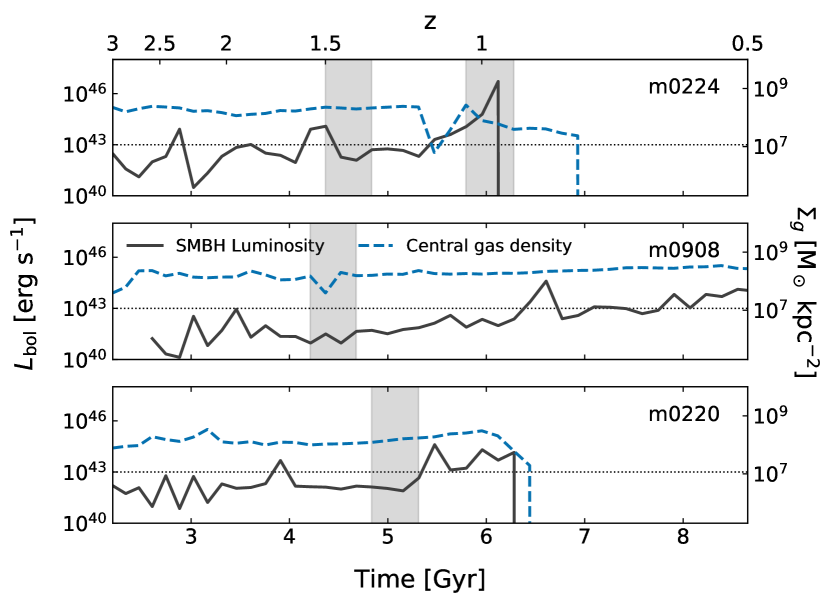
Finally, we choose three central galaxies that were gas rich at and track both their central gas density and the bolometric luminosity of the central SMBH. We loosely define gas-rich by . We also define the central gas density within the central kpc of the galaxy:
| (14) |
If mergers are capable of triggering AGN, we expect to see an influx of gas flowing into the central regions following a merger, and hence an increase in central gas density.
Figure 11 shows the evolution of total bolometric luminosity compared with the evolution of the central gas density, with time. We also highlight periods where the central galaxy is in a major merging state.
Halo m0224 undergoes two major mergers around and . AGN activity appears to increase immediately preceding both the first and second merger, but only spike sharply in the second. Following a peak in AGN activity during the second merger, it steeply drops, followed by an eventual drop in the central gas content, presumably as gas is evacuated from the central regions. This halo’s growth history shows that at least some mergers do appear to be connected with enhanced accretion onto the SMBH, leading to observable levels of AGN activity.
Halo m0908 instead undergoes a major merger without significant AGN activity and only a slight variation in central gas density. Instead, AGN activity slowly increases over time as the SMBH grows. The SMBH grows via slow gas accretion from a central gas supply that is constantly replenished by the rest of the galaxy.
Finally, halo m0220 has one major merger which appears to affect AGN activity in the later stages of the event, as well as after the event. Distinct from the other two halos, AGN activity increases slightly during the merger, then quickly increases a short time after the merger completes. Gas is consumed or ejected until the AGN shuts off Gyr later, likely from lack of fuel.
Neither halo m0908 nor halo m0220 are consistent with gas-rich mergers as the primary driver of AGN activity. This set of halos illustrates that major mergers may sometimes drive immediate episodes of significant black hole accretion, but not all AGN activity is connected with mergers and not all mergers are connected with immediately enhanced AGN activity. Further, it appears that even when galaxies are gas rich, mergers are not guaranteed to trigger significant accretion onto the SMBH. These halos illustrate there are likely additional criteria on top of gas richness that are required in order to trigger AGN activity.
4.2 Comparison of Intrinsic and Classified Mergers
With intrinsic merger statistics in hand, we now explore the characteristics of our merger classifier applied to the synthetic images. We examine the morphologies exhibited by the central galaxy in each synthetic image, then search for any connection between major mergers identified through both the classifier and intrinsic AGN activity.
When estimating merger fractions derived from the synthetic images, we apply an additional correction for the known incompleteness of the automated classifier, in order to form more equal comparisons with intrinsic merger fractions. Following Snyder et al. (2019), we define the merger fraction for classified mergers as:
| (15) |
for number of mergers identified by the classifier and total images. In astronomy terms, is the classifier purity while is the completeness. Multiplying merger fractions by the purity helps account for non-mergers falsely classified as mergers. Dividing by the completeness helps account for true mergers missed by the classifier. The trained classifier yields a correction .
4.2.1 Merger fraction is rarely enhanced among AGN
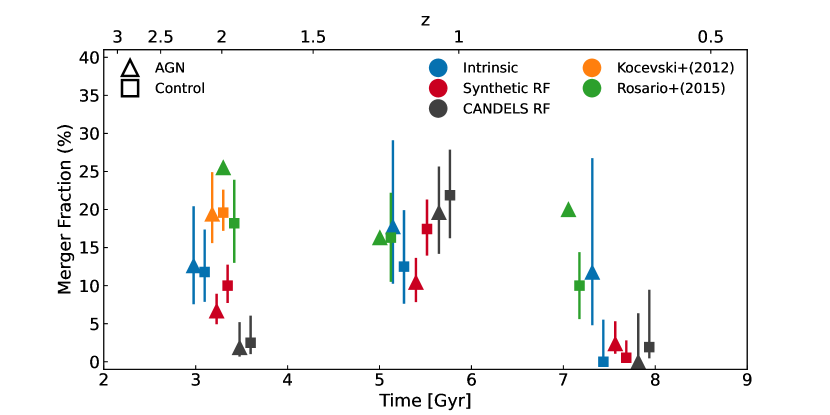
First, we examine how merger fractions differ across time between AGN and non-AGN. Figure 12 compares intrinsic, RF classified synthetic image and CANDELS merger fractions as a function of cosmic time, for galaxies hosting AGN ( erg s-1) versus the inactive ( erg s-1) control sample. We show the CANDELS merger fraction: companion pair fraction from Kocevski et al. (2012), who use data from the CANDELS GOODS-S field, and the interaction fractions from Rosario et al. (2015), who use the combined data of all five CANDELS fields, GOODS-N included. We compute the non-parametric morphology statistics from the CANDELS image and employ them to differentiate between mergers and non-mergers using the Random Forest classifier trained on synthetic images. This process mirrors the application of the RF classifier to the synthetic image for distinguishing between mergers and non-mergers in the observational data. We note that both Kocevski et al. (2012) and Rosario et al. (2015) employed visual classification methods for categorizing mergers.
In all cases, we found no statistically significant difference in the merger fraction between AGN and the control sample. Intrinsic, RF-classified synthetic images, and RF classified CANDELS images, did not show a significant difference in merger fraction between AGN and non-AGN. However, The few AGN between show a slight excess in merger fraction over non-AGN that is not seen at higher redshift. Overall, our intrinsic merger fractions are similar to merger fractions from Kocevski et al. (2012) and Rosario et al. (2015) across time, hovering between %. We find evidence of a slight excess in intrinsic merger fraction at low redshift as seen in Rosario et al. (2015). This excess is driven by the small number of especially gas-rich AGN found in merging galaxies between .
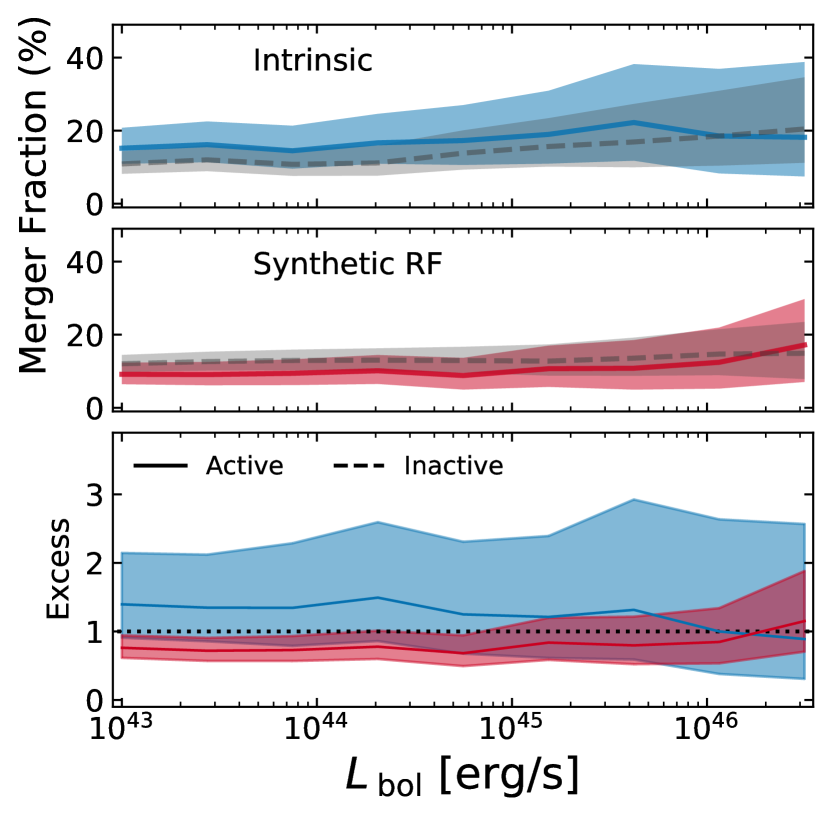
Next we explore how merger fraction depends on AGN luminosity between redshifts . We make sequentially higher cuts on bolometric luminosity and examine the merger fraction relative to the corresponding inactive control sample. Figure 13 shows how merger fractions vary with increasing bolometric luminosity thresholds relative to the inactive control samples, in both the intrinsic and classified cases. We also plot the fractional excess merger fraction for AGN versus non-AGN, as a function of the moving luminosity threshold.
Even the most luminous AGN in our sample do not exhibit a significant enhancement of merger fraction relative to the control galaxies. Neither the intrinsic nor the classified merger fractions are significantly different from their corresponding control samples in any luminosity bin.
4.2.2 AGN fraction is rarely enhanced by mergers
Previously we asked whether we could detect a difference in the merger fraction of AGN hosts compared with an inactive control sample. We now ask the reverse question: do we see a difference in the AGN fraction of a sample of galaxy mergers, compared to a non-merging control sample?
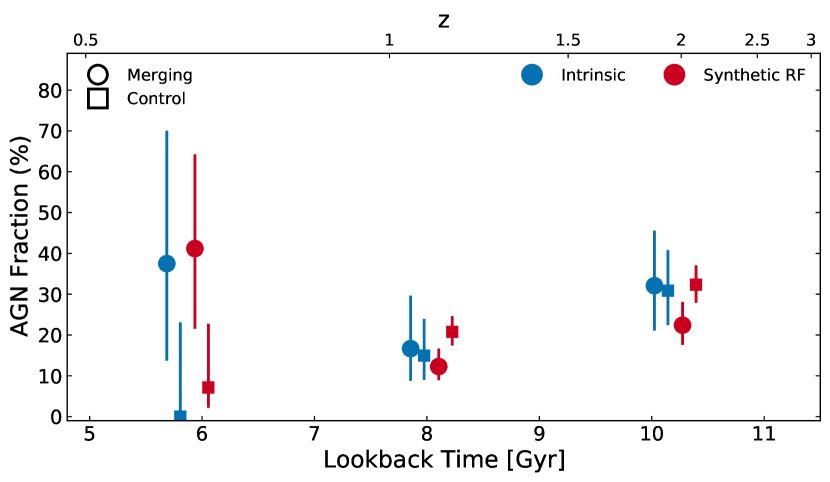
For each both intrinsic and classified mergers, we select control galaxies which are not experiencing major mergers. We then identify AGN using a bolometric luminosity threshold erg s-1. Figure 14 shows the AGN fraction across cosmic time for intrinsic and classified mergers, relative to their corresponding non-merging control samples.
Intrinsic merging systems do not show a significant enhancement of AGN activity relative to non-merging systems. The AGN fraction in merging and non-merging systems does not evolve strongly with time, hovering between % above . In the lowest redshift bin, there is an enhancement in AGN fraction, though there few major mergers and few AGN. While we saw an enhancement in merger fraction in low redshift systems, it is unclear how significant the enhancement in AGN fraction is.
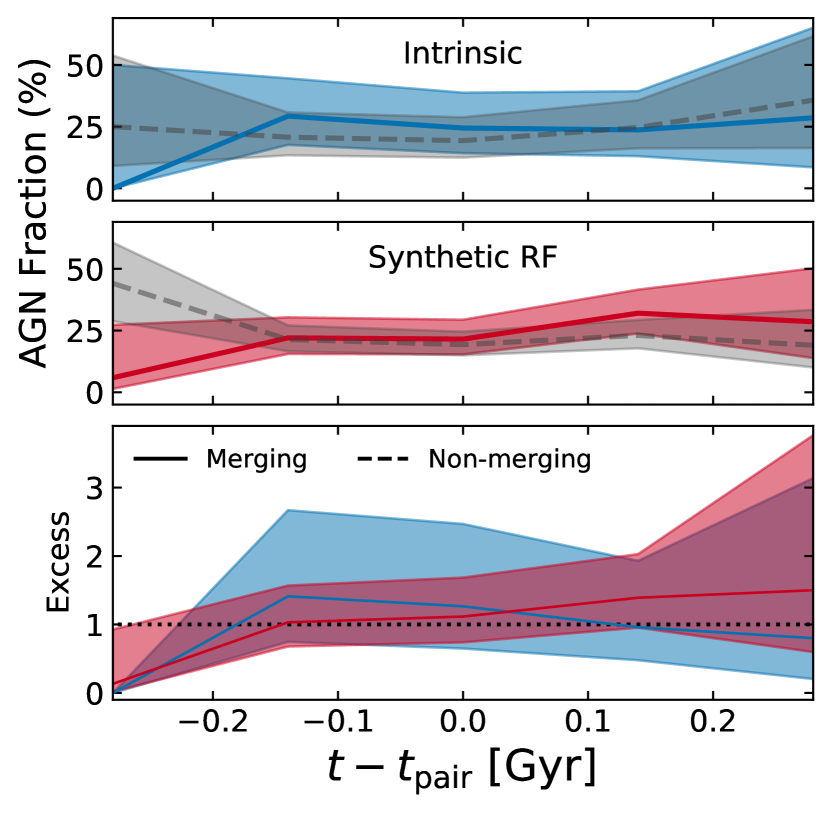
Next we track the evolution of AGN fraction throughout each merger period and search for enhancement relative to the control sample. Figure 15 shows AGN fractions for galaxies during each stage of a merger, compared to the AGN fraction of the corresponding control galaxies. We centre the merger times at the snapshot where a close pair was initially identified, , such that negative/positive values of correspond with pre-/post- merger states, respectively. We also plot the fractional excess in AGN fraction relative to the control at each merger stage, as done previously.
Within Myr of pair identification, both intrinsic mergers and those identified from the synthetic images show similar AGN fractions throughout all merger stages, and show no statistically significant difference relative to their corresponding control sets.
5 Discussion
5.1 Caveats
Our analysis has a few caveats that must be considered, including the impact of torus-scale dust obscuration on identifying AGN, the impact of simulation resolution and sub-grid physics, the subtleties of our methodology, and the impact of our merger detection methods.
Many studies have found that mid-IR selected AGN show a stronger correlation with mergers than AGN selected at other wavelengths (e.g, Satyapal et al., 2014; Ellison et al., 2019). Donley et al. (2018) find that IR-selected, heavily obscured AGN in the CANDELS/COSMOS field are more likely than X-ray-selected AGN to be identified as disturbed, potentially post-merger, systems. Kocevski et al. (2015) find heavily obscured AGN at are three times more likely than unobscured AGN to show signatures of galaxy interactions.
Although our RT model includes galaxy-scale dust, it does not include dust on the scale of the accretion structure surrounding the black hole. While we can directly measure intrinsic accretion rates onto the central SMBHs, we do not take into account the torus-scale obscuration in the generation of our synthetic images, or in our AGN luminosity cuts. The inclusion of torus-scale obscuration may be a relevant ingredient in realistically selecting AGN from the simulations, by potentially removing the few merger-induced AGN from detection. Future work may benefit from more detailed modeling of AGN emission (e.g, Done et al., 2012) and torus-scale obscuration (such as the models detailed in Nenkova et al., 2008b, a).
Simulation resolution and sub-grid physics could also impact our results. Our choices of SMBH accretion and feedback physics within the simulation directly impact the measured AGN activity, and are themselves dependent on simulation resolution. In order to study the impact of mergers on AGN activity, both AGN scales and cosmological scales must be simulated at high resolution. Simulations run at higher spatial resolution would allow the inclusion of more detailed physics, that occurs well below the resolution limit of our simulations. For example, hyper-zoom simulations that study accretion onto SMBH find that the Bondi-Hoyle approximation used in our simulation suite may be quite inaccurate (Anglés-Alcázar et al., 2021). Zanisi et al. (2021) find that higher resolution cosmological hydrodynamic simulations are better able to capture the small-scale galaxy morphologies, which may be tied to AGN response to mergers. Higher resolutions and more realistic modelling may find a stronger and more broad correlation between merger events and induced AGN activity.
Due to the nature of high-resolution zoom-in simulations, we do not have a cosmologically representative sample relative to larger, uniform cosmological simulations and observational surveys. Although we can increase our image sample size by observing each galaxy from multiple orientations, we likely suffer from systematics. For example, our simulation suite does not include the very massive systems that likely give rise to the most luminous AGN and quasars at high redshifts, and may not provide good statistical representation of rare major mergers. Indeed, it is the most massive and luminous galaxies that have been observed to have the strongest connection between mergers and AGN (e.g, Goulding et al., 2018). With only halos, we are likely not sampling the full diversity of halo merger histories.
Many observations rely on non-parametric morphological parameters to differentiate between mergers and non-mergers. However, our simulations and the analysis of mock images have revealed that these parameters lack effective discrimination between intrinsic mergers and non-mergers when employed individually, as illustrated in Figure 4. When combining all these parameters and employing machine learning techniques, we managed to create a more robust merger classifier than using them individually, but its performance remains suboptimal. Our conclusion is that employing non-parametric measurements for classifying mergers might not be advisable initially. Exploring alternative machine learning methods that directly incorporate mock images could prove to be a more fruitful way to classify merger.
In addition, as seen in Figure 5, our automated classifier performs well in identifying true mergers at the cost of incorrectly classifying many non-mergers. The high impurity in our classifier means that it is often difficult to disentangle the effects of misclassification from effects of the mock observation process itself. In falsely classifying non-mergers as mergers, true connections between mergers and AGN may be washed out. For example, in Figure 12 we found an excess of intrinsic merger fraction with high uncertainty at low redshift. In moving to the classifier merger fractions, the uncertainties are lower but the excess is smaller. It is not clear whether the discrepancy in merger fraction is due the classifier impurity washing out any intrinsic enhancement, or if there is an implicit bias away from mergers in AGN within the methodology itself. Machine learning methods with higher classification precision (e.g, Huertas-Company et al., 2019) may find differing results.
An imbalance in the class of data also greatly affects the performance of RF classifier. To overcome this problem, we perform a random undersampling of the majority class (non-merger), but this sampling is not perfect. There are various ways to reduce the imbalance of data, such as including more snapshots when mergers occur, and we leave this as future work.
Finally, there are many ways that mergers can be identified both within the simulation and in observations. As discussed in Section 3.1, we choose to identify major mergers within the simulation based on a close pairs method. Similar studies (Rodriguez-Gomez et al., 2015; Abruzzo et al., 2018) instead generate halo merger trees to identify galaxy mergers and trace progenitor histories. The identified galaxy mergers instead depend on different observing timescales from close pairs. It is not clear how the choice of merger selection method or merger tree generation algorithm affects the end sample of selected mergers, or even if such methods are directly comparable.
5.2 Interpretation and Implications
Our study has yielded some important insights into the AGN-merger connection and our ability to probe it with observations. It is clear that the simple picture painted by binary merger simulations is not representative of the results of modern cosmological simulations. The reasons for these differences are not yet entirely clear, and will be the subject of future studies, but we can speculate on some of them. The most commonly used initial conditions for binary merger simulations in the past have been 1:1 mergers of gas-rich, thin, rotationally supported (Milky Way like) spiral galaxies (e.g, Springel et al., 2005b; Hopkins et al., 2005; Cox et al., 2006; Bournaud et al., 2008). These are somewhat different from the progenitors of most AGN hosts, particularly at high redshift. Based on both simulations (Thomas et al., 2005; Somerville & Davé, 2015; Naab & Ostriker, 2017; Fiacconi et al., 2017) and observations (Mullaney et al., 2012; Santini et al., 2012; Förster Schreiber et al., 2014; Elmegreen et al., 2017; Förster Schreiber et al., 2018; Förster Schreiber & Wuyts, 2020), the progenitors of AGN hosts are more likely to be highly turbulent and thickened star-forming galaxies. Indeed, very gas-rich galaxies are actually thought to be less susceptible to strong merger-driven nuclear inflows, as most of the torque that drives gas inwards is caused by the lag between the gaseous and stellar bar (Robertson et al., 2006; Hopkins et al., 2009). Moreover, there have been few studies on the impact of minor mergers on AGN triggering, though studies of nuclear inflows and starbursts indicate that minor mergers would be expected to have a less dramatic impact (Cox et al., 2008). The response of the disk to a perturber is also sensitive to the radial extent and presence of a pre-existing bulge in the primary, and to the satellite orbit (Cox et al., 2008). Finally, idealized binary merger simulations do not include cosmological accretion or accretion of cold gas from a hot halo.
Moving from idealized merger simulations to cosmological simulations does not entirely solve the problem, since modern cosmological simulations also give varying results. McAlpine et al. (2020) find that mergers strongly correlate with an enhancement of AGN fraction within gas-rich galaxies in the EAGLE cosmological simulation, in tension with our findings of similar mass galaxies. Both this work and McAlpine et al. (2020) find 1) similar merger and AGN fractions across time, and 2) that mergers are not a significant growth mode for the BH, either because accretion enhancement is too little, mergers do not last long enough, or there are too few significant mergers. Using the “genetic modification" technique on a zoom-in cosmological simulation of similar resolution to our simulations, Pontzen et al. (2017) are able to alter the merger history of a halo with virial mass , while keeping the final halo mass, large-scale structure, and local environment unchanged. With each iteration of the reference halo, they are able to measure the impact of smaller/larger infalling companions on AGN activity and galaxy quenching. They find that mergers are able to trigger brief periods of SMBH accretion, but not long term growth. On the other hand, Steinborn et al. (2018) find that recent mergers in the Magneticum Pathfinder cosmological simulation can increase the probability of subsequent AGN activity by a factor of three, but overall can only account for the population of very luminous AGN erg s-1 at .
Ultimately, all simulation results are impacted by the simulation characteristics and implementation of physics. Given the interaction of all of the physical factors with the expected sensitivity to the sub-grid recipes for star formation, stellar feedback, black hole accretion, and to resolution, it is perhaps not surprising that even recent cosmological simulations present a mixed picture of the AGN-merger connection. More detailed studies that look at the effect of mergers in different simulations while controlling for these other variables (progenitor structure and morphology, gas fraction, orbit, etc) will be needed to begin to disentangle these effects.
Another important conclusion of our study is that we do not expect to see significant enhancement of AGN activity in early stage mergers, when galaxies can be identified as close pairs. Any enhancement is expected to manifest in late stage mergers, after the nuclei have coalesced, as seen in McAlpine et al. (2020). Traditional methods used to identify mergers from images, including those based on non-parametric morphological statistics, are not even very effective at identifying early stage mergers — identifying a post-merger system is likely much more difficult. However, pixel-based deep learning techniques such as those utilized by Bottrell et al. (2019); Ferreira et al. (2020); Bickley et al. (2021); Zanisi et al. (2021) may be able to identify these late-stage mergers more effectively, which is something that we can test with our synthetic images.
Our results are consistent with the observational CANDELS sample that was the target comparison sample for our study, and somewhat agree with observational studies that have found evidence for significant enhancement in the merger fraction of AGN hosts, and of the AGN fraction of mergers/post-mergers around (e.g. Satyapal et al., 2014; Ellison et al., 2019). Rosario et al. (2015) suggest that evolving gas fractions may mean mergers are required to trigger AGN in the local universe, but are not necessary at high redshifts, in line with what we find in our analysis. We emphasize that in order to assess the consistency between a particular simulation and a particular observational analysis, it is critical to carry out the analysis in a consistent manner on synthetic observations. Such synthetic observations should be created with great care to match the observational characteristics of the sample to be compared with (Bottrell et al., 2019; Zanisi et al., 2021).
6 Conclusion
In this paper we explore the potential connection between galaxy mergers, AGN activity, gas content, and overall SMBH growth in a set of cosmological zoom-in simulations between . We identify mergers within the simulation by finding close pairs ( kpc separation) of major stellar companions. We run the dust radiative transfer code Powderday in post-processing to generate mock observations which emulate the characteristics of the CANDELS survey. We then train a random forest classifier to identify mergers based on non-parametric morphological statistics measured from the synthetic images. This method allows us to make reasonable comparisons with observational statistics from CANDELS.
By comparing mergers identified directly from the simulation to those identified through the classifier, we study how AGN activity may correlate with merger events. With carefully selected mass-matched control samples, we compare how merger fractions vary between AGN and inactive galaxies, as well as how AGN fractions vary between merging and non-merging systems. We find that:
-
1.
Most SMBHs in the simulations do not grow significantly during periods of merger activity. The amount of time that a galaxy spends in a merging state has no clear bearing on how much a SMBH grows.
-
2.
Gas-rich mergers are most common at high redshift , and mergers are overall most common at intermediate redshift , yet neither redshift range show evidence of merger-induced AGN activity.
-
3.
Mergers occur among AGN with the same probability as among non-AGN, except at low redshift where the very few gas-rich mergers tend to host AGN. This result is in-line with Rosario et al. (2015) who find that evolving global gas fractions mean that mergers are required to trigger AGN in the local universe. Moreover, highly luminous AGN ( erg s-1) are no more likely than non-AGN to undergo mergers.
-
4.
AGN can be found with equal probability in merging as non-merging systems, except at low redshift where AGN are slightly more common in merging systems. On average, AGN activity is not enhanced at any particular phase of a major merger.
-
5.
The predictions of our state-of-the-art zoom cosmological simulations for the AGN-merger connection are consistent with the CANDELS observational sample, when the analysis is carried out in a reasonably comparable manner.
Together this evidence suggests that, while gas-rich mergers may sometimes trigger observable AGN activity at low redshift (and indeed may be a requirement to observe AGN at low redshift), there are probably other mechanisms that play a significant role in fueling moderate luminosity AGN and driving the growth of SMBHs. We plan to further investigate the role of torus-scale obscuration on AGN selection, and hence on the detection of an AGN-merger connection in future work.
7 Acknowledgements
We thank the anonymous referee for providing many valuable comments and suggestions. We thank Alyson Brooks, Ariyeh Maller, and Christopher Hayward for helpful conversations. This work was supported by the 2023 Research Fund of the University of Seoul for E. Choi. Also, this work is supported by NASA grant HST-AR-14287.003 for R. Sharma. R. Somerville gratefully acknowledges support from the Simons Foundation. TN acknowledges support from the Deutsche Forschungsgemeinschaft (DFG, German Research Foundation) under Germany’s Excellence Strategy - EXC-2094 - 390783311 from the DFG Cluster of Excellence “ORIGINS”. We acknowledge the Office of Advanced Research Computing (OARC) at Rutgers, The State University of New Jersey for providing access to the Amarel cluster and associated research computing resources that have contributed to the results reported here.
This work makes use of the following software packages: Powderday (Narayanan et al., 2021), yt (Turk et al., 2011), Hyperion (Robitaille, 2011), FSPS (Conroy & Gunn, 2010), statmorph (Rodriguez-Gomez et al., 2019), RealSim (Bottrell et al., 2019), Scikit-learn (Pedregosa et al., 2011), corner.py (Foreman-Mackey, 2016), and Astropy (Astropy Collaboration et al., 2013, 2018). Powderday was conceived of at the Aspen Center for Physics. The Aspen Center for Physics is supported by National Science Foundation grant PHY-2210452.
8 Data Availability
The data underlying this article will be shared on reasonable request to the corresponding author.
References
- Abraham et al. (2003) Abraham R. G., van den Bergh S., Nair P., 2003, The Astrophysical Journal, 588, 218
- Abruzzo et al. (2018) Abruzzo M. W., Narayanan D., Davé R., Thompson R., 2018, arXiv e-prints, 1803, arXiv:1803.02374
- Ackermann et al. (2018) Ackermann S., Schawinski K., Zhang C., Weigel A. K., Turp M. D., 2018, Monthly Notices of the Royal Astronomical Society, 479, 415
- Anglés-Alcázar et al. (2021) Anglés-Alcázar D., et al., 2021, The Astrophysical Journal, 917, 53
- Arav et al. (2020) Arav N., Xu X., Miller T., Kriss G. A., Plesha R., 2020, The Astrophysical Journal Supplement Series, 247, 37
- Astropy Collaboration et al. (2013) Astropy Collaboration et al., 2013, Astronomy and Astrophysics, 558, A33
- Astropy Collaboration et al. (2018) Astropy Collaboration et al., 2018, The Astronomical Journal, 156, 123
- Aumer et al. (2013) Aumer M., White S. D., Naab T., Scannapieco C., 2013, Monthly Notices of the Royal Astronomical Society, 434, 3142
- Barnes & Hernquist (1991) Barnes J. E., Hernquist L. E., 1991, The Astrophysical Journal Letters, 370, L65
- Barro et al. (2019) Barro G., et al., 2019, The Astrophysical Journal Supplement Series, 243, 22
- Bellovary et al. (2013) Bellovary J., Brooks A., Volonteri M., Governato F., Quinn T., Wadsley J., 2013, The Astrophysical Journal, 779, 136
- Bershady et al. (2000) Bershady M. A., Jangren A., Conselice C. J., 2000, The Astronomical Journal, 119, 2645
- Bessiere et al. (2012) Bessiere P. S., Tadhunter C. N., Ramos Almeida C., Villar Martín M., 2012, Monthly Notices of the Royal Astronomical Society, 426, 276
- Bickley et al. (2021) Bickley R. W., et al., 2021, Monthly Notices of the Royal Astronomical Society, 504, 372
- Bignone et al. (2017) Bignone L. A., Tissera P. B., Sillero E., Pedrosa S. E., Pellizza L. J., Lambas D. G., 2017, Monthly Notices of the Royal Astronomical Society, 465, 1106
- Blumenthal & Barnes (2018) Blumenthal K. A., Barnes J. E., 2018, Monthly Notices of the Royal Astronomical Society, 479, 3952
- Bondi (1952) Bondi H., 1952, Monthly Notices of the Royal Astronomical Society, 112, 195
- Bondi & Hoyle (1944) Bondi H., Hoyle F., 1944, Monthly Notices of the Royal Astronomical Society, 104, 273
- Bottrell et al. (2019) Bottrell C., et al., 2019, Monthly Notices of the Royal Astronomical Society, 490, 5390
- Bournaud et al. (2008) Bournaud F., Duc P. A., Emsellem E., 2008, Monthly Notices of the Royal Astronomical Society, 389, L8
- Bournaud et al. (2011) Bournaud F., Dekel A., Teyssier R., Cacciato M., Daddi E., Juneau S., Shankar F., 2011, The Astrophysical Journal Letters, 741, L33
- Brennan et al. (2015) Brennan R., et al., 2015, Monthly Notices of the Royal Astronomical Society, 451, 2933
- Bridge et al. (2007) Bridge C. R., et al., 2007, The Astrophysical Journal, 659, 931
- Cameron (2011) Cameron E., 2011, Publications of the Astronomical Society of Australia, 28, 128
- Choi et al. (2012) Choi E., Ostriker J. P., Naab T., Johansson P. H., 2012, Astrophysical Journal, 754, 125
- Choi et al. (2015) Choi E., Ostriker J. P., Naab T., Oser L., Moster B. P., 2015, Monthly Notices of the Royal Astronomical Society, 449, 4105
- Choi et al. (2017) Choi E., Ostriker J. P., Naab T., Somerville R. S., Hirschmann M., Núñez A., Hu C.-Y., Oser L., 2017, The Astrophysical Journal, 844, 31
- Churazov et al. (2005) Churazov E., Sazonov S., Sunyaev R., Forman W., Jones C., Böhringer H., 2005, Monthly Notices of the Royal Astronomical Society, 363, L91
- Ciotti & Ostriker (1997) Ciotti L., Ostriker J. P., 1997, The Astrophysical Journal Letters, 487, L105
- Ciotti & Ostriker (2007) Ciotti L., Ostriker J. P., 2007, The Astrophysical Journal, 665, 1038
- Ciotti et al. (2010) Ciotti L., Ostriker J. P., Proga D., 2010, Astrophysical Journal, 717, 708
- Ćiprijanović et al. (2020) Ćiprijanović A., Snyder G. F., Nord B., Peek J. E. G., 2020, Astronomy and Computing, 32, 100390
- Cisternas et al. (2011) Cisternas M., et al., 2011, The Astrophysical Journal, 726, 57
- Conroy & Gunn (2010) Conroy C., Gunn J. E., 2010, The Astrophysical Journal, 712, 833
- Conroy et al. (2009) Conroy C., Gunn J. E., White M., 2009, The Astrophysical Journal, 699, 486
- Conselice et al. (2003) Conselice C. J., Bershady M. A., Dickinson M., Papovich C., 2003, The Astronomical Journal, 126, 1183
- Cotini et al. (2013) Cotini S., Ripamonti E., Caccianiga A., Colpi M., Della Ceca R., Mapelli M., Severgnini P., Segreto A., 2013, Monthly Notices of the Royal Astronomical Society, 431, 2661
- Cox et al. (2006) Cox T. J., Jonsson P., Primack J. R., Somerville R. S., 2006, Monthly Notices of the Royal Astronomical Society, 373, 1013
- Cox et al. (2008) Cox T. J., Jonsson P., Somerville R. S., Primack J. R., Dekel A., 2008, Monthly Notices of the Royal Astronomical Society, 384, 386
- Crain et al. (2015) Crain R. A., et al., 2015, Monthly Notices of the Royal Astronomical Society, 450, 1937
- Darg et al. (2010) Darg D. W., et al., 2010, Monthly Notices of the Royal Astronomical Society, 401, 1552
- De Robertis et al. (1998) De Robertis M. M., Yee H. K. C., Hayhoe K., 1998, The Astrophysical Journal, 496, 93
- Dekel et al. (2009) Dekel A., Sari R., Ceverino D., 2009, The Astrophysical Journal, 703, 785
- Di Matteo et al. (2005) Di Matteo T., Springel V., Hernquist L., 2005, Nature, 433, 604
- Done et al. (2012) Done C., Davis S. W., Jin C., Blaes O., Ward M., 2012, Monthly Notices of the Royal Astronomical Society, 420, 1848
- Donley et al. (2018) Donley J. L., et al., 2018, The Astrophysical Journal, 853, 63
- Draine (2003) Draine B. T., 2003, Annual Review of Astronomy and Astrophysics, 41, 241
- Dubois et al. (2015) Dubois Y., Volonteri M., Silk J., Devriendt J., Slyz A., Teyssier R., 2015, Monthly Notices of the Royal Astronomical Society, 452, 1502
- Ellison et al. (2011) Ellison S. L., Patton D. R., Mendel J. T., Scudder J. M., 2011, Monthly Notices of the Royal Astronomical Society, 418, 2043
- Ellison et al. (2013) Ellison S. L., Mendel J. T., Scudder J. M., Patton D. R., Palmer M. J. D., 2013, Monthly Notices of the Royal Astronomical Society, 430, 3128
- Ellison et al. (2019) Ellison S. L., Viswanathan A., Patton D. R., Bottrell C., McConnachie A. W., Gwyn S., Cuillandre J.-C., 2019, Monthly Notices of the Royal Astronomical Society, 487, 2491
- Elmegreen et al. (2017) Elmegreen B. G., Elmegreen D. M., Tompkins B., Jenks L. G., 2017, The Astrophysical Journal, 847, 14
- Fan et al. (2016) Fan L., et al., 2016, The Astrophysical Journal Letters, 822, L32
- Ferrarese & Merritt (2000) Ferrarese L., Merritt D., 2000, The Astrophysical Journal Letters, 539, L9
- Ferreira et al. (2020) Ferreira L., Conselice C. J., Duncan K., Cheng T.-Y., Griffiths A., Whitney A., 2020, The Astrophysical Journal, 895, 115
- Fiacconi et al. (2017) Fiacconi D., Mayer L., Madau P., Lupi A., Dotti M., Haardt F., 2017, Monthly Notices of the Royal Astronomical Society, 467, 4080
- Foreman-Mackey (2016) Foreman-Mackey D., 2016, The Journal of Open Source Software, 1
- Förster Schreiber & Wuyts (2020) Förster Schreiber N. M., Wuyts S., 2020, Annual Review of Astronomy and Astrophysics, vol. 58, p.661-725, 58, 661
- Förster Schreiber et al. (2014) Förster Schreiber N. M., et al., 2014, The Astrophysical Journal, 787, 38
- Förster Schreiber et al. (2018) Förster Schreiber N. M., et al., 2018, The Astrophysical Journal Supplement Series, 238, 21
- Gabor et al. (2009) Gabor J. M., et al., 2009, The Astrophysical Journal, 691, 705
- Gabor et al. (2016) Gabor J. M., Capelo P. R., Volonteri M., Bournaud F., Bellovary J., Governato F., Quinn T., 2016, Astronomy and Astrophysics, 592, A62
- Galametz et al. (2013) Galametz A., et al., 2013, The Astrophysical Journal Supplement Series, 206, 10
- Gan et al. (2019) Gan Z., Choi E., Ostriker J. P., Ciotti L., Pellegrini S., 2019, The Astrophysical Journal, 875, 109
- Gan et al. (2020) Gan Z., Hensley B. S., Ostriker J. P., Ciotti L., Schiminovich D., Pellegrini S., 2020, The Astrophysical Journal, 901, 7
- Gebhardt et al. (2000) Gebhardt K., et al., 2000, The Astrophysical Journal Letters, 539, L13
- Glasser (1962) Glasser G. J., 1962, Journal of the American Statistical Association, 57, 648
- Glikman et al. (2015) Glikman E., Simmons B., Mailly M., Schawinski K., Urry C. M., Lacy M., 2015, The Astrophysical Journal, 806, 218
- Goulding et al. (2018) Goulding A. D., et al., 2018, Publications of the Astronomical Society of Japan, 70, S37
- Grogin et al. (2005) Grogin N. A., et al., 2005, The Astrophysical Journal Letters, 627, L97
- Grogin et al. (2011) Grogin N. A., et al., 2011, The Astrophysical Journal Supplement Series, 197, 35
- Guo et al. (2013) Guo Y., et al., 2013, The Astrophysical Journal Supplement Series, 207, 24
- Haardt & Madau (2001) Haardt F., Madau P., 2001, in Neumann D., Tran J., eds, Clusters of Galaxies and the High Redshift Universe Observed in X-Rays.
- Habouzit et al. (2019) Habouzit M., et al., 2019, Monthly Notices of the Royal Astronomical Society, 484, 4413
- Häring & Rix (2004) Häring N., Rix H.-W., 2004, The Astrophysical Journal Letters, 604, L89
- Hickox et al. (2014) Hickox R. C., Mullaney J. R., Alexander D. M., Chen C.-T. J., Civano F. M., Goulding A. D., Hainline K. N., 2014, The Astrophysical Journal, 782, 9
- Hirschmann et al. (2012) Hirschmann M., Naab T., Somerville R. S., Burkert A., Oser L., 2012, Monthly Notices of the Royal Astronomical Society, 419, 3200
- Hirschmann et al. (2014) Hirschmann M., Dolag K., Saro A., Bachmann L., Borgani S., Burkert A., 2014, Monthly Notices of the Royal Astronomical Society, 442, 2304
- Hocking et al. (2018) Hocking A., Geach J. E., Sun Y., Davey N., 2018, Monthly Notices of the Royal Astronomical Society, 473, 1108
- Hopkins et al. (2005) Hopkins P. F., Hernquist L., Cox T. J., Di Matteo T., Martini P., Robertson B., Springel V., 2005, The Astrophysical Journal, 630, 705
- Hopkins et al. (2006) Hopkins P. F., Somerville R. S., Hernquist L., Cox T. J., Robertson B., Li Y., 2006, The Astrophysical Journal, 652, 864
- Hopkins et al. (2007) Hopkins P. F., Richards G. T., Hernquist L., 2007, The Astrophysical Journal, 654, 731
- Hopkins et al. (2008a) Hopkins P. F., Hernquist L., Cox T. J., Kereš D., 2008a, The Astrophysical Journal Supplement Series, 175, 356
- Hopkins et al. (2008b) Hopkins P. F., Cox T. J., Kereš D., Hernquist L., 2008b, The Astrophysical Journal Supplement Series, 175, 390
- Hopkins et al. (2009) Hopkins P. F., Cox T. J., Younger J. D., Hernquist L., 2009, The Astrophysical Journal, 691, 1168
- Hoyle & Lyttleton (1939) Hoyle F., Lyttleton R., 1939, Proceedings of the Cambridge Philosophical Society, 34, 405
- Hu et al. (2014) Hu C. Y., Naab T., Walch S., Moster B. P., Oser L., 2014, Monthly Notices of the Royal Astronomical Society, 443, 1173
- Huertas-Company et al. (2018) Huertas-Company M., et al., 2018, The Astrophysical Journal, 858, 114
- Huertas-Company et al. (2019) Huertas-Company M., et al., 2019, Monthly Notices of the Royal Astronomical Society, 489, 1859
- Iwamoto et al. (1999) Iwamoto K., Brachwitz F., Nomoto K., Kishimoto N., Umeda H., Hix W. R., Thielemann F.-K., 1999, The Astrophysical Journal Supplement Series, 125, 439
- Ji et al. (2014) Ji I., Peirani S., Yi S. K., 2014, Astronomy and Astrophysics, 566, A97
- Jogee et al. (2009) Jogee S., et al., 2009, The Astrophysical Journal, 697, 1971
- Karakas (2010) Karakas A. I., 2010, Monthly Notices of the Royal Astronomical Society, 403, 1413
- Kartaltepe et al. (2015) Kartaltepe J. S., et al., 2015, The Astrophysical Journal Supplement Series, 221, 11
- Kocevski et al. (2012) Kocevski D. D., et al., 2012, The Astrophysical Journal, 744, 148
- Kocevski et al. (2015) Kocevski D. D., et al., 2015, The Astrophysical Journal, 814, 104
- Kocevski et al. (2018) Kocevski D. D., et al., 2018, The Astrophysical Journal Supplement Series, 236, 48
- Koekemoer et al. (2011) Koekemoer A. M., et al., 2011, The Astrophysical Journal Supplement Series, 197, 36
- Kormendy & Ho (2013) Kormendy J., Ho L. C., 2013, Annu. Rev. Astron. Astrophys, 51, 511
- Kormendy & Kennicutt (2004) Kormendy J., Kennicutt Jr. R. C., 2004, Annual Review of Astronomy and Astrophysics, 42, 603
- Koss et al. (2010) Koss M., Mushotzky R., Veilleux S., Winter L., 2010, The Astrophysical Journal Letters, 716, L125
- Koss et al. (2012) Koss M., Mushotzky R., Treister E., Veilleux S., Vasudevan R., Trippe M., 2012, The Astrophysical Journal Letters, 746, L22
- Koss et al. (2018) Koss M. J., et al., 2018, Nature, 563, 214
- Kroupa (2001) Kroupa P., 2001, Monthly Notices of the Royal Astronomical Society, 322, 231
- Lackner et al. (2014) Lackner C. N., et al., 2014, The Astronomical Journal, 148, 137
- Lemaître et al. (2017) Lemaître G., Nogueira F., Aridas C. K., 2017, Journal of Machine Learning Research, 18, 1
- Li et al. (2008) Li C., Kauffmann G., Heckman T. M., White S. D. M., Jing Y. P., 2008, Monthly Notices of the Royal Astronomical Society, 385, 1915
- Lotz et al. (2004) Lotz J. M., Primack J., Madau P., 2004, The Astronomical Journal, 128, 163
- Lotz et al. (2008) Lotz J. M., et al., 2008, The Astrophysical Journal, 672, 177
- Lotz et al. (2010) Lotz J. M., Jonsson P., Cox T. J., Primack J. R., 2010, Monthly Notices of the Royal Astronomical Society, 404, 575
- Magorrian et al. (1997) Magorrian J., et al., 1997, The Astronomical Journal, Volume 115, Issue 6, pp. 2285-2305., 115, 2285
- Mantha et al. (2018) Mantha K. B., et al., 2018, Monthly Notices of the Royal Astronomical Society, 475, 1549
- Marconi & Hunt (2003) Marconi A., Hunt L. K., 2003, The Astrophysical Journal Letters, 589, L21
- Marian et al. (2019) Marian V., et al., 2019, The Astrophysical Journal, 882, 141
- McAlpine et al. (2020) McAlpine S., Harrison C. M., Rosario D. J., Alexander D. M., Ellison S. L., Johansson P. H., Patton D. R., 2020, Monthly Notices of the Royal Astronomical Society, 494, 5713
- Mechtley et al. (2016) Mechtley M., et al., 2016, The Astrophysical Journal, 830, 156
- Menci et al. (2014) Menci N., Gatti M., Fiore F., Lamastra A., 2014, Astronomy and Astrophysics, 569, A37
- Mullaney et al. (2012) Mullaney J. R., et al., 2012, Monthly Notices of the Royal Astronomical Society, 419, 95
- Mundy et al. (2017) Mundy C. J., Conselice C. J., Duncan K. J., Almaini O., Häußler B., Hartley W. G., 2017, Mon Not R Astron Soc, 470, 3507
- Naab & Ostriker (2017) Naab T., Ostriker J. P., 2017, Annu. Rev. Astron. Astrophys., 55, 59
- Nandra et al. (2015) Nandra K., et al., 2015, The Astrophysical Journal Supplement Series, 220, 10
- Narayanan et al. (2021) Narayanan D., et al., 2021, The Astrophysical Journal Supplement Series, 252, 12
- Nayyeri et al. (2017) Nayyeri H., et al., 2017, The Astrophysical Journal Supplement Series, 228, 7
- Nenkova et al. (2008a) Nenkova M., Sirocky M. M., Ivezić Ž., Elitzur M., 2008a, The Astrophysical Journal, 685, 147
- Nenkova et al. (2008b) Nenkova M., Sirocky M. M., Nikutta R., Ivezić Ž., Elitzur M., 2008b, The Astrophysical Journal, 685, 160
- Nevin et al. (2019) Nevin R., Blecha L., Comerford J., Greene J., 2019, The Astrophysical Journal, 872, 76
- Nulsen & Fabian (2000) Nulsen P. E. J., Fabian A. C., 2000, Monthly Notices of the Royal Astronomical Society, 311, 346
- Núñez et al. (2017) Núñez A., Ostriker J. P., Naab T., Oser L., Hu C.-Y., Choi E., 2017, The Astrophysical Journal, 836, 204
- Nyman et al. (1992) Nyman L., et al., 1992, Astronomy & Astrophysics. Supplement Series, 93, 121
- O’Leary et al. (2021) O’Leary J. A., Moster B. P., Naab T., Somerville R. S., 2021, Monthly Notices of the Royal Astronomical Society, 501, 3215
- Oser et al. (2010) Oser L., Ostriker J. P., Naab T., Johansson P. H., Burkert A., 2010, Astrophysical Journal, 725, 2312
- Pawlik et al. (2016) Pawlik M. M., Wild V., Walcher C. J., Johansson P. H., Villforth C., Rowlands K., Mendez-Abreu J., Hewlett T., 2016, Monthly Notices of the Royal Astronomical Society, 456, 3032
- Pedregosa et al. (2011) Pedregosa F., et al., 2011, Journal of Machine Learning Research, 12, 2825
- Pellegrini et al. (2020) Pellegrini S., Gan Z., Ostriker J. P., Ciotti L., 2020, Astronomische Nachrichten, 341, 184
- Pontzen et al. (2017) Pontzen A., Tremmel M., Roth N., Peiris H. V., Saintonge A., Volonteri M., Quinn T., Governato F., 2017, Monthly Notices of the Royal Astronomical Society, 465, 547
- Reichard et al. (2009) Reichard T. A., Heckman T. M., Rudnick G., Brinchmann J., Kauffmann G., Wild V., 2009, The Astrophysical Journal, 691, 1005
- Robertson et al. (2006) Robertson B., Bullock J. S., Cox T. J., Di Matteo T., Hernquist L., Springel V., Yoshida N., 2006, The Astrophysical Journal, 645, 986
- Robitaille (2011) Robitaille T. P., 2011, Astronomy and Astrophysics, 536, A79
- Rodriguez-Gomez et al. (2015) Rodriguez-Gomez V., et al., 2015, Monthly Notices of the Royal Astronomical Society, 449, 49
- Rodriguez-Gomez et al. (2019) Rodriguez-Gomez V., et al., 2019, Monthly Notices of the Royal Astronomical Society, 483, 4140
- Rosario et al. (2015) Rosario D. J., et al., 2015, Astronomy and Astrophysics, 573, A85
- Sabater et al. (2015) Sabater J., Best P. N., Heckman T. M., 2015, Monthly Notices of the Royal Astronomical Society, 447, 110
- Sanders et al. (1988) Sanders D. B., Soifer B. T., Elias J. H., Madore B. F., Matthews K., Neugebauer G., Scoville N. Z., 1988, The Astrophysical Journal, 325, 74
- Santini et al. (2012) Santini P., et al., 2012, Astronomy & Astrophysics, Volume 540, id.A109, 20 pp., 540, A109
- Santini et al. (2015) Santini P., et al., 2015, The Astrophysical Journal, 801, 97
- Satyapal et al. (2014) Satyapal S., Secrest N. J., McAlpine W., Ellison S. L., Fischer J., Rosenberg J. L., 2014, The Astrophysical Journal, 784, 113
- Sazonov et al. (2004) Sazonov S. Y., Ostriker J. P., Sunyaev R. A., 2004, Monthly Notices of the Royal Astronomical Society, 347, 144
- Sazonov et al. (2005) Sazonov S. Y., Ostriker J. P., Ciotti L., Sunyaev R. A., 2005, Monthly Notices of the Royal Astronomical Society, 358, 168
- Schawinski et al. (2012) Schawinski K., Simmons B. D., Urry C. M., Treister E., Glikman E., 2012, Monthly Notices of the Royal Astronomical Society, 425, L61
- Schaye et al. (2015) Schaye J., et al., 2015, Monthly Notices of the Royal Astronomical Society, 446, 521
- Silverman et al. (2011) Silverman J. D., et al., 2011, The Astrophysical Journal, 743, 2
- Snyder et al. (2015a) Snyder G. F., Lotz J., Moody C., Peth M., Freeman P., Ceverino D., Primack J., Dekel A., 2015a, Monthly Notices of the Royal Astronomical Society, 451, 4290
- Snyder et al. (2015b) Snyder G. F., et al., 2015b, Monthly Notices of the Royal Astronomical Society, 454, 1886
- Snyder et al. (2019) Snyder G. F., Rodriguez-Gomez V., Lotz J. M., Torrey P., Quirk A. C. N., Hernquist L., Vogelsberger M., Freeman P. E., 2019, Monthly Notices of the Royal Astronomical Society, 486, 3702
- Somerville & Davé (2015) Somerville R. S., Davé R., 2015, Annual Review of Astronomy and Astrophysics, 53, 51
- Somerville et al. (2008) Somerville R. S., Hopkins P. F., Cox T. J., Robertson B. E., Hernquist L., 2008, Monthly Notices of the Royal Astronomical Society, 391, 481
- Spergel et al. (2007) Spergel D. N., et al., 2007, The Astrophysical Journal Supplement Series, 170, 377
- Springel (2005) Springel V., 2005, Monthly Notices of the Royal Astronomical Society, 364, 1105
- Springel et al. (2005a) Springel V., Di Matteo T., Hernquist L., 2005a, Monthly Notices of the Royal Astronomical Society, 361, 776
- Springel et al. (2005b) Springel V., Di Matteo T., Hernquist L., 2005b, The Astrophysical Journal Letters, 620, L79
- Stefanon et al. (2017) Stefanon M., et al., 2017, The Astrophysical Journal Supplement Series, 229, 32
- Steinborn et al. (2018) Steinborn L. K., Hirschmann M., Dolag K., Shankar F., Juneau S., Krumpe M., Remus R.-S., Teklu A. F., 2018, Monthly Notices of the Royal Astronomical Society, 481, 341
- Strömgren (1939) Strömgren B., 1939, The Astrophysical Journal, 89, 526
- Thomas et al. (2005) Thomas D., Maraston C., Bender R., Mendes de Oliveira C., 2005, The Astrophysical Journal, 621, 673
- Treister et al. (2012) Treister E., Schawinski K., Urry C. M., Simmons B. D., 2012, The Astrophysical Journal Letters, 758, L39
- Turk et al. (2011) Turk M. J., Smith B. D., Oishi J. S., Skory S., Skillman S. W., Abel T., Norman M. L., 2011, The Astrophysical Journal Supplement Series, 192, 9
- Ventou et al. (2019) Ventou E., et al., 2019, Astronomy & Astrophysics, Volume 631, id.A87, $<$NUMPAGES$>$18$<$/NUMPAGES$>$ pp., 631, A87
- Villforth et al. (2014) Villforth C., et al., 2014, Monthly Notices of the Royal Astronomical Society, 439, 3342
- Weston et al. (2017) Weston M. E., McIntosh D. H., Brodwin M., Mann J., Cooper A., McConnell A., Nielsen J. L., 2017, Monthly Notices of the Royal Astronomical Society, 464, 3882
- Wiersma et al. (2009) Wiersma R. P., Schaye J., Smith B. D., 2009, Monthly Notices of the Royal Astronomical Society, 393, 99
- Woosley & Weaver (1995) Woosley S. E., Weaver T. A., 1995, The Astrophysical Journal Supplement Series, 101, 181
- Xue et al. (2011) Xue Y. Q., et al., 2011, The Astrophysical Journal Supplement Series, 195, 10
- Xue et al. (2016) Xue Y. Q., Luo B., Brandt W. N., Alexander D. M., Bauer F. E., Lehmer B. D., Yang G., 2016, The Astrophysical Journal Supplement Series, 224, 15
- Zanisi et al. (2021) Zanisi L., et al., 2021, Monthly Notices of the Royal Astronomical Society, 501, 4359