Distinct High Energy Cutoff Variation Patterns in Two Seyfert Galaxies
Abstract
Investigating how the cutoff energy varies with X-ray flux and photon index in individual AGNs opens a new window to probe the yet unclear coronal physics. So far variations have only been detected in several AGNs but different patterns have been reported. Here we report new detections of variations in two Seyfert galaxies with multiple NuSTAR exposures. While in NGC 3227 monotonically increases with , the – relation exhibits a shape in SWIFT J2127.4+5654 ( increasing with at 2.05, but reversely decreasing at 2.05), indicating more than a single underlying mechanism is involved. Meanwhile both galaxies show softer spectra while they brighten in X-ray, a common phenomenon in Seyfert galaxies. Plotting all 7 AGNs with variations ever reported with NuSTAR observations in the – diagram, we find they could be unified with the pattern. Although the sample is small and SWIFT J2127.4+5654 is the only source with varying across the break point thus the only one exhibiting the complete pattern in a single source, the discoveries shed new light on the coronal physics in AGNs. Possible underlying physical mechanisms are discussed.
keywords:
Galaxies: active – Galaxies: nuclei – X-rays: galaxies1 Introduction
In the standard disc-corona paradigm the hard X-ray emission of active galactic nuclei (AGNs) is produced in a hot and compact region, the so called corona (e.g. Haardt & Maraschi, 1991; Haardt et al., 1994), through the inverse Compton scattering of the seed photons from the accretion disk. This process could produce the observed power law continuum with a high-energy cutoff. Such a cutoff has been detected in a number of AGNs (Zdziarski et al., 2000; Molina et al., 2013), particularly with the high-quality hard X-ray spectra of NuSTAR (e.g., Matt et al., 2015; Tortosa et al., 2018; Molina et al., 2019; Kang et al., 2020), providing key constraints on the yet unclear coronal physics (e.g. Fabian et al., 2015).
The Nuclear Spectroscopic Telescope Array (NuSTAR Harrison et al., 2013) also enables the detection of (or coronal temperature ) variations in individual AGNs with multiple exposures, including 3C 382 (Ballantyne et al., 2014), NGC 5548 (Ursini et al., 2015), Mrk 335 (Keek & Ballantyne, 2016), NGC 4593 (Ursini et al., 2016; Middei et al., 2019a), MCG–5–23–16 (Zoghbi et al., 2017), and 4C 74.26 (Zhang et al., 2018). Zhang et al. (2018) also revisited the first five sources mentioned above using the spectra ratio technique they developed. They confirmed the claimed variations in 3 of them, but disproved those in NGC 4593 and MCG–5–23–16. Despite the limited number of sources, these studies have opened a new window to probe the coronal physics. Remarkably, Zhang et al. (2018) found that all the 4 AGNs with variations confirmed tend to have larger (thus hotter corona) when they brighten and soften in X-ray. In other words, they show a “hotter-when-brighter” behavior along with the conventional “softer-when-brighter” pattern (e.g., Markowitz et al., 2003; Sobolewska & Papadakis, 2009). Possible underlying mechanisms have been discussed in Zhang et al. (2018) and Wu et al. (2020), including geometrical changes of the corona and pair production. Do Seyfert galaxies universally follow this “hotter-when-softer/brighter” pattern? A possible counter-example is the narrow line Seyfert 1 galaxy (NLS1) Ark 564, for which Barua et al. (2020) found cooler corona (though statistically marginal) during the softer and brighter phases within a 200 ks NuSTAR observation.
In this letter we report new detections of variations in two Seyfert galaxies, NGC 3227 and SWIFT J2127.4+5654, and a shaped – relation for the first time. §2 presents the NuSTAR observations and data reduction. In §3 we describe the spectral models and deliver the fitting results. In §4 we discuss the spectral variabilities and the underlying mechanisms for AGNs with reported variations.
| Source | ID and No. | Obs. time | Exposure | Flux3-78keV |
|---|---|---|---|---|
| (ks) | ||||
| NGC 3227 | 60202002002 (1) | 2016–11–09 | 49.8 | 1.26 |
| 60202002004 (2) | 2016–11–25 | 42.5 | 1.05 | |
| 60202002006 (3) | 2016–11–29 | 39.7 | 1.16 | |
| 60202002008 (4) | 2016–12–01 | 41.8 | 1.37 | |
| 60202002010 (5) | 2016–12–05 | 40.9 | 1.38 | |
| 60202002012 (6) | 2016–12–09 | 39.3 | 1.35 | |
| 60202002014 (7) | 2017–01–21 | 47.6 | 1.8 | |
| SWIFT J2127.4+5654 | 60001110002 (1) | 2012–11–04 | 49.2 | 0.58 |
| 60001110003 (2) | 2012–11–05 | 28.8 | 0.71 | |
| 60001110005 (3) | 2012–11–06 | 74.6 | 0.77 | |
| 60001110007 (4) | 2012–11–08 | 42.1 | 0.82 | |
| 60402008004 (5) | 2018–07–16 | 71.6 | 0.83 | |
| 60402008006 (6) | 2018–07–30 | 72.1 | 0.85 | |
| 60402008008 (7) | 2018–09–14 | 72.9 | 0.66 | |
| 60402008010 (8) | 2018–12–30 | 74.2 | 0.76 |
-
•
: For convenience, the observations for each source were sorted and numbered (in parenthesis) by time.
| ID and No. | NH | EW | (pexrav) | (pexriv) | (relxill) | (xillverCp) | (relxillCp) | |||||||
| () | (eV) | (keV) | (keV) | (keV) | (keV) | (keV) | ||||||||
| NGC 3227 | ||||||||||||||
| 60202002002 (1) | 1.05 | 1.05 | 1.09 | 1.1 | 1.11 | |||||||||
| 60202002004 (2) | 0.96 | 0.95 | 1.00 | 1.02 | 1.03 | |||||||||
| 60202002006 (3) | 1.16 | 1.15 | 1.15 | 1.17 | 1.19 | |||||||||
| 60202002008 (4) | 1.02 | 1.03 | 1.04 | 1.03 | 1.06 | |||||||||
| 60202002010 (5) | 0.99 | 0.97 | 0.98 | 1.02 | 0.99 | |||||||||
| 60202002012 (6) | 0.93 | 0.92 | 0.94 | 1.00 | 0.95 | |||||||||
| 60202002014 (7) | 1.01 | 1.01 | 1.01 | 1.04 | 1.04 | |||||||||
| SWIFT J2127.4+5654 | ||||||||||||||
| 60001110002 (1) | 1.01 | 1.01 | 1.06 | 1.07 | 1.04 | |||||||||
| 60001110003 (2) | 0.96 | 0.97 | 0.98 | 1.03 | 0.98 | |||||||||
| 60001110005 (3) | 1.01 | 1.02 | 1.04 | 1.13 | 1.03 | |||||||||
| 60001110007 (4) | 0.96 | 0.96 | 1.02 | 1.03 | 1.00 | |||||||||
| 60402008004 (5) | 1.09 | 1.07 | 1.12 | 1.18 | 1.10 | |||||||||
| 60402008006 (6) | 0.93 | 0.94 | 0.96 | 1.03 | 0.95 | |||||||||
| 60402008008 (7) | 0.95 | 0.95 | 0.98 | 1.07 | 0.97 | |||||||||
| 60402008010 (8) | 1.03 | 1.05 | 1.09 | 1.19 | 1.07 | |||||||||
-
•
: In some observations a broad Fe K line is statistically needed, with the corresponding EW marked with . NGC 3227: 60202002004, = keV. SWIFT J2127.4+5654: 60001110002, = keV; 60402008006, = keV; 60402008008, = keV.
2 Observations and Data Reduction
NGC 3227 is a radio-quiet Seyfert 1.5 galaxy (Véron-Cetty & Véron, 2006) at z = 0.0039111The radio types and the redshifts are from NED: http://ned.ipac.caltech.edu. In Tab. 1 we list the seven archival NuSTAR observations of NGC 3227. NGC 3227 shows highly variable X-ray emission and its absorption feature have been extensively investigated in literature. As an example, based on the NuSTAR and XMM-Newton observations, Turner et al. (2018) found a rapid occultation event in NGC 3227 between two exposures of NuSTAR (60202002010 and 60202002012), with several absorber zones involved. However, as further shown in §3, our study on the high-energy cutoff in this work is barely influenced by these complex absorbers.
Meanwhile, SWIFT J2127.4+5654, a radio-quiet NLS1 (Malizia et al., 2008) at z = 0.0144, has been observed by NuSTAR in two campaigns, with four exposures in 2012 and five in 2018. We dropped the observation 60402008002 (not listed in Tab. 1) of SWIFT J2127.4+5654, which has an issue flag = 1, indicating possible contamination from solar activity or other unexpected issues. Marinucci et al. (2014) performed a joint spectral fitting of the four 2012 observations with (quasi-)simultaneous XMM-Newton data and an average = keV was reported. Besides, using XMM-Newton data only, Sanfrutos et al. (2013) reported a partial covering absorber in SWIFT J2127.4+5654 with and a covering fraction 0.43, whereas we find it has negligible effect in NuSTAR spectra.
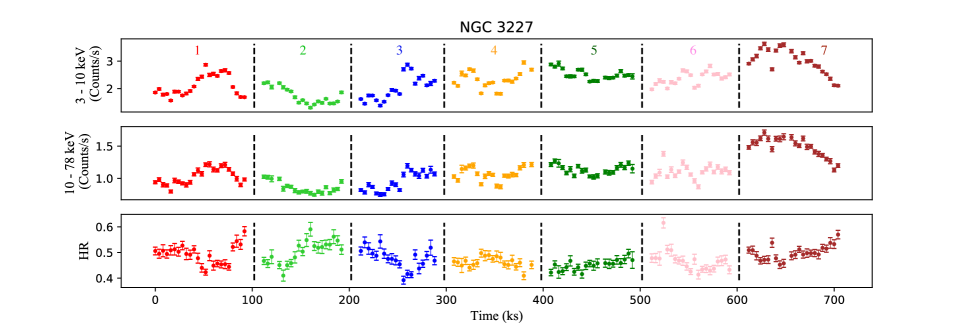
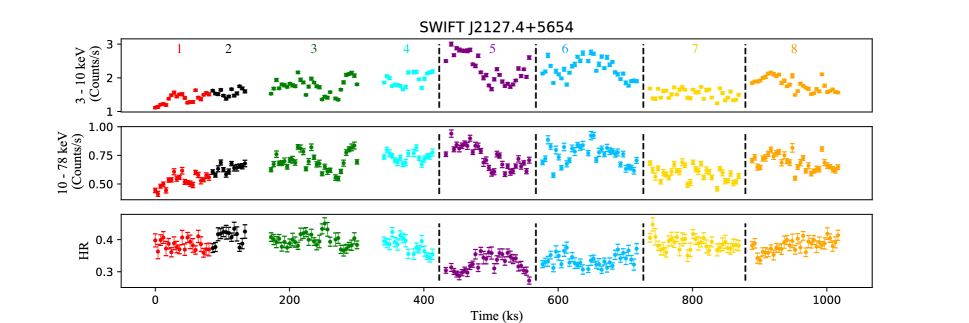
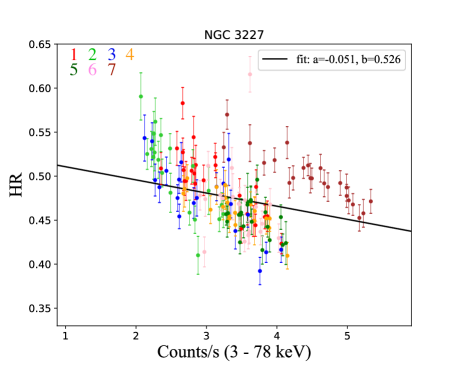
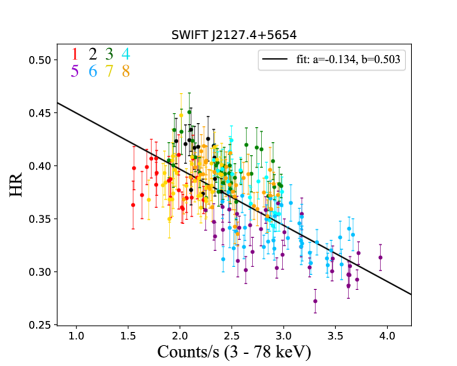
NuSTAR data reduction is performed using the NuSTAR Data Analysis Software (NuSTARDAS) within the HEAsoft package (version 6.26). With CALDB version 20190513, the calibrated and cleaned event files are produced with nupipeline. We first extract the light curves using nuproducts, adopting a circular source region with a radius of 60″ centered on each source, and an annulus from 120″ to 200″ for background extraction. The light curves from FPMA and FPMB, with the livetime, PSF/EXPOSURE and vignetting corrections applied, are then combined using lcmath. The 3 – 10 keV and 10 – 78 keV light curves, along with the 10 – 78 keV/ 3 – 10 keV hardness ratios, are plotted in Fig. 1. Both sources show clear variations in flux (count rate) and spectra shape (hardness ratio), not only between but also within the individual exposures. In the plot of hardness ratio (HR) versus count rate (Fig. 2) both sources clearly exhibit the “softer-when-brighter” pattern. However different individual exposures appear to follow different “softer-when-brighter” tracks. For instance, Obs. ID 60202002014 (No. 7) of NGC 3227 clearly deviate from other exposures in Fig. 2. See also exposures No. 1 and No. 2, No. 5 and No. 6 of SWIFT J2127.4+5654. Such variations could be due to the physical or structural changes in the corona which may lead to different “softer-when-brighter" tracks (e.g., Sarma et al., 2015), stopping us from merging data from different exposures according to the count rate or hardness ratio. In this work we focus on the analyses of spectra integrated over individual exposures and investigate the variations between these exposures. Though rapid hardness ratio variations within individual exposures are seen, due to limited photon counts we are yet unable to explore more rapid variations in two sources.
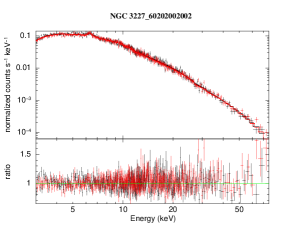
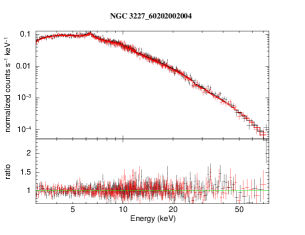
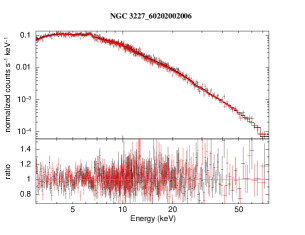
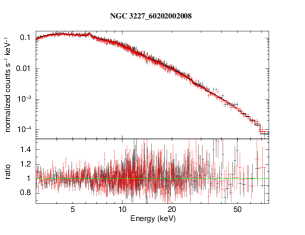
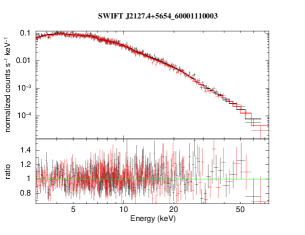
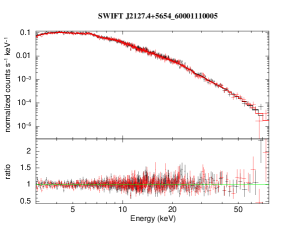
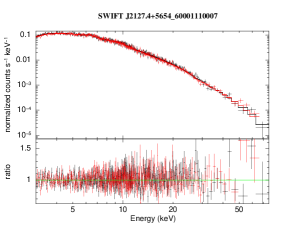
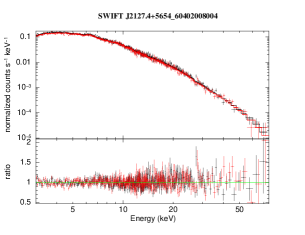
Source spectra are extracted from the same circular regions as the light curves, using the nuproducts. As for background extraction, we use NUSKYBGD developed by Wik et al. (2014) to handle the spatially variable background of NuSTAR observations (see also Kang et al., 2020, for an example). NuSTAR observations generally do not suffer from pile-up222https://heasarc.gsfc.nasa.gov/docs/nustar/nustar_faq.html#pileup. Meanwhile, we find the low-energy effective area issue for FPMA (Madsen et al., 2020) to be insignificant in all the observations and no low energy excess in FPMA spectra is found (see Fig. 7). As a final step, the source spectra are rebinned to achieve a minimum of 50 counts bin-1 using grppha.
We notice there are (quasi-)simultaneous XMM-Newton observations for both sources (six of NGC 3227 and three of SWIFT J2127.4+5654). However, we find slightly different photon indices between most XMM-Newton and NuSTAR exposures for both sources. Such discrepancy, likely due to the inter-instrument calibration, is widely found in literature (e.g. Cappi et al., 2016; Ponti et al., 2018; Middei et al., 2019b). Additionally, the fact that XMM-Newton and NuSTAR exposures are not perfectly simultaneous may also have played a role due to the intrinsic spectral variation. However requiring perfect simultaneity would yield significant loss of the valuable NuSTAR exposure time. Since measurement is sensitive to the photon index (e.g., Molina et al., 2019; Kang et al., 2020) and not all NuSTAR exposures have corresponding XMM-Newton observations, in this work we do not include those XMM-Newton exposures but provide uniform spectral fitting to NuSTAR spectra alone.
3 Spectral fitting
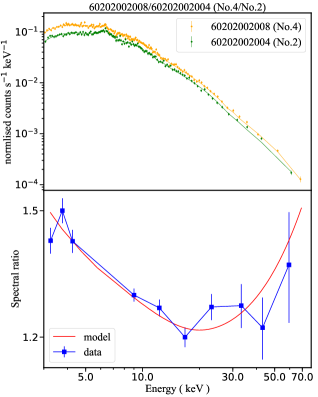
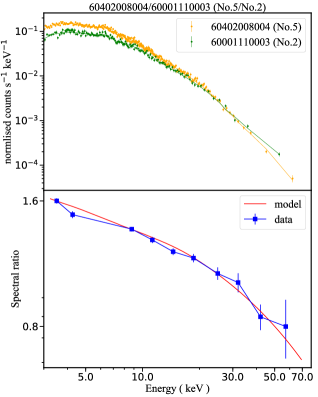
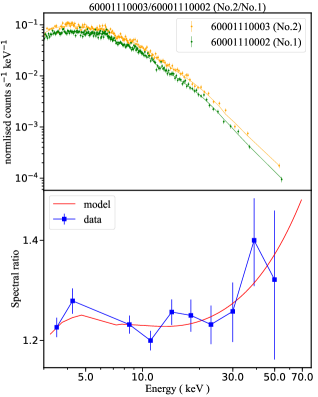
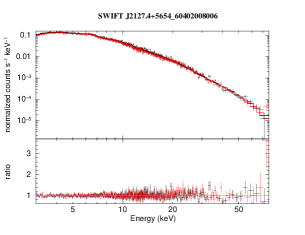
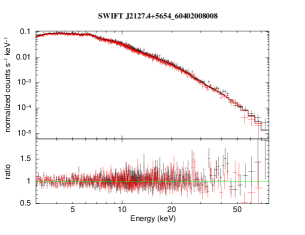
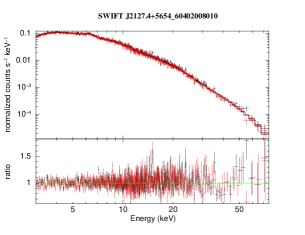
Zhang et al. (2018) developed the spectral ratio technique, analogous to the difference-imaging technique in astronomy, to assist the study of variations. Briefly, if the is invariable within two observations, the ratio of two spectra (primarily exponentially cutoff power law) is supposed to be a straight line in log-log space in the spectra ratio plot. So we can notice potential variations directly by looking for deviations from the straight line at the high energy end (see Zhang et al., 2018, for details). We applied this technique to AGNs with multiple archival NuSTAR exposures and took notice of NGC 3227 and SWIFT J2127.4+5654, of which the spectral ratios indicate clear and prominent variations as shown in Fig. 3. In this section, we perform spectral fitting to quantify the variations in both sources.
Spectral fitting is performed in the 3–78 keV band within XSPEC (Arnaud, 1996), using statistics and the relative element abundances given by Anders & Grevesse (1989). All errors along with the upper/lower limits reported throughout the letter are calculated using = 2.71 criterion (90% confidence range). For each observation, the spectra obtained by the two NuSTAR modules (FPMA and FPMB) are fitted simultaneously, with a cross-normalization difference typically less than 5% (Madsen et al., 2015).
We employ pexrav (Magdziarz & Zdziarski, 1995) to describe the exponentially cutoff power law plus the reflection component. For simplicity, the solar element abundance for the reflector and an inclination of are adopted (as default of this model)333These two parameters are poorly constrained with NuSTAR spectra if allowed free to vary, thus are commonly fixed at the default values in many studies on NuSTAR spectra (e.g. Zhang et al., 2018; Molina et al., 2019; Panagiotou & Walter, 2020).Through joint fitting XMM-Newton and NuSTAR spectra of SWIFT J2127.4+5654, Marinucci et al. (2014) reported an iron abundance AFe of 0.71 and an inclination angle of 49∘, slightly different from the default values we adopted. Generally, larger AFe (inclination angle) would yield slightly higher (higher) reflection fraction R, smaller (larger) photon index and lower (higher) cutoff energy . However adopting different values of AFe or inclination angle would not alter the main results of this work. . We let the photon index , and the reflection fraction free to vary. In addition, zphabs is used to model the intrinsic absorption, with the Galactic absorption ignored due to its negligible impact on NuSTAR spectra. Replacing the component with to account for the partial covering reported in both sources (Turner et al., 2018; Sanfrutos et al., 2013) does not affect our measurements, as such absorbers have negligible influence on NuSTAR spectra.
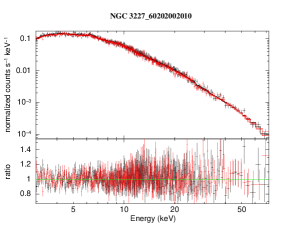
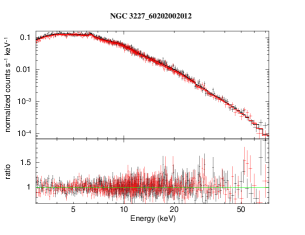
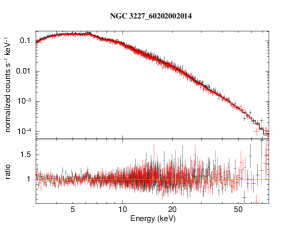
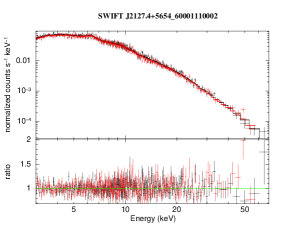
As for the Fe K emission lines, several lines have been previously found in both sources with XMM-Newton spectra (e.g. Markowitz et al., 2009; Marinucci et al., 2014), whereas some of them are insignificant in NuSTAR spectra, likely due to the limited spectral resolution ( 0.4 keV at 6 keV). We use a statistical standard to model possible lines as follows. We add a zgauss component at 6.4 keV (rest frame) with its width fixed at 19 eV (the mean Fe K line width in AGNs measured with Chandra HETG, Shu et al., 2010) to describe a neutral and narrow Fe K line. Since the Fe K line could be relativistically broadened, we allow the width to vary freely. If a free width can significantly improve the fit (), the corresponding fitting results are adopted (see Tab. 2). Furthermore, we find no other potential lines in all the observations with this criterion. To sum up, our final model in XSPEC form is . The spectra and the best-fit models are shown in Fig. 7.
Besides, we adopt different models to check the results. Firstly we replace the component with (Magdziarz & Zdziarski, 1995) to take account of potential ionized reflection. As shown in Tab. 2, the results of the two models ( and ) are very close. Furthermore, we employ relxill (Dauser et al., 2010; García et al., 2014) which models the spectra with a cutoff power law and relativistic ionized reflection from the accretion disc. For SWIFT J2127.4+5654 we fix its spin referring to Marinucci et al. (2014), while for NGC 3227 is tied among the observations during fitting, with and tied among observations for both sources. In this way, we derive , and for NGC 3227, and , for SWIFT J2127.4+5654. We let photon index , reflection fraction and vary freely, and set other parameters including inclination and disk radii as default. As shown in Tab. 2, while the results from two models are generally consistent within statistical uncertainties, the relxill model yields systematically smaller for NGC 3227 and larger for SWIFT J2127.4+5654 compared with the model. Nevertheless, the yielded variation trends from two models, as the focus of this work, are similar. Moreover, we adopt comptonized models and (Dauser et al., 2010; García et al., 2014, for the normal and relativistic reflection components respectively) to directly measure the coronal temperature . The derived coronal temperatures and (see Tab. 2) for SWIFT J2127.4+5654 are generally consistent with 1/3 of the measured (e.g. Petrucci et al., 2001), but systematically smaller than 1/3 of the best-fit for NGC 3227.
From Tab. 2 we can see that and yield similarly smaller reduced compared with other models, while has one more free parameter than . As is widely adopted in literature to measure in literature (e.g. Zhang et al., 2018; Molina et al., 2019; Panagiotou & Walter, 2020), to directly compare with those studies, hereafter we simply adopt the best-fit results from . Utilizing results from the other models however would not alter the conclusions of this work. Further note that in , and , the reflection component and the Fe lines are coupled under certain assumptions, which may bias the (or ) measurements in some sources (e.g., Zhang et al., 2018; Kang et al., 2020).
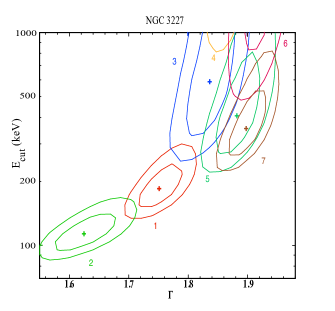
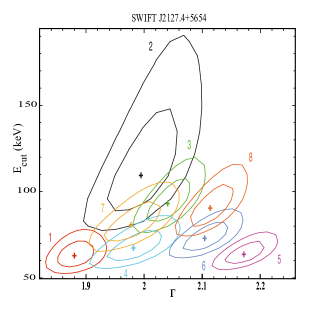
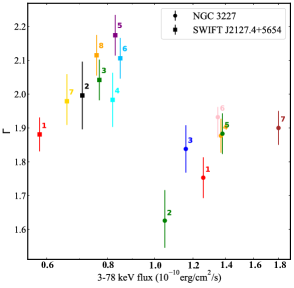
We plot the vs. contours in Fig. 4 to illustrate the variation patterns in two sources. A clear positive correlation between and is seen in NGC 3227. However the – plot of SWIFT J2127.4+5654 exhibits a distinct shape: increases with at 2.05, but reversely decreases at 2.05. Though considering the degeneracy between and , the rising part of the shape is less significant comparing with the declining part, the overall variation trend in SWIFT J2127.4+5654 clearly deviates from a monotonous function. Meanwhile, the common “softer-when-brighter” trend in Seyfert galaxies is clear in both sources (Fig. 4).
To quantifying the significance of the shape, we perform Spearman rank-order correlation analyses on the rising (obs. No. 1, 2, 3, 4, 7) and descending (obs. No. 2, 3, 5, 6, 8) branches of the shape. We find a positive correlation between and ( with a p-value = 0.054) for the rising branch, and a negative correlation for the descending branch (a with a p-value = 0.037). We also perform linear regression to measure the slopes of the two branches of the shape ( for the left and for the right). However, the Spearman’s correlation could be unreliable when the sample size is small (e.g., n < 10), and random fluctuation can produce strong correlation/anti-correlation in small samples. Meanwhile, the measurement errors and the degeneracy of the parameters should also be taken into account. We perform simulations to address these issues. Assuming there is no intrinsic variation in SWIFT J2127.4+5654, we jointly fit all eight observations and derive a of 80 keV. Starting from = 80 keV and other best-fit spectral parameters (derived with tied) for each observation, we create one artificial spectrum for each exposure using . We then perform spectral fitting to those faked spectra to measure the simulated and and perform Spearman rank and linear regression analyses. We repeat the process 1000 times, and find only 26 runs out of them show stronger Spearman’s correlation and steeper linear regression slope (compared with the observed values) for the left side of the shape, while only 2 runs out of 1000 for the right one. This indicate the rising and descending of the pattern have statistical confidence level of 97.4% and 99.8% respectively, showing statistical fluctuations of the parameters and the degeneracy between and are unlikely able to reproduce the observed pattern.
4 Discussion
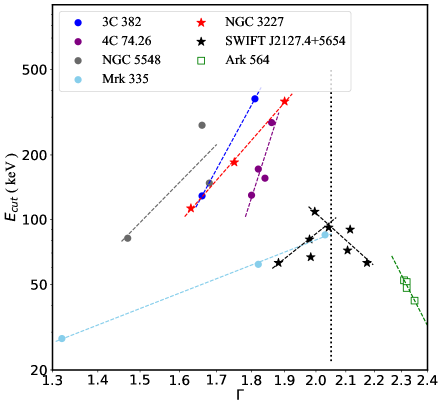
In Fig. 5 we plot – for both our sources together with those introduced in §1. For Ark 564 we convert the corona temperature given by Barua et al. (2020) into , assuming an optically thick corona and (Petrucci et al., 2001). For the other four sources we simply take measurements from Zhang et al. (2018). Though all of them follow the common “softer-when-brighter” trend (see Fig. 4 and Zhang et al., 2018; Barua et al., 2020), they show different – variation patterns. Interestingly, it appears that all seven sources could be unified with the shaped pattern seen in SWIFT J2127.4+5654, e.g., “hotter-when-softer/brighter” at 2.05, but “cooler-when-softer/brighter” at 2.05, though SWIFT J2127.4+5654 is the only source with varying across the break point, thus the only one showing the complete pattern in a single source.
The common “softer-when-brighter” trend in Seyfert galaxies was generally attributed to presumbly cooler corona during brighter phases due to more effective cooling by more seed photons. However, such scenario clearly contradicts the discovery of “hotter-when-brighter” pattern detected in AGNs (e.g. Keek & Ballantyne, 2016; Zhang et al., 2018). Geometry changes of the corona are required to reproduce the “softer-when-brighter” trend (e.g. Keek & Ballantyne, 2016; Zhang et al., 2018; Wu et al., 2020). Specifically, the corona could be heated to a higher temperature and simultaneously driven to inflate during X-ray brighter phases (Wu et al., 2020), leading to a smaller opacity and thus softer spectra, and reproducing the observed “hotter-when-softer/brighter” pattern (the rising part of the pattern). The inflation could be primarily vertical, as there are evidences that suggest the corona is vertically outflowing (e.g. Liu et al., 2014) and the corona could reach higher heights during brighter phases (Wilkins & Gallo, 2015; Alston et al., 2020). Note in case of outflowing corona, if the outflowing velocity is higher during X-ray brighter phases, higher is also expected due to stronger Doppler shift.
As the X-ray flux brightening, spectrum softening and corona inflation continue, more seed photons from the disk could be intercepted, leading to higher cooling efficiency. Moreover, the cooling efficiency could be further boosted if the steeper X-ray spectrum is accompanied by a stronger soft X-ray excess component from the presumed warm corona (e.g. Petrucci et al., 2013) which could also contribute as seed photons. The latter mechanism may be essential, that the Compton cooling effect begins to dominate beyond a certain , yielding the declining part of the pattern (“cooler-when-brighter”). However, as SWIFT J2127.4+5654 is yet the only individual source showing a pattern, it is unclear whether the break point of 2.05 is universal, and if yes, why so.
Meanwhile, pair production may also play a key role. As shown in Fabian et al. (2015), the coronae in many AGNs lie close to the electron–positron pair runaway line in the compactness–temperature diagram, suggesting the corona temperature is controlled by pair production. An inflated corona with a smaller compactness means a higher temperature limit by the run away pair-production. Moreover, Ghisellini & Haardt (1994) showed that, in a pair-dominated corona with a certain compactness, the temperature positively correlates with for electron temperature . Therefore positive correlations between X-ray flux and and between and are expected in pair-dominated corona.
It is known that the NLS1 Ark 564 lies well below the thermal pair-production limit (Kara et al., 2017), meanwhile 3C 382, 4C 74.26, NGC 5548 and Mrk 335 lie close to the limit (e.g. Zhang et al., 2018). Following Fabian et al. (2015) we calculate the compactness, , and dimensionless temperature, , for the two sources reported in this work, where 444 We adopt to stay consistent with Fabian et al. (2015) and Zhang et al. (2018). Directly adopting the or we derived, or assuming will not alter the main results presented here.. We adopt and the 0.1–200 keV luminosity, for NGC 3227 (Graham, 2008), and for SWIFT J2127.4+5654 (Malizia et al., 2008). Comparing the results with the runaway pair production boundary in Stern et al. (1995), we find while NGC 3227 lies close to or on the boundary, the NLS1 SWIFT J2127.4+5654 also lie clearly below the boundary (though closer to the boundary compared with Ark 564, Fig. 6).
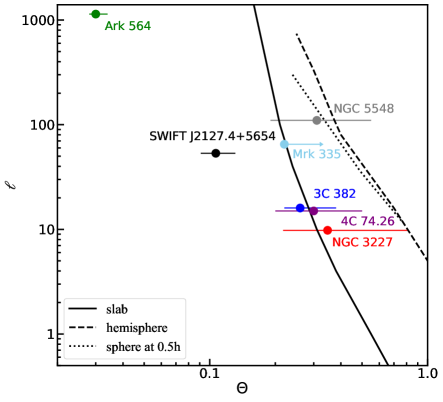
It is remarkable to note that there also likely exists a link between variation patterns and pair-dominance: pair-dominated coronae (those lying close to or on the pair limit in the – diagram) only exhibit “hotter-when-softer/brighter” trend, while a “cooler-when-softer/brighter” or shape is only possible in coronae which are not pair-dominated. In this case the pair production could counter against the higher cooling efficiency of an expanded and less compact corona in many AGNs. Consequently the “cooler-when-softer/brighter” trend or the pattern only exists in sources lacking strong pair production, like the NLS1 SWIFT J2127.4+5654 and Ark 564. We note that Fabian et al. (2017) proposed that the coronae lying well below the pair limit (such as in Ark 564) could also be pair dominated if containing both thermal and non-thermal particles. However, if the possible link aforementioned does exist, it suggests the pair production in the cool coronae of Ark 564 and SWIFT J2127.4+5654 is indeed weak.
Though the sample discussed above is small, the discoveries presented in this work shed new light on the coronal physics in AGNs. Future observations of variations in a larger sample of AGNs are desired to testify the universality of the pattern, confirm the potential link between variation pattern and pair production, and independently probe the coronal physics.
Acknowledgements
This research has made use of the NuSTAR Data Analysis Software (NuSTARDAS) jointly developed by the ASI Science Data Center (ASDC, Italy) and the California Institute of Technology (USA). The work is supported by National Natural Science Foundation of China (grants No. 11421303, 11890693 12033006) and CAS Frontier Science Key Research Program (QYZDJ-SSW-SLH006).
Data Availability
The data underlying this article are available in the article and in its online supplementary material.
References
- Alston et al. (2020) Alston W. N., et al., 2020, Nature Astronomy, p. 2
- Anders & Grevesse (1989) Anders E., Grevesse N., 1989, Geochimica et Cosmochimica Acta, 53, 197
- Arnaud (1996) Arnaud K. A., 1996, in Jacoby G. H., Barnes J., eds, Astronomical Society of the Pacific Conference Series Vol. 101, Astronomical Data Analysis Software and Systems V. p. 17
- Ballantyne et al. (2014) Ballantyne D. R., et al., 2014, The Astrophysical Journal, 794, 62
- Barua et al. (2020) Barua S., Jithesh V., Misra R., Dewangan G. C., Sarma R., Pathak A., 2020, MNRAS, 492, 3041
- Cappi et al. (2016) Cappi M., et al., 2016, A&A, 592, A27
- Dauser et al. (2010) Dauser T., Wilms J., Reynolds C. S., Brenneman L. W., 2010, MNRAS, 409, 1534
- Fabian et al. (2015) Fabian A. C., Lohfink A., Kara E., Parker M. L., Vasudevan R., Reynolds C. S., 2015, MNRAS, 451, 4375
- Fabian et al. (2017) Fabian A. C., Lohfink A., Belmont R., Malzac J., Coppi P., 2017, MNRAS, 467, 2566
- García et al. (2014) García J., et al., 2014, ApJ, 782, 76
- Ghisellini & Haardt (1994) Ghisellini G., Haardt F., 1994, ApJ, 429, L53
- Graham (2008) Graham A. W., 2008, Publ. Astron. Soc. Australia, 25, 167
- Haardt & Maraschi (1991) Haardt F., Maraschi L., 1991, ApJ, 380, L51
- Haardt et al. (1994) Haardt F., Maraschi L., Ghisellini G., 1994, ApJ, 432, L95
- Harrison et al. (2013) Harrison F. A., et al., 2013, The Astrophysical Journal, 770, 103
- Kang et al. (2020) Kang J., Wang J., Kang W., 2020, The Astrophysical Journal, 901, 111
- Kara et al. (2017) Kara E., García J. A., Lohfink A., Fabian A. C., Reynolds C. S., Tombesi F., Wilkins D. R., 2017, MNRAS, 468, 3489
- Keek & Ballantyne (2016) Keek L., Ballantyne D. R., 2016, MNRAS, 456, 2722
- Liu et al. (2014) Liu T., Wang J.-X., Yang H., Zhu F.-F., Zhou Y.-Y., 2014, ApJ, 783, 106
- Madsen et al. (2015) Madsen K. K., et al., 2015, ApJS, 220, 8
- Madsen et al. (2020) Madsen K. K., Grefenstette B. W., Pike S., Miyasaka H., Brightman M., Forster K., Harrison F. A., 2020, arXiv e-prints, p. arXiv:2005.00569
- Magdziarz & Zdziarski (1995) Magdziarz P., Zdziarski A. A., 1995, MNRAS, 273, 837
- Malizia et al. (2008) Malizia A., et al., 2008, MNRAS, 389, 1360
- Marinucci et al. (2014) Marinucci A., et al., 2014, MNRAS, 440, 2347
- Markowitz et al. (2003) Markowitz A., Edelson R., Vaughan S., 2003, ApJ, 598, 935
- Markowitz et al. (2009) Markowitz A., Reeves J. N., George I. M., Braito V., Smith R., Vaughan S., Arévalo P., Tombesi F., 2009, ApJ, 691, 922
- Matt et al. (2015) Matt G., et al., 2015, MNRAS, 447, 3029
- Middei et al. (2019a) Middei R., et al., 2019a, MNRAS, 483, 4695
- Middei et al. (2019b) Middei R., et al., 2019b, MNRAS, 483, 4695
- Molina et al. (2013) Molina M., Bassani L., Malizia A., Stephen J. B., Bird A. J., Bazzano A., Ubertini P., 2013, MNRAS, 433, 1687
- Molina et al. (2019) Molina M., Malizia A., Bassani L., Ursini F., Bazzano A., Ubertini P., 2019, Monthly Notices of the Royal Astronomical Society, 484, 2735
- Panagiotou & Walter (2020) Panagiotou C., Walter R., 2020, A&A, 640, A31
- Petrucci et al. (2001) Petrucci P. O., et al., 2001, ApJ, 556, 716
- Petrucci et al. (2013) Petrucci P. O., et al., 2013, A&A, 549, A73
- Ponti et al. (2018) Ponti G., et al., 2018, MNRAS, 473, 2304
- Sanfrutos et al. (2013) Sanfrutos M., Miniutti G., Agís-González B., Fabian A. C., Miller J. M., Panessa F., Zoghbi A., 2013, MNRAS, 436, 1588
- Sarma et al. (2015) Sarma R., Tripathi S., Misra R., Dewangan G., Pathak A., Sarma J. K., 2015, MNRAS, 448, 1541
- Shu et al. (2010) Shu X. W., Yaqoob T., Wang J. X., 2010, The Astrophysical Journal Supplement Series, 187, 581
- Sobolewska & Papadakis (2009) Sobolewska M. A., Papadakis I. E., 2009, MNRAS, 399, 1597
- Stern et al. (1995) Stern B. E., Poutanen J., Svensson R., Sikora M., Begelman M. C., 1995, ApJ, 449, L13
- Tortosa et al. (2018) Tortosa A., Bianchi S., Marinucci A., Matt G., Petrucci P. O., 2018, A&A, 614, A37
- Turner et al. (2018) Turner T. J., Reeves J. N., Braito V., Lobban A., Kraemer S., Miller L., 2018, MNRAS, 481, 2470
- Ursini et al. (2015) Ursini F., et al., 2015, A&A, 577, A38
- Ursini et al. (2016) Ursini F., et al., 2016, MNRAS, 463, 382
- Véron-Cetty & Véron (2006) Véron-Cetty M. P., Véron P., 2006, A&A, 455, 773
- Wik et al. (2014) Wik D. R., et al., 2014, The Astrophysical Journal, 792, 48
- Wilkins & Gallo (2015) Wilkins D. R., Gallo L. C., 2015, MNRAS, 449, 129
- Wu et al. (2020) Wu Y.-J., Wang J.-X., Cai Z.-Y., Kang J.-L., Liu T., Cai Z., 2020, arXiv e-prints, p. arXiv:2008.03284
- Zdziarski et al. (2000) Zdziarski A. A., Poutanen J., Johnson W. N., 2000, ApJ, 542, 703
- Zhang et al. (2018) Zhang J.-X., Wang J.-X., Zhu F.-F., 2018, ApJ, 863, 71
- Zoghbi et al. (2017) Zoghbi A., et al., 2017, ApJ, 836, 2
Appendix A NuSTAR spectra