Extremal fluctuations driving the relaxation in glassy energy landscapes
Abstract
Cooperative events requiring anomalously large fluctuations, are a defining characteristic for the onset of glassy relaxation across many materials. The importance of such intermittent events has been noted in systems as diverse as superconductors, metallic glasses, gels, colloids, and granular piles. Here, we show that prohibiting the attainment of new record-high energy fluctuations – by explicitly imposing a “lid” on the fluctuation spectrum – impedes further relaxation in the glassy phase. This lid allows us to directly measure the impact of record events on the evolving system in extensive simulations of aging in such vastly distinct glass formers as spin glasses and tapped granular piles. Interpreting our results in terms of a dynamics of records succeeds in explaining the ubiquity of both, the logarithmic decay of the energy and the memory effects encoded in the scaling of two-time correlation functions of aging systems.
I Introduction
One of the simplest protocols to study the dynamics of non-equilibrium systems consists of a hard quench applied when taking them instantly from very high to a low temperature. Of course, in most ordinary materials (like a cup of coffee) heat is rapidly expelled from the system so that the internal energy falls exponentially fast to the equilibrium value that comports with its low temperature. However, when the quench traverses a phase transition, the relaxation process becomes more complicated. In particular, if a transition into a glassy phase is passed [1], many out-of-equilibrium phenomena are observed, often for a large range of time-scales [2]. In fact, the trajectory of the cooling system through configuration space for various temperature protocols might serve as a “microscope” into the complexities of the multimodal free-energy landscape of the glassy material [3]. The processes by which glassy systems scale barriers to evolve in their landscape has been, and still remains a very active field of research [4, 5, 6].
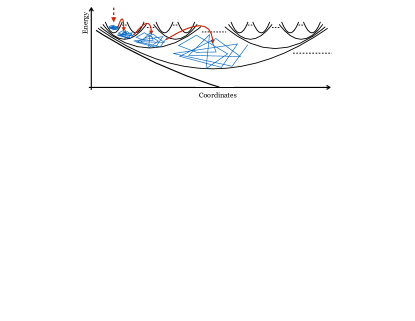
Remarkably, at least for the basic protocol of a hard quench, a large class of glassy systems as diverse as spin glasses [9], superconductors [10], gels [11], colloids [12, 13, 14], and granular piles [15] exhibit a ubiquitous behavior, irrespective of microscopic details. Macroscopic observables evolve very slowly, essentially logarithmically, and data for two-time correlation functions scales with the ratio of both times (“full aging”). Furthermore, it is found that the aging dynamics is activated via intermittent, irreversible events [16, 17, 18, 12, 13]. These observations can be unified via generic features, illustrated in Fig. 1, that are common to glassy energy landscapes [19, 14, 20] and has lead to models of relaxation on tree-structures [7, 21], which capture key features of real aging systems. In spin glasses these features emerge because (1) a quench leaves them with many small domains at high energy and (2) enlarging a domain requires overcoming barriers proportional to the size of that domain [22, 23].
In such a landscape, not only do its equilibrated domains grow exceedingly slowly, in want of large fluctuations [24], but the glassy system also must achieve ever new records in its fluctuation spectrum [25] to maintain its relaxation. That records drive the dynamics (i.e., “set the clock”) in a large class of complex systems, of which glassy materials are a subset, is referred to as Record Dynamics (RD) [26]. In the latter, quakes, the non-equilibrium events triggering the changes from a metastable state to the next are identified and shown to form a log-Poisson process [27, 28]. This means that the coarse-grained decelerating dynamics of the system at hand is log-time homogeneous and opens a way for a number of theoretical predictions. The rate of quakes and their log-Poisson statistics have been observed directly in various glasses [14, 29, 28, 30, 15]. That records of the free energy, or some other fluctuating configuration space function, actually trigger quakes is supported in RD by analogies and by indirect evidence. The basic analogy is that records in white noise, standing in for equilibrium fluctuations, are a log-Poisson process, independently of the distribution from which the noise is drawn. The indirect evidence is that a relaxation on tree models of configuration space share key properties of aging systems [7, 21].
Here, we show how record events strongly influence the course of glassy relaxation by letting a Maxwell demon intervene into the microscopic dynamics. The demon explicitly imposes a “lid” on upward energy fluctuations. This eliminates the emergence of new high energy records and, at the same time, limits the system’s ability to overcome energy barriers. Specifically, we compare the behavior with and without a lid in extensive simulations of both, an Ising spin glass in contact with a heat bath and a 3d pile of grains, tapped upwards against gravity to activate grains that dissipate through friction and inelastic collisions. In the spin glass case, our lid device is shown to have very different consequence above and below the critical temperature. Energy relaxation toward lower equilibrium values is accelerated above, but decelerated below . In the granular pile, the lid nearly stops the logarithmic decay of the potential energy..
II Quench Protocols, with or without a Lid
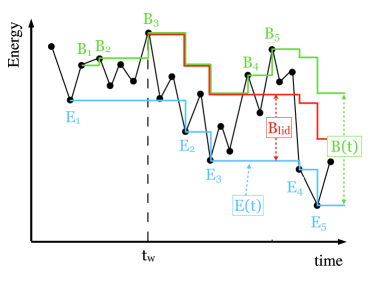
In our aging simulations of the spin glass or the granular pile, we start in each case either with randomly assigned spins or with a randomly poured pile at , respectively. The ensuing relaxation process then corresponds to an aging protocol for a hard (instantaneous) quench at , in temperature from to some finite for the Ising magnets, or in tapping strength from infinitely hard to mild tapping. The ensuing energy trace is illustrated in Fig. 2, while examples of actual traces from our experiments are shown below in Fig. 3 for EA or in Fig. 5 for the granular pile.
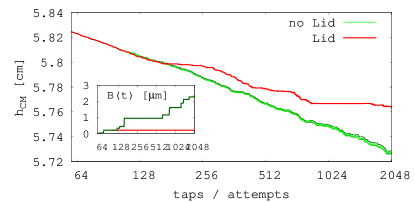
As those traces of show, the energy density decreases on average while exhibiting a characteristic range of fluctuations. This (logarithmic) decline in average energy suggests that we need to assess the effect of fluctuations with respect to an equally descending energy-scale. Note that this decline renders as tenuous the notion of aging as a return process (to some fixed, global energy level), as is inherent to the trap model description of aging [31, 32]. Instead, it is essential to assess records in these fluctuations [33, 30, 20], relative to the up-to-now lowest energy value encountered at time , and the “barrier” , i.e., the up-to-now highest energy attained relative to the most recent E. An energy trace then maps into a random sequence of symbols and , as illustrated in Fig. 2. In the traces shown in Figs. 3 or 5, the values of and of are plotted as envelopes below and above, respectively, to the fluctuating signal . For the Ising magnets, the unobstructed fluctuations are shown in green, while those shown in red have been curbed by a “lid”. Although the fluctuations for the granular pile seem minute, they distribution is well-resolved [34].
The manner in which the Maxwell demon imposes a lid on the fluctuations [35] is also illustrated in Fig. 2: As represents the span of regular (unhindered) fluctuations, beginning at some predetermined “waiting time” after the quench, the “lid” rejects any update towards exceeding for all . For example, we chose for the Ising magnets and for the granular pile. Then, for all Monte Carlo updates of individual spins in the Ising magnets, or entire taps for the granular pile, are rejected if they would increase at any time to an energy of . Thus, for such a lid no new barrier records can ever be achieved! This is again illustrated in Fig. 2, where the red envelope remains stuck at in this illustration) while the green envelope – without a lid – achieves new barrier records . The question addressed here is: Would the imposition of the lid impede, or enhance, finding better minima, like and in this illustration?
III Spin Glass Fluctuations
The well-known Ising spin glass model on a 3d lattice due to Edwards and Anderson (EA) [36] has become the very definition of complexity and disorder, not only in physics but also in computer science, engineering, and biology [37, 38]. We employ EA on hyper-cubic lattices of size with periodic boundary conditions using the Hamiltonian
| (1) |
Bonds between neighboring spins are drawn with equal probability to be and 1000 such instances were generated randomly. As a reference, we have also studied purely ferromagnetic systems (FM) with only positive bonds, , throughout. In each run, we have updated the system by the Metropolis method [39] at a fixed temperature , both for a higher () and for a lower temperature (), using system sweeps and tracked the instantaneous energy density of the entire system, .
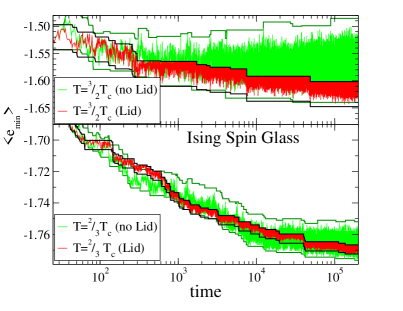
We illustrate the typical behavior of in Fig. 3 with a single trace of the energy fluctuations for times after the quench on a logarithmic time scale. The wider fluctuations (green) represent the regular relaxation process, while narrower fluctuations (red) result from the imposition of a lid for . As defined in Fig. 2, the range of each signal is characterized by staircasing envelope-functions, for below, and above by for the regular fluctuations or for the fluctuations curbed by a lid. For , the regular signal soon relaxes to some stationary value of around which it fluctuates. In those cases, the evolution with the imposed lid consistently skirts the lower edge of the regular fluctuations. In turn, traces in the glassy regime ( ) continue to decrease on average while exhibiting a significantly narrower range of fluctuations. Accordingly, the lid also attains a smaller value. Here, the corresponding fluctuations struggle to achieve the same set of minima, , as the regular fluctuations.
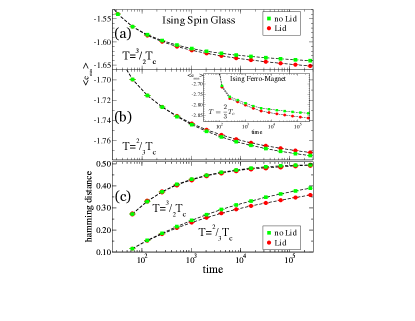
The impression conveyed by those illustrative traces are borne out by a systematic study, shown in Fig. 4. Here, we are not looking at the average of the fluctuations but measuring the energy minima that the system can access with or without a lid on the range of energy barriers it is allowed to cross. While the thermal average provides little information about the local structure of the energy landscape, it is these minima that signify reaching new basins of local stability. Definitely for the high-temperature quench to , but also for the quench into the ferromagnetically order phase at (see inset), the imposition of a lid actually results in achieving better energy minima than without. In contrast, for the glassy case in Fig. 4(b), the lid limits the quality of energy minima that can be explored. These results are robust and only vary gradually by varying , or when using Gaussian distributed bonds instead of . The interpretation of these findings is as follows: At high , or even for ferromagnetic order, achieving new records in the barriers that are overcome by fluctuations is immaterial for access to new energy minima; average-size fluctuations suffice to traverse any part of the configuration space at the respective temperature. In fact, the lid forces the Monte Carlo process to spent more time at lower energy and, hence, increases the probability of finding new minima. In contrast, in the glassy case, prohibiting barrier crossings via a lid curbs the exploration of new meta-stable basins for their minima and more likely traps the system in the local basin. Hence, traversing those barriers between basins via record fluctuations, as stipulated for RD, proves essential for the glassy system to relax.
IV Fluctuations in Granular Piles
The wide scope of what we found for spin glasses is demonstrated in Figs. 5-6, where we study aging in a tapped granular pile using molecular dynamics simulations (MD). To that end, we employ the implementation recently presented in Refs. 15, 34. It is inspired by the experimental setup used for the Chicago experiment [40]. Our three-dimensional pile consists of bidisperse spheres, in equal proportion of 1 or 1.02mm in diameter, contained in a vertical cylinder of 2.4cm diameter. The initial column height, obtained through simple pouring, is about 11.5cm. The (minute) bidispersity was introduced in order to prevent crystallization and the particle diameter ratio was chosen to avoid segregation. We use MD as implemented in the soft spheres model provided by the LIGGGHTS open source software [41], i.e., LAMMPS improved for general granular and granular heat transfer simulations. Within LIGGGHTS, we apply a Hertz model [42] for the particle–particle and particle–wall contact forces (with a Young’s modulus of , a Poisson ration of 0.3, a restitution coefficient of 0.5, and a friction coefficient of ). Particle densities equal .
Tapping simulations conducted entirely with MD evolve deterministically. For the Maxwell demon to be able to reject a tap, we need each tap to contain a systemic random process that would lead to alternative (randomized) outcomes for a renewed tap of any given static configuration. In order to introduce stochasticity here, instead of deterministically pushing the container floor and walls upward, we initiate each tap via a perturbation that consists of a homogeneous vertical dilatation. It is obtained by multiplying the -coordinate of each particle in the system by a random amount that is uniformly distributed in the range . This perturbation is followed by a MD deposition under the action of gravity, until all kinetic energy is dissipated. Only the mechanically static configurations at the end of each tap process are considered in our measurements of the total gravitational potential energy of the system. The system will be considered mechanically static when the kinetic energy of the pile falls below . This cutoff value was deemed sufficient after examination of the system dynamics and its kinetic energy evolution. The use of this homogeneous vertical expansion to mimic the effect of a tap has been proposed before for a simpler granular model with ballistic deposition [43], which has proven to show good agreement in reproducing the dynamics of the compaction as a function of the perturbation intensity [43, 44] and the signature effects of aging behavior.
We evolve ten instances of the pile after a quench at for attempted taps, which is our unit of time in this process. We measure the density of the pile in terms of the average local volume fraction occupied by the particles, which is obtaining from their Voronoi volume (using Voro++ [45]) for all particles that are two particle diameters off the container walls and its surface. The internal energy here is presented in terms of the center-of-mass height of the pile, , where the total potential energy is , with constants for gravity and the mass of the pile, .
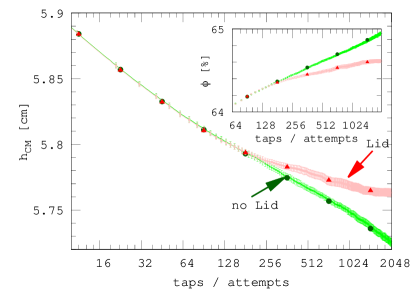
In Fig. 5, we show a trace of the internal (gravitational) energy for a single instance, without and with a lid imposed after taps, similar to Fig. 3. Fig. 6 shows the average of that energy over all ten instances, decreasing logarithmically without a lid but stalling when the lid is imposed, similar to Fig. 4. In the inset of Fig. 6, we demonstrate that a sequence of those taps following a quench reproduces the logarithmic density increase (shown as volume fraction , in green) that is expected from experiments [40] and that is consistent with a glass [46, 15, 34]. Although there was no lid on the density fluctuation itself, the lid on the energy fluctuations nonetheless stalls the relaxation in density, also shown in that inset (red).
V Discussion
We note that our global energy record are merely a stand-in for irreversible events that occur locally. In many contexts these are harder to identify and control microscopically but certainly involve an additional entropic element 111These events are analyzed in Ref. 30 for spin glasses, and in Ref. 15 for the granular pile.. For this reason,, the lid we define likely does not completely trap the glassy system within a basin of attraction. The record barrier that the system overcomes in any particular relaxation process is not necessarily in the absolute lowest-energy path available to leave the basin. The latter is just a more probable one to follow. In other words, a purely energetic lid entirely ignores the entropic component of the free-energy barrier that the system eventually finds after the lid confines it long enough within a given basin. Thus, the system ultimately escapes anyway and finds better energy minima, albeit much later.
We can directly assess the entropic aspects of the different relaxation processes in the Ising magnets by also considering the Hamming distances between the spin configurations at any later minima relative to the latest minimum encountered just before , . The Hamming distance here counts the number of Ising spins between these configurations that are no longer in the same orientation, divided by the total number of spins, . Thus, identical configurations have zero distance while each differing spin adds . A distance of for two configurations makes them maximally uncorrelated, as those would share half of their spins purely at random. As the bottom panel of Fig. 4 shows, at high temperature , the relaxation process completely decorrelates, independent of the lid. Even at low temperature for a ferromagnet, the Hamming distance is indistinguishable between having a lid or not (not shown). However, we observe quite a different behavior for the glassy case: Although the difference in the value of the minima explored with or without lid might seem small, it certainly signals a profound constraint on the part of configuration space that a glassy system is allowed to explore when a lid is imposed! At the latest time simulated here, the Hamming distance for new minima explored by the process with a lid lags behind that of the regular exploration by about . That is, the range of exploration within the configuration space is smaller by spins when record barrier crossings are curbed with the lid, corresponding to a reduced volume of some configurations that remain out of range. Of course, only few of those get visited even without the lid, and even fewer are novel minima, yet, those numbers indicate the enormous consequences extremal fluctuations, or the lack thereof, entail in glassy relaxation.
VI Conclusion
We have demonstrated that, in glassy dynamics, extremal upward energy fluctuations are essential for how extremal low energy states are reached while the system descends through its complex, multimodal energy landscape toward equilibrium. While fluctuations in non-glassy systems also exhibit large excursions, these remain inconsequential, since typical fluctuations are sufficient for relaxation. Thus, any physical description of glassy relaxation will have to account for those rare, irreversible and record-sized events that drive the observed intermittent behavior [16, 17, 18, 11, 12, 13] and manifest themselves across many materials [9, 10, 11, 12, 13, 14, 15], irrespective of any microscopic details, as especially the example of the (a-thermal) granular pile clearly demonstrates. These insights not only pertain to aging behavior in physical systems [48], but likely also affect the behavior of local search heuristics in the optimization of hard combinatorial problems [49, 50] and many other applications of glassy dynamics [38].
Acknowledgements.
Simulations of the granular pile were performed at the Imperial College Research Computing Service (see DOI: 10.14469/hpc/2232).References
- Struik [1978] L. Struik, Physical aging in amorphous polymers and other materials (Elsevier Science Ltd, New York, 1978).
- Berthier et al. [2011] L. Berthier, G. Biroli, J.-P. Bouchaud, L. Cipelletti, and W. van Saarloos, eds., Dynamical Heterogeneities in Glasses, Colloids, and Granular Media (Oxford University Press, 2011).
- Bouchaud et al. [2001] J.-P. Bouchaud, V. Dupuis, J. Hammann, and E. Vincent, Phys. Rev. B 65, 024439 (2001).
- Amir et al. [2012] A. Amir, Y. Oreg, and Y. Imry, Proceedings of the National Academy of Sciences 109, 1850 (2012).
- Lubchenko and Wolynes [2017] V. Lubchenko and P. G. Wolynes, The Journal of Physical Chemistry B 122, 3280 (2017).
- Ros et al. [2021] V. Ros, G. Biroli, and C. Cammarota, SciPost Physics 10, 002 (2021).
- Sibani and Hoffmann [1989] P. Sibani and K. H. Hoffmann, Physical Review Letters 63, 2853 (1989).
- Charbonneau et al. [2013] P. Charbonneau, J. Kurchan, G. Parisi, P. Urbani, and F. Zamponi, Nature Communications 5, 3725 (2013).
- Rodriguez et al. [2003] G. F. Rodriguez, G. G. Kenning, and R. Orbach, Phys. Rev. Lett. 91, 037203 (2003).
- Oliveira et al. [2005] L. P. Oliveira, H. J. Jensen, M. Nicodemi, and P. Sibani, Phys. Rev. B 71, 104526 (2005).
- Parker and Normand [2010] A. Parker and V. Normand, Soft Matter 6, 4916 (2010).
- Yunker et al. [2009] P. Yunker, Z. Zhang, K. B. Aptowicz, and A. G. Yodh, Phys. Rev. Lett. 103, 115701 (2009).
- Kajiya et al. [2013] T. Kajiya, T. Narita, V. Schmitt, F. Lequeuxa, and L. Talini, Soft Matter 9, 11129 (2013).
- Robe et al. [2016] D. M. Robe, S. Boettcher, P. Sibani, and P. Yunker, EPL (Europhysics Letters) 116, 38003 (2016).
- Gago and Boettcher [2020] P. A. Gago and S. Boettcher, Proceedings of the National Academy of Sciences 117, 33072 (2020).
- Bissig et al. [2003] H. Bissig, S. Romer, L. Cipelletti, V. Trappe, and P. Schurtenberger, Phys. Chem. Comm. 6, 21 (2003).
- Buisson et al. [2003] L. Buisson, L. Bellon, and S. Ciliberto, J. Phys. Cond. Mat. 15, S1163 (2003).
- P. Sibani, G.F. Rodriguez and G.G. Kenning [2006] P. Sibani, G.F. Rodriguez and G.G. Kenning, Phys. Rev. B 74, 224407 (2006).
- Heuer [2008] A. Heuer, J. Phys.: Condens. Matter 20, 373101 (2008).
- Boettcher and Rahman [2021] S. Boettcher and M. Rahman, Physical Review B 103, 024201 (2021).
- Fischer et al. [2008] A. Fischer, K. H. Hoffmann, and P. Sibani, Phys. Rev. E 77, 041120 (2008).
- Fisher and Huse [1988a] D. S. Fisher and D. A. Huse, Phys. Rev. B 38, 386 (1988a).
- Shore et al. [1992] J. D. Shore, M. Holzer, and J. P. Sethna, Physical Review B 46, 11376 (1992).
- Fisher and Huse [1988b] D. S. Fisher and D. A. Huse, Phys. Rev. B 38, 373 (1988b).
- Sibani and Littlewood [1993] P. Sibani and P. B. Littlewood, Physical Review Letters 71, 1482 (1993).
- Sibani et al. [2021] P. Sibani, S. Boettcher, and H. J. Jensen, The European Physical Journal B 94, 37 (2021).
- Sibani and Jensen [2013] P. Sibani and H. J. Jensen, Stochastic Dynamics of Complex Systems (Imperial College Press, 2013).
- Boettcher et al. [2018] S. Boettcher, D. M. Robe, and P. Sibani, Physical Review E 98, 020602 (2018).
- Robe and Boettcher [2018] D. Robe and S. Boettcher, Soft Matter 14, 9451 (2018).
- Sibani and Boettcher [2018] P. Sibani and S. Boettcher, Physical Review B 98, 054202 (2018).
- Bouchaud [1992] J. Bouchaud, J. Phys. I France 2, 1705 (1992).
- Baity-Jesi et al. [2018] M. Baity-Jesi, G. Biroli, and C. Cammarota, Journal of Statistical Mechanics: Theory and Experiment 013301 (2018).
- Dall and Sibani [2003] J. Dall and P. Sibani, Eur. Phys. J. B 36, 233 (2003).
- Gago and Boettcher [7764] P. A. Gago and S. Boettcher, arXiv:2107.07764.
- Sibani et al. [1999] P. Sibani, R. van der Pas, and J. C. Schön, Computer Physics Communications 116, 17 (1999).
- Edwards and Anderson [1975] S. F. Edwards and P. W. Anderson, J. Phys. F 5, 965 (1975).
- Mézard et al. [1987] M. Mézard, G. Parisi, and M. A. Virasoro, Spin glass theory and beyond (World Scientific, Singapore, 1987).
- Stein and Newman [2013] D. L. Stein and C. M. Newman, Spin Glasses and Complexity (Princeton University Press, Princeton, 2013).
- Metropolis et al. [1953] N. Metropolis, A. W. Rosenbluth, M. N. Rosenbluth, A. H. Teller, and E. Teller, J. Chem. Phys. 21, 1087 (1953).
- Nowak et al. [1998] E. R. Nowak, J. B. Knight, E. Ben-Naim, H. M. Jaeger, and S. R. Nagel, Phys. Rev. E 57, 1971 (1998).
- Goniva et al. [2012] C. Goniva, C. Kloss, N. G. Deen, J. A. Kuipers, and S. Pirker, Particuology 10, 582 (2012).
- Brilliantov et al. [1996] N. V. Brilliantov, F. Spahn, J.-M. Hertzsch, and T. Pöschel, Physical review E 53, 5382 (1996).
- Philippe and Bideau [2001] P. Philippe and D. Bideau, Physical Review E 63, 051304 (2001).
- Pugnaloni et al. [2008] L. A. Pugnaloni, M. Mizrahi, C. M. Carlevaro, and F. Vericat, Physical Review E 78, 051305 (2008).
- Rycroft [2009] C. H. Rycroft, Chaos: An Interdisciplinary Journal of Nonlinear Science 19, 041111 (2009).
- Richard et al. [2005] P. Richard, M. Nicodemi, R. Delannay, P. Ribière, and D. Bideau, Nature Materials 4, 121 (2005).
- Note [1] These events are analyzed in Ref. 30 for spin glasses, and in Ref. 15 for the granular pile.
- Roth [2016] C. Roth, Polymer Glasses (CRC Press, 2016).
- Boettcher and Percus [2001] S. Boettcher and A. G. Percus, Physical Review Letters 86, 5211 (2001).
- Boettcher and Sibani [2005] S. Boettcher and P. Sibani, The European Physical Journal B 44, 317 (2005).