Regulating star formation in nearby dusty galaxies: Low photoelectric efficiencies in the most compact systems
Abstract
Star formation in galaxies is regulated by the heating and cooling in the interstellar medium. In particular, the processing of molecular gas into stars will depend strongly on the ratio of gas heating to gas cooling in the neutral gas around sites of recent star-formation. In this work, we combine mid-infrared (mid-IR) observations of Polycyclic Aromatic Hydrocarbons (PAHs), the dominant heating mechanism of gas in the interstellar medium (ISM), with [C II], [O I], and [Si II] fine-structure emission, the strongest cooling channels in dense, neutral gas. The ratio of IR cooling line emission to PAH emission measures the photoelectric efficiency, a property of the ISM which dictates how much energy carried by ultraviolet photons gets transferred into the gas. We find that star-forming, IR luminous galaxies in the Great Observatories All-Sky LIRG Survey (GOALS) with high IR surface densities have low photoelectric efficiencies. These systems also have, on average, higher ratios of radiation field strength to gas densities, and larger average dust grain size distributions. The data support a scenario in which the most compact galaxies have more young star-forming regions per unit area, which exhibit less efficient gas heating. These conditions may be more common at high, and may help explain the higher star-formation rates at cosmic noon. We make predictions on how this can be investigated with JWST.
revtex4-1Repair the float
1 Introduction
Star-formation in a galaxy is dependent on processes which remove energy allowing gas to cool. Only the coldest phases will collapse under self-gravity to form stars, and so characterizing the mechanisms by which gas heats and cools is critical to our understanding of star-formation, and galaxy evolution. The cold gas associated with star-formation emits strongly in low energy atomic and molecular transitions, bright at infrared (IR) wavelengths.
Studies with the Infrared Space Observatory (ISO) were key in unveiling the wavelength regime of the electro-magnetic spectrum of galaxies, which is rich in strong atomic and molecular emission lines that trace the ISM (Malhotra et al., 1997, 2001; Dale et al., 2000). Amongst the brightest of these features are [O I] , and [C II] which can contain of total infrared luminosities (Malhotra et al., 2001; Stacey et al., 2010; Díaz-Santos et al., 2013; Brisbin et al., 2015; Ibar et al., 2015). The Herschel Space Telescope was used to significantly increase the number of galaxies detected in the far-IR lines (e.g., Sturm et al. 2000; van der Wel et al. 2014; Díaz-Santos et al. 2011), and studies with the Spitzer Space Telescope added other prominent cooling lines such as [Si II] , as well as Polycyclic Aromatic Hydrocarbon (PAH) vibrational lines between m that trace photoelectric heating.
[C II], [O I], and [Si II] are well-established as strong coolants in Milky Way photodissociation regions (PDRs), the transition zones between H II regions and the cold-neutral-medium (e.g., Wolfire et al. 1990, 2003). As the boundary layer between warm and cold gas, PDRs are an excellent place to study the processes of heating and cooling, as the relative balance of energy gains and losses can impact future star-formation. Emission from small grains, PAHs, provide an excellent tracer of the photoelectric heating of gas in PDRs (Galliano et al., 2008; Tielens, 2008). Photoelectrons ejected from PAH grains share energy with H and H2, which go on to collisionally excite fine-structure transitions of C+, O, and Si+. Although [C II] and [O I] emission are the dominant cooling channels in more normal PDRs (e.g., Tielens & Hollenbach 1985; Kaufman et al. 1999), [Si II] can also act as a significant coolant at high interstellar radiation field densities (Kaufman et al., 2006). Thus, the cycle of gas heating and cooling in PDRs is traced by [C II], [O I], [Si II], and PAH emission, which collectively make for a powerful diagnostic of the ISM in extragalactic sources (e.g., Malhotra et al. 2001; Helou et al. 2001; Croxall et al. 2012; Beirão et al. 2012; Sutter et al. 2019.
The deficit of [C II] emission per unit LIR in warmer (higher dust temperatures; Tdust), and more compact Luminous IR Galaxies (LIRGs: , ULIRGs: ) as compared to less extreme galaxies is a well-studied phenomenon (e.g., Malhotra et al. 1997, 2001; Luhman et al. 1998, 2003; Stacey et al. 2010; Herrera-Camus et al. 2015; Díaz-Santos et al. 2013, 2014, 2017; Ibar et al. 2015; Smith et al. 2017). Moreover, PAH emission and other far-IR fine-structure lines key to PDR heating and cooling show similar deficits (e.g., Brauher et al. 2008; Wu et al. 2010; Graciá-Carpio et al. 2011; Pope et al. 2013; Stierwalt et al. 2014; De Looze et al. 2014; Cormier et al. 2015; Díaz-Santos et al. 2017). The IR emission line deficits can be due to changes in ISM densities and the strength of the radiation field impinging upon PDR surfaces (e.g., Díaz-Santos et al. 2017), and/or opacity effects, thermal line saturation, and evolution in dust grain properties (Luhman et al., 1998; Malhotra et al., 2001; Helou et al., 2001; Muñoz & Oh, 2016; Smith et al., 2017); however, the deficits largely disappear in normal star-forming galaxies when the line emission is normalized by total PAH emission (Helou et al., 2001; Croxall et al., 2012; Sutter et al., 2019). This reinforces the link between the ejection of photoelectrons from PAH grains and the collisional excitation of [C II] and other fine-structure lines, and suggests that the heating and cooling processes within PDRs behave similarly for normal star-forming conditions over a range of Tdust and LIR. Interestingly, McKinney et al. (2020) found lower [C II]/PAH emission at than , suggesting evolution in the heating and cooling balance with redshift. However, the cooling/heating ratio has yet to be fully characterized in starbursts, which represents a key step for future studies of the early Universe.
In this work, we explore the range of the ratio between fine-structure line cooling to photoelectric heating in local dusty, star-forming galaxies by comparing [C II], [O I], and [Si II] emission to PAH emission in the Great Observatories All Sky LIRG Survey (GOALS; Armus et al. 2009). GOALS is comprised of 244 galaxy nuclei within 202 LIRGs and ULIRGs spanning a range in merger stage and morphology. The range in IR luminosities and stellar masses of galaxies in GOALS makes the sample a bridge between normal star-forming galaxies and the most extreme, compact starbursts that host atypical PDR conditions exposed to stronger radiation fields (Díaz-Santos et al., 2017). Whether or not the gas cooling/heating properties are fundamentally different in such extreme environments remains an open question which this work aims to address.
GOALS has been the subject of extensive study with observations spanning the electromagnetic spectrum111For a complete list, visit http://goals.ipac.caltech.edu/publications.html., including mid- and far-IR measurements of PDR cooling lines and PAHs, the ratio of which is an empirical measure of the photoelectric efficiency, : the fraction of energy, in UV photons, emitted by hot stars that is absorbed by small dust grains and transferred into the neutral PDR gas via the photoelectric effect (e.g., Gerola & Schwartz 1976; de Jong 1977). There is evidence that is a constant amongst normal star-forming galaxies (Helou et al., 2001; Sutter et al., 2019); however, this has yet to be tested in the starburst regime typical in luminous and ultra-luminous infrared galaxies powered by star formation..
The paper is organized as follows: We review the multi-wavelength observations in Section 2, and discuss the sample selection. Section 3 summarizes important derived quantities of GOALS galaxies presented in other works, as well as key analysis steps we take in this paper to appropriately combine the multi-wavelength data. Our results are presented in Section 4, which we discuss in Section 5 in the context of local star-formation and trends in galaxy evolution. Section 6 summarizes the paper.
2 Sample Selection and Data
This work focuses on data from Spitzer/IRS (Díaz-Santos et al., 2010, 2011; Petric et al., 2011; Stierwalt et al., 2013, 2014; Inami et al., 2013), Spitzer/IRAC (Mazzarella et al. 2020, in prep.), Herschel PACS and SPIRE (Zhao et al., 2013; Díaz-Santos et al., 2013, 2014, 2017), and AKARI/IRC (Inami et al., 2018).
To measure the ratio of cooling and heating in star-forming gas, we select from the 244 galaxies in GOALS all sources with [Ne V]14.3μm / [Ne II] and/or [O IV]25.9μm / [Ne II] in oder to exclude from the sample those galaxies with significant heating from a central AGN (Inami et al., 2013; Petric et al., 2011). Sources with low PAH equivalent widths (EW) but no high-ionization emission lines are not removed from the sample to avoid biasing the results concerning grain properties such as size and ionization. As a result, 16 strong AGN systems are removed from consideration. Heavily dust obscured AGN could still be lurking in the sample, and we use mid-IR AGN fractions () derived in Díaz-Santos et al. (2017) to identify sources with excess warm dust in the remaining sample, which we show in Figures to concentrate on the star-forming properties of the sample galaxies.
To fully explore the properties of interstellar PAH grains, we use AKARI spectra of 145 GOALS (U)LIRGs presented in Inami et al. (2018), in which the 3.3 PAH feature was detected for 133 targets. This sub-sample spans the full range of LIR and luminosity distance, and is representative of the range in star-formation properties of GOALS.
3 Analysis
In addition to measured line fluxes, this work makes use of a number of quantities from Herschel/PACS observations derived in Díaz-Santos et al. (2017): We subtract out the ionized component of [C II] emission using the neutral [C II] PDR fractions (), estimated with [N II]122 and [N II]205 available for 54% of the sample, and far-IR colors otherwise, as described in Díaz-Santos et al. (2017). We use IR surface densities from Díaz-Santos et al. (2017) which are calculated from the effective area measured at , and total IR luminosities from Armus et al. (2009). We also use measurements of the average intensity of the UV interstellar radiation field impinging onto the surface of PDRs, G, measured in local units (G0 erg s-1 cm-2, Habing 1968), and neutral gas volume densities, nH, derived using the Kaufman et al. (1999, 2006) PDR models through PDR TOOLKIT (PDRT; Pound & Wolfire 2008) which depend principally on the galaxy-integrated [C II] and [O I] line fluxes, as well as LIR.
3.1 PAH Properties
The PAH line fluxes used in our analysis are reported in Stierwalt et al. (2013, 2014), and Inami et al. (2018). We take the PAH luminosity, LPAH, to be the sum of features measured between by Spitzer IRS. Specifically, LPAH includes the , , , , and PAH lines and all sub-features therein, as measured by CAFE which fits the line fluxes, continuum and the extinction simultaneously (Marshall et al., 2007). On average, these five PAH lines account for of the total PAH luminosity measured by both the Short-Low (SL, ) and Long-Low (LL, ) slits in GOALS galaxies (Stierwalt et al. 2014). Because the SL and LL slits have different widths, tied to the changing PSF with wavelength, some highly resolved galaxies show a small jump between their SL and LL IRS spectra. This is discussed fully in Stierwalt et al. (2013), and we combine the SL and LL data using their scale factors derived from the wavelength overlap between the two slits. LPAH is normalized to the SL slit. The 3.3 PAH luminosities () are also matched to the aperture extraction of IRS/SL data (see Inami et al. 2018 Section 3); however, represents a small component of LPAH (), and is therefore only used to investigate the properties of PAH line ratios. In general, the fraction of total PAH power measured through the SL slit compared to the LL slit does not correlate with galaxy distance, or other quantities we compare against in this work, namely . The sum of PAH features between 6 and 18 traces the bulk of the total power of PAH emission in GOALS.
From the sub-sample of GOALS galaxies with AKARI observations, 50 objects were selected as test-cases for CAFE-NG (Advanced CAFE; Bonfini et. al., in prep., Marshall et al. 2007), which simultaneously fits continuum and spectral features in the range. These galaxies have full spectral model fits to the AKARI+Spitzer data, which explicitly includes silicate absorption and 3.05 ice feature absorption which are fit independently. Joint fits to IR continuum and line measurements are important to get accurate line fluxes e.g., Smith et al. 2007; Lai et al. 2020), and we use these new CAFE fits to estimate extinction-corrected 3.3 luminosities, , for the full AKARI sample. In general, the measured PAH intensity depends on how the local continuum is estimated. Inami et al. (2018) adopt a spline technique (), which is known to under-estimate the extinction-corrected flux of PAH features between m by (Smith et al., 2007). From careful fits to the full PAH features (Bonfini et al., in prep.) we find that . For the sample here we use this conversion and the results from Inami et al. (2018) to estimate for each source before comparing to the other PAH features.
3.2 Aperture Matching
Galaxies in GOALS vary from extended sources spatially resolved by Spitzer to unresolved point-like sources, which motivates a careful approach to aperture matching when comparing Sptizer and Herschel measurements. The effective area of the Spitzer/IRS SL slit is (Stierwalt et al., 2013). To best match this area, we begin by using [C II] and [O I] line fluxes measured through the central spaxel of the PACS/IFU with dimensions of (See Sect. 3.2 in Díaz-Santos et al. 2017). Next, we project the effective SL slit and PACS central-spaxel aperture onto the Spitzer/IRAC images, assuming that it traces the co-spatial PAH and far-IR line emission from star-forming regions in LIRGs, which is reasonable for the kpc-scale observations in this work (Peeters et al., 2004; Alonso-Herrero et al., 2010; Pereira-Santaella et al., 2010; Salgado et al., 2016; Hughes et al., 2016). Smith et al. (2007) show the fractional power of PAHs to the IRAC 8 band to have a median value of in normal star-forming galaxies, which increases only marginally when a more careful subtraction of stellar continuum is done using the IRAC channels (e.g., Helou et al. 2004). We use the ratio of the flux through each aperture to derive a correction, which is then used to scale down the PACS measurements to match the IRS aperture. The median of aperture corrections derived in this manner is 0.62 with upper and lower quartiles of 0.69 and 0.55 respectively. We note that aperture matching does not introduce any bias in the slope of trends we explore in this paper.
The [Si II] 34.8 emission was measured in the Spitzer/IRS LL slit, using an effective extraction aperture of (Stierwalt et al., 2013). To match measurements made through the IRS/SL slit, we scale the [Si II] line flux down to the normalization of the SL spectrum using the same multiplicative factors applied to the 17 PAH fluxes (Stierwalt et al., 2013). As noted in Stierwalt et al. (2014), 15 LIRGs in GOALS have scale factors due to extended structure in the LL slit not captured by the SL slit. To avoid complications, we do not include these sources in our analysis. In summary, we have matched the apertures between Herschel/PACS and Spitzer/IRS, and the measurements reported here are for the central regions ( kpc) of GOALS systems unless explicitly stated otherwise.
4 Results
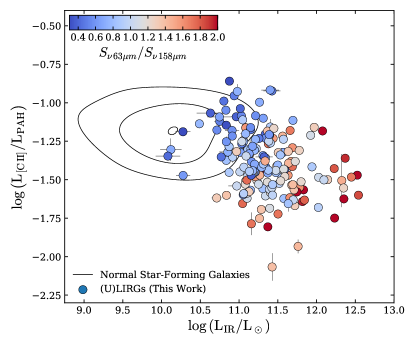
Following early [C II] surveys of low-redshift, mostly normal star-forming galaxies with ISO, Helou et al. (2001) measured a constant [C II]/PAH ratio over a range of far-IR colors that showed significantly less scatter than [C II]/LIR. This reinforced the link between PAHs and [C II] emission via photoelectric heating inside PDRs. We find that the galaxy-integrated [C II]/PAH ratio in luminous, infrared, star-forming galaxies does not correlate strongly with either far-IR color or LIR as shown in Figure 1, although warmer LIRGs and ULIRGs tend to have lower [C II]/PAH ratios compared to galaxies at . Trends in PDR gas cooling/heating within the GOALS sample are likely to be more clear when measured against quantities that better reflect the ionizing radiation or luminosity density surrounding the young stars.
| Line | (dex) | |||
|---|---|---|---|---|
| [C II] | -0.278 | -0.124 | 0.00 | 0.08 |
| [C II] | -2.378 | 0.242 | -0.016 | 0.15 |
| [O I] | -1.997 | 0.013 | 0.00 | 0.19 |
| [Si II] | -14.325 | 2.487 | -0.120 | 0.19 |
| aaSee Equation 2. | -6.277 | 1.010 | -0.050 | 0.12 |
Note. — All line luminosities have been calculated from aperture matched flux measurements as described in Section 3 unless otherwise noted. Fits are a function of (0.5LIR in units of L⊙ kpc-2. The right-most column corresponds to the scatter about the trend.
4.1 Line-to-PAH Ratios
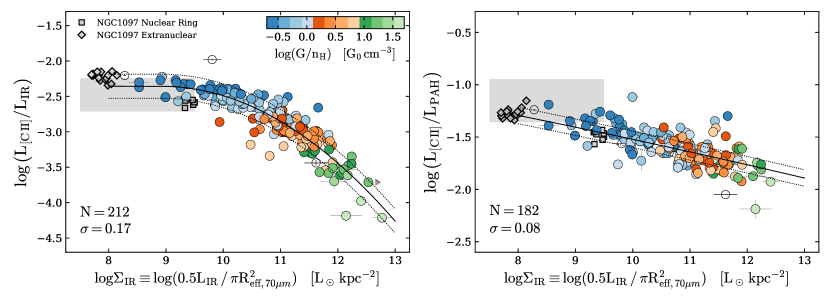
The IR surface density is a more direct tracer of far-IR fine-structure line properties than color or LIR (Díaz-Santos et al., 2013, 2017; Smith et al., 2017), both of which exhibit little to no influence on the ratio of [C II]/PAH (Fig. 1). As should scale with the number density of massive star-forming regions in the beam, we expect to be more sensitive to statistical trends across the sample. The [C II] deficit vs. among luminous infrared star-forming galaxies presented in Díaz-Santos et al. (2017) is re-created for comparison in Figure 2 (Left). To test for trends in gas cooling over photoelectric heating, we calculate the [C II]/PAH ratio as a function of , shown in Figure 2 (Right), color coded by which scales linearly with IR surface density above (Díaz-Santos et al., 2017). Whereas the [C II]/LIR ratio exhibits a maximum deficit of dex between , the [C II]/PAH ratio falls by a factor of dex over the same range. LIRGs at low exhibit [C II]/LIR and [C II]/PAH ratios comparable to those found in the spatially-resolved regions of NGC 1097 (Beirão et al., 2012), and the normal star-forming galaxies in Helou et al. (2001).
Following Díaz-Santos et al. (2017), we fit a second-order polynomial function to the [C II]/PAH ratio of the form:
| (1) |
Note that the function is forced to a constant maximum at values of less than where the turn-over occurs. While we do not include normal star-forming galaxies in the fit, a constant line-to-PAH ratio below the turn-over yields the best agreement with observations of low galaxies (e.g., Helou et al. 2001; Beirão et al. 2012; Croxall et al. 2012). The best-fit is shown as a black solid line in Fig. 2 (Right), the parameters for which are given in Table 1. While the [C II]/PAH ratio is not constant, the magnitude of the drop with is significantly less.
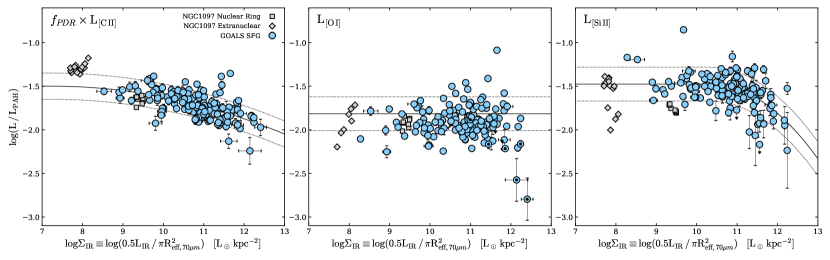
In addition to [C II], [O I] and [Si II] are important PDR cooling lines in terms of their overall contribution to the cooling budget (e.g., Rosenberg et al. 2015), and their strengths relative to the PAH emission are a diagnostic of PDR structure. Large [O I]/PAH ratios where [C II]/PAH is low could indicate greater gas densities, which would preferentially cool through the higher critical density [O I] line. In Figure 3, we show the [C II]/PAH, [O I]/PAH, and [Si II]/PAH ratios in separate panels for LIRGs and ULIRGs as a function of . Because we are comparing different fine-structure cooling lines here and would like to focus on the PDR emission alone, we subtract out the non-PDR component of the [C II] emission using (e.g., Díaz-Santos et al. 2017). At low IR surface densities, the line-to-PAH ratios are consistent with spatially-resolved measurements of NGC 1097 (Beirão et al., 2012), representative of more normal star-forming conditions.
[C II]/PAH falls in the most compact sources at . [O I]/PAH does not exhibit a turn-over at high , but shows an increasingly larger scatter (higher than the other line ratios), mostly with a constant lower envelope. This could arise from varying degrees of line self-absorption, as [O I] originates from deeper regions within PDRs, and/or the presence of intervening (foreground) cold, neutral material. Indeed, IRASF1224-0624, and ICO860, the two galaxies below the [O I]/PAH trend both show signs of self-absorption in the PACS spectra and have some of the highest optical depths observed in the sample; however, [O I] self-absorption is only observed in of GOALS in total (12 objects, see Díaz-Santos et al. 2017) spanning , and is therefore unlikely to influence statistical trends in the sample over the full range in .
| SNR [aa Assuming normally distributed posteriors.] | |||
|---|---|---|---|
| LIR | |||
| bb See Figure 4. | |||
| cc See Figure 5. | |||
| EW() | |||
| dd For the subset of GOALS (U)LIRGs with AKARI 3.3 PAH detections. See Figure 7. |
Note. — Kendall’s correlation coefficients () and values were calculated using pymccorrelation (Privon et al., 2020), which implements bootstrap error estimation on and with censored data (upper limits) as described in Curran (2014) and Isobe et al. (1986) respectively. We report 16%, 50%, and 84% percentiles for each quantity.
4.2 The Photoelectric Efficiency
The photoelectric efficiency () is the fraction of energy that photoelectrons from PAHs transfer from UV photons into the gas relative to the total heating of dust. Observationally, can be traced by the ratio of far-IR line emission to total PAH emission because photoelectrons from PAHs are one of the dominant heating mechanisms in PDRs, which cool predominantly via far-IR fine-structure line emission (e.g., Bakes & Tielens 1994; Malhotra et al. 2001; Croxall et al. 2012; Beirão et al. 2012). In practice, the cooling budget is dominated by [C II], [O I], and [Si II], and LPAH(L+L+L). Assuming that the PAHs and ions are co-spatial such that the energy input into the gas by photoelectric heating powers the [C II], [O I], and [Si II] lines, an empirical tracer of the photoelectric efficiency is
| (2) |
where the relative contribution of far-IR lines to can vary across the PDR (Kaufman et al., 2006). Nevertheless, combined observations of these features capture an average of PDRs over a galaxy.
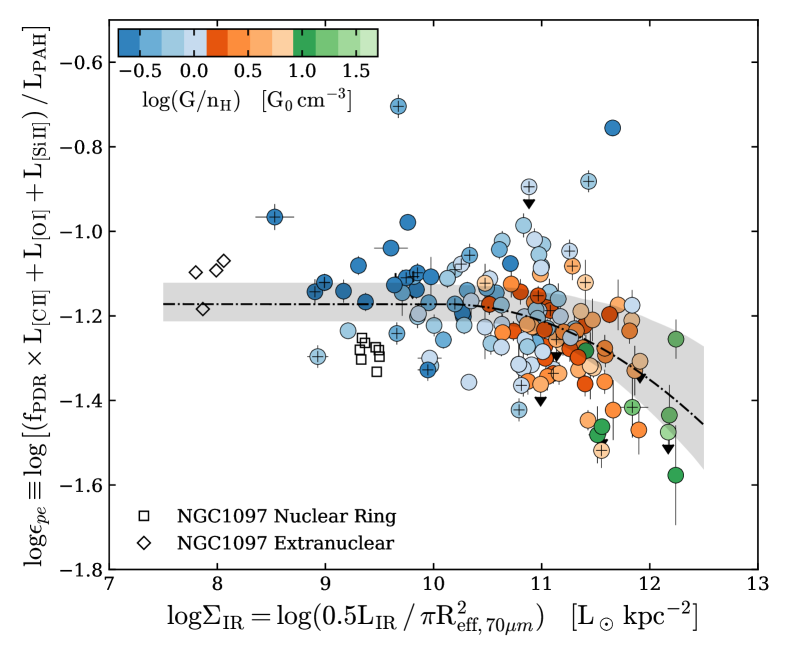
We measure the average for 152 GOALS star-forming galaxies including five upper limits, and show the combined sum of neutral [C II], [O I], and [Si II] cooling over LPAH in Figure 4. A Kendall’s test supports an anti-correlation between and at (see Table 2). As shown in Fig. 4, LIRGs at low exhibit fairly constant photoelectric efficiencies comparable to observations of normal star-forming galaxies (Beirão et al., 2012; Croxall et al., 2012). At high , the sum of all cooling lines relative to the PAHs shows a decreasing photoelectric efficiency, which suggests that the net cooling to photoelectric heating ratio is falling across the density and temperature structure of PDRs in compact objects. The relative contributions of [C II], [O I], and [Si II] to the cooling budget within PDRs (i.e., the numerator of Eq. 2) are on average 32%, 20%, and 48% respectively, and these values do not change significantly when splitting the sample above and below . Therefore, low photoelectric efficiencies are the product of overall less cooling in PDRs in all channels relative to PAH heating.
The anti-correlation between and is robust against outliers, as demonstrated by the bootstrap fits on Figure 4. Nevertheless, there exist galaxies deviating from the trend by more than that warrant closer inspection. At all IR surface densities, objects in this class collectively have higher mean and median compared to the rest of the sample. Thus, the scatter above and below the best-fit trend may be partially due to sources with an excess of hot dust continuum emission in their mid-IR spectra. This may be due to a weak, deeply buried AGN, even in sources where LIR is dominated by star formation, which in turn may change the ionization structure and the PAH properties (Voit, 1992; Langer & Pineda, 2015; Langer et al., 2017). Alternatively, these objects may harbor heavily obscured star-forming regions with high levels of line self-absorption and/or continuum opacities. This absorption should appear in the PACS line profiles, but only 12 GOALS sources show evidence for absorption in the [O I] line (Díaz-Santos et al., 2017). We note that the detection of these signatures, presumably due to compact (narrow velocity) foreground clouds, may be limited by the coarse spectral resolution () of Herschel/PACS (Gerin et al., 2015).
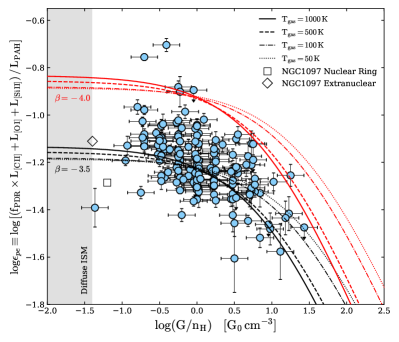
The photoelectric efficiencies we measure represent averages over the local properties of PDRs in the central ( kpc) star-forming regions of luminous infrared galaxies, and the trend in Fig. 4 suggests a departure from the typical ISM and PDR conditions at high . Indeed, galaxies in this domain with low also have the largest ratios of G/nH, which is also sensitive to the local physics of PDRs. We fit Equation 1 to the data, the parameters of which are given in Table 1, and find that the photoelectric efficiency turns over at , close to where G/nH scales linearly with (Díaz-Santos et al., 2017). Models of heating and cooling in PDRs predict an anti-correlation between G/nH and as the size and charge of dust grains are modified by the stellar radiation field (e.g., Bakes & Tielens 1994; Tielens 2008), a trend which we recover in Figure 5 at high () significance (see Tab. 2). We find general agreement between modeled and measured for K, reasonable values for temperatures across the phase structure of PDRs (e.g., Tielens & Hollenbach 1985; Bakes & Tielens 1994; Draine & Bertoldi 1996), and the two sets of models are able to account for the range in we measure in GOALS. The most extreme ULIRGs at high and low also show the highest values of supporting a link between the strength of the radiation field and the heating efficiency within the PDR, which is mediated by the properties of PAH grains.
5 Discussion
In this work, we find that the cooling-to-heating ratios observed in the most compact luminous infrared galaxies are low, and are accompanied by an increase in the mean energy density per H atom () incident upon the surfaces of PDRs. The IR surface density is a global property of a galaxy, and both and measure the average physical conditions local to the PDRs. The trends between , , and suggest a link between the global properties of a starburst and the conditions of individual star-forming regions.
5.1 Alternate Explanations for decreasing with
The low photoelectric efficiencies we measure in galaxies with high (Fig. 4) and high (Fig. 5) suggests a change in the thermal regulation of star-forming gas in compact LIRGs; however, a number of alternative physical conditions may conspire to produce the trends we observe with .
The relative strengths of the far-IR cooling or PAH emission may be affected by any or all of the following: (1) Far-IR line fluxes may be suppressed by optically thick continuum absorption (e.g., Scoville et al. 2017a). In this case, the [O I]/LIR-deficit would have a steeper slope than [C II]/LIR (e.g., Malhotra et al. 2001), a trend that is not observed (Díaz-Santos et al., 2017). (2) Ionized gas from diffuse or H II regions, and/or AGN may contribute to the [C II] and [Si II] line fluxes owing to their ionization potentials being lower than that of neutral hydrogen. This is unlikely to drive trends in our sample, as the photoelectric efficiency does not correlate with the fraction of [C II] emission from PDRs (; Tab. 2). Moreover, the neutral PDR fraction of [Si II] would have to be larger at low or smaller at high to maintain constant , both of which are inconsistent with the increase in PDR area filling factor with in LIRGs and ULIRGs (Díaz-Santos et al., 2017). (3) PAH molecules in galaxies with large absorb and re-emit more energy per unit dust mass because of the large UV opacities of grains (Li & Draine, 2001). If the PAHs and ions (C+, O, and Si+) were de-coupled spatially, LPAH could increase with without a corresponding increase in (L+L+L), lowering the observed IR line-to-PAH ratio by Eq. 2. However, this spatial decoupling of PAHs and ions is inconsistent with observations of PDRs in the Milky Way (Okada et al., 2013; Salgado et al., 2016), the LMC (Lebouteiller et al., 2012; Chevance et al., 2016), and local galaxies (Croxall et al., 2012; Abdullah et al., 2017; Bigiel et al., 2020). (4) Metallicity may influence the strength of cooling lines and the PAHs (Cormier et al., 2015; Smith et al., 2017; Croxall et al., 2017; Cormier et al., 2019; Aniano et al., 2020). However, direct effects on the PAH grains appear most pronounced at metallicities well below those seen in GOALS galaxies, which typically have (Inami et al., 2013; Díaz-Santos et al., 2017). Therefore, the trends observed in Fig. 4 and Fig. 5 likely reflect variations in the heating and cooling mechanisms on the scale of individual PDRs.
5.2 Dust Grain Properties and the Photoelectric Efficiency
The photoelectric efficiency is not only a function of , but also the size and ionization state of PAH grains (Bakes & Tielens, 1994; Galliano et al., 2008; Tielens, 2008). Observations of PDRs in the Milky Way indicate that falls as the grain charging parameter () rises, and grains become more ionized (Tielens, 2008; Okada et al., 2013; Salgado et al., 2016). Indeed, the models of Bakes & Tielens (1994) shown in Figure 5 predict low at high , and the data falls closer to the model with a grain size distribution weighted more towards larger grains. Thus, a link between PAH properties and is to be expected if the decrease in at high arises from a change in the local physics of gas heating in PDRs as mediated by the charge and size of PAHs.
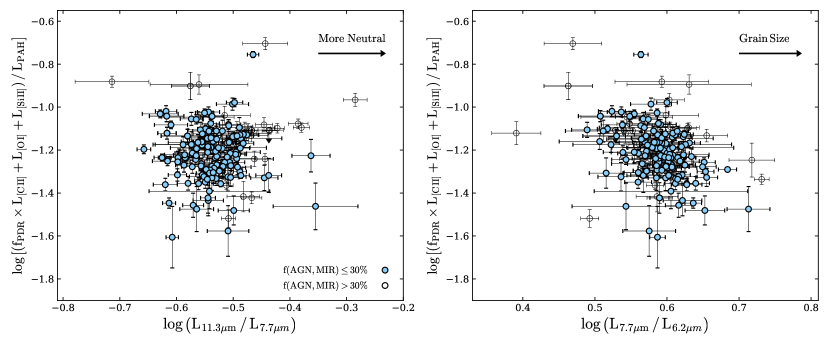
Ratios between the 6.2, 7.7, 8.6, and 11.3 PAH lines are well-established as tracers of grain size and ionization (e.g., Draine & Li 2001; Tielens 2008), and local LIRGs exhibit comparable ratios to nearby, normal star-forming galaxies and high- ULIRGs (Stierwalt et al., 2014; Smith et al., 2007; Pope et al., 2008; Wu et al., 2010; Shipley et al., 2013). For example, star-forming LIRGs cluster tightly in vs. , tracing grain size and ionization respectively, which show a larger scatter in sources with AGN (Stierwalt et al., 2014).
Figure 6 shows as a function of the ratio, a tracer of grain charge, and the ratio, a tracer of the average cationic grain size (Draine & Li, 2001). We do not detect a correlation between and the grain ionization state at a significant confidence level (Tab. 2); however, and are anti-correlated at a confidence level, albeit with large scatter, suggesting that that the average size of PAH grains may influence the observed photoelectric efficiencies in local (U)LIRGs, consistent with the sensitivity of theoretical photoelectric efficiencies on the grain size distribution (Fig. 5).
Smaller PAH grains emit more strongly in the shorter wavelength bands, whereas larger grains are brighter at longer wavelengths (Allamandola et al., 1989; Schutte et al., 1993; Draine & Li, 2001). Thus, the diagnostic utility of a PAH line ratio as a grain-size indicator is a function of the separation in wavelength of the two features. The 7.7/6.2 ratio has been a wide-spread tool in the literature as both features are bright in extragalactic sources, relatively unaffected by the 9.7 silicate ice feature, and were observable simultaneously with IRS aboard Spitzer (Draine & Li, 2001; O’Dowd et al., 2009; Sandstrom et al., 2012; Stierwalt et al., 2014). With the advent of AKARI/IRC, the 3.3 PAH feature became accessible for large numbers of extragalactic sources while unlocking a longer baseline diagnostic of grain size.
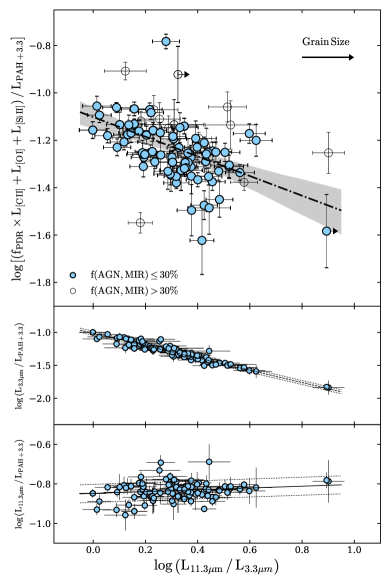
The ratio of to PAH intensity is one of the most robust tracers of PAH grain size because of the large baseline in wavelength (Allamandola et al., 1989; Jourdain de Muizon et al., 1990; Schutte et al., 1993; Mori et al., 2012; Ricca et al., 2012; Croiset et al., 2016; Maragkoudakis et al., 2020). Using the available AKARI spectra in GOALS, we plot vs. in Figure 7 to further test if low is associated with larger or smaller PAHs. We find that galaxies in the AKARI sub-sample of GOALS with low show systematically higher values of 11.3/3.3 PAH emission (Tab. 2). This trend is not driven by systematic variations in the 11.3 feature strength, as the /LPAH ratio is constant over the range in , and exhibits minimal scatter of 0.05 dex about the average (Fig. 7, bottom panel). Instead, the strength of the features relative to LPAH decreases dramatically by nearly an order of magnitude (Fig. 7, center panel). The anti-correlation between and reinforces the importance of the mean grain size in dictating the observed photoelectric efficiency.
5.3 Physical Interpretation
The photoelectric heating efficiency of PAHs falls as the number of carbon atoms per particle increases (e.g., Bakes & Tielens 1994), and small grains are preferentially destroyed in the presence of harsh radiation fields (e.g., Jochims et al. 1994). This provides a simple physical interpretation of the data presented so far: PDRs in the most compact starbursts () have, on average, more intense radiation fields per gas density (Díaz-Santos et al., 2017), which leads to a preferential destruction of the smallest PAH grains, raising the average grain size and leaving behind large PAHs capable of releasing both less and weaker photo-electrons. This decreases the energy of a typical photoelectron available to heat the gas, and results in a lower gas heating efficiency.
This scenario is consistent with principles of PDR evolution. The strength of the radiation field impinging upon PDRs (i.e., ) is inversely proportional to the distance between the ionization front and the ionizing photon source (Kaufman et al., 1999). Therefore, higher values of are associated with younger PDR systems that have yet to evolve away from their host star, and are more likely to be found in galaxies with higher star-formation rate surface densities (e.g., Díaz-Santos et al. 2017). The low photoelectric efficiencies at high are plausibly linked to higher fractions of young, short-lived, and dust-cocooned star-forming regions, where the high ratios of destroy small dust grains, hindering the coupling between the radiation field strength and PDR gas temperatures. Such PDRs may be continuously replenished by the compaction of gas and dust during a major merger (Sanders et al., 1988; Hopkins et al., 2008). Indeed, the majority of late-stage mergers (80%) are above (Stierwalt et al., 2013; Díaz-Santos et al., 2017), where photoelectric efficiencies are low.
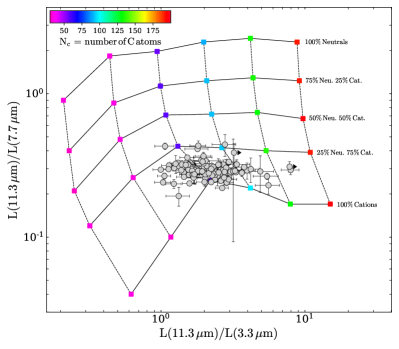
As shown in Figure 8, the and ratios in LIRGs and ULIRGs are consistent with predominantly ionized PAHs containing on average C atoms per particle when compared to the modeled PAH spectra of Maragkoudakis et al. (2020)222We adopt the Maragkoudakis et al. (2020) models corresponding to a mean photon energy of 10 eV.. PAHs with tend to be photo-destroyed in PDRs (Jochims et al., 1994), which is close to the lower bound on grain sizes we observe for LIRGs and ULIRGs in Fig. 8. Other mechanisms for grain destruction include shock-induced fragmentation and/or shattering; however, interstellar shocks tend to destroy larger grains which is the opposite effect we see in the data (Jones et al., 1996). Therefore, may be a critical factor for determining the photoelectric efficiency in (U)LIRGs with the grain size distribution acting as an intermediary between the radiation field, and gas cooling and heating.
5.4 Prospects for Star-Formation at High-Redshift
The rise and fall of the cosmic star-formation rate density may be accompanied by an increase in the efficiency of star-formation at earlier times, although this remains a subject of debate (e.g., Lilly et al. 1996; Madau et al. 1996; Madau & Dickinson 2014; Tacconi et al. 2010, 2013, 2018; Genzel et al. 2015; Scoville et al. 2017b; Liu et al. 2019; Decarli et al. 2019). Nevertheless, starbursts above the main-sequence have higher star-formation efficiencies (star-formation rate per unit molecular gas mass) than normal galaxies, independent of redshift (Saintonge et al., 2013; Genzel et al., 2015; Scoville et al., 2017b). Can changes in the global star-formation efficiency of a galaxy, with redshift and/or distance from the main-sequence, be linked to variations in the ISM conditions on small scales?
Given that photoelectric heating is the dominant coupling mechanism between gas temperatures and stellar radiation fields, could play a role in mediating the star-formation efficiency today and in the past by raising or lowering the energy transfer from stellar photons into the gas. When the photoelectric efficiency is low, photo-electrons convert a lower fraction of the incident radiation field into raising the gas temperature. In other words, gas may remain cold despite overall less cooling relative to photoelectric heating because the mechanism by which gas heats in the first place is weak at low . This may be more common at earlier times, because normal star-forming galaxies at high-redshift are more compact than local galaxies at a given stellar mass (Buitrago et al., 2008; Conselice, 2014; van der Wel et al., 2014; Mowla et al., 2019), and anti-correlates with . In addition, efficient star-formation in the thick disks of high dusty, star-forming galaxies could contain a number of star-forming regions that each resemble the central regions of local (U)LIRGs (e.g., Tacconi et al. 2008; Bothwell et al. 2010; Stacey et al. 2010; Brisbin et al. 2015), in which case high and low could be common in PDRs across a high starburst. These conditions may play a more important role at high-redshift as the contribution of ULIRGs to the total star-formation rate density increases from to by a factor of (Murphy et al., 2011).
Recent efforts to combine mid- and far-IR measurements of gas heating and cooling at are largely limited to handfuls of ULIRGs with archival Spitzer/IRS spectra (Brisbin et al., 2015; McKinney et al., 2020). Using ALMA, McKinney et al. (2020) compared the [C II] and 6.2 PAH emission for GS IRS20, a luminous, compact starburst galaxy at and found a low [C II]/6.2 ratio at high IR surface density that could indicate a low photoelectric efficiency. This galaxy has a L/ ratio of 0.11, which would correspond to a 11.3/3.3 ratio of 21.5 if galaxies follow similar scaling relations between the PAH features and [C II] as in local (U)LIRGs. If this is the case, then GS IRS20 would have a PAH flux of , which can be easily detected in under 15 minutes by JWST/MIRI. While MIRI will be excellent at measuring bright PAH lines at high, our ability to probe much of the rest-frame mid and far-IR regime at high remains limited. Future facilities, such as the Origins Space Telescope333https://origins.ipac.caltech.edu/, a proposed flagship mission covering the near-far infrared with powerful imaging and spectroscopic capabilities and a large, cold telescope, would be a powerful tool for measuring the full energy budget in distant star-forming galaxies, and testing the idea that the star-formation efficiency is linked to the balance of gas cooling and heating.
6 Summary and Conclusion
We combine observations of PAH emission with measurements of the far-infrared fine-structure [C II], [O I], and [Si II] lines to infer the properties of gas heating and cooling in local, star-forming, luminous infrared galaxies. The ratio of IR cooling lines to PAH emission traces the photoelectric efficiency, , and measures the coupling between stellar radiation field and gas temperatures in photodissociation regions (PDRs). Our main conclusions are:
-
1.
In local LIRGs, the ratio of [C II] to PAH emission does not correlate with LIR or far-IR color, both of which trace a mix of the diffuse and PDR dust.
-
2.
We find an anti-correlation between [C II]/PAH and IR surface density () where the most compact ULIRGs have low ratios of [C II] cooling to PAH emission compared to normal star-forming galaxies by dex. The [C II]/PAH ratio exhibits less overall scatter in GOALS than L/LIR, as well as a lower magnitude of decline between low- and high- galaxies.
-
3.
[Si II]/PAH and [O I]/PAH exhibit constant ratios up to the most compact ULIRGs, were some objects fall below the average value by a factor of in both line ratios. Notably, [O I]/PAH does not increase when [C II]/PAH is low: enhanced cooling via the [O I] channel is not sufficient to compensate for the deficiencies observed in the [C II] line when considering the total cooling budget.
-
4.
We measure the photoelectric efficiency as (LLL)/LPAH, which is a factor of lower in galaxies with , which also have high ratios of UV radiation field strength to neutral hydrogen density (G/nH). Compact ULIRGs have low photoelectric efficiencies and more extreme ISM conditions, indicating a link between the large-scale energy density of a starburst and the gas cooling and heating properties on PDR scales.
-
5.
LIRGs with low photoelectric efficiencies have high ratios of to PAH emission, a tracer of the mean PAH grain size. We estimate typical grain sizes of C atoms per grain in LIRGs, and find that the PAHs are predominantly ionized. Large, ionized grains produce both less and weaker photo-electrons, which may contribute to the low photoelectric efficiencies in the most compact ULIRGs if small grains are preferentially destroyed. Spectral signatures of grain emission can be used to understand the role played by dust in regulating the star-formation of galaxies.
The photoelectric efficiency may be key for regulating the evolution of the ISM, and can influence the overall star-formation efficiency by mediating the coupling between stellar radiation fields and gas temperatures. The trends between , , and G/nH reflect vigorous, compact star-formation where dusty and young PDRs exhibit less efficient gas heating. Low photoelectric efficiencies may be common in the high-redshift Universe where compact star-formation is ubiquitous, and may also contribute to changes in the star-formation efficiency. The link between the efficiency of star-formation and the cooling/heating balance will be further tested with JWST and ALMA, but ultimately a large space-based IR telescope like Origins is needed to measure the mid and far-infrared emission and track the full energy budget in star-forming galaxies over a significant fraction of cosmic time.
We thank the referee for the thoughtful comments and recommendations. J.M. thanks S.Linden for the constructive feedback on the paper. J.M. was supported by the IPAC Visiting Graduate Fellowship. A.S.E. and Y.S. were supported by NSF grant AST 1816838. H.I. acknowledges support from JSPS KAKENHI Grant Number JP19K23462. This work is based on observations made with the Herschel Space Observatory, a European Space Agency (ESA) Cornerstone Mission with science instruments provided by European-led Principal Investigator consortia and significant participation from NASA. The Spitzer Space Telescope is operated by the Jet Propulsion Laboratory, California Institute of Technology, under NASA contract 1407. This research is based on observations with AKARI, a JAXA project with the participation of ESA. This research has made use of the NASA/IPAC Extragalactic Database (NED), which is operated by the Jet Propulsion Laboratory, California Institute of Technology, under contract with the National Aeronautics and Space Administration, and of NASA’s Astrophysics Data System (ADS) abstract service. This research has made use of the NASA/IPAC Infrared Science Archive, which is operated by the Jet Propulsion Lab- oratory, California Institute of Technology, under contract with the National Aeronautics Space Administration.
References
- Abdullah et al. (2017) Abdullah, A., Brandl, B. R., Groves, B., et al. 2017, ApJ, 842, 4, doi: 10.3847/1538-4357/aa6fa9
- Allamandola et al. (1989) Allamandola, L. J., Tielens, A. G. G. M., & Barker, J. R. 1989, ApJS, 71, 733, doi: 10.1086/191396
- Alonso-Herrero et al. (2010) Alonso-Herrero, A., Pereira-Santaella, M., Rieke, G. H., et al. 2010, Advances in Space Research, 45, 99, doi: 10.1016/j.asr.2009.08.010
- Aniano et al. (2020) Aniano, G., Draine, B. T., Hunt, L. K., et al. 2020, ApJ, 889, 150, doi: 10.3847/1538-4357/ab5fdb
- Armus et al. (2009) Armus, L., Mazzarella, J. M., Evans, A. S., et al. 2009, PASP, 121, 559, doi: 10.1086/600092
- Bakes & Tielens (1994) Bakes, E. L. O., & Tielens, A. G. G. M. 1994, ApJ, 427, 822, doi: 10.1086/174188
- Beirão et al. (2012) Beirão, P., Armus, L., Helou, G., et al. 2012, ApJ, 751, 144, doi: 10.1088/0004-637X/751/2/144
- Bigiel et al. (2020) Bigiel, F., de Looze, I., Krabbe, A., et al. 2020, ApJ, 903, 30, doi: 10.3847/1538-4357/abb677
- Bothwell et al. (2010) Bothwell, M. S., Chapman, S. C., Tacconi, L., et al. 2010, MNRAS, 405, 219, doi: 10.1111/j.1365-2966.2010.16480.x
- Brauher et al. (2008) Brauher, J. R., Dale, D. A., & Helou, G. 2008, ApJS, 178, 280, doi: 10.1086/590249
- Brisbin et al. (2015) Brisbin, D., Ferkinhoff, C., Nikola, T., et al. 2015, ApJ, 799, 13, doi: 10.1088/0004-637X/799/1/13
- Buitrago et al. (2008) Buitrago, F., Trujillo, I., Conselice, C. J., et al. 2008, ApJ, 687, L61, doi: 10.1086/592836
- Chevance et al. (2016) Chevance, M., Madden, S. C., Lebouteiller, V., et al. 2016, A&A, 590, A36, doi: 10.1051/0004-6361/201527735
- Conselice (2014) Conselice, C. J. 2014, ARA&A, 52, 291, doi: 10.1146/annurev-astro-081913-040037
- Cormier et al. (2015) Cormier, D., Madden, S. C., Lebouteiller, V., et al. 2015, A&A, 578, A53, doi: 10.1051/0004-6361/201425207
- Cormier et al. (2019) Cormier, D., Abel, N. P., Hony, S., et al. 2019, A&A, 626, A23, doi: 10.1051/0004-6361/201834457
- Croiset et al. (2016) Croiset, B. A., Candian, A., Berné, O., & Tielens, A. G. G. M. 2016, A&A, 590, A26, doi: 10.1051/0004-6361/201527714
- Croxall et al. (2012) Croxall, K. V., Smith, J. D., Wolfire, M. G., et al. 2012, ApJ, 747, 81, doi: 10.1088/0004-637X/747/1/81
- Croxall et al. (2017) Croxall, K. V., Smith, J. D., Pellegrini, E., et al. 2017, ApJ, 845, 96, doi: 10.3847/1538-4357/aa8035
- Curran (2014) Curran, P. A. 2014, Monte Carlo error analyses of Spearman’s rank test. https://arxiv.org/abs/1411.3816
- Dale et al. (2000) Dale, D. A., Silbermann, N. A., Helou, G., et al. 2000, AJ, 120, 583, doi: 10.1086/301478
- de Jong (1977) de Jong, T. 1977, A&A, 55, 137
- De Looze et al. (2014) De Looze, I., Cormier, D., Lebouteiller, V., et al. 2014, A&A, 568, A62, doi: 10.1051/0004-6361/201322489
- Decarli et al. (2019) Decarli, R., Walter, F., Gónzalez-López, J., et al. 2019, ApJ, 882, 138, doi: 10.3847/1538-4357/ab30fe
- Díaz-Santos et al. (2010) Díaz-Santos, T., Alonso-Herrero, A., Colina, L., et al. 2010, ApJ, 711, 328, doi: 10.1088/0004-637X/711/1/328
- Díaz-Santos et al. (2011) Díaz-Santos, T., Charmandaris, V., Armus, L., et al. 2011, ApJ, 741, 32, doi: 10.1088/0004-637X/741/1/32
- Díaz-Santos et al. (2013) Díaz-Santos, T., Armus, L., Charmandaris, V., et al. 2013, ApJ, 774, 68, doi: 10.1088/0004-637X/774/1/68
- Díaz-Santos et al. (2014) —. 2014, ApJ, 788, L17, doi: 10.1088/2041-8205/788/1/L17
- Díaz-Santos et al. (2017) —. 2017, ApJ, 846, 32, doi: 10.3847/1538-4357/aa81d7
- Draine & Bertoldi (1996) Draine, B. T., & Bertoldi, F. 1996, ApJ, 468, 269, doi: 10.1086/177689
- Draine & Li (2001) Draine, B. T., & Li, A. 2001, ApJ, 551, 807, doi: 10.1086/320227
- Galliano et al. (2008) Galliano, F., Madden, S. C., Tielens, A. G. G. M., Peeters, E., & Jones, A. P. 2008, ApJ, 679, 310, doi: 10.1086/587051
- Genzel et al. (2015) Genzel, R., Tacconi, L. J., Lutz, D., et al. 2015, ApJ, 800, 20, doi: 10.1088/0004-637X/800/1/20
- Gerin et al. (2015) Gerin, M., Ruaud, M., Goicoechea, J. R., et al. 2015, A&A, 573, A30, doi: 10.1051/0004-6361/201424349
- Gerola & Schwartz (1976) Gerola, H., & Schwartz, R. A. 1976, ApJ, 206, 452, doi: 10.1086/154400
- Graciá-Carpio et al. (2011) Graciá-Carpio, J., Sturm, E., Hailey-Dunsheath, S., et al. 2011, ApJ, 728, L7, doi: 10.1088/2041-8205/728/1/L7
- Habing (1968) Habing, H. J. 1968, Bull. Astron. Inst. Netherlands, 19, 421
- Helou et al. (2001) Helou, G., Malhotra, S., Hollenbach, D. J., Dale, D. A., & Contursi, A. 2001, ApJ, 548, L73, doi: 10.1086/318916
- Helou et al. (2004) Helou, G., Roussel, H., Appleton, P., et al. 2004, ApJS, 154, 253, doi: 10.1086/422640
- Herrera-Camus et al. (2015) Herrera-Camus, R., Bolatto, A. D., Wolfire, M. G., et al. 2015, in American Astronomical Society Meeting Abstracts, Vol. 225, American Astronomical Society Meeting Abstracts #225, 109.02
- Hopkins et al. (2008) Hopkins, P. F., Hernquist, L., Cox, T. J., & Kereš, D. 2008, ApJS, 175, 356, doi: 10.1086/524362
- Hughes et al. (2016) Hughes, T. M., Baes, M., Schirm, M. R. P., et al. 2016, A&A, 587, A45, doi: 10.1051/0004-6361/201527644
- Ibar et al. (2015) Ibar, E., Lara-López, M. A., Herrera-Camus, R., et al. 2015, MNRAS, 449, 2498, doi: 10.1093/mnras/stv439
- Inami et al. (2013) Inami, H., Armus, L., Charmandaris, V., et al. 2013, ApJ, 777, 156, doi: 10.1088/0004-637X/777/2/156
- Inami et al. (2018) Inami, H., Armus, L., Matsuhara, H., et al. 2018, A&A, 617, A130, doi: 10.1051/0004-6361/201833053
- Isobe et al. (1986) Isobe, T., Feigelson, E. D., & Nelson, P. I. 1986, ApJ, 306, 490, doi: 10.1086/164359
- Jochims et al. (1994) Jochims, H. W., Ruhl, E., Baumgartel, H., Tobita, S., & Leach, S. 1994, ApJ, 420, 307, doi: 10.1086/173560
- Jones et al. (1996) Jones, A. P., Tielens, A. G. G. M., & Hollenbach, D. J. 1996, ApJ, 469, 740, doi: 10.1086/177823
- Jourdain de Muizon et al. (1990) Jourdain de Muizon, M., D’Hendecourt, L. B., & Geballe, T. R. 1990, A&A, 235, 367
- Kaufman et al. (2006) Kaufman, M. J., Wolfire, M. G., & Hollenbach, D. J. 2006, ApJ, 644, 283, doi: 10.1086/503596
- Kaufman et al. (1999) Kaufman, M. J., Wolfire, M. G., Hollenbach, D. J., & Luhman, M. L. 1999, ApJ, 527, 795, doi: 10.1086/308102
- Lai et al. (2020) Lai, T. S. Y., Smith, J. D. T., Baba, S., Spoon, H. W. W., & Imanishi, M. 2020, arXiv e-prints, arXiv:2010.05034. https://arxiv.org/abs/2010.05034
- Langer & Pineda (2015) Langer, W. D., & Pineda, J. L. 2015, A&A, 580, A5, doi: 10.1051/0004-6361/201525950
- Langer et al. (2017) Langer, W. D., Velusamy, T., Morris, M. R., Goldsmith, P. F., & Pineda, J. L. 2017, A&A, 599, A136, doi: 10.1051/0004-6361/201629497
- Lebouteiller et al. (2012) Lebouteiller, V., Cormier, D., Madden, S. C., et al. 2012, A&A, 548, A91, doi: 10.1051/0004-6361/201218859
- Li & Draine (2001) Li, A., & Draine, B. T. 2001, ApJ, 554, 778, doi: 10.1086/323147
- Lilly et al. (1996) Lilly, S. J., Le Fevre, O., Hammer, F., & Crampton, D. 1996, ApJ, 460, L1, doi: 10.1086/309975
- Liu et al. (2019) Liu, D., Schinnerer, E., Groves, B., et al. 2019, arXiv e-prints, arXiv:1910.12883. https://arxiv.org/abs/1910.12883
- Luhman et al. (2003) Luhman, M. L., Satyapal, S., Fischer, J., et al. 2003, ApJ, 594, 758, doi: 10.1086/376965
- Luhman et al. (1998) —. 1998, ApJ, 504, L11, doi: 10.1086/311562
- Madau & Dickinson (2014) Madau, P., & Dickinson, M. 2014, ARA&A, 52, 415, doi: 10.1146/annurev-astro-081811-125615
- Madau et al. (1996) Madau, P., Ferguson, H. C., Dickinson, M. E., et al. 1996, MNRAS, 283, 1388, doi: 10.1093/mnras/283.4.1388
- Malhotra et al. (1997) Malhotra, S., Helou, G., Stacey, G., et al. 1997, ApJ, 491, L27, doi: 10.1086/311044
- Malhotra et al. (2001) Malhotra, S., Kaufman, M. J., Hollenbach, D., et al. 2001, ApJ, 561, 766, doi: 10.1086/323046
- Maragkoudakis et al. (2020) Maragkoudakis, A., Peeters, E., & Ricca, A. 2020, MNRAS, 494, 642, doi: 10.1093/mnras/staa681
- Marshall et al. (2007) Marshall, J. A., Herter, T. L., Armus, L., et al. 2007, ApJ, 670, 129, doi: 10.1086/521588
- McKinney et al. (2020) McKinney, J., Pope, A., Armus, L., et al. 2020, ApJ, 892, 119, doi: 10.3847/1538-4357/ab77b9
- Mori et al. (2012) Mori, T. I., Sakon, I., Onaka, T., et al. 2012, ApJ, 744, 68, doi: 10.1088/0004-637X/744/1/68
- Mowla et al. (2019) Mowla, L. A., van Dokkum, P., Brammer, G. B., et al. 2019, ApJ, 880, 57, doi: 10.3847/1538-4357/ab290a
- Muñoz & Oh (2016) Muñoz, J. A., & Oh, S. P. 2016, MNRAS, 463, 2085, doi: 10.1093/mnras/stw2102
- Murphy et al. (2011) Murphy, E. J., Chary, R. R., Dickinson, M., et al. 2011, ApJ, 732, 126, doi: 10.1088/0004-637X/732/2/126
- O’Dowd et al. (2009) O’Dowd, M. J., Schiminovich, D., Johnson, B. D., et al. 2009, ApJ, 705, 885, doi: 10.1088/0004-637X/705/1/885
- Okada et al. (2013) Okada, Y., Pilleri, P., Berné, O., et al. 2013, A&A, 553, A2, doi: 10.1051/0004-6361/201118450
- Peeters et al. (2004) Peeters, E., Spoon, H. W. W., & Tielens, A. G. G. M. 2004, ApJ, 613, 986, doi: 10.1086/423237
- Pereira-Santaella et al. (2010) Pereira-Santaella, M., Alonso-Herrero, A., Rieke, G. H., et al. 2010, ApJS, 188, 447, doi: 10.1088/0067-0049/188/2/447
- Petric et al. (2011) Petric, A. O., Armus, L., Howell, J., et al. 2011, ApJ, 730, 28, doi: 10.1088/0004-637X/730/1/28
- Pope et al. (2008) Pope, A., Chary, R.-R., Alexander, D. M., et al. 2008, ApJ, 675, 1171, doi: 10.1086/527030
- Pope et al. (2013) Pope, A., Wagg, J., Frayer, D., et al. 2013, ApJ, 772, 92, doi: 10.1088/0004-637X/772/2/92
- Pound & Wolfire (2008) Pound, M. W., & Wolfire, M. G. 2008, in Astronomical Society of the Pacific Conference Series, Vol. 394, Astronomical Data Analysis Software and Systems XVII, ed. R. W. Argyle, P. S. Bunclark, & J. R. Lewis, 654
- Privon et al. (2020) Privon, G. C., Ricci, C., Aalto, S., et al. 2020, ApJ, 893, 149, doi: 10.3847/1538-4357/ab8015
- Ricca et al. (2012) Ricca, A., Bauschlicher, Charles W., J., Boersma, C., Tielens, A. G. G. M., & Allamand ola, L. J. 2012, ApJ, 754, 75, doi: 10.1088/0004-637X/754/1/75
- Rosenberg et al. (2015) Rosenberg, M. J. F., van der Werf, P. P., Aalto, S., et al. 2015, ApJ, 801, 72, doi: 10.1088/0004-637X/801/2/72
- Saintonge et al. (2013) Saintonge, A., Lutz, D., Genzel, R., et al. 2013, ApJ, 778, 2, doi: 10.1088/0004-637X/778/1/2
- Salgado et al. (2016) Salgado, F., Berné, O., Adams, J. D., et al. 2016, ApJ, 830, 118, doi: 10.3847/0004-637X/830/2/118
- Sanders et al. (1988) Sanders, D. B., Soifer, B. T., Elias, J. H., et al. 1988, ApJ, 325, 74, doi: 10.1086/165983
- Sandstrom et al. (2012) Sandstrom, K. M., Bolatto, A. D., Bot, C., et al. 2012, ApJ, 744, 20, doi: 10.1088/0004-637X/744/1/20
- Schutte et al. (1993) Schutte, W. A., Tielens, A. G. G. M., & Allamandola, L. J. 1993, ApJ, 415, 397, doi: 10.1086/173173
- Scoville et al. (2017a) Scoville, N., Murchikova, L., Walter, F., et al. 2017a, ApJ, 836, 66, doi: 10.3847/1538-4357/836/1/66
- Scoville et al. (2017b) Scoville, N., Lee, N., Vanden Bout, P., et al. 2017b, ApJ, 837, 150, doi: 10.3847/1538-4357/aa61a0
- Shipley et al. (2013) Shipley, H. V., Papovich, C., Rieke, G. H., et al. 2013, ApJ, 769, 75, doi: 10.1088/0004-637X/769/1/75
- Smith et al. (2007) Smith, J. D. T., Draine, B. T., Dale, D. A., et al. 2007, ApJ, 656, 770, doi: 10.1086/510549
- Smith et al. (2017) Smith, J. D. T., Croxall, K., Draine, B., et al. 2017, ApJ, 834, 5, doi: 10.3847/1538-4357/834/1/5
- Stacey et al. (2010) Stacey, G. J., Hailey-Dunsheath, S., Ferkinhoff, C., et al. 2010, ApJ, 724, 957, doi: 10.1088/0004-637X/724/2/957
- Stierwalt et al. (2013) Stierwalt, S., Armus, L., Surace, J. A., et al. 2013, ApJS, 206, 1, doi: 10.1088/0067-0049/206/1/1
- Stierwalt et al. (2014) Stierwalt, S., Armus, L., Charmandaris, V., et al. 2014, ApJ, 790, 124, doi: 10.1088/0004-637X/790/2/124
- Sturm et al. (2000) Sturm, E., Lutz, D., Tran, D., et al. 2000, A&A, 358, 481. https://arxiv.org/abs/astro-ph/0002195
- Sutter et al. (2019) Sutter, J., Dale, D. A., Croxall, K. V., et al. 2019, ApJ, 886, 60, doi: 10.3847/1538-4357/ab4da5
- Tacconi et al. (2008) Tacconi, L. J., Genzel, R., Smail, I., et al. 2008, ApJ, 680, 246, doi: 10.1086/587168
- Tacconi et al. (2010) Tacconi, L. J., Genzel, R., Neri, R., et al. 2010, Nature, 463, 781, doi: 10.1038/nature08773
- Tacconi et al. (2013) Tacconi, L. J., Neri, R., Genzel, R., et al. 2013, ApJ, 768, 74, doi: 10.1088/0004-637X/768/1/74
- Tacconi et al. (2018) Tacconi, L. J., Genzel, R., Saintonge, A., et al. 2018, The Astrophysical Journal, 853, 179, doi: 10.3847/1538-4357/aaa4b4
- Tielens (2008) Tielens, A. G. G. M. 2008, ARA&A, 46, 289, doi: 10.1146/annurev.astro.46.060407.145211
- Tielens & Hollenbach (1985) Tielens, A. G. G. M., & Hollenbach, D. 1985, ApJ, 291, 747, doi: 10.1086/163112
- van der Wel et al. (2014) van der Wel, A., Franx, M., van Dokkum, P. G., et al. 2014, ApJ, 788, 28, doi: 10.1088/0004-637X/788/1/28
- Voit (1992) Voit, G. M. 1992, MNRAS, 258, 841, doi: 10.1093/mnras/258.4.841
- Wolfire et al. (2003) Wolfire, M. G., McKee, C. F., Hollenbach, D., & Tielens, A. G. G. M. 2003, ApJ, 587, 278, doi: 10.1086/368016
- Wolfire et al. (1990) Wolfire, M. G., Tielens, A. G. G. M., & Hollenbach, D. 1990, ApJ, 358, 116, doi: 10.1086/168966
- Wu et al. (2010) Wu, Y., Helou, G., Armus, L., et al. 2010, ApJ, 723, 895, doi: 10.1088/0004-637X/723/1/895
- Zhao et al. (2013) Zhao, Y., Lu, N., Xu, C. K., et al. 2013, ApJ, 765, L13, doi: 10.1088/2041-8205/765/1/L13