CovTANet: A Hybrid Tri-level Attention Based Network for Lesion Segmentation, Diagnosis, and Severity Prediction of COVID-19 Chest CT Scans
Abstract
Rapid and precise diagnosis of COVID-19 is one of the major challenges faced by the global community to control the spread of this overgrowing pandemic. In this paper, a hybrid neural network is proposed, named CovTANet, to provide an end-to-end clinical diagnostic tool for early diagnosis, lesion segmentation, and severity prediction of COVID-19 utilizing chest computer tomography (CT) scans. A multi-phase optimization strategy is introduced for solving the challenges of complicated diagnosis at a very early stage of infection, where an efficient lesion segmentation network is optimized initially which is later integrated into a joint optimization framework for the diagnosis and severity prediction tasks providing feature enhancement of the infected regions. Moreover, for overcoming the challenges with diffused, blurred, and varying shaped edges of COVID lesions with novel and diverse characteristics, a novel segmentation network is introduced, namely Tri-level Attention-based Segmentation Network (TA-SegNet). This network has significantly reduced semantic gaps in subsequent encoding decoding stages, with immense parallelization of multi-scale features for faster convergence providing considerable performance improvement over traditional networks. Furthermore, a novel tri-level attention mechanism has been introduced, which is repeatedly utilized over the network, combining channel, spatial, and pixel attention schemes for faster and efficient generalization of contextual information embedded in the feature map through feature re-calibration and enhancement operations. Outstanding performances have been achieved in all three-tasks through extensive experimentation on a large publicly available dataset containing 1110 chest CT-volumes that signifies the effectiveness of the proposed scheme at the current stage of the pandemic.
Index Terms:
COVID-19, computer tomography (CT) scan, computer-aided diagnosis, lesion segmentation, neural network.I Introduction
Since the onset of the coronavirus disease (COVID-19) in December-2019, it has severely jeopardized the global healthcare systems for its extremely infectious nature. With its extreme infectious nature and high mortality rate, it has been declared as one of the most devastating global pandemics of history [1]. Although reverse transcription-polymerase chain reaction (RT-PCR) assay is considered as the gold standard for COVID-19 diagnosis, the shortage of this expensive test-kit coupled with the elongated testing protocol and relatively low sensitivity (60-70%) calls for an alternative diagnostic tool that is adequately efficient to perform prompt mass-screening [2]. For providing immediate and proper clinical support to the critical patients, severity quantification of the infection is also a dire need. With numerous success stories in the field of clinical diagnostics and biomedical engineering, artificial intelligent (AI) assisted diagnostic paradigms can be embraced as a medium of paramount importance to conduct automated diagnosis and severity quantification of COVID-19 with substantial accuracy and efficiency [3, 4]. Several deep learning-based frameworks have been explored in recent times deploying automated screening of chest radiography and computer tomography as one of the vital sources of information for COVID diagnosis [5, 6, 7, 8, 9]. However, owing to the relatively higher sensitivity and the provision of enhanced infection visualization in the three-dimensional representation, CT-based screening is a more viable alternative than the X-ray counterparts. With a large number of asymptomatic patients, early detection of COVID-19 through imaging modalities is still a stupendously challenging task due to significantly smaller, scattered, and obscure regions of infections that are difficult to distinguish [10]. These diverse heterogeneous characteristics of infections among different subjects also make the severity prediction to be an extremely difficult objective to achieve [11]. The scarcity of considerably large reliable datasets further increases the complexity of the endeavor. Recent studies mostly opt for solving this daunting task partially where infection segmentation, diagnosis, or severity analysis have separately attempted [12, 13, 14]. Such methods lack the complete integration of the objectives for providing a robust clinical tool.
Deep learning-based approaches have been widely incorporated in diverse medical imaging applications for their unprecedented performance even in challenging conditions. Several state-of-the-art networks have been investigated for the segmentation of COVID lesions from chest CTs including FCN [15], U-Net [16], UNet++ [17], and ResUNet [6]. However, precise segmentation of COVID lesions has still been a major challenge due to the patchy, diffused, and scattered distributions of the infections involving ground-glass opacities, pleural effusions, and consolidations [18]. Traditional U-Net and its variants with similar encoder-decoder architectures suffer from increased semantic gaps between the corresponding scale of feature maps of encoder-decoder modules while experiencing vanishing gradient problems with several optimization issues due to the sequential optimization strategy of multi-scale features. Moreover, the contextual information generated at different scales of representation does not properly converge into the final reconstruction of the segmentation mask that results in sub-optimal performances. Lately, numerous attention-gated mechanisms have been paired up with the traditional segmentation frameworks and demonstrated highly promising performance in terms of gathering more contextual information through redistribution of the feature space [19, 12].
In this paper, CovTANet, an end-to-end hybrid neural network is proposed, that is capable of performing precise segmentation of COVID lesions along with accurate diagnosis and severity predictions. The intricate network of the proposed scheme emerges as an effective solution by overcoming the limitations of the traditional approaches. The major contributions of this work can be summarized as follows:
-
1.
A novel tri-level attention guiding mechanism is proposed combining channel, spatial and pixel domains for feature recalibration and better generalization.
-
2.
A tri-level attention based segmentation network (TA-SegNet) network is proposed for precise segmentation of COVID lesions integrating the triple attention mechanisms with parallel multi-scale feature optimization and fusion.
-
3.
A multi-phase optimization scheme is introduced by effectively integrating the initially optimized TA-SegNet with the joint diagnosis and severity prediction framework.
-
4.
A system of networks is proposed for efficient processing of CT-volumes to integrate all three objectives for improving performance in challenging conditions.
-
5.
Extensive experimentations have been carried out over a large number of subjects with diverse levels and characteristics of infections.
II Methodology
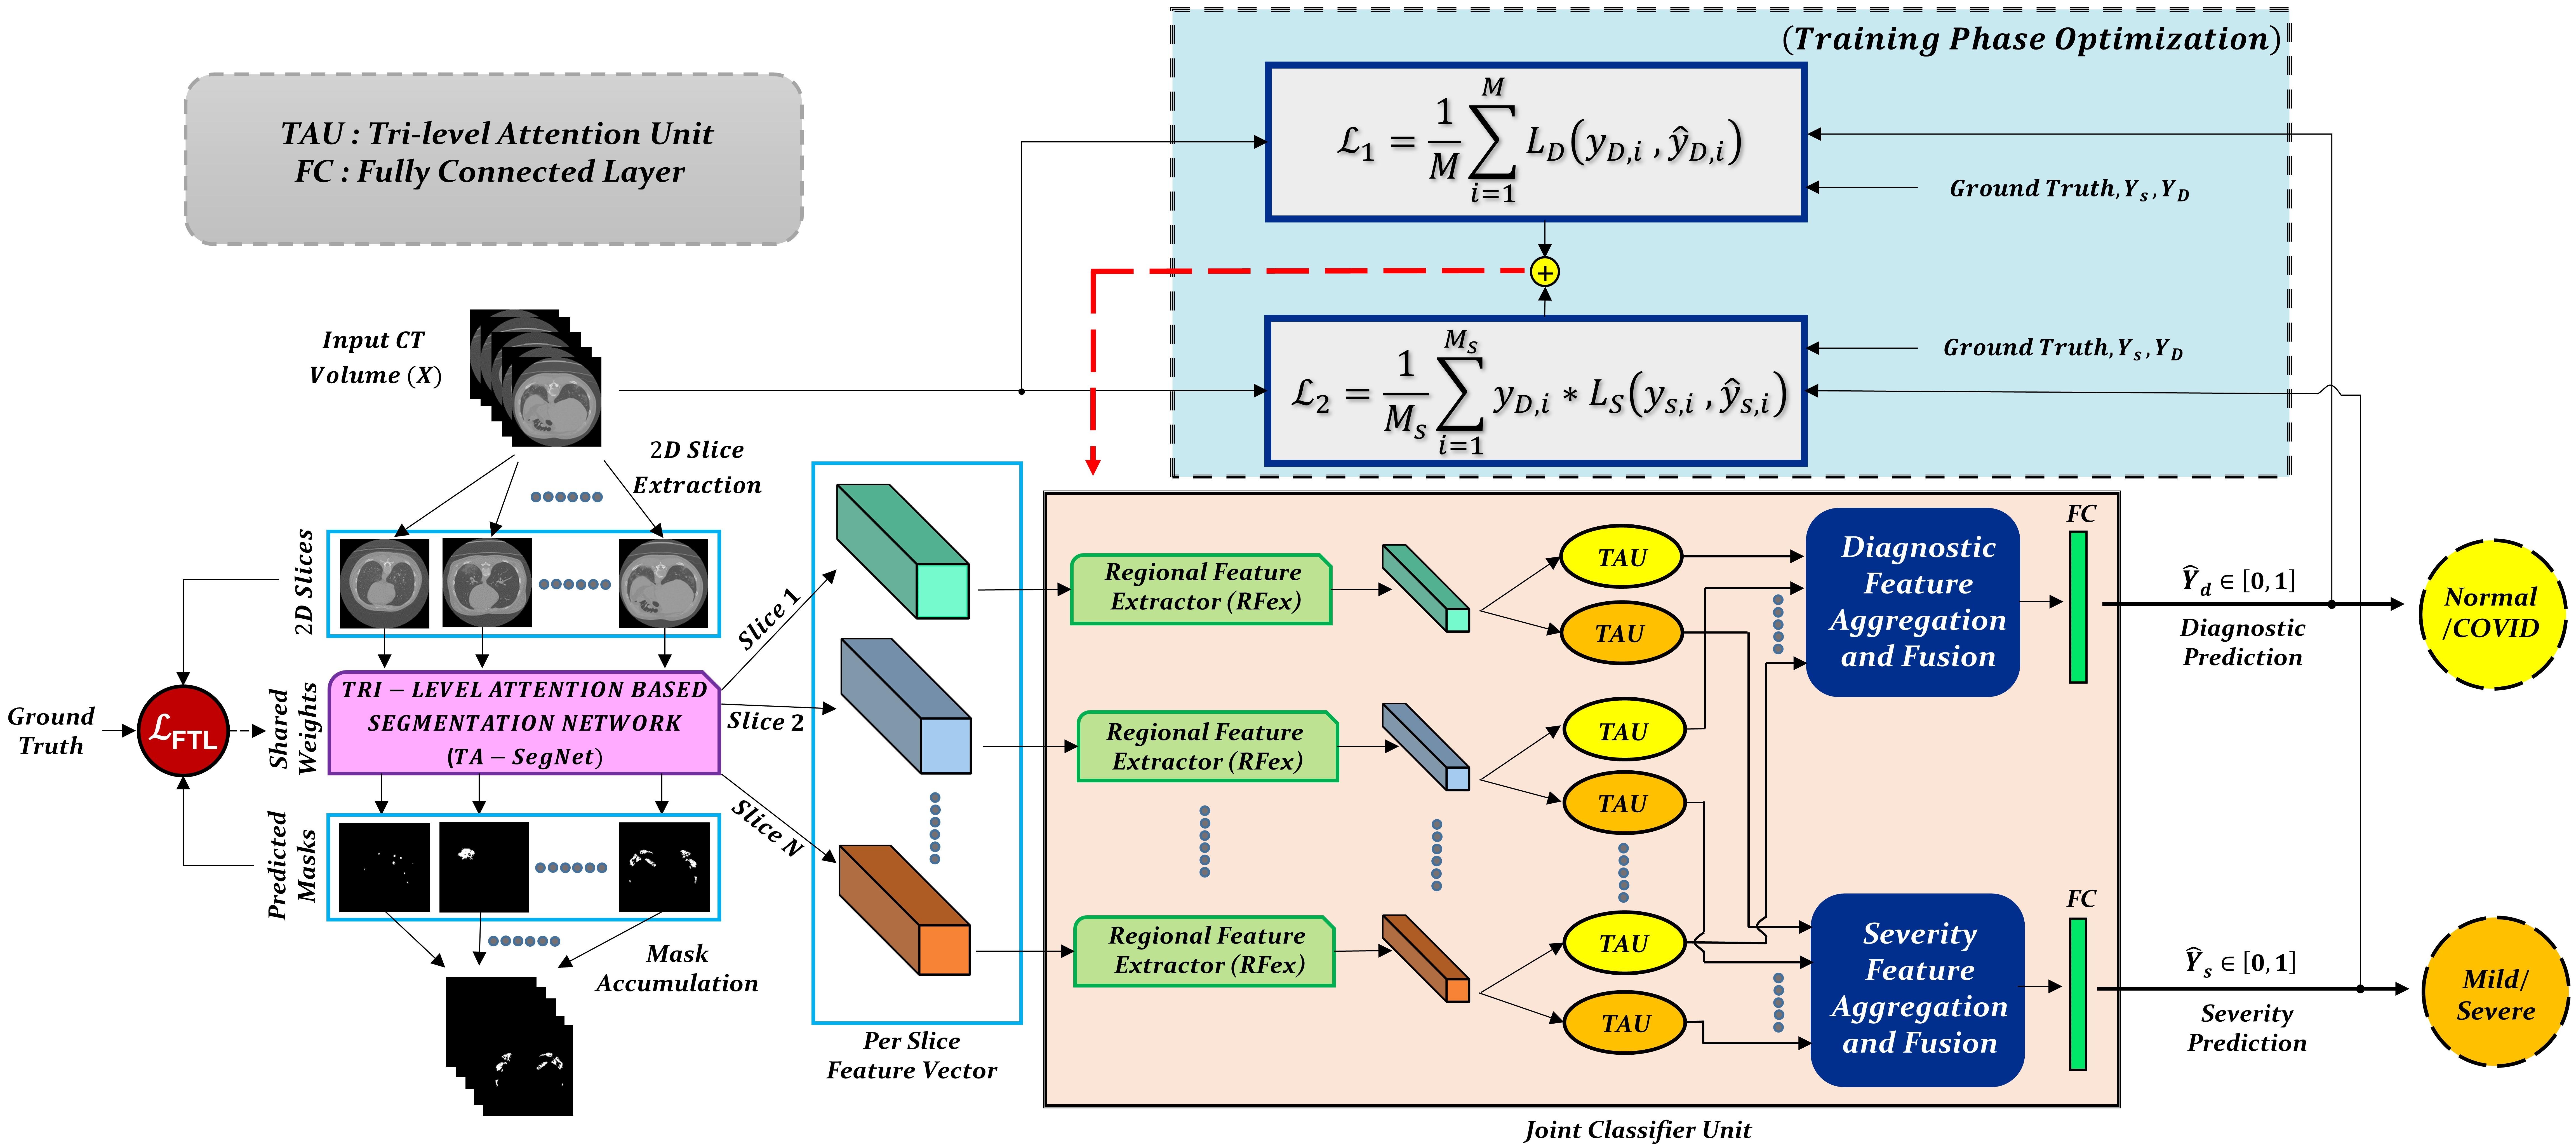
The proposed CovTANet network is developed in a modular way focusing on diverse clinical perspectives including precise COVID diagnosis, automated lesion segmentation, and effective severity prediction. The whole scheme is represented in Fig. 1. Here, a hybrid neural network (CovTANet) is introduced for segmenting COVID lesions from CT-slices as well as for providing effective features of the region-of-lesions which are later integrated for the precise diagnosis and severity prediction tasks. The complete optimization process is divided into two sequential stages for efficient processing. Firstly, a neural network, named as Tri-level Attention-based Segmentation Network (TA-SegNet), is designed and optimized for slicewise lesion segmentation from a particular CT-volume. A tri-level attention gating mechanism is introduced in this network with multifarious architectural renovations to overcome the limitations of the traditional Unet network (Section II-B), which gradually accumulates effective features for precise segmentation of COVID lesions. Because of the pertaining complicacy with blurred, diffused, and scattered patterns of COVID lesions, it is quite obvious that direct utilization of the final segmented portions for diagnosis may result in loss of information due to some false positive estimations. The proposed CovTANet aims to resolve this issue by extracting effective features regarding the regions-of-infection utilizing the initially optimized TA-SegNet as it is optimized for precisely segmenting COVID lesions with diverse levels, types, and characteristics. Therefore, slicewise effective features are extracted utilizing the optimized TA-SegNet network and deployed into the second phase of training for the joint optimization of diagnosis and severity prediction tasks. Additionally, separate regional feature extractors are employed for generating more generalized forms of the slicewise feature vectors from different lung regions. Subsequently, these generalized feature representations of CT-slices are guided into separate volumetric feature aggregation and fusion schemes through the proposed tri-level attention mechanism for extracting the significant diagnostic features as well as severity based features. The diagnostic path is supposed to extract the more generalized representation of infections while the severity path is more concerned with the levels of infections. Both the diagnostic and severity predictions are optimized through a joint optimization strategy with an amalgamated loss function. The whole training and optimization process is summarized in Algorithm 1. In addition, the optimization flow of the complete CovTANet network is shown in Fig. 2. Several architectural submodules of the CovTANet are discussed in detail in the following sections.
II-A Proposed Tri-level Attention Scheme
Attention mechanism, first proposed in [20] for enhanced contextual information extraction in natural language processing, has been adopted in numerous fields including medical image processing [21, 22]. This mechanism assists faster convergence with considerable performance improvement by eliminating the redundant parts while putting more attention on the region-of-interests through the generalization of the predominant contextual information. In this work, we have proposed a novel self-supervised attention mechanism combining three levels of abstraction for improved generalization of the relevant contextual features, i.e. channel-level, spatial-level, and pixel-level. The channel attention (CA) mechanism operates on a broader perspective to emphasize the corresponding channels containing more information, while the spatial attention (SA) mechanism concentrates more on the local spatial regions containing region of interests, and finally, the pixel attention (PA) mechanism operates on the lowest level to analyze the feature relevance of each pixel. However, relying only on the higher level of attention causes loss of information while relying on lower/local levels may weaken the effect of generalization. Hence, to reach the optimum point of generalization and re-calibration of feature space, we have introduced a tri-level attention unit (TAU) mechanism that integrates the advantages of all three levels of attention. This TAU unit module is repeatedly used all over the CovTANet network (Fig. 1) to improve the feature relevance through feature recalibration.

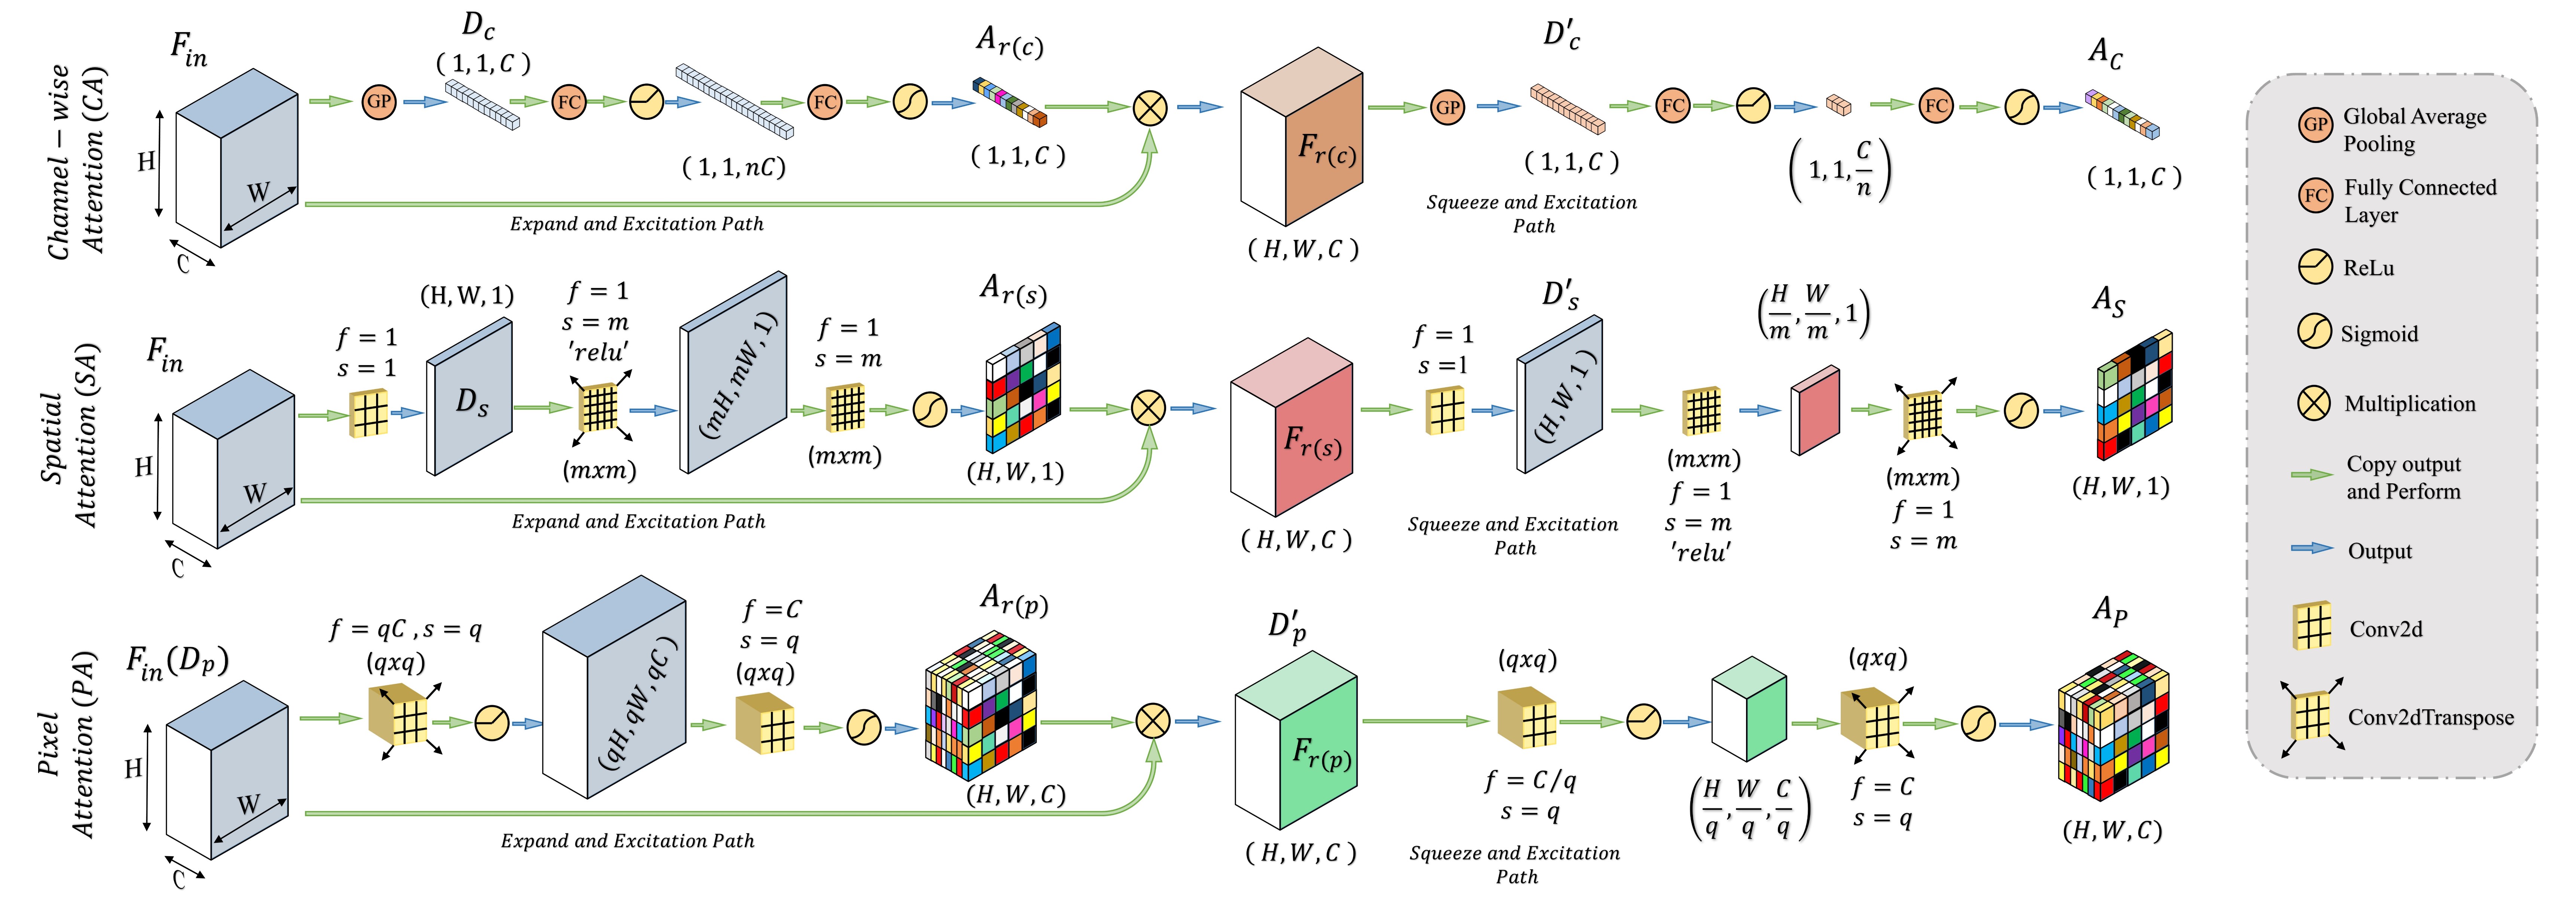
In general, the proposed attention mechanisms operating at different levels of abstraction (shown in Fig. 3) can be divided into two phases: a feature re-calibration phase followed by a feature generalization phase. In each phase, a statistical description of the intended level of generalization is extracted, which is processed later for generating the corresponding attention map. Let, be the input feature map where represent the height, width, and channels of the feature map, respectively. Here, channel description, is generated by taking the global averages of the pixels of particular channels, while the spatial description, is created by convolutional filtering, and the input feature map, represents the pixel description, itself.
Afterwards, the feature re-calibration phase is carried out by projecting the descriptor vector to a higher dimensional space followed by the restoration process of the original dimension to generate the re-calibration attention map , which is utilized to obtain the re-calibrated feature map . This process assists in the redistribution of the feature space in the subsequent feature generalization phase for better generalization of features through sharpening the effective representative features. It can be represented as:
| (1) | ||||
| (2) |
where represents the element-wise multiplication with the required dimensional broadcasting operation, denotes the statistical descriptor extractor, represents the dimension expansion filtering, represents the dimension restoration filtering, and represents the sigmoid activation. For the channel-attention mechanism, and are realized by fully connected layers, while for spatial and pixel attention, convolutional filters are employed.
Subsequently, the feature generalization operation is carried out through the squeeze and excitation operation on the re-calibrated feature space, to generate the effective attention map . In this phase, the extracted feature descriptor, is projected into a lower-dimensional space to extract the most effective representational features and thereafter, reconstructed back to the original dimension. Such sequential dimension reduction and reconstruction operations provide an opportunity to emphasize the generalized features while reducing the redundant features. Hence, the generated attention map provides the opportunity to reduce the effect of redundant features by providing more attention to the effective features, and it can be represented as:
| (3) |
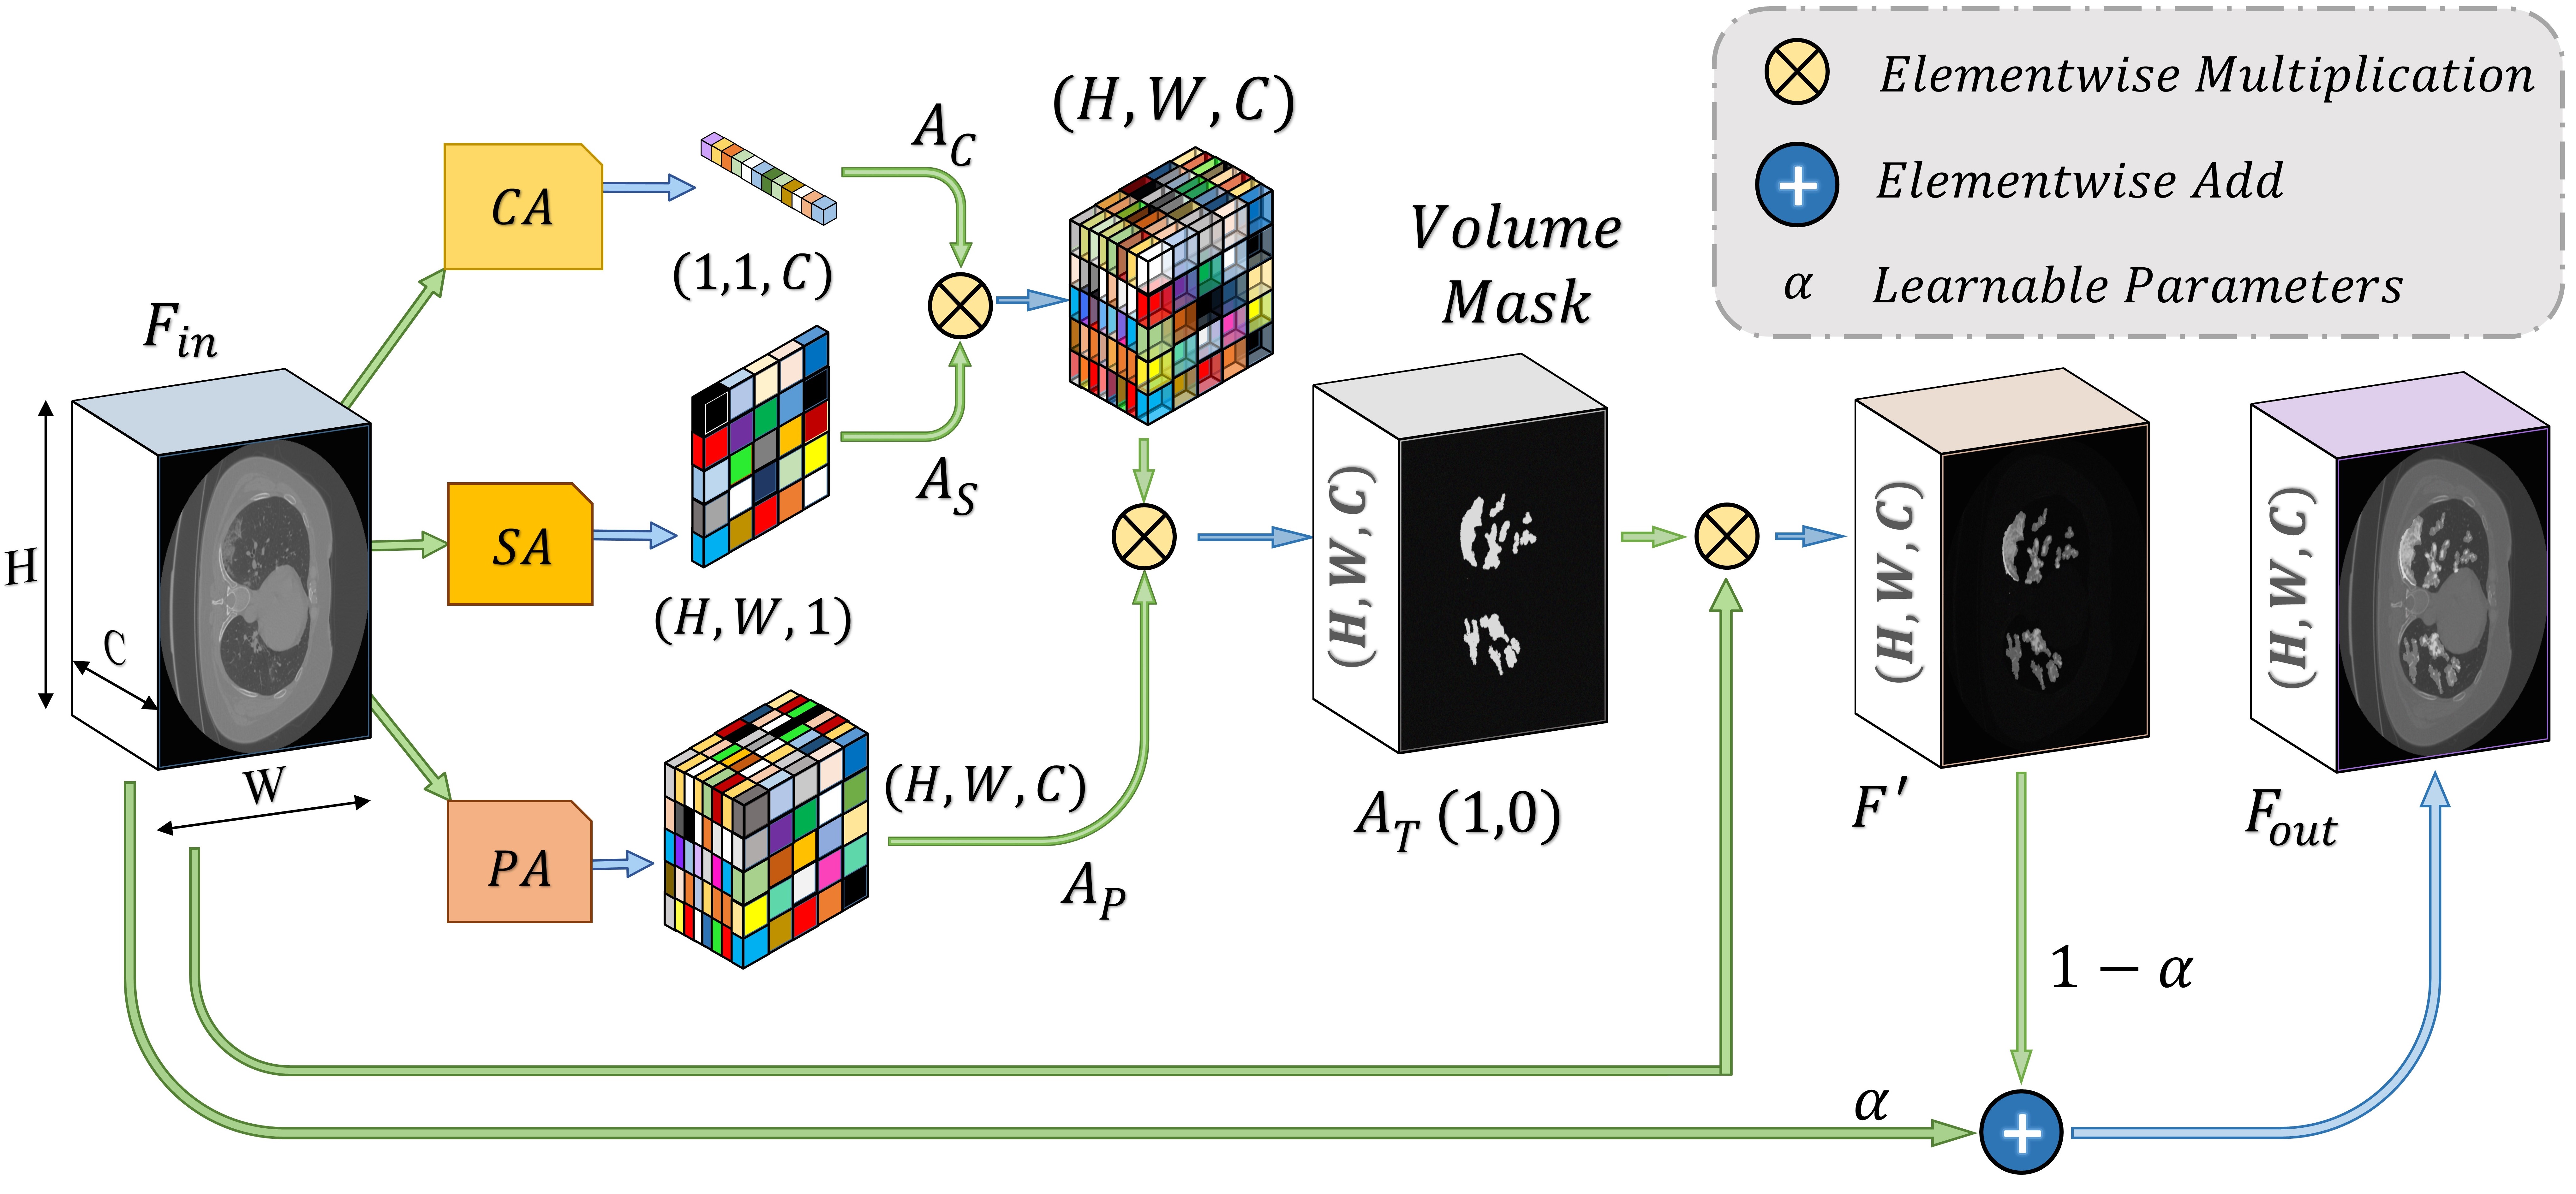
where represents the corresponding squeeze and restoration filtering, respectively, while represents the statistical descriptor extractor. Therefore, three levels of attention maps are generated, i.e. a channel attention map , a spatial attention map , and a pixel attention map . The tri-level attention unit (TAU), represented in Fig. 4, generates the effective volumetric, triple attention mask integrating all three maps, which is given by:
| (4) |
Later, this accumulated attention mask is used to transform the input feature map to for enhancing the region-of-interest, and finally the output feature map, is generated through the weighted addition of the input and transformed feature maps, and these can be summarized as:
| (5) | |||
| (6) |
where T() represents the proposed Tri-level attention mechanism, is a learnable parameter that is optimized through the back-propagation algorithm along with other parameters.
II-B Proposed Tri-level Attention-based Segmentation Network (TA-SegNet)
The proposed TA-SegNet network is deployed for segmenting the infected lesions as well as for extracting features for the following joint diagnosis and segmentation tasks (as shown in Fig. 1). For better segmentation, this network introduces several modifications over traditional networks which are mostly based on Fully convolutional networks (FCN) and Unet networks generally.
FCN and Unet are the most widely explored networks for medical image segmentation. In FCN, a single stage of encoder module is employed to generate different scales of encoded feature maps from the input image, and afterwards, the segmentation mask is reconstructed through joint processing of multi-scale encoded features. Whereas, the Unet network considerably improved the performance by introducing a decoder module followed by the encoder module to sequentially gather the contextual information of the segmentation mask. Moreover, to recover the loss of information through downscaling, each level of encoder and decoder modules are directly connected through skip connections in Unet. Despite that, a semantic gap is generated through such direct skip connections between the corresponding scale of feature maps of the encoder and decoder modules, which hinders proper optimization. For the deeper implementation of the encoder/decoder module, this network further suffers from vanishing gradient problem since different scales of feature maps are optimized sequentially.
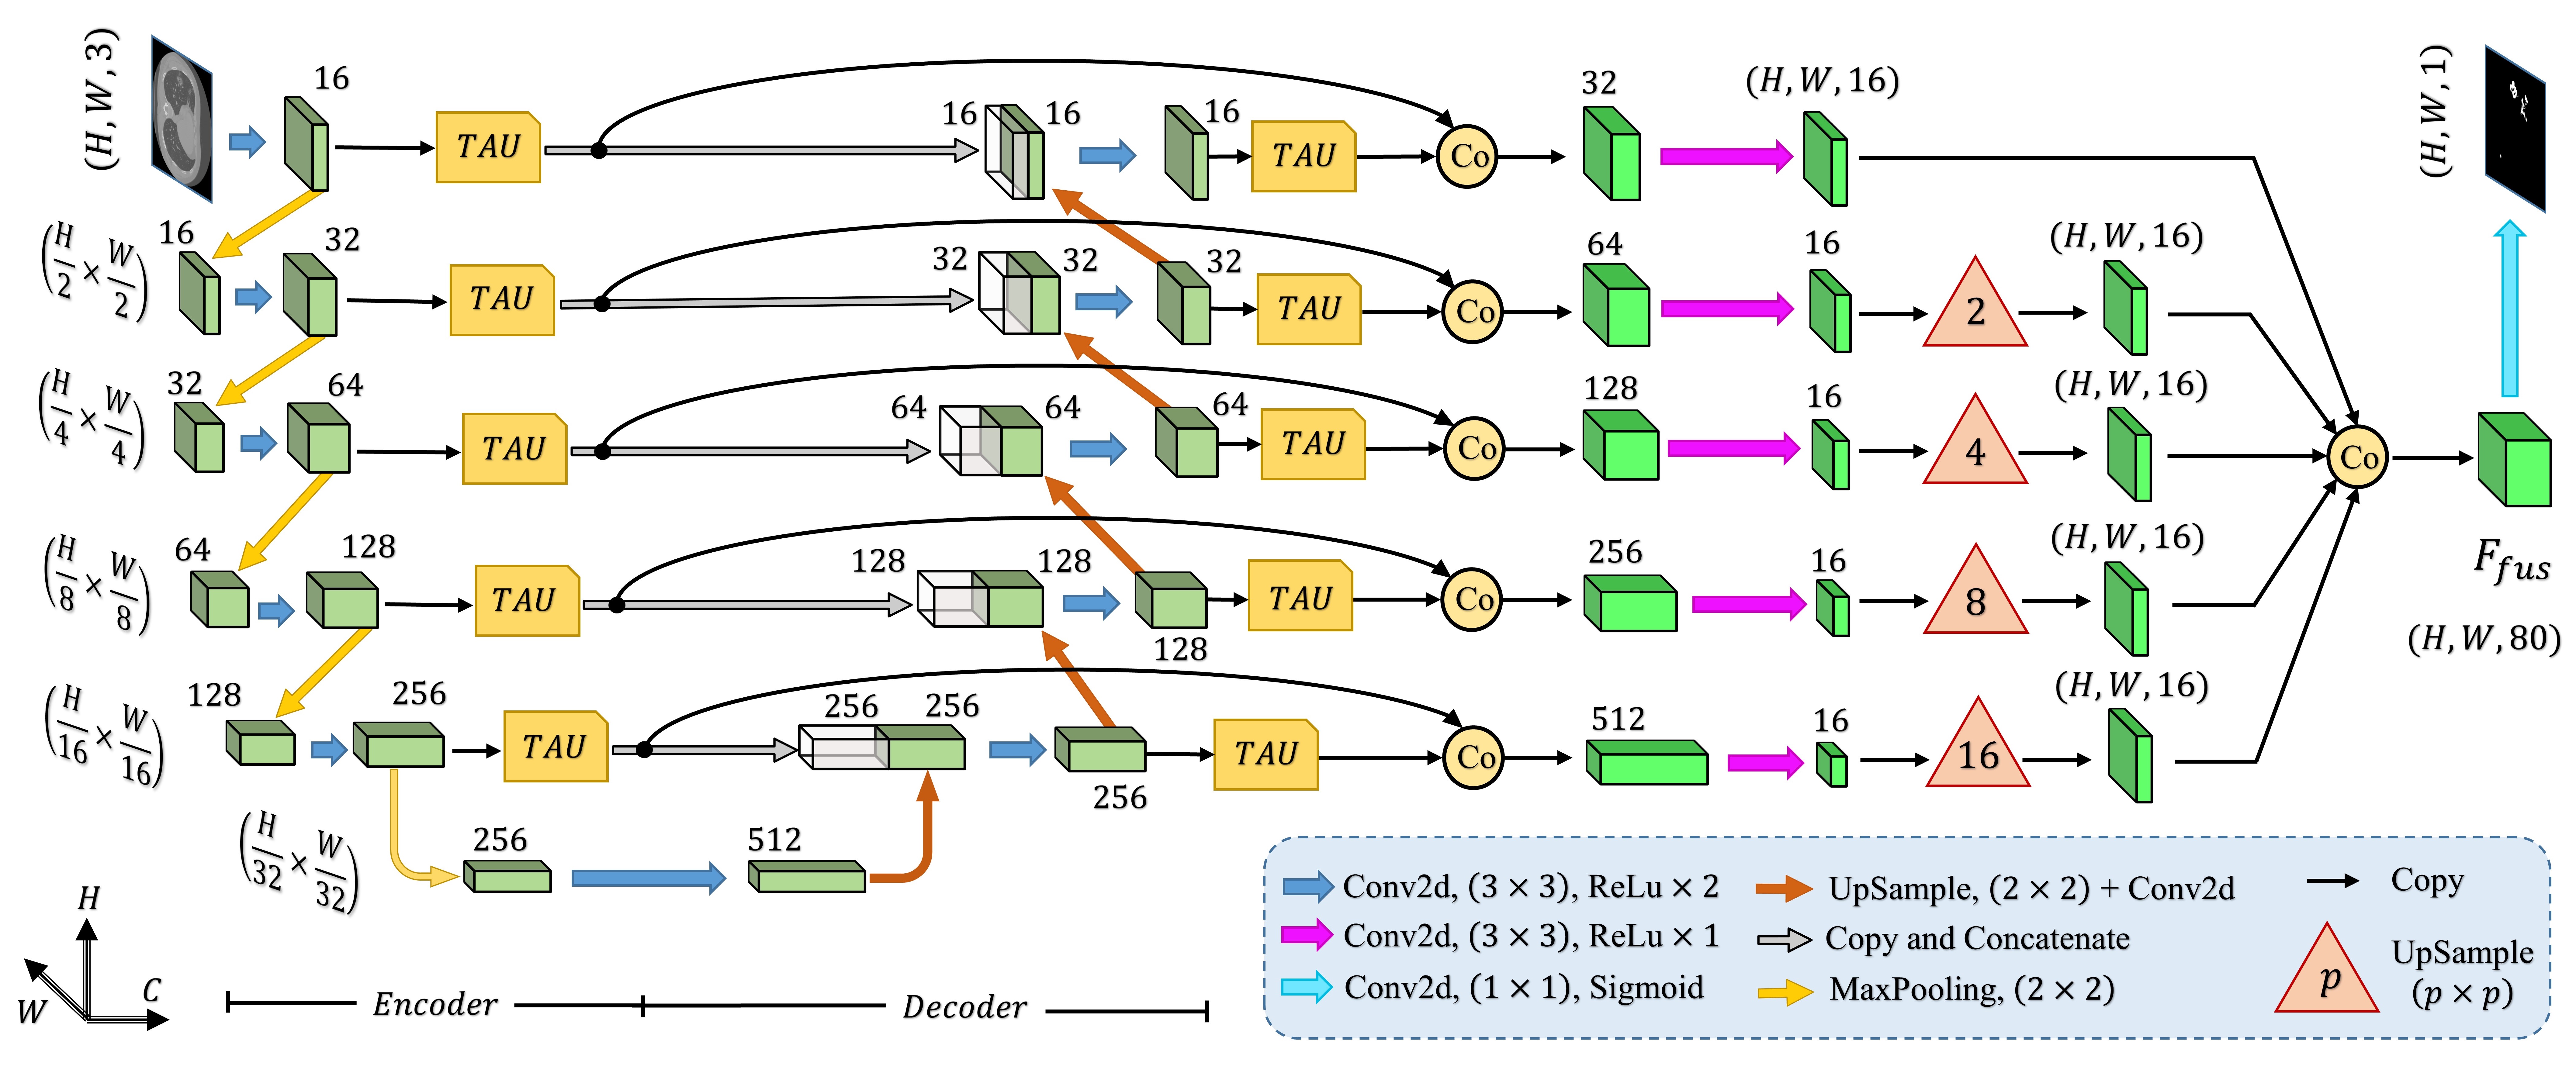
The proposed TA-SegNet network (shown in Fig. 5) integrates the advantages of both Unet and FCN by introducing an encoder-decoder based network with reduced semantic gaps along with the opportunity of parallel optimization of multi-scale features. Firstly, the input images pass through sequential encoding stages with convolutional filtering followed by sequential decoding operations similar to the Unet. Moreover, the output feature map generated from each layer of the encoder unit is connected to the corresponding decoder layer through a Tri-level Attention Unit (TAU) mechanism for better reconstruction in the decoder unit. For further generalization and refinement of contextual features, all scales of decoded feature representations also pass through another stage of the attention mechanism. Afterwards, for introducing joint optimization of multi-scale features, the attention gated, refined feature maps generated at different stages of encoder and decoder modules are accumulated through a series of operational stages. Initially, sequential concatenation of corresponding encoder-decoder layer outputs (after attention-gating) are carried out. Following that, channel downscaling operations through convolutional filtering and bi-linear spatial upsampling operations are employed to produce feature vectors with uniform dimensions. Afterwards, these uniform feature vectors are accumulated through channel-wise concatenation to generate the fusion vector , and it can be represented as:
| (7) |
where represents feature concatenation, stand for level of feature representations from total levels of the encoder, and decoder modules, respectively, represents the tri-level attention unit operation, and represents the multi-scale feature fusion operation.
Afterwards, the final convolutional filtering is operated on the fusion feature map () to produce the output segmentation mask. Moreover, to introduce transfer-learning in this TA-SegNet similar to other networks, the encoder module can be replaced by different pre-trained backbone networks for better optimization. Hence, the proposed TA-SegNet facilitates faster convergence through parallel optimization of the multi-scale features while effectively extracting the region-of-interest from each scale of representation with the novel tri-level attention gating mechanism for providing the optimum performance even in the most challenging conditions.
II-C Proposed Regional Feature Extractor Module
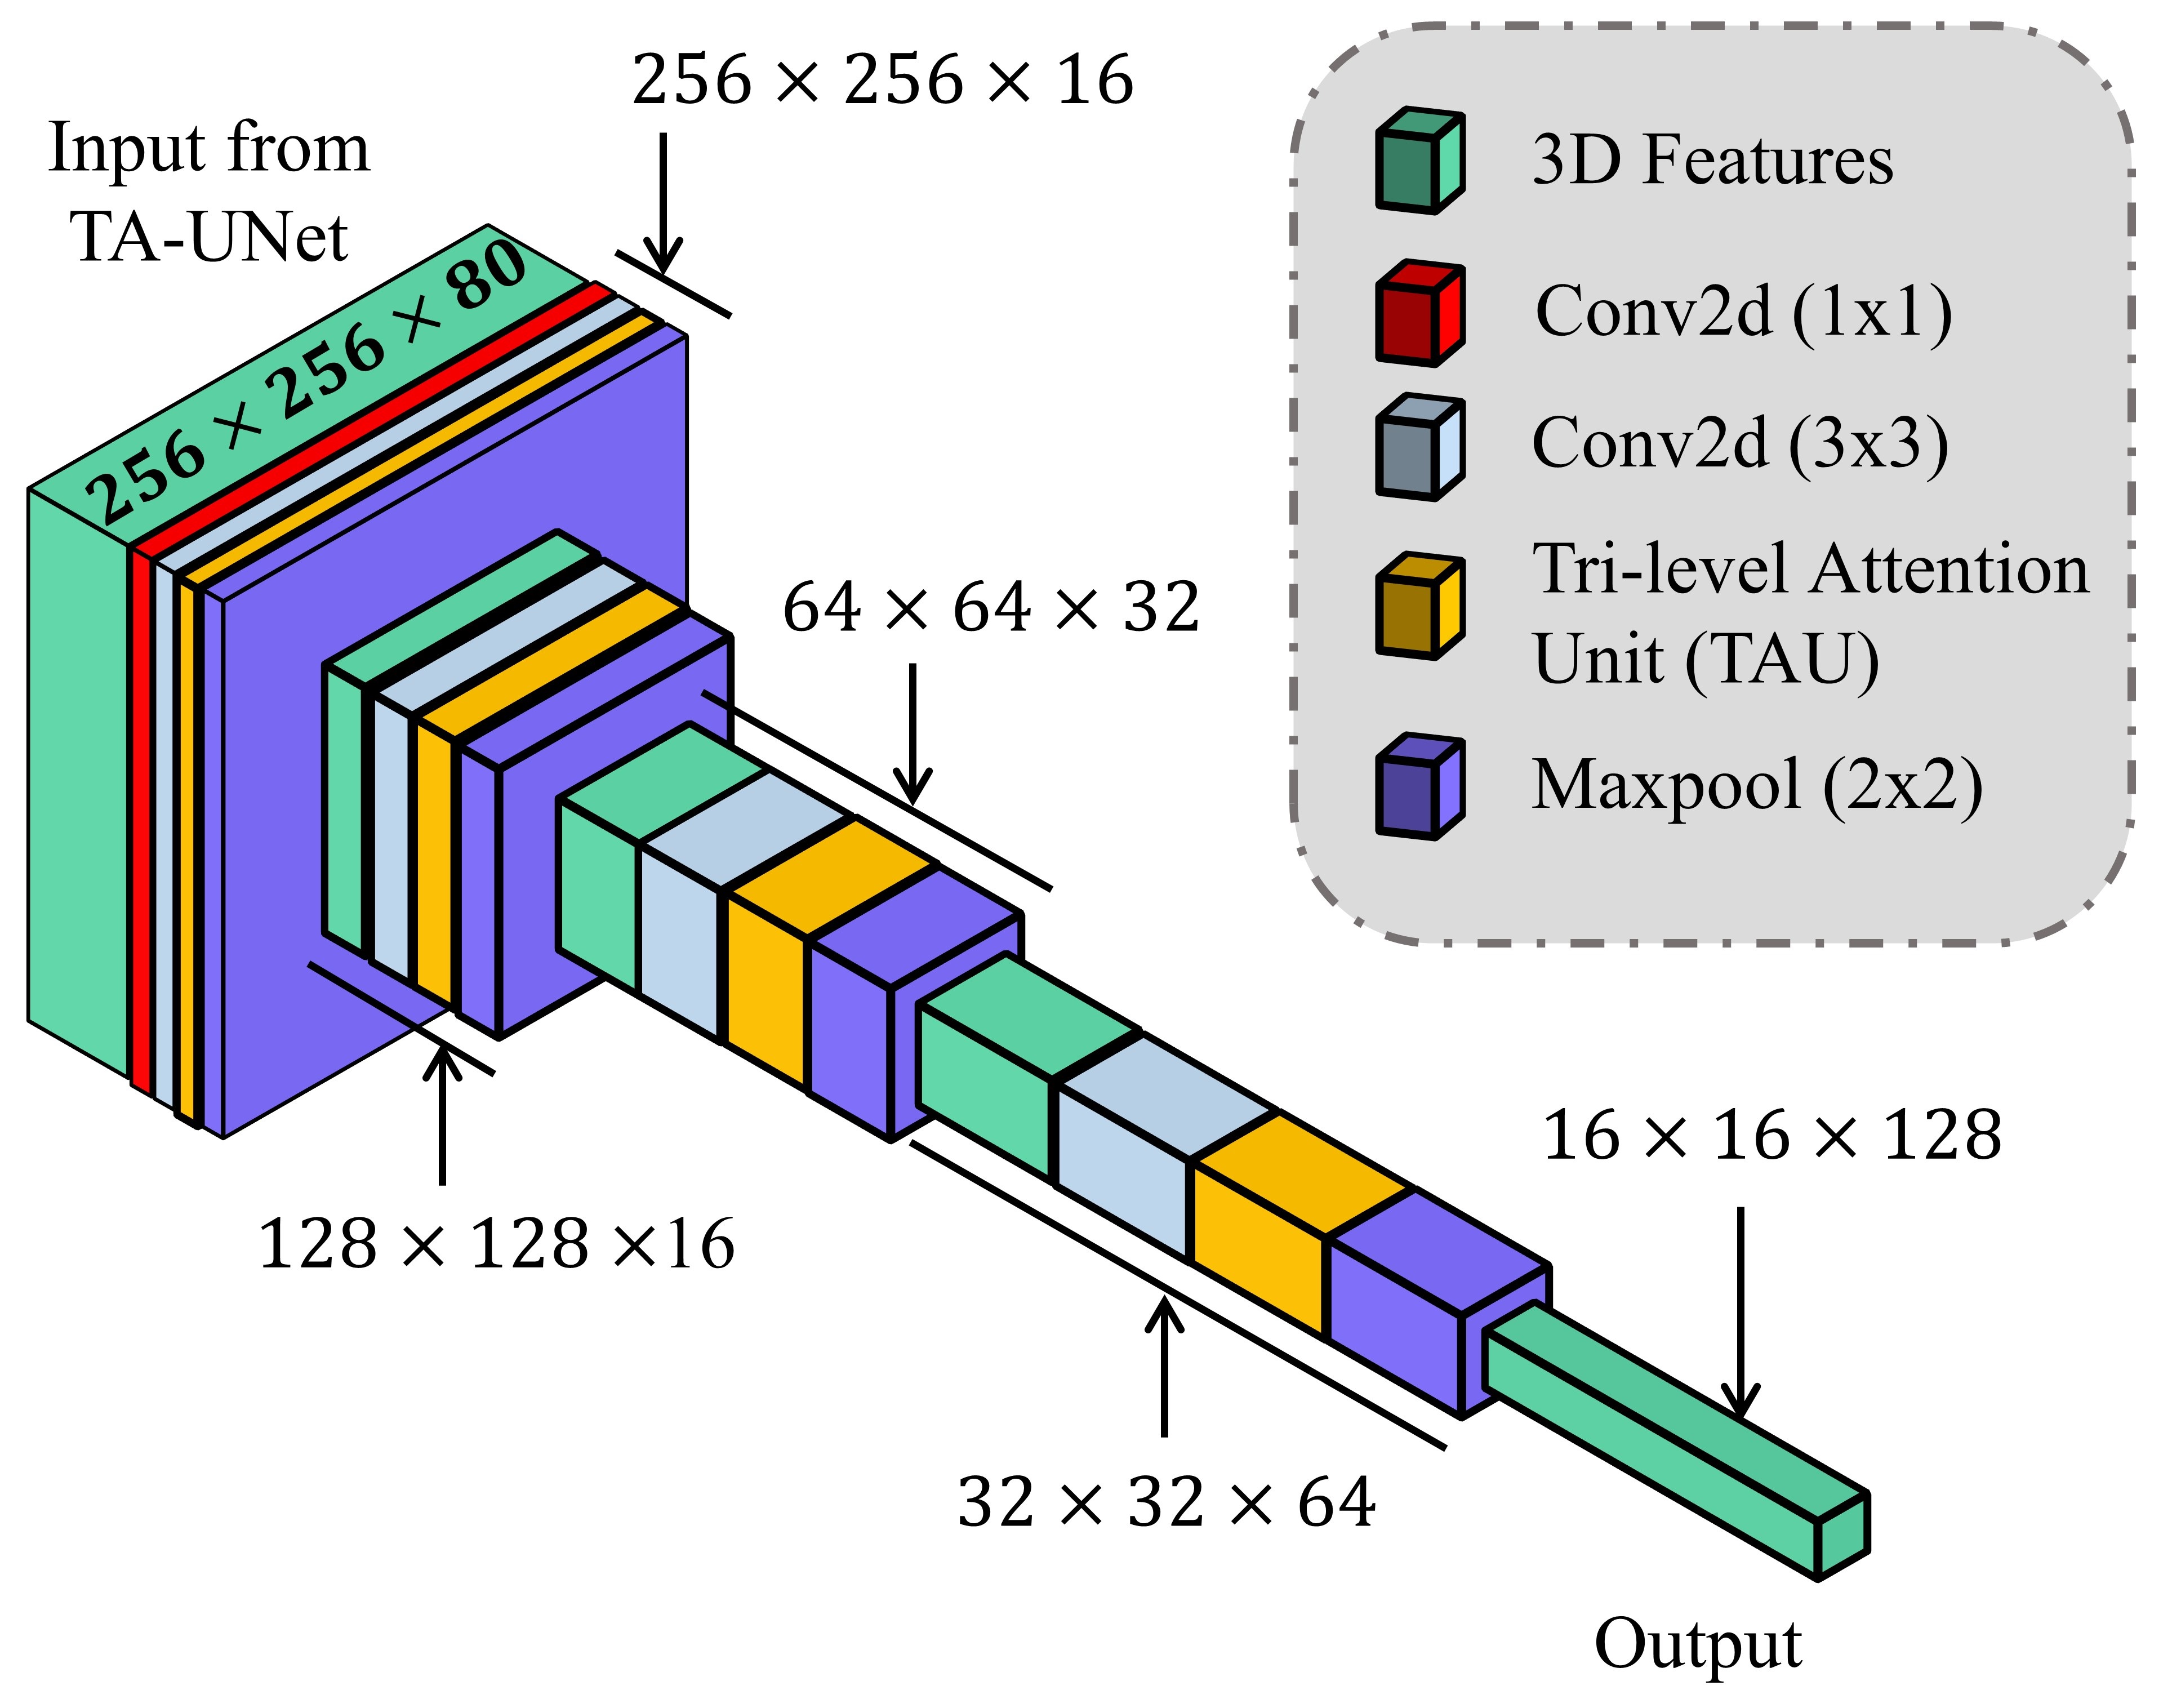
Though the proposed TA-SegNet is optimized for providing precise segmentation performances on challenging COVID lesion extraction, some loss of information is expected to occur especially at the early stages of infection when it is difficult to extract relatively smaller and scattered infection patches. To overcome the limitation, the final fusion vector generated at TA-SegNet is incorporated into further processing, instead of the segmented lesion, as it contains the effective feature representations of the region-of-infections. For further emphasizing the COVID lesion features, a regional feature extractor module () is also proposed that separately operates on each of the slice-wise fusion vector and thus generates the effective regional feature representation . From Fig. 1, it is to be noted that such regional feature extractor module separately operates on the extracted feature vectors of each CT-slice and hence, enhance the effective regional features regarding the infection. The architectural details of this module are presented in Fig. 6. It consists of several stages of convolutional filtering while incorporating the Tri-level Attention Unit at each stage. These attention units operated at different stages are supposed to execute different roles. As we go deeper into this module, more generalized feature representations are created through subsequent pooling operations where the information is made more sparsely distributed among increased channels. Hence, the attention units at earlier stages enhance the more detailed, localized feature representations, while at deeper stages the attention units learn to expedite the generalization process. Therefore, the regional feature extractor module effectively incorporates the proposed tri-level attention mechanism to extract the most generalized representative features of infections from different regions of the respective CT volume.
II-D Volumetric Feature Aggregation and Fusion Module
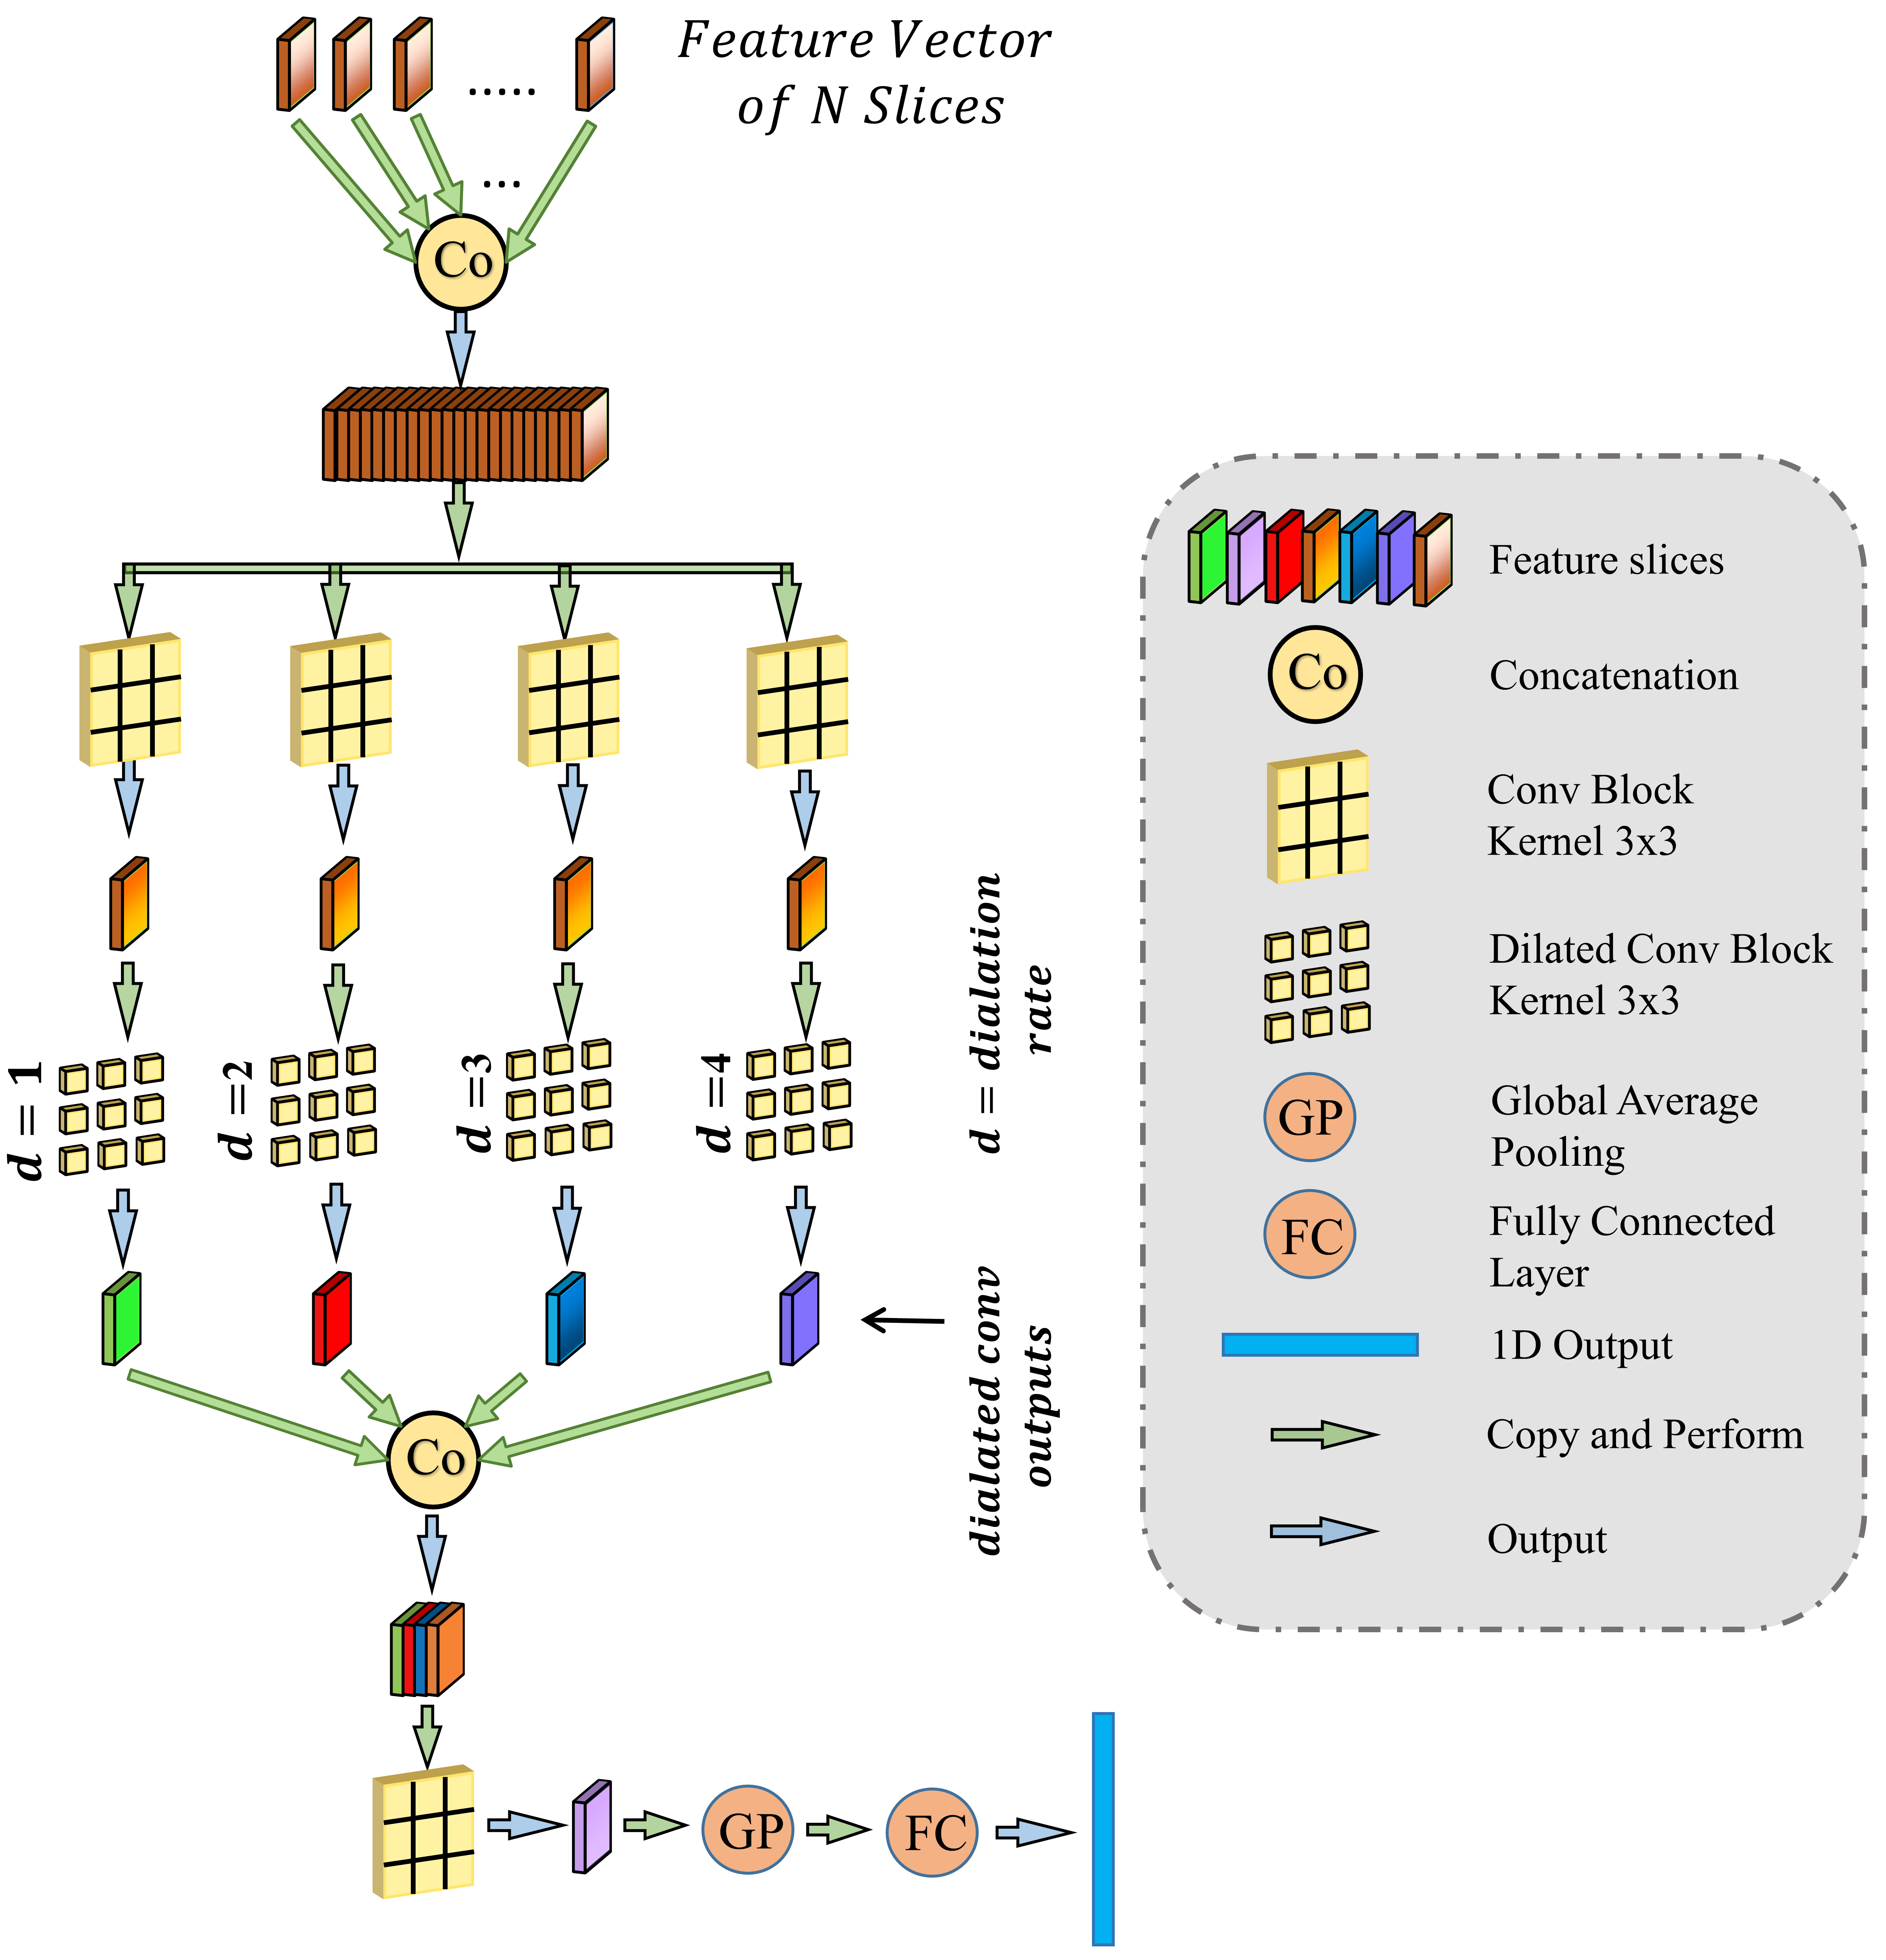
The regional features extracted from each slice of the CT volume are supposed to optimize through a joint processing module for the final diagnosis and severity prediction. This module accumulates the volumetric features from the generalized feature representation of each slice as well as introduces an effective fusion of features to generate the corresponding representative feature vector of the CT-volume. Moreover, this module plays an influential role in the proper selection of features especially in the early stage of infection when few of the slices contain infected lesions. To facilitate the feature selection process, the processing of severity based features and diagnostic features are isolated. In Fig. 1, separate volumetric feature aggregation and fusion modules are integrated to separately optimize the diagnostic and severity features. Though similar operational modules are employed in both of these cases, another stage of attention-gating operations is employed to guide the effective slice-wise features in these operational modules with different objectives (shown in Fig. 1). This module is schematically presented in Fig. 7. Firstly, the volumetric feature accumulation is carried out to produce the aggregated feature vector from the regional features () of all slices. Thereupon, the fusion scheme is employed utilizing dilated convolutions [23] which provides the opportunity to explore features from diverse receptive areas. Firstly, a pointwise convolution is carried out for depth reduction of the aggregated vector . Subsequently, several dilated convolutions are operated with varying dilation rates for the effective fusion of features, and outputs of these convolutions are processed through another stage of aggregation, convolutional filtering, and global pooling operations to generate a 1D-representational feature vector. Finally, several fully connected layer operations are employed for generating the final prediction for a specific CT-volume.
II-E Loss Functions
The optimization of the whole process is divided into two phases where the TA-SegNet is optimized in the first phase and joint optimization of the diagnostic and severity prediction tasks are carried out in the second phase utilizing the optimized TA-SegNet from phase-1. A focal Tversky loss function () is proposed in [24] utilizing the Tversky index that performs well over a large range of applications which is used as the objective function to optimize TA-SegNet.
In general, both the COVID diagnosis and severity predictions are defined as binary-classification tasks, where normal/disease classes are considered for diagnosis while mild/severe classes are considered for severity predictions. For joint optimization of the diagnosis and severity prediction, an objective loss function () is defined by combining the objective loss functions for diagnosis () and severity prediction (). The severity prediction task will only be initiated for the infected volumes where , while for the normal cases (), this task is ignored. However, the diagnosis task is carried out for all normal/infectious volumes. Hence, the objective loss function () can be expressed as:
| (8) |
where and represent the set of diagnosis and severity ground truths while represent the corresponding set of predictions, denotes binary cross-entropy loss, denotes the total number of CT-volumes, and represents the total number of infected volumes. Hence, the proposed CovTANet network can be effectively optimized for joint segmentation, diagnosis, and severity predictions of COVID-19 utilizing this two phase optimization scheme.
III Results and Discussions
In this section, results obtained from extensive experimentation on a publicly available dataset are presented and discussed from diverse perspectives to validate the effectiveness of the proposed scheme.
| Version |
|
|
|
|
|
Dice(%) | ||||||||||
| V1 | ✗ | ✗ | ✗ | ✗ | ✗ | 50.50.26 | ||||||||||
| V2 | ✗ | ✗ | ✗ | ✗ | ✓ | 52.40.17 | ||||||||||
| V3 | ✗ | ✓ | ✗ | ✗ | ✗ | 54.90.14 | ||||||||||
| V4 | ✗ | ✓ | ✗ | ✗ | ✗ | 54.60.14 | ||||||||||
| V5 | ✗ | ✗ | ✓ | ✗ | ✗ | 53.40.19 | ||||||||||
| V6 | ✗ | ✓ | ✓ | ✗ | ✗ | 57.10.33 | ||||||||||
| V7 | ✗ | ✓ | ✓ | ✓ | ✓ | 60.20.26 | ||||||||||
| V8 | ✓ | ✓ | ✓ | ✓ | ✓ | 62.30.18 |
| Networks | Sensitivity(%) | Precision(%) | Dice(%) | IoU(%) |
| FCN [27] | 78.80.23 | 58.90.16 | 35.60.36 | 29.30.45 |
| Unet [16] | 94.30.34 | 74.40.32 | 50.50.26 | 40.30.23 |
| Vnet [28] | 84.50.42 | 64.60.54 | 40.20.33 | 36.40.26 |
| Unet++ [17] | 78.10.15 | 65.10.25 | 37.20.27 | 33.30.32 |
| CPF-Net [29] | 82.40.25 | 71.30.29 | 48.90.21 | 37.60.38 |
| COPLE-Net [14] | 85.50.18 | 73.10.20 | 51.10.21 | 41.20.38 |
| Mini-SegNet [13] | 81.50.25 | 69.10.19 | 43.70.23 | 35.20.38 |
| Inf-Net [12] | 92.80.27 | 76.90.34 | 51.80.31 | 41.60.27 |
| TA-SegNet (Prop.) | 99.60.09 | 84.80.26 | 62.30.18 | 51.70.29 |
III-A Dataset Description
This study is conducted using “MosMedData: Chest CT Scans with COVID-19 Related Findings” [25], one of the largest publicly available datasets in this domain. The dataset, being collected from the hospitals in Moscow, Russia, contains 1110 anonymized CT-volumes with severity annotated COVID-19 related findings, as well as without such findings. Each one of the 1110 CT-volumes is acquired from different persons and 30-46 slices per patient are available. Pixel annotations of the COVID lesions are provided for 50 CT-volumes which are used for training and evaluation of the proposed TA-SegNet. For carrying out the diagnosis and severity prediction tasks, all the CT-volumes are divided into normal, mild (25% lung parenchyma) and severe (25% lung parenchyma) infection categories.
In addition, to validate the lesion segmentation performance of our method, “COVID-19 CT Lung and Infection Segmentation Collection dataset” [26] is employed as a secondary dataset that contains 20 CT volumes (Average slices 176 per volume) collected from 19 different patients with pixel-annotated lung and infection regions labeled by two expert radiologists. However, this dataset does not contain severity-based annotation and therefore, is mainly incorporated for additional experimentation on the segmentation performance using TA-SegNet.
III-B Experimental Setup
With a five-fold cross-validation scheme over the MosMed dataset, all the experimentations have been implemented on the google cloud platform with NVIDIA P-100 GPU as the hardware accelerator. For evaluation of the segmentation performance, some of the traditional metrics are used, such as accuracy, precision, dice score, and intersection-over-union (IoU) score, while for assessing the severity classification performance, accuracy, sensitivity, specificity, and F1-score are used. The Adam optimizer is employed with an initial learning rate of which is decayed at a rate of 0.99 after every 10 epochs.
| Network | Sensitivity(%) | Specificity(%) | Dice(%) | IoU(%) |
|---|---|---|---|---|
| Unet [16] | 75.90.34 | 88.90.12 | 79.30.26 | 74.90.18 |
| MultiResUnet [30] | 77.20.33 | 90.30.24 | 82.70.28 | 77.40.15 |
| Attention-Unet [31] | 81.10.29 | 92.20.11 | 85.10.14 | 79.60.28 |
| CPF-Net [29] | 78.90.27 | 91.70.14 | 84.40.25 | 79.30.25 |
| Gated-Unet [32] | 81.40.24 | 92.50.19 | 85.60.19 | 80.20.16 |
| Inf-Net [12] | 82.70.26 | 94.80.21 | 86.90.34 | 81.10.18 |
| TA-SegNet (ours) | 88.50.22 | 98.90.14 | 90.20.17 | 86.40.19 |
| Network | Diagnostic Prediction | Severity Prediction | ||||||||||
| Normal vs. Mild | Normal vs. Severe | Mild vs. Severe | ||||||||||
| Sen.(%) | Spec.(%) | Acc.(%) | F1(%) | Sen.(%) | Spec.(%) | Acc.(%) | F1(%) | Sen.(%) | Spec.(%) | Acc.(%) | F1(%) | |
| VGG-19 | 54.40.37 | 63.40.28 | 58.40.32 | 58.60.33 | 63.40.32 | 70.80.37 | 65.90.28 | 66.90.39 | 62.70.25 | 65.50.23 | 61.90.25 | 64.10.28 |
| ResNet-50 | 61.10.29 | 65.70.33 | 62.50.44 | 63.30.37 | 66.50.26 | 69.30.31 | 69.10.17 | 67.80.33 | 61.10.36 | 63.80.29 | 64.80.34 | 62.40.37 |
| Xception | 56.80.38 | 57.90.41 | 59.90.27 | 57.30.43 | 64.80.19 | 67.20.26 | 66.70.21 | 65.90.25 | 62.90.33 | 65.10.32 | 63.10.22 | 63.90.34 |
| DenseNet121 | 59.70.27 | 64.60.21 | 61.10.39 | 62.10.28 | 65.10.23 | 70.10.19 | 67.80.29 | 67.50.25 | 60.20.28 | 64.40.21 | 60.60.26 | 62.20.27 |
| InceptionV3 | 60.40.31 | 62.10.38 | 59.30.23 | 61.20.35 | 66.60.28 | 69.80.24 | 66.20.32 | 68.20.31 | 62.80.29 | 67.90.35 | 61.40.19 | 65.30.33 |
| CovTANet (ours) | 83.80.25 | 90.30.27 | 85.20.19 | 86.90.22 | 93.90.13 | 96.60.11 | 95.80.17 | 94.20.21 | 90.90.16 | 93.40.23 | 91.70.19 | 92.10.11 |
III-C Analysis of the Segmentation Performance
Firstly, ablation studies are carried out to validate the effectiveness of different modules in TA-SegNet. Afterwards, the performance of the best performing variant is compared with other networks from qualitative and quantitative perspectives.
III-C1 Ablation study
Traditional Unet network has been used as a baseline model (V1) and five other schemes/modules have been incorporated in the baseline model to analyze the contribution of different modules in the performance improvement of the proposed TA-SegNet (V8). For ease of comparison, only Dice score is used as it is the most widely used metric for segmentation tasks. From Table I, it can be noted that the encoder TAUs (V4) provide 4.1% improvement of the Dice score from the baseline, while the decoder TAUs (V5) provide a 2.9% improvement and when both these are combined (V6), 6.6% improvement is achieved. As the encoder TAUs contribute significantly to the reduction of semantic gaps with the corresponding decoder feature maps, while the decoder TAU units guide the decoded feature maps with finer details for better generalization of multi-scale features, considerable performance improvement is achieved when employed in combination. Moreover, all the multi-scale feature maps generated from various encoder levels are guided to the reconstruction process through a deep fusion scheme along with the multi-scale decoded feature maps. The integration of these multi-scale features from the encoder-decoder modules in the fusion process (V3) contributes to the efficient reconstruction, and 4.4% improvement of Dice score is achieved over the baseline. Moreover, 9.7% improvement of Dice score is achieved when the fusion scheme is combined with two-stage TAU-units (V7). Additionally, for introducing transfer learning, pre-trained models on the ImageNet database can be used as the backbone of the encoder module of the TA-SegNet similar to most other segmentation networks. It should be noted that with the pre-trained EfficientNet network as the backbone of the encoder module (V8), the performance gets improved by 2.1% compared to the TA-SegNet framework without such backbone (V7).
III-C2 Quantitative analysis
In Table II, performances of some of the state-of-the-art networks are summarized. It should be noticed that the proposed TA-SegNet outperforms all the methods compared by a considerable margin in all the metrics. Using the proposed framework, 11.8% improvement of Dice score over Unet, and 26.7% improvement of Dice score over the FCN have been achieved. Furthermore, our network improves the dice score of the second-best method (Inf-Net) by about 10.5%, which intuitively indicates its excellent capabilities over the rest of the models. The robustness of the proposed scheme and the enhanced capability of our model in terms of infected region identification is further demonstrated by the high sensitivity score (99.6%) reported. This signifies the fact that the model integrates the symmetric encoding-decoding strategy of Unet as well as exploits the parallel optimization advantages of FCN that provides this large improvement. Most other state-of-the-art variants of the Unet provide sub-optimal performances for increasing complexity considerably that makes the optimization difficult in most of the challenging cases. However, due to the smaller amount of infections in the annotated CT-volumes used for training and optimization of the segmentation networks, a higher amount of false positives have been generated in most of the networks which reduced the precision. The proposed TA-SegNet has considerably reduced the false positives along with false negatives and has improved both precision and sensitivity.
III-C3 Qualitative analysis
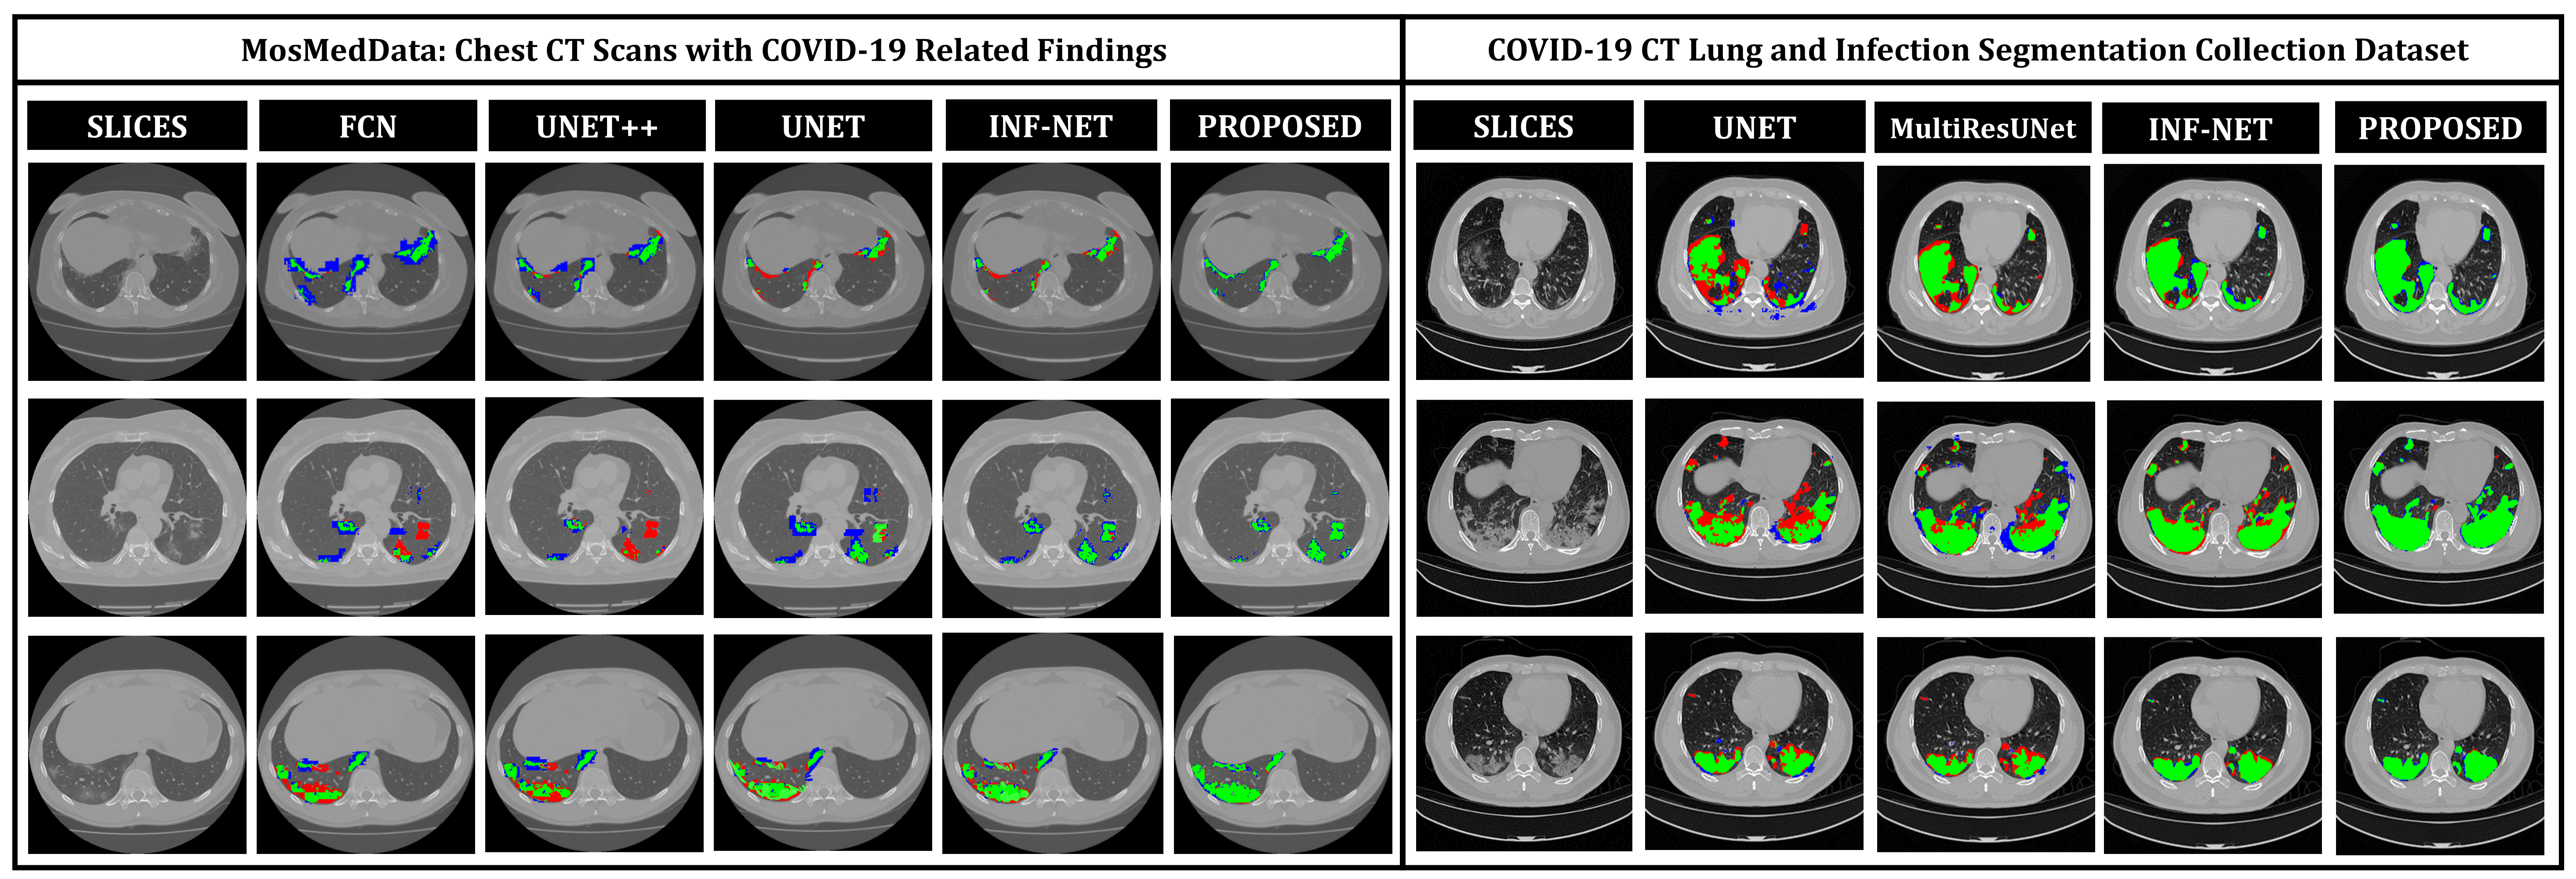
In Fig. 8, qualitative representations of the segmentation performances of different networks are shown in some challenging conditions. The comparable dimensions of the small infected regions and the arteries, veins embedded in the thorax cavity with varying anatomical appearance might be attributed to the large occurrences of the false positives. It is evident that most other networks struggle to extract the complicated, scattered, and diffused COVID-19 lesions, while the proposed TA-SegNet considerably improves the segmentation performance in such challenging conditions. This depiction conforms to the fact that our network can correctly segment both of the large and small infected regions. Furthermore, our framework consistently demonstrates almost non-existent false negatives compared to the other models while considerably reducing the false positive predictions as it can distinguish sharper details of the lesions and effectively perform for early diagnosis of the infection.
III-D Performance on Secondary Dataset
In Table III, quantitative performances on Dataset-2 [26] for different networks are summarized. It should be noticed that the proposed TA-SegNet provides the best achievable performances with mean Dice score while providing improvement over Unet. In Fig. 8, the qualitative performance analyses are provided on several challenging examples that further demonstrate the effectiveness of the proposed TA-SegNet over other traditional networks with large reductions in both false positives and false negatives. However, it should be mentioned that this dataset contains mostly higher levels of infections in the CT volumes on average that makes the learning and optimization more favorable compared to the MosMedData, and thus, comparatively higher segmentation performances have been achieved.
III-E Analysis of the Joint Classification Performance
In Table IV, the performances obtained from the joint diagnosis and severity prediction tasks are summarized. To analyze the effectiveness of the proposed multi-phase optimization scheme, some of the state-of-the-art networks are also evaluated for the slice-wise processing of the CT-volumes in the joint-classification scheme discarding the TA-SegNet.
III-E1 Diagnostic prediction performance analysis
The diagnosis performances with mild and severe cases of COVID-19 are separately reported to distinguish the early diagnosis performance. The proposed CovTANet provides 85.2% accuracy in isolating the COVID patients even with mild symptoms, while the accuracy is as high as 95.8% when the CT volumes contain severe infections. However, the other networks operating without the TA-SegNet noticeably suffer especially in the early diagnosis phase, as it is difficult to isolate the small infection patches from the CT-volume. Hence, it can be interpreted that this high early diagnostic accuracy of CovTANet is significantly contributed by the multi-phase optimization scheme that incorporates the highly optimized TA-SegNet for extracting the most effective lesion features to mitigate the effect of redundant healthy parts.
III-E2 Severity prediction performance analysis
In the joint optimization process based on the amount of infected lung parenchymas, mild and severe patients are also categorized. Despite the additional challenges regarding the isolation and quantification of the abnormal tissues, the proposed scheme generalizes the problem quite well which provides 91.7% accuracy in categorizing mild and severe patients. It should be noted that the highest achievable severity prediction accuracy with a traditional network is 64.8% (using ResNet50) with considerably smaller results in most other metrics. Traditional network directly operates on the whole CT-volume to extract effective features for severity prediction which makes the task more complicated. Whereas, the proposed hybrid CovTANet with multiphase optimization effectively integrates features regarding infections from the TA-SegNet for considerably simplifying the feature extraction process in the joint-classification process that results in higher accuracy.
IV Conclusion and Future Works
In this study, a multi-phase optimization scheme is proposed with a hybrid neural network (CovTANet) where an efficient lesion segmentation network is integrated into a complete optimization framework for joint diagnosis and severity prediction of COVID-19 from CT-volume. The tri-level attention mechanism and parallel optimization of multi-scale encoded-decoded feature maps which are introduced in the segmentation network (TA-SegNet) have improved the lesion segmentation performance substantially. Moreover, the effective integration of features from the optimized TA-SegNet is found to be extremely beneficial in diagnosis and severity prediction by de-emphasizing the effects of redundant features from the whole CT-volumes. It is also shown that the proposed joint classification scheme not only provides better diagnosis at severe infection stages but also is capable of early diagnosis of patients having mild infections with outstanding precision. Furthermore, considerable performances have been achieved in severity screening that would facilitate a faster clinical response to substantially reduce the probable damages. Nonetheless, a further study should be carried out considering patients from diverse geographic locations to understand the mutation and evolution of this deadly virus where the proposed hybrid network is supposed to be very effective. The proposed scheme can be a valuable tool for the clinicians to combat this pernicious disease through faster-automated mass-screening.
References
- [1] G. Meyerowitz-Katz and L. Merone, “A systematic review and meta-analysis of published research data on COVID-19 infection fatality rates,” International Journal of Infectious Diseases, vol. 101, pp. 138 – 148, 2020.
- [2] Y. Fang, H. Zhang, J. Xie, M. Lin, L. Ying, P. Pang, and W. Ji, “Sensitivity of chest CT for COVID-19: comparison to RT-PCR,” Radiology, vol. 296, no. 2, pp. E115–E117, 2020.
- [3] F. Shi, J. Wang, J. Shi, Z. Wu, Q. Wang, Z. Tang, K. He, Y. Shi, and D. Shen, “Review of artificial intelligence techniques in imaging data acquisition, segmentation and diagnosis for COVID-19,” IEEE Reviews in Biomedical Engineering, 2020.
- [4] M. Abdel-Basset, V. Chang, and N. A. Nabeeh, “An intelligent framework using disruptive technologies for COVID-19 analysis,” Technological Forecasting and Social Change, p. 120431, 2020.
- [5] L. Li, L. Qin, Z. Xu, Y. Yin, X. Wang, B. Kong, J. Bai, Y. Lu, Z. Fang, Q. Song et al., “Artificial intelligence distinguishes COVID-19 from community acquired pneumonia on chest CT,” Radiology, vol. 296, no. 2, pp. E65–E71, 2020.
- [6] L. Huang, R. Han, T. Ai, P. Yu, H. Kang, Q. Tao, and L. Xia, “Serial quantitative chest CT assessment of COVID-19: Deep-learning approach,” Radiology: Cardiothoracic Imaging, vol. 2, no. 2, p. e200075, 2020.
- [7] M. Abdel-Basset, V. Chang, H. Hawash, R. K. Chakrabortty, and M. Ryan, “FSS-2019-nCov: A deep learning architecture for semi-supervised few-shot segmentation of COVID-19 infection,” Knowledge-Based Systems, p. 106647, 2020.
- [8] T. Mahmud, M. A. Rahman, and S. A. Fattah, “CovXNet: A multi-dilation convolutional neural network for automatic COVID-19 and other pneumonia detection from chest X-ray images with transferable multi-receptive feature optimization,” Computers in Biology and Medicine, p. 103869, 2020.
- [9] M. Abdel-Basset, V. Chang, and R. Mohamed, “HSMA_WOA: A hybrid novel slime mould algorithm with whale optimization algorithm for tackling the image segmentation problem of chest X-ray images,” Applied Soft Computing, vol. 95, p. 106642, 2020.
- [10] J. P. Kanne, B. P. Little, J. H. Chung, B. M. Elicker, and L. H. Ketai, “Essentials for radiologists on COVID-19: an update—radiology scientific expert panel,” Radiology, vol. 296, no. 2, pp. E113–E114, 2020.
- [11] J. T. Wu, K. Leung, M. Bushman, N. Kishore, R. Niehus, P. M. de Salazar, B. J. Cowling, M. Lipsitch, and G. M. Leung, “Estimating clinical severity of COVID-19 from the transmission dynamics in Wuhan, China,” Nature Medicine, vol. 26, no. 4, pp. 506–510, 2020.
- [12] D. P. Fan, T. Zhou, G. P. Ji, Y. Zhou, G. Chen, H. Fu, J. Shen, and L. Shao, “Inf-Net: Automatic COVID-19 lung infection segmentation from CT images,” IEEE Transactions on Medical Imaging, vol. 39, no. 8, pp. 2626–2637, 2020.
- [13] Y. Qiu, Y. Liu, and J. Xu, “Miniseg: An extremely minimum network for efficient COVID-19 segmentation,” arXiv preprint arXiv:2004.09750, 2020.
- [14] G. Wang, X. Liu, C. Li, Z. Xu, J. Ruan, H. Zhu, T. Meng, K. Li, N. Huang, and S. Zhang, “A noise-robust framework for automatic segmentation of COVID-19 pneumonia lesions from CT images,” IEEE Transactions on Medical Imaging, vol. 39, no. 8, pp. 2653–2663, 2020.
- [15] L. Huang, R. Han, T. Ai, P. Yu, H. Kang, Q. Tao, and L. Xia, “Serial quantitative chest CT assessment of COVID-19: Deep-learning approach,” Radiology: Cardiothoracic Imaging, vol. 2, no. 2, p. e200075, 2020.
- [16] O. Ronneberger, P. Fischer, and T. Brox, “U-net: Convolutional networks for biomedical image segmentation,” in 2015 18th International Conference on Medical image computing and computer-assisted intervention, 2015, pp. 234–241.
- [17] Z. Zhou, M. M. R. Siddiquee, N. Tajbakhsh, and J. Liang, “Unet++: Redesigning skip connections to exploit multiscale features in image segmentation,” IEEE Transactions on Medical Imaging, vol. 39, no. 6, pp. 1856–1867, 2019.
- [18] A. Bernheim, X. Mei, M. Huang, Y. Yang, Z. A. Fayad, N. Zhang, K. Diao, B. Lin, X. Zhu, K. Li et al., “Chest CT findings in coronavirus disease-19 (COVID-19): relationship to duration of infection,” Radiology, vol. 295, no. 3, p. 200463, 2020.
- [19] A. Sinha and J. Dolz, “Multi-scale self-guided attention for medical image segmentation,” IEEE Journal of Biomedical and Health Informatics, 2020.
- [20] A. Vaswani, N. Shazeer, N. Parmar, J. Uszkoreit, L. Jones, A. N. Gomez, Ł. Kaiser, and I. Polosukhin, “Attention is all you need,” in Advances in Neural Information Processing Systems, 2017, pp. 5998–6008.
- [21] J. Hu, L. Shen, and G. Sun, “Squeeze-and-excitation networks,” in 2018 IEEE conference on computer vision and pattern recognition, 2018, pp. 7132–7141.
- [22] Z. Tan, Y. Yang, J. Wan, H. Hang, G. Guo, and S. Z. Li, “Attention-based pedestrian attribute analysis,” IEEE Transactions on Image Processing, vol. 28, no. 12, pp. 6126–6140, 2019.
- [23] F. Yu and V. Koltun, “Multi-scale context aggregation by dilated convolutions,” arXiv preprint arXiv:1511.07122, 2015.
- [24] N. Abraham and N. M. Khan, “A novel focal tversky loss function with improved attention U-net for lesion segmentation,” in 2019 IEEE 16th International Symposium on Biomedical Imaging, 2019, pp. 683–687.
- [25] “MosMedData: Chest CT Scans with COVID-19 Related Findings,” 2020, accessed: 28 April, 2020. [online]. Available: https://mosmed.ai/datasets/covid19_1110.
- [26] “COVID-19 CT Lung and Infection segmentation dataset,” 2020, accessed: 16 October, 2020. [online]. Available: https://zenodo.org/record/3757476.
- [27] J. Long, E. Shelhamer, and T. Darrell, “Fully convolutional networks for semantic segmentation,” in 2015 IEEE 28th conference on computer vision and pattern recognition, 2015, pp. 3431–3440.
- [28] F. Milletari, N. Navab, and S.-A. Ahmadi, “V-net: Fully convolutional neural networks for volumetric medical image segmentation,” in 2016 4th International Conference on 3D Vision, 2016, pp. 565–571.
- [29] S. Feng, H. Zhao, F. Shi, X. Cheng, M. Wang, Y. Ma, D. Xiang, W. Zhu, and X. Chen, “CPFNet: Context pyramid fusion network for medical image segmentation,” IEEE Transactions on Medical Imaging, vol. 39, no. 10, pp. 3008–3018, 2020.
- [30] N. Ibtehaz and M. S. Rahman, “MultiResUNet: Rethinking the U-Net architecture for multimodal biomedical image segmentation,” Neural Networks, vol. 121, pp. 74–87, 2020.
- [31] O. Oktay, J. Schlemper, L. L. Folgoc, M. Lee, M. Heinrich, K. Misawa, K. Mori, S. McDonagh, N. Y. Hammerla, B. Kainz et al., “Attention U-net: Learning where to look for the pancreas,” arXiv preprint arXiv:1804.03999, 2018.
- [32] J. Schlemper, O. Oktay, M. Schaap, M. Heinrich, B. Kainz, B. Glocker, and D. Rueckert, “Attention gated networks: Learning to leverage salient regions in medical images,” Medical Image Analysis, vol. 53, pp. 197–207, 2019.