On the Origins of Tension–Compression Asymmetry in Crystals
and Implications for Cyclic Behavior
Abstract
Most of crystalline materials exhibit a hysteresis on their deformation curve when mechanically loaded in alternating directions. This Bauschinger effect is the signature of mechanisms existing at the atomic scale and controlling the materials damage and ultimately their failure. Here, three-dimensional simulations of dislocation dynamics and statistical analyses of the microstructure evolution reveal two original elementary mechanisms. An asymmetry in the dislocation network junctions arising from the stress driven curvatures and the partial reversibility of plastic avalanches give an explanation to the traction-compression asymmetry observed in FCC single-crystals. These mechanisms are then connected in a physically justified way to larger-scale representations using a dislocation density based theory. Parameter-free predictions of the Bauschinger effect and strain hardening during cyclic deformation in different materials and over a range of loading directions and different plastic strain amplitudes are found to be in excellent agreement with experiments. This work brings invaluable mechanistic insights for the interpretation of experiments and for the design of structural components to consolidate their service life under cyclic load.
The materials mechanical response depends upon the deformation history. At the macroscale, this manifests itself in the shape of hysteresis loops on force-displacement curves when the loading direction is alternated [1]. Thus, an initial deformation in tension usually facilitates a reverse deformation in compression, at least over a certain transient. This phenomenon, known as the Bauschinger Effect (BE) is intimately related to fundamental aspects of material behavior such as strain hardening and life prediction under cyclic loading. The issue of the durability of crystalline materials in non-monotonic solicitation is a key problem in a large variety of applications ranging from microelectronic devices to biocompatible implants and monumental structural frames of buildings [2]. It is consequently associated with crucial technological, economical and safety stakes. Modelling the BE and cyclic behavior is a long-standing problem and a physically based model with real predictive capability has yet to be formulated. Here, we elucidate the puzzling and most argued BE observed in FCC single crystals and quantify its implication for cyclic behavior. This step is essential before addressing more complex polycrystalline materials.
Dislocation dynamics and their interactions are key phenomena controlling the plasticity of the crystalline materials and the formation of organised microstructures. At the small scale, their intermittent and mostly irreversible motion presents similarities with avalanche phenomena [3, 4, 5]. Until now, tension-compression asymmetry was thought to find its origin in the building up of a resistive long-range backstress during the first loading [6, 7] or easy slip after reversal of the strain induced by partial dissolution of the dislocation network [8, 9, 10, 11]. In principle, these mechanisms can facilitate dislocation motion during reverse strain, but neither any known elementary dislocation mechanism nor any in-situ experimental evidence support them in single crystals. Moreover, they do not fit with the embraced ’forest’ model [5, 12] according to which the formation of dislocation junctions controls plastic flow and strain hardening.
To shed light on this problem, tension-compression tests were performed with 3D Dislocations Dynamics (DD) simulations. We find that the hysteresis behavior of plastic deformation originates from two dislocation mechanisms observed after the loading reversal. From averages performed on the collective behavior of dislocations, we define a crystal plasticity model that captures, without any fitting parameter, most of the features of the BE and of the cyclic strain hardening observed in FCC single crystals.
All simulations are performed using the DD simulation code microMegas [13]. Periodic boundary conditions are applied to ensure that the dislocation avalanches occur without amplitude restriction, in agreement with the plastic processes found in single crystals or large grains in polycrystals. Cu and Ni are taken as reference materials and for comparison with experimental data. Having a systematic approach, our simulations cover an extensive set of experimental configurations where key parameters are varied, namely, the initial dislocation density (), the amount of plastic strain accumulated during prestrain () and crystal orientation (, , and ). Detailed information on the methods, including statements of data availability and any associated accession codes and references, are available in the joint publication [14].
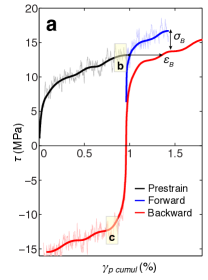
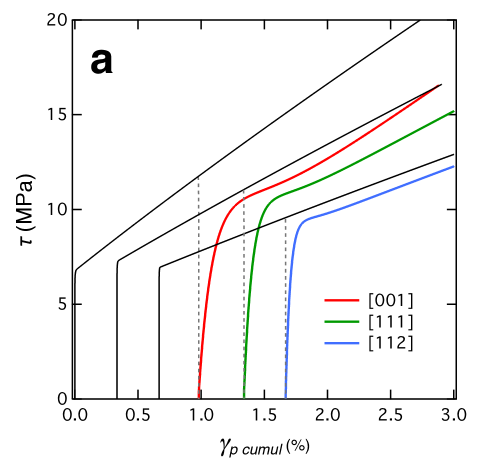
First, we show that DD simulations reproduce the main features of tension-compression asymmetry observed experimentally. Choosing the [001] deformation axis as a representative example of other crystal orientation, Fig. 1a shows a typical stress-strain curve obtained during a Bauschinger cycle simulation. Several slip systems, associated with different slip planes and different Burgers vectors, are simultaneously shearing the crystal. Their interactions induce a dislocation storage and an increase in the flow stress with a linear slope close to (where is the material shear modulus) in good agreement with experiments [2]. Serrations are clearly visible on the simulated deformation curves and can be attributed to strain bursts and dislocation avalanches. Serrations are also present on the compression curves and continued tension second loadings. The reverse compression curve exhibits a reduced elastic limit, a well-rounded appearance of the initial plastic portion (characterized by a strain shift ) and a permanent stress softening () with respect to the continued tension curve.
While the many BE tests we made compare well with experiments, the simulation analysis surprisingly does not support usual interpretations of the BE. For instance, no significant backstress is found in the simulated volumes at the beginning of the reversed deformation when the applied loading is still close to zero. This finding agrees with recent Xray microdiffraction measurements [15, 16], where the residual stress induced by a dislocation microstructure formed in a tensile test was found as low as a few percent of the flow stress.
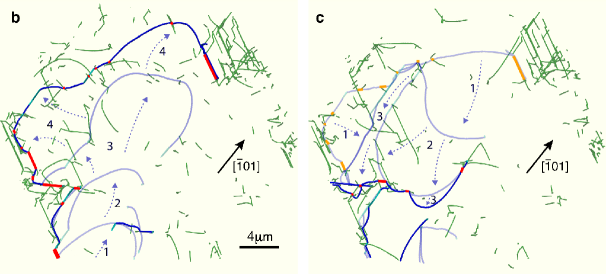
Actually, our simulations give evidence that the BE is caused by two original mechanisms. As illustrated in Fig. 1b, plastic deformation proceeds through intermittent dislocation motion sequences. Each sequence starts with the destruction of a junction with the lateral unzipping of a mobile dislocation progressing under the effect of external loading [17]. This first event triggers a cascade of other junction destructions and significant dislocation displacements characterized by a scale-free power law distribution [5]. During such bursts in dislocation dynamics, new junctions can be formed each time a mobile dislocation collides with a ‘forest’ dislocation (an immobile dislocation piercing the mobile dislocation glide plane) if this reaction minimises the elastic energy. As illustrated in Fig. 1b, these plastic strain avalanches leave in their wake a large amount of immobile dislocation segments at the origin of dislocation density increase and material strengthening. Each avalanche stops when the whole mobile dislocation length is pinned on the dislocation network.
The same zone observed during the later compression (Fig. 1c) shows a very different behavior. First, former stable junctions that anchored the dislocation network at the end of the tensile loading are now easily unzipped. A first tension-compression asymmetry is therefore found in the junctions stability. This effect is unexpected because it contrasts with basic calculations that consider only two interacting dislocations. Here, the junction weakening we see in the simulations comes from the interactions between several forest dislocations and a curved mobile dislocation. Indeed, arrangements of three consecutive junctions zipped along a curved dislocation are less (respectively more) stable than isolate junctions formed by straight segments as an effect of an additional line curvature energy working to decrease (respectively expand) the junction length.
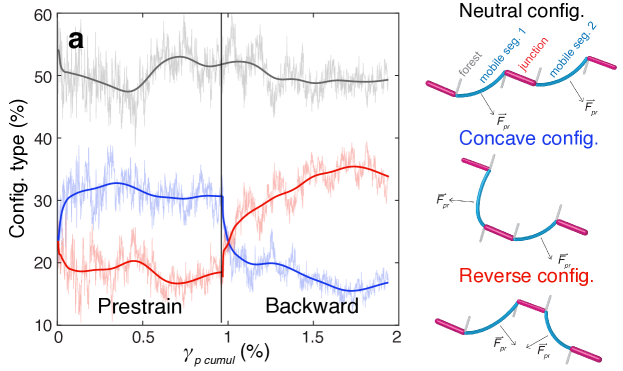
When considering the large variety of dislocation arrangements existing in simulated networks, one can distinguish three configuration geometries (see schematics on Fig. 2a), (i) concave configurations where two segments are pulling a given junction backward due to the spatial arrangement of other dislocations, (ii) reverse configurations where two segments are both pulling the connected junction forward and (iii) neutral configurations where two segments are pulling the considered junction in opposite directions. Concave configurations (i) are, on average, more mechanically stable than reverse configurations since mobile segments ending at the junction promote the zipping rather than the unzipping of the junction. This is why, as illustrated in Fig. 2a, concave configurations represent a larger number () of the configurations found in the dislocation networks than reverse configurations (), while neutral configurations take the rest (). When loading is changed from tension to compression, concave (i) and reverse configurations (ii) switch roles as the direction of dislocation curvature is reversed. This explains the excess of weaker reverse configurations that is systematically observed at the beginning of backward deformation. This abnormal partition of junction configurations progressively disappears as deformation progresses.
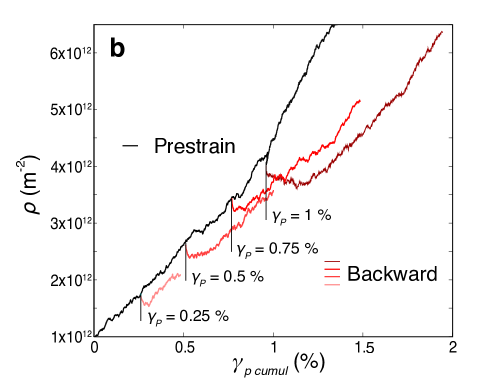
A second and stronger asymmetry in the tension-compression behavior is found in the kinetics of dislocation glide. The backward motion sequence of Fig. 1c shows that deformation still occurs through slip bursts. However, plastic events now take place within regions that have already been explored by mobile dislocations during their recent forward motion. In turn, avalanches at the beginning of the backward deformation eliminate many junctions previously formed in the dislocation network. This effect is somewhat similar to what is observed in alloys [18], where mobile dislocations collide with dislocation loops formed during prestrain. Consequently, as illustrated in Fig. 2b, a significant decrease of the dislocation density is noticed at strain reversal. Due to the irreversible nature of plastic events, dislocations will eventually explore new material regions and this effect will wear off with deformation.
With the ambition in mind to connect with larger scale simulations, we now formulate constitutive equations that describe the mechanisms discovered in the DD simulations. Since the plastic behaviour observed in our BE test simulations is still controlled by forest interactions and plastic bursts leading to dislocation storage, we consider a dislocation density based theory of Crystal Plasticity (CP) established by the seminal work of Kocks and Mecking [19, 20, 21]. Next, we expose the main modifications required to account for the BE within this framework. The model is presented in its entirety in the joint publication [14].
Junction stability appears in the model within the flow stress equation and is accounted for with an interaction matrix whose coefficients measure the average junction strength between an active slip system ‘i’ and a forest slip system ‘j’. dimensionless coefficients depend mostly upon the type of reactions and are well known from experiments or simulations in the case of monotonous loadings. To reproduce the weakening of junction stability induced by the deformation history, we write:
| (1) |
where the ‘pr’ and ‘bck’ subscripts refer to prestrain and backward deformation, respectively. The term within the exponential states the competition between the easy destruction of existing junctions formed during previous deformation stage and the formation of fresh junctions in newly explored areas of the crystal. is the amount of density stored during the first loading and is proportional to the number of junctions formed [5]. is a dimensionless coefficient describing the length of the transient regime.
The Mean Free Path (MFP) of dislocations, which describes the distance covered by dislocations before their temporary or permanent immobilisation, controls the storage rate of dislocation density. Dislocation MFP depends upon few physical parameters among which is the rate of formation of immobilizing junctions per unit of strain, [5]. Hence, the loss of stored dislocations corresponds to a lengthening of the dislocation MFP. The evolution of revealed by DD simulations after stress reversal is accounted for by the following equation:
| (2) |
where and are two dimensionless constants that measure the initial drop and the length of the transient regime on , respectively. The three coefficients , and were unambiguously evaluated from a large set of different DD simulations leading to , and see the joint publication [14] for calculation details).
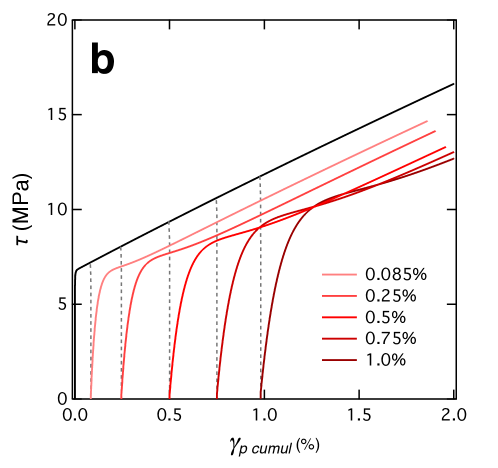
To compare with existing experimental data on single crystals, we solved the equations of the CP model including equations 1-2 with the Finite Element Method (FEM) where the relevant physical fields (see supplementary materials) are now continuous and defined at the scale of macroscopic specimens. A selection of obtained deformation curves is given in Fig. 3. These results agree well with DD simulations and experiments. Those CP calculations provide additional useful insights on the BE. The observed increase of the BE stress and BE strain with the amount of prestrain [8, 23] is the outcome of the increase of , the dislocation density stored during prestrain. Also, the BE intensification observed with the increasing number of active slip systems [8, 24, 25, 26] is explained by a larger fraction of dislocation density that is affected by equations 1-2. Last, single glide orientation also exhibits a BE, but is relatively smaller in intensity [8, 24, 25] and is due to the very low rate of dislocation storage for this orientation.
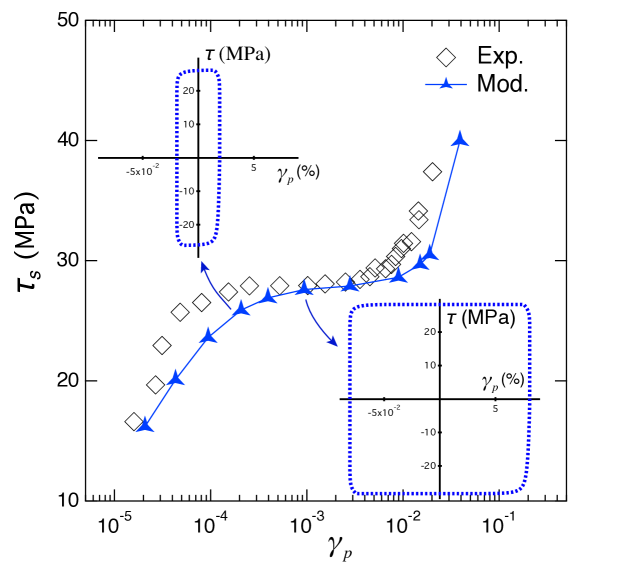
Without the use of any ad hoc parameters or backstress definition, our CP model also captures most of the features of the cyclic behavior of single crystals submitted to alternating tension and compression. This is shown in Fig. 4, where the cyclic behavior of Cu single crystals deformed in [135] single glide conditions is compared with experimental data [22]. With the accumulation of plastic strain, flow stress increases at every cycle very quickly at first, but ultimately saturates for large amounts of cumulated plastic strain. This saturation stress is controlled partly by the new dislocation processes identified for the BE and partly by the more conventional dynamic recovery mechanisms already present in monotonic deformation [21]. The model captures quantitatively the complex evolution of the saturation stress with the increase of plastic strain amplitude per cycle, and the loss of roundness of hysteresis curves at saturation. Saturation stress first increases with the strain up to , and then exhibits a plateau behavior for larger strain increments between and where materials response is dominated by recovery processes (see joint publication [14] for more details). A third stage is ultimately triggered by the activation of a secondary slip system.
To summarize, thanks to a multiscale modeling approach we identified the key mechanisms controlling the tension-compression asymmetry in FCC single crystals. From this, a crystal plasticity model free of adjustable parameters was proposed. This model reproduces the BE and the cyclic deformation of FCC single crystals in a physically justified manner. These results pave the way for new predictive models of cyclic deformation, and ultimately for the understanding of complex behavior like plastic strain localisation in devices which are key issues to assess the service life of materials.
References
- Miguel and Zapperi [2006] M. C. Miguel and S. Zapperi, Fluctuations in plasticity at the microscale, Science 312, 1151 (2006).
- Kubin [2013] L. Kubin, Dislocations, mesoscale simulations and plastic flow, in Oxford Series On Materials Modelling, Vol. 5, edited by A. Sutton and R. Rudd (Oxford University Press, 2013).
- Dimiduk et al. [2006] D. Dimiduk, C. Woodward, M. LeSar, and M. Uchic, Scale-free intermittent flow in crystal plasticity, Science 312, 1188 (2006).
- Csikor et al. [2007] F. Csikor, C. Motz, D. Weygand, M. Zaiser, and S. Zapperi, Dislocation avalanches, strain bursts, and the problem of plastic forming at the micromeer scale, Science 318, 251 (2007).
- Devincre et al. [2008] B. Devincre, T. Hoc, and L. Kubin, Dislocation mean free paths and strain hardening of crystals, Science 320, 1745 (2008).
- Asaro [1975] R. J. Asaro, Elastic-plastic memory and kinematic-type hardening, Acta Metallurgica 23, 1255 (1975).
- Mughrabi [1988] H. Mughrabi, Dislocation clustering and long-range internal stresses in monotonically and cyclically deformed metal crystals, Revue de Physique Appliquee 23, 367 (1988).
- Buckley and Entwistle [1956] S. Buckley and K. Entwistle, The bauschinger effect in super-pure aluminum single crystals and polycrystals, Acta Metallurgica 4, 352 (1956).
- Sleeswyk et al. [1978] A. W. Sleeswyk, M. R. James, D. H. Plantinga, and W. S. T. Maathuis, Reversible strain in cyclic plastic deformation, Acta Metallurgica 26, 1265 (1978).
- Déprés et al. [2008] C. Déprés, M. Fivel, and L. Tabourot, A dislocation-based model for low-amplitude fatigue behaviour of face-centred cubic single crystals, Scripta Materialia 58, 1086 (2008).
- Rauch et al. [2011] E. Rauch, J. J. Gracio, F. Barlat, and G. Vincze, Modelling the plastic behaviour of metals under complex loading conditions, Modelling and Simulation in Materials Science and Engineering 19 (2011).
- Friedel [1967] J. Friedel, Dislocations (Pergamon Press, Oxford, 1967).
- Devincre et al. [2011] B. Devincre, R. Madec, G. Monnet, S. Queyreau, R. Gatti, and L. Kubin, Mechanics of nano-objects (Presses de l’Ecole des Mines de Paris, 2011) Chap. Modeling crystal plasticity with dislocation dynamics simulations: The ’microMegas’ code.
- Queyreau and Devincre [2021] S. Queyreau and B. Devincre, A multiscale investigation of the physical origins of tension–compression asymmetry in crystals and their implications for cyclic behavior, Joint publication submitted to Physical Review Materials (2021).
- Kassner et al. [2009] M. E. Kassner, P. Geantil, L. E. Levine, and B. C. Larson, Mapping mesoscale heterogeneity in the plastic deformation of a copper single crystal, Int. J. Mech. Sci. 100, 333 (2009).
- Kassner et al. [2013] M. E. Kassner, P. Geantil, and L. E. Levine, Long range internal stresses in single-phase crystalline materials, In Honor of Rob Wagoner, International Journal of Plasticity 45, 44 (2013).
- Bulatov et al. [1998] V. V. Bulatov, F. F. Abraham, L. P. Kubin, B. Devincre, and S. Yip, Connecting atomistic and mesoscale simulations of crystal plasticity, Nature 391, 669 (1998).
- Queyreau and Devincre [2009] S. Queyreau and B. Devincre, Bauschinger effect in precipitation-strengthened materials: A dislocation dynamics investigation, Philosophical Magazine Letters 89, 419 (2009).
- Kocks and Mecking [2003] U. Kocks and H. Mecking, Physics and phenomenology of strain hardening: the fcc case, Progress in Materials Science 48, 171 (2003).
- Teodosiu et al. [1993] C. Teodosiu, J. Raphanel, and L. Tabourot, Finite element simulation of the large elastoplastic deformation of multicrystals, in Large Plastic Deformations, edited by C. Teodosiu, J. Raphanel, and F. Sidoroff (A.A. Balkema, Rotterdam, 1993) pp. 153–175.
- Kubin et al. [2008] L. Kubin, B. Devincre, and T. Hoc, Modeling dislocation storage rates and mean free paths in face-centered cubic crystals, Acta Materialia 56, 6040 (2008).
- Mughrabi [1978] H. Mughrabi, The cyclic hardening and saturation behaviour of copper single crystals, Materials Science and Engineering 33, 207 (1978).
- Pedersen et al. [1981] O. B. Pedersen, L. M. Brown, and W. M. Stobbs, The bauschinger effect in copper, Acta Metallurgica 29, 1843 (1981).
- Yakou et al. [1977] T. Yakou, T. Hasegawa, E. Shimokawa, and S. Karashima, Orientation dependence of the bauschinger effect in aluminium single crystals, Transactions of the Japan Institute of Metals 18, 25 (1977).
- Wadsworth [1963] N. J. Wadsworth, Work hardening of copper crystals under cyclic straining, Mechanisms of fatigue in crystalline solids, Acta Metallurgica 11, 663 (1963).
- Marukawa and Sanpei [1971] K. Marukawa and T. Sanpei, Stability of the work hardened state against stress reversal in copper single crystals, Acta Metallurgica 19, 1169 (1971).