Evidence of 200 TeV photons from HAWC J1825-134
Abstract
The Earth is bombarded by ultra-relativistic particles, known as cosmic rays (CRs). CRs with energies up to a few PeV (=1015 eV), the knee in the particle spectrum, are believed to have a Galactic origin. One or more factories of PeV CRs, or PeVatrons, must thus be active within our Galaxy. The direct detection of PeV protons from their sources is not possible since they are deflected in the Galactic magnetic fields. Hundred TeV -rays from decaying , produced when PeV CRs collide with the ambient gas, can provide the decisive evidence of proton acceleration up to the knee. Here we report the discovery by the High Altitude Water Cherenkov (HAWC) observatory of the -ray source, HAWC J1825-134, whose energy spectrum extends well beyond 200 TeV without a break or cutoff. The source is found to be coincident with a giant molecular cloud. The ambient gas density is as high as 700 protons/cm3. While the nature of this extreme accelerator remains unclear, CRs accelerated to energies of several PeV colliding with the ambient gas likely produce the observed radiation.
1 Introduction
A very prominent feature in the CR spectrum measured at Earth is the spectral steepening at several PeV known as the knee, which is believed to mark the maximum acceleration energy achievable in the Galaxy. A single population of CR accelerators, namely young supernova remnants (SNRs), has long been thought to support the entire Galactic CR population up to the knee. An efficient mechanism which can explain sub-PeV to PeV particle acceleration has not been found for historical and older SNR shells, but it might be found for much younger SNe. From an observational point of view the -ray spectra of young SNRs, with the possible exception of the SNR G106.3+2.7 (Albert et al., 2020a), show clear cutoffs in the TeV range (Aharonian et al., 2019). SNRs are proven to be efficient CR accelerators only up to about 100 TeV. Observational evidence of cosmic rays acceleration up to PeV energies has been found within the Galactic Centre (GC) region. The GC source, whose nature is still debated, can account only for a small portion of the CR energy budget in the Galaxy (Abramowski et al., 2016). This leaves space for other accelerators or classes of accelerators such as star forming regions or associations of stars to be major contributors to the Galactic CR population (Cesarsky & Montmerle, 1983; Parizot et al., 2004; Aharonian et al., 2019).
HAWC is a cosmic and -ray observatory located at a latitude of 19∘ North and an altitude of 4100 m on the slope of the Sierra Negra volcano close to Puebla, in central Mexico (Abeysekara et al., 2017a). The HAWC detector has a large field of view (2 sr), high duty cycle (>90% uptime), an angular resolution which can be as good as 0.1∘ (Abeysekara et al., 2019), and unprecedented sensitivity for -ray sources beyond 100 TeV. HAWC has carried out the deepest ever survey of the Galactic Plane in the unexplored range of -rays with energies beyond 50 TeV, which is crucial for the search of Galactic PeVatrons (Abeysekara et al., 2020a). Among the HAWC high energy sources, eHWC J1825-134, stands out for having the highest flux above 10 TeV. The new analysis of the eHWC J1825-134 region, presented in Section 2 and 3, extends the previous analysis by investigating the morphology and spectrum of this region in more detail. A discussion on the possible emission mechanisms and the possible counterparts of the HAWC radiation is presented in Section 4. Finally, conclusions are given in Section 5.
2 Analysis
Recently, the HAWC energy resolution has improved thanks to the implementation of two independent energy-estimation methods, which makes it possible to measure -ray energies beyond 100 TeV (Abeysekara et al., 2019). Based on this improvement the collaboration released a high-energy catalogue of sources emitting above 56 TeV (Abeysekara et al., 2020a). In this catalogue, three sources showed significant emission above 100 TeV. One of these sources is eHWC J1825-134 which is located within a complex region containing more than one source. The analysis presented in this work resolves and characterizes the different sources contained in the region, thanks to the HAWC angular resolution, which is best at high energies.
We performed a Maximum Likelihood analysis using the Multi-Mission Maximum Likelihood (3ML) (Vianello et al., 2015) software framework. The dataset used for the analysis contains 1343 days of observations. This means 300 days more than the dataset used for the high-energy catalogue (Abeysekara et al., 2020a), and almost three times the live time of the second HAWC catalogue (Abeysekara et al., 2017b) dataset where the source was identified as 2HWC J1825-134. In order to assess the significance of the detected sources we used the likelihood ratio test statistic (TS) defined as:
| (1) |
where, is the maximum likelihood of the alternative hypothesis (background + source model) and is the likelihood of the null hypothesis (background only).
We make use of the ground parameter energy estimation method introduced in (Abeysekara et al., 2019). The region of interest (ROI) used in the analysis is a 2.5∘ disk around the position of eHWC J1825-134. In order to reproduce the observed emission several models were tested. The one showing the best agreement in terms of statistical significance has the following components. First, two extended Gaussian-shaped -ray sources, with a power law with an exponential cut-off as -ray spectrum
| (2) |
which are compatible in position with H.E.S.S. sources (H.E.S.S. J1826-130 and H.E.S.S. J1825-137). Secondly, a point source with a simple power-law spectrum. The nearby TeV -ray binary LS 5039 was not included in the model because its average flux is below the HAWC sensitivity and it was not significantly detected. Finally, the model also includes a Galactic diffuse emission (GDE) component, with a Gaussian shape along the Galactic latitude (b) with a fixed width of 1∘ and peaked at b = 0∘ based on previous HAWC studies (Rho et al., 2018).
3 Results
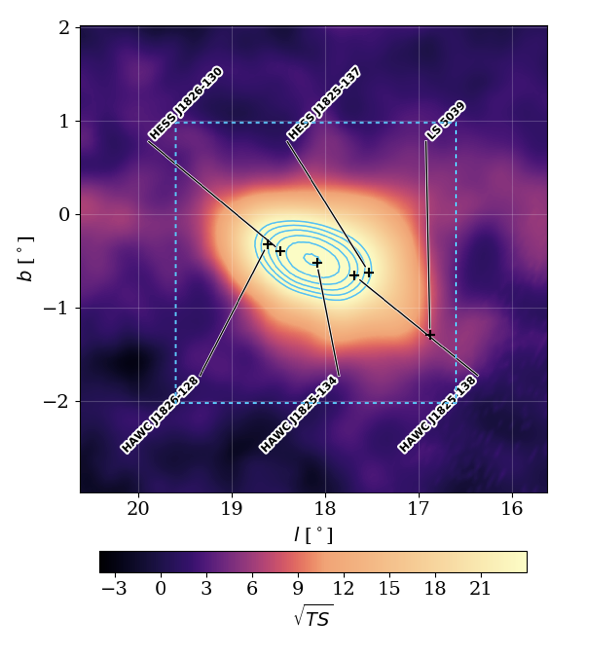
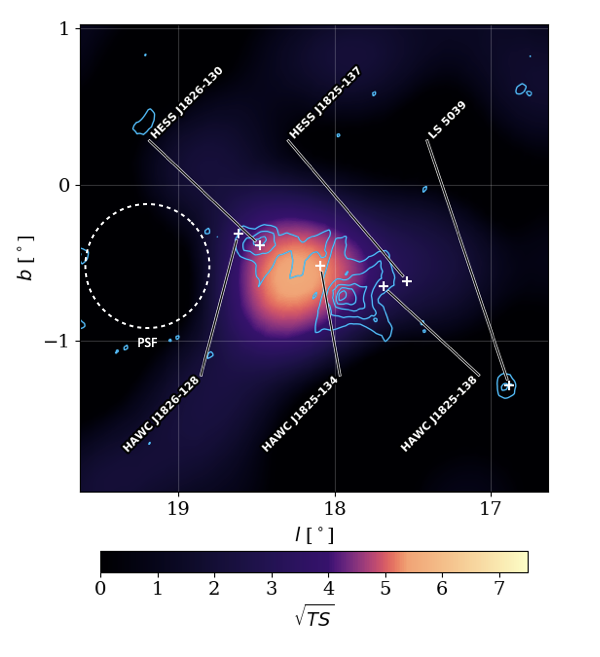
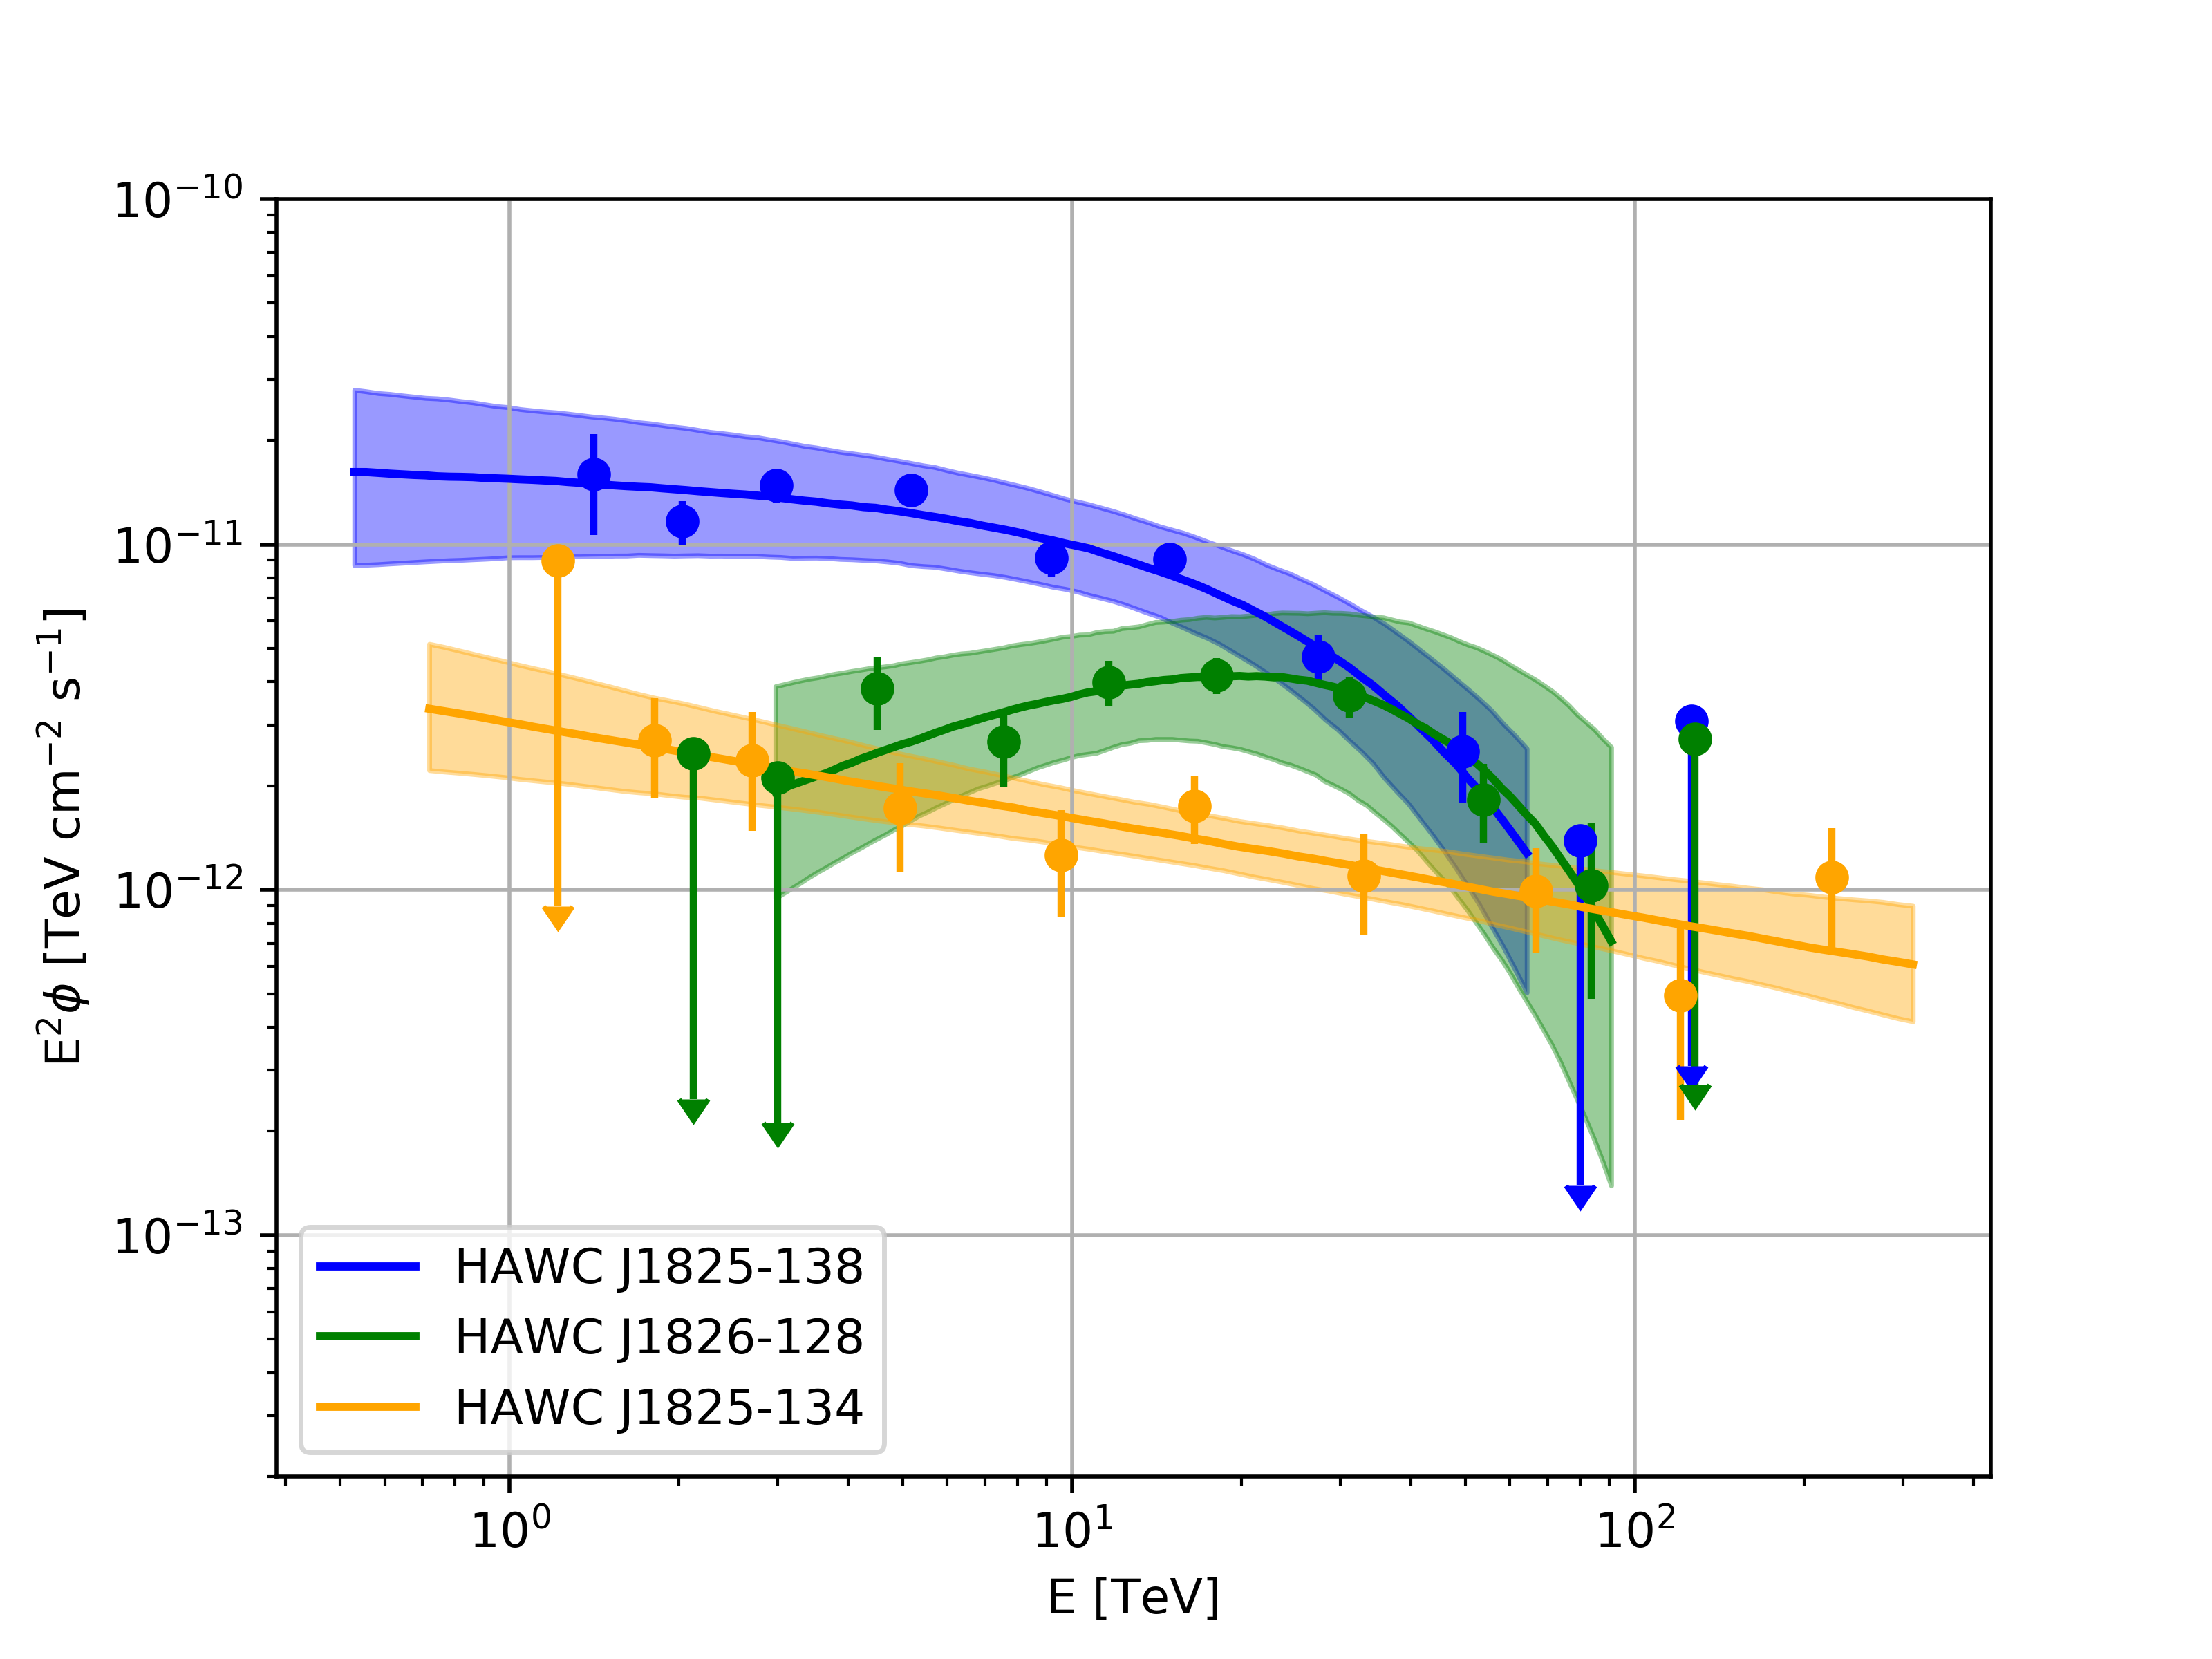
The HAWC significance map for the 1 TeV to 316 TeV energy range is plotted in Figure 1 left. The HAWC significance map of the region for events above 177 TeV only is shown in Figure 1 right. The -ray emission in the 1 TeV to 350 TeV energy range observed by HAWC from eHWC J1825-134 is well described by four components including galactic diffuse emission (GDE), the likely counterparts to known -ray sources, HESS J1825-137 and HESS J1826-130, and a newly discovered source, HAWC J1825-134. As shown in Figure 2, HAWC J1825-134, presents a hard power-law energy spectrum with index -2.280.12 (stat.) (syst.). The spectrum continues beyond 200 TeV without evidence of a cutoff or break.
To confirm the detection of the point source HAWC J1825-134, a likelihood ratio test is performed between the model using 3 sources, introduced in the previous section, and a 2-source model, similar to the one presented in (Salesa Greus & Casanova, 2020), which does not include HAWC J1825-134. According to Wilk’s theorem (Wilks, 1938), for nested models by assuming the 2-source model is true, the TS is distributed as distribution. We define the test statistic difference:
| (3) |
where is the maximum likelihood of the 3-source model and is the maximum likelihood of the 2-source model. The test result shows the 3-source model is favored by TS = 38. Additionally, we perform a Monte Carlo study, from which we estimate that the TS of 38 corresponds to 5.2 sigma after accounting for trials (Section A).
The results of the parameters from the maximum likelihood analysis are summarized in Table 1. The TS value in the table refers only to the improvement added by that particular source, i.e., it considers all the other sources (including the GDE) as the null hypothesis. For the sources modeled in the analysis we use a pivot energy, E0 in Equation 2, of 18 TeV.
| Source Name | RA [∘] | dec [∘] | width [∘] | [] | Ecut [TeV] | TS | |
| HAWC J1825-138 | 276.38 | -13.86 | 0.47 | 4.5 | 2.02 | 27 | 142 |
| HAWC J1826-128 | 276.50 | -12.86 | 0.20 | 2.7 | 1.2 | 24 | 83 |
| HAWC J1825-134 | 276.44 | -13.42 | – | 4.2 | 2.28 | – | 38 |
The differential flux at 18 TeV of the new source, HAWC J1825-134, is 4.2 (stat.) (syst.) 10-15 cm-2 s-1 TeV-1 and its spectrum is a pure power law with spectral index 2.28 0.12 (stat.) (syst.). Its integral flux above 1 TeV is 2.4 10-12 cm-2 s-1, corresponding to roughly 12 of the Crab flux above 1 TeV. The source is considered as a point source with an upper limit of its Gaussian width extension of 0.18∘ at 95% CL.
The spectral shape of the GDE is assumed to follow a simple power law. It is important to notice that the GDE component of the model adopted includes not only the emission from the interactions between CRs and interstellar gas/radiation fields, but also all the emission from sources below the HAWC detection threshold. For a pivot energy of E0 = 7 TeV, the best values for the fitted GDE parameters are: spectral index (stat.) (syst.), and flux normalization (stat.) (syst.). The TS for the GDE component is 62.
The result of the likelihood fit is susceptible to the effects of systematic errors. Based on previous HAWC studies we considered the following effects: angular resolution mismodeling, late light simulation, charge uncertainty, absolute PMT efficiency, PMT threshold. For further details on each of these effects see (Abeysekara et al., 2017a, 2019). We changed the instrument response, which is modeled using Monte Carlo simulations, to probe the effects mentioned before. Apart from those effects, we also considered the impact of an asymmetric PSF on the total flux measured using simulations. To get a total systematic uncertainty, all possible systematic uncertainties were added in quadrature. Finally, studies done for the third HAWC catalogue (Albert et al., 2020b) showed that there is a systematic error on the absolute pointing of the order of 0.2∘ for the region studied here. This systematic is expected to shift the location of the sources in our analysis in a single direction. In any case, even a shift of 0.5 deg would not change the conclusion of the paper, as it is discussed later. We also tested the systematic uncertainties coming from a possible mismodeling of the morphology of HAWC J1825-138, and in particular the impact on HAWC J1825-134. The study indicates that this effect is smaller than other detector systematic uncertainties.
All the spectra of the relevant sources are plotted in Figure 2. The flux points are obtained following the prescription presented in (Abeysekara et al., 2019) where, for a given energy range, the flux normalization is fitted while keeping fixed the other parameters in the model. When the TS of a given point is below 4, then an upper limit is set for this point at 90% CL using the Profile Likelihood method (Venzon & Moolgavkar, 1988). The energy ranges, for which the uncertainty bands are displayed, are computed using the hard-cutoff method explained in (Abeysekara et al., 2017a) for a 68% CL. Using the same method we can test the maximum energy of the new source, HAWC J1825-134, for which the likelihood fit shows no evidence of a spectral cutoff or break. In this case, the lower limits on the maximum photon energy are 163 (syst.), 209 (syst.), and 312 (syst.) TeV for CL of 99.7, 95, and 68% respectively. These values are consistent with the ones reported in another HAWC analysis (Albert et al., 2020c) using a different energy estimator and modeling.
4 Discussion
The TeV -ray emission from HAWC J1825-134 can in principle be produced by either PeV CR protons colliding with the ambient gas (hadronic mechanism) or by sub-PeV to PeV electrons upscattering the cosmic microwave background (CMB) photons through Inverse Compton scattering (IC) (leptonic mechanism).
There are however several arguments why a major contribution to the emission of HAWC J1825-134 from the leptonic mechanism is unlikely. To reach energies of 200 TeV in up-scattered photons as measured by HAWC, we have to assume electron energies of at least 200 TeV or more, the median energy of these electrons being roughly 500 TeV (Aharonian, 2004). The leptonic population has in fact no cutoff (Section B). These electrons could be in principle accelerated either in nearby pulsars or SNRs.
In SNRs the acceleration time of 500 TeV electrons in the Bohm regime and for fast shock speed, of 2000 km/s, would be , where and =1 for Bohm diffusion. The acceleration time, yr (Aharonian, 2004), would thus be longer than the ages of any nearby SNR. The way to shorten the acceleration time would be to increase the B field by at least a factor of 100-1000, then 103-102 yr. However, in this case the synchrotron cooling time, yr would be extremely short, of the order of two years or even less. Effective acceleration implies strongly amplified magnetic fields, which in turn cause the electron synchrotron cooling time to be extremely short. Thus, SNR acceleration of electrons is disfavored by acceleration and cooling time arguments.
If nearby pulsars accelerated electrons up to 500 TeV, the shortest acceleration time would be yr for extreme accelerators working at the highest possible rate in Bohm regime (Abramowski et al., 2016). These electrons would have to diffuse from the pulsars to the entire HAWC J1825-134 region. The magnetic field B in dense gas regions such as HAWC J1825-134 is known from Zeeman measurements in molecular cloud cores (Crutcher et al., 2010). The correlation between magnetic field strength and gas density is B G. Within HAWC J1825-134 the average gas density is n=700 cm-3 (see Section C), which corresponds to an average B 27 G. The cooling time and the distance travelled by the electrons are both proportional to . The cooling time for 500 TeV electrons in a B field of 27 G would be roughly 28 yr, giving a maximum range of about 8 pc for particles travelling at the light speed, whereas the distance to travel from the closest pulsar, PSR J1826-1334, is of 30 pc. Furthermore, the regime of particle transport depends upon the level of turbulence. In turbulent HII regions, such as the region of HAWC J1825-134, one expects the particle diffusion coefficient to be strongly suppressed, so that particles diffuse at least tens to hundreds of times slower than in the average Galactic interstellar medium. In summary, the escape of such energetic electrons from the accelerator and their propagation from the local pulsars to the region of HAWC J1825-134 would require weak magnetic fields and extremely fast diffusion, which are unrealistic conditions in regions of high gas density (for further information see Section C). In Section B we discuss the effect of the uncertainty on the HAWC J1825-134 fit location for the leptonic scenario.
The major contribution to the emission from HAWC J1825-134 likely comes from PeV protons colliding off the ambient gas and producing which immediately decay into hundred TeV photons. The spectrum of the CR population producing the HAWC emission is a pure power law with spectral index -2.30 0.12 and without cutoff, as obtained with a Naima fit (Zabalza, 2016). A lower limit for the maximum energy of the protons producing the HAWC J1825-134 emission is 1.3 PeV at 95% confidence level (CL). The total CR energy budget required to explain the HAWC radiation above 10 TeV is Wp = 1.2 10 erg. For an estimated ambient gas density of 700 cm-3 (see Section C) the cosmic ray energy density above 10 TeV, wp, is 0.3 eV/cm3, which is about 300 times higher than the locally measured CR energy density above 10 TeV (Adriani et al., 2019). Such a high cosmic ray density is likely produced by a currently operating accelerator inside HAWC J1825-134 or very close to the HAWC source. Extrapolating the proton spectrum to GeV energies, the required energy budget would be Wp = 3.4 10 erg above 1 GeV.
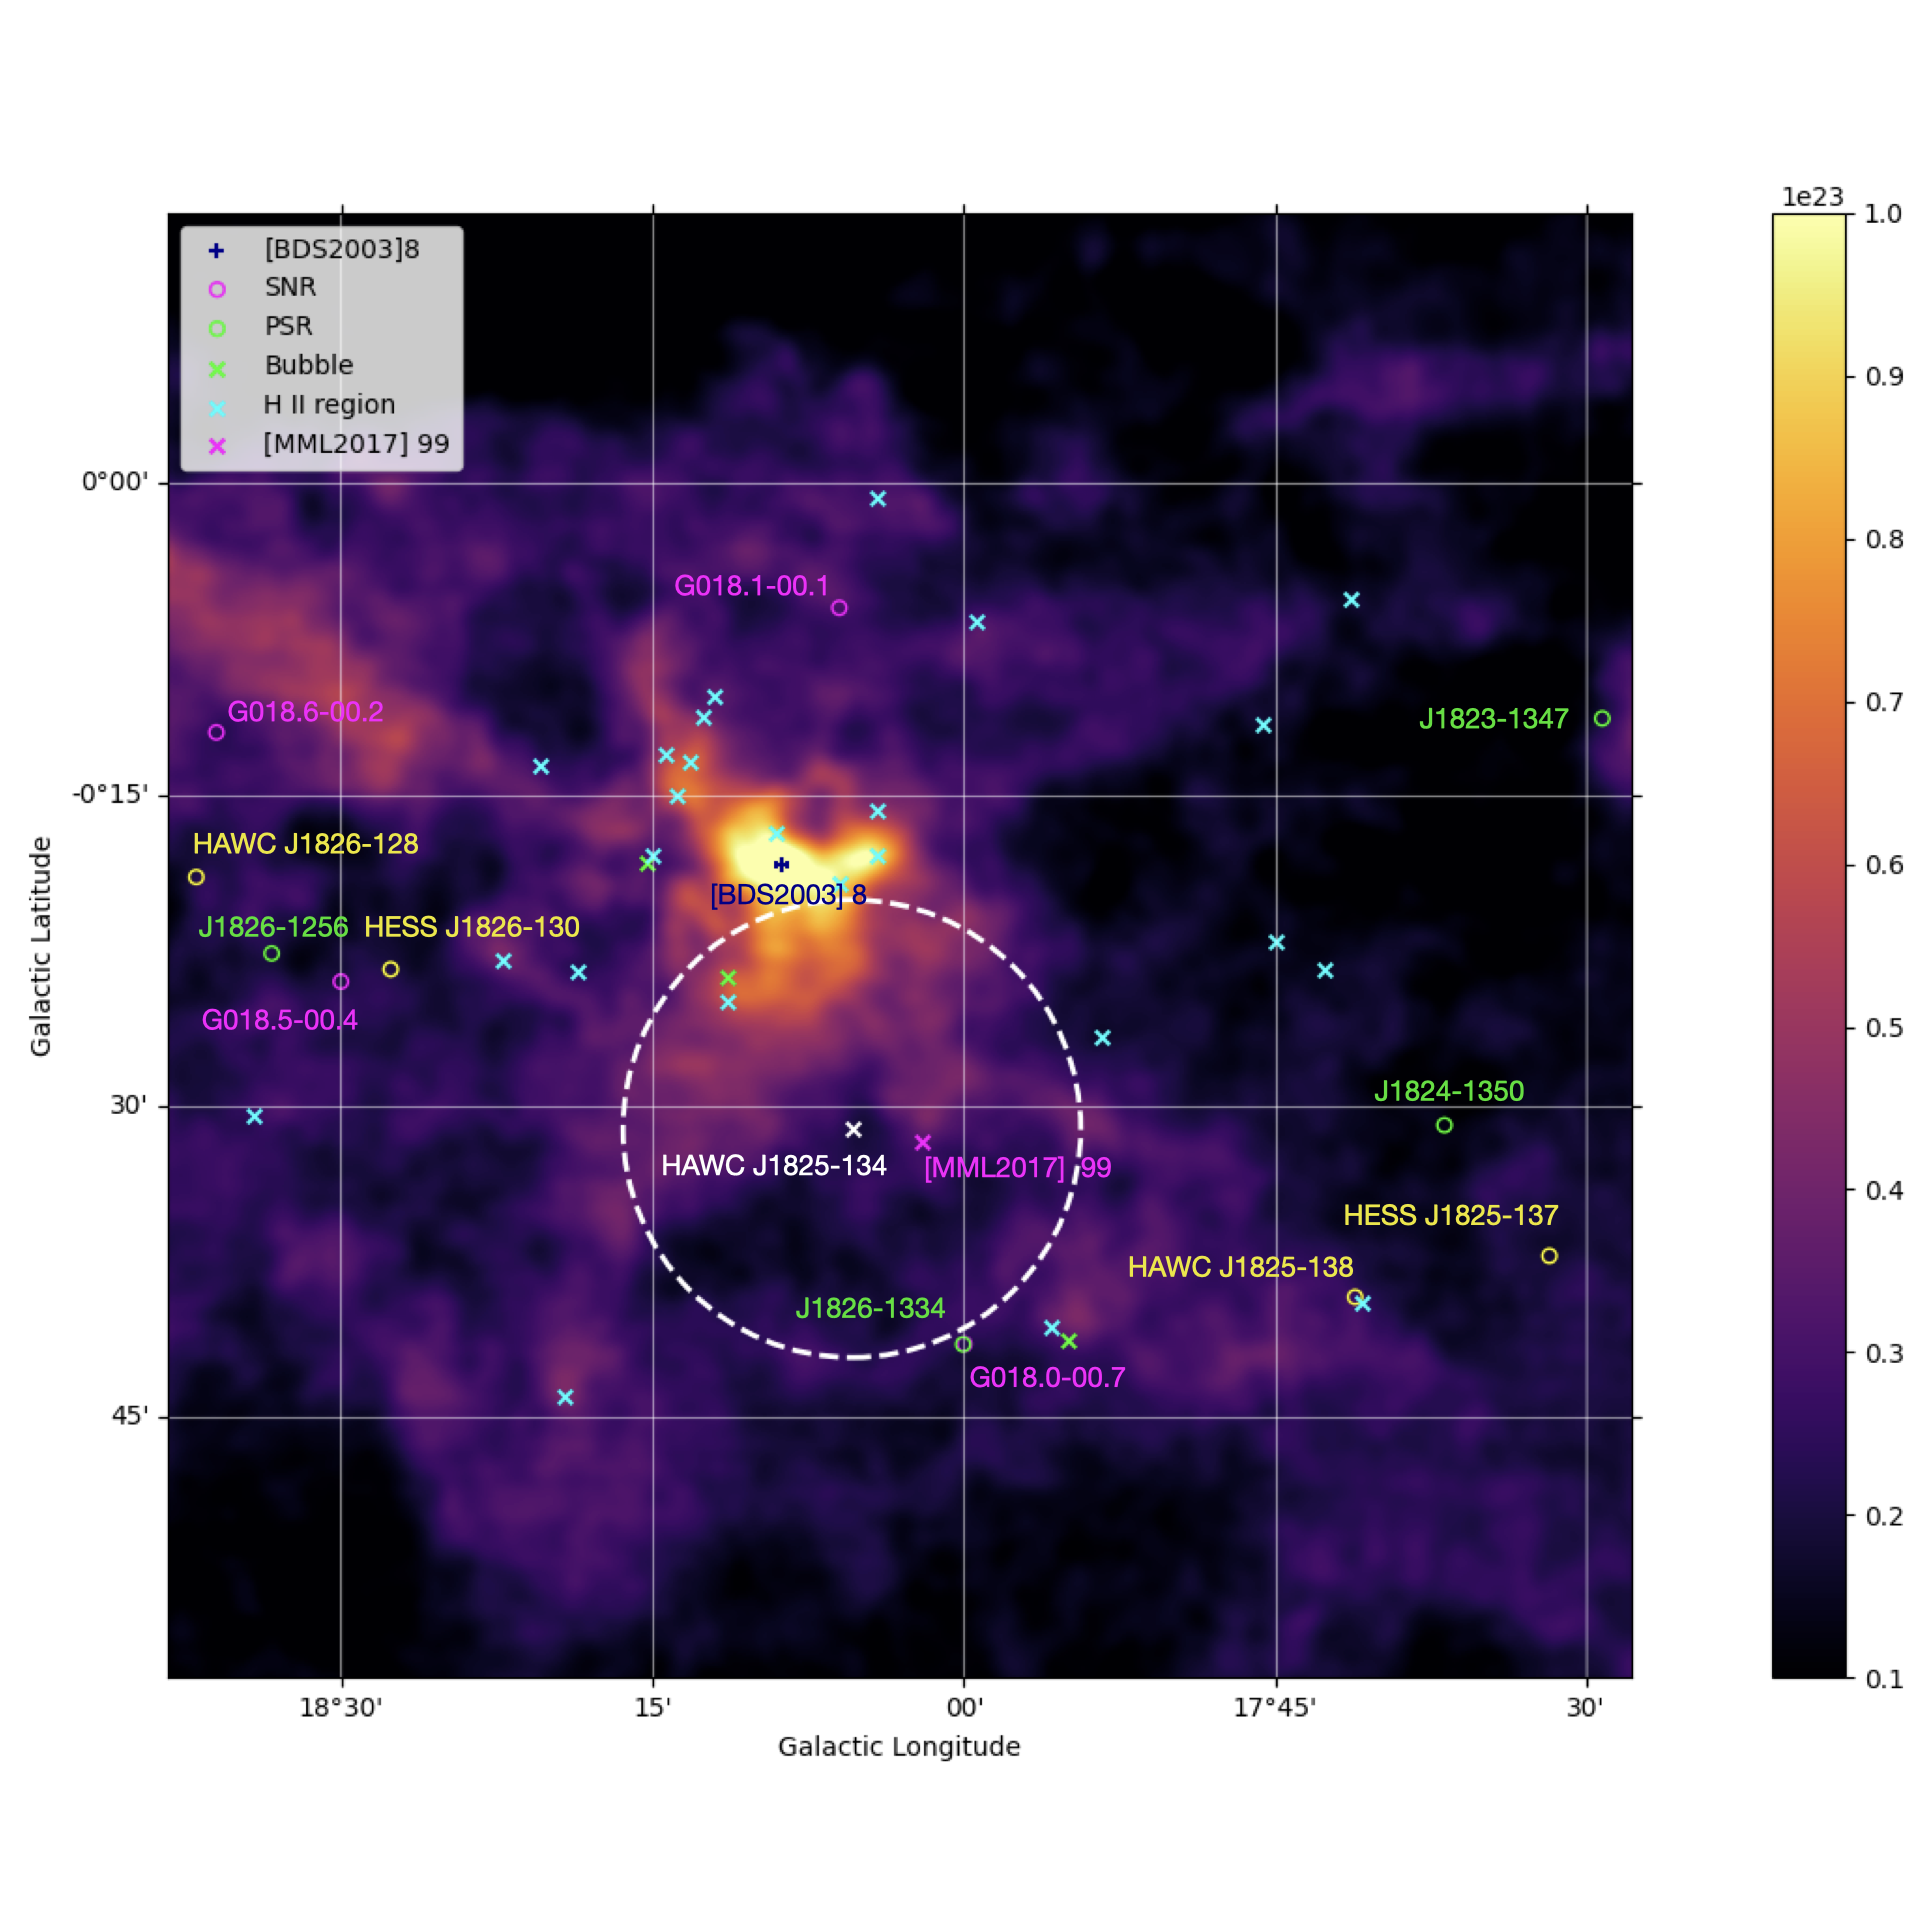
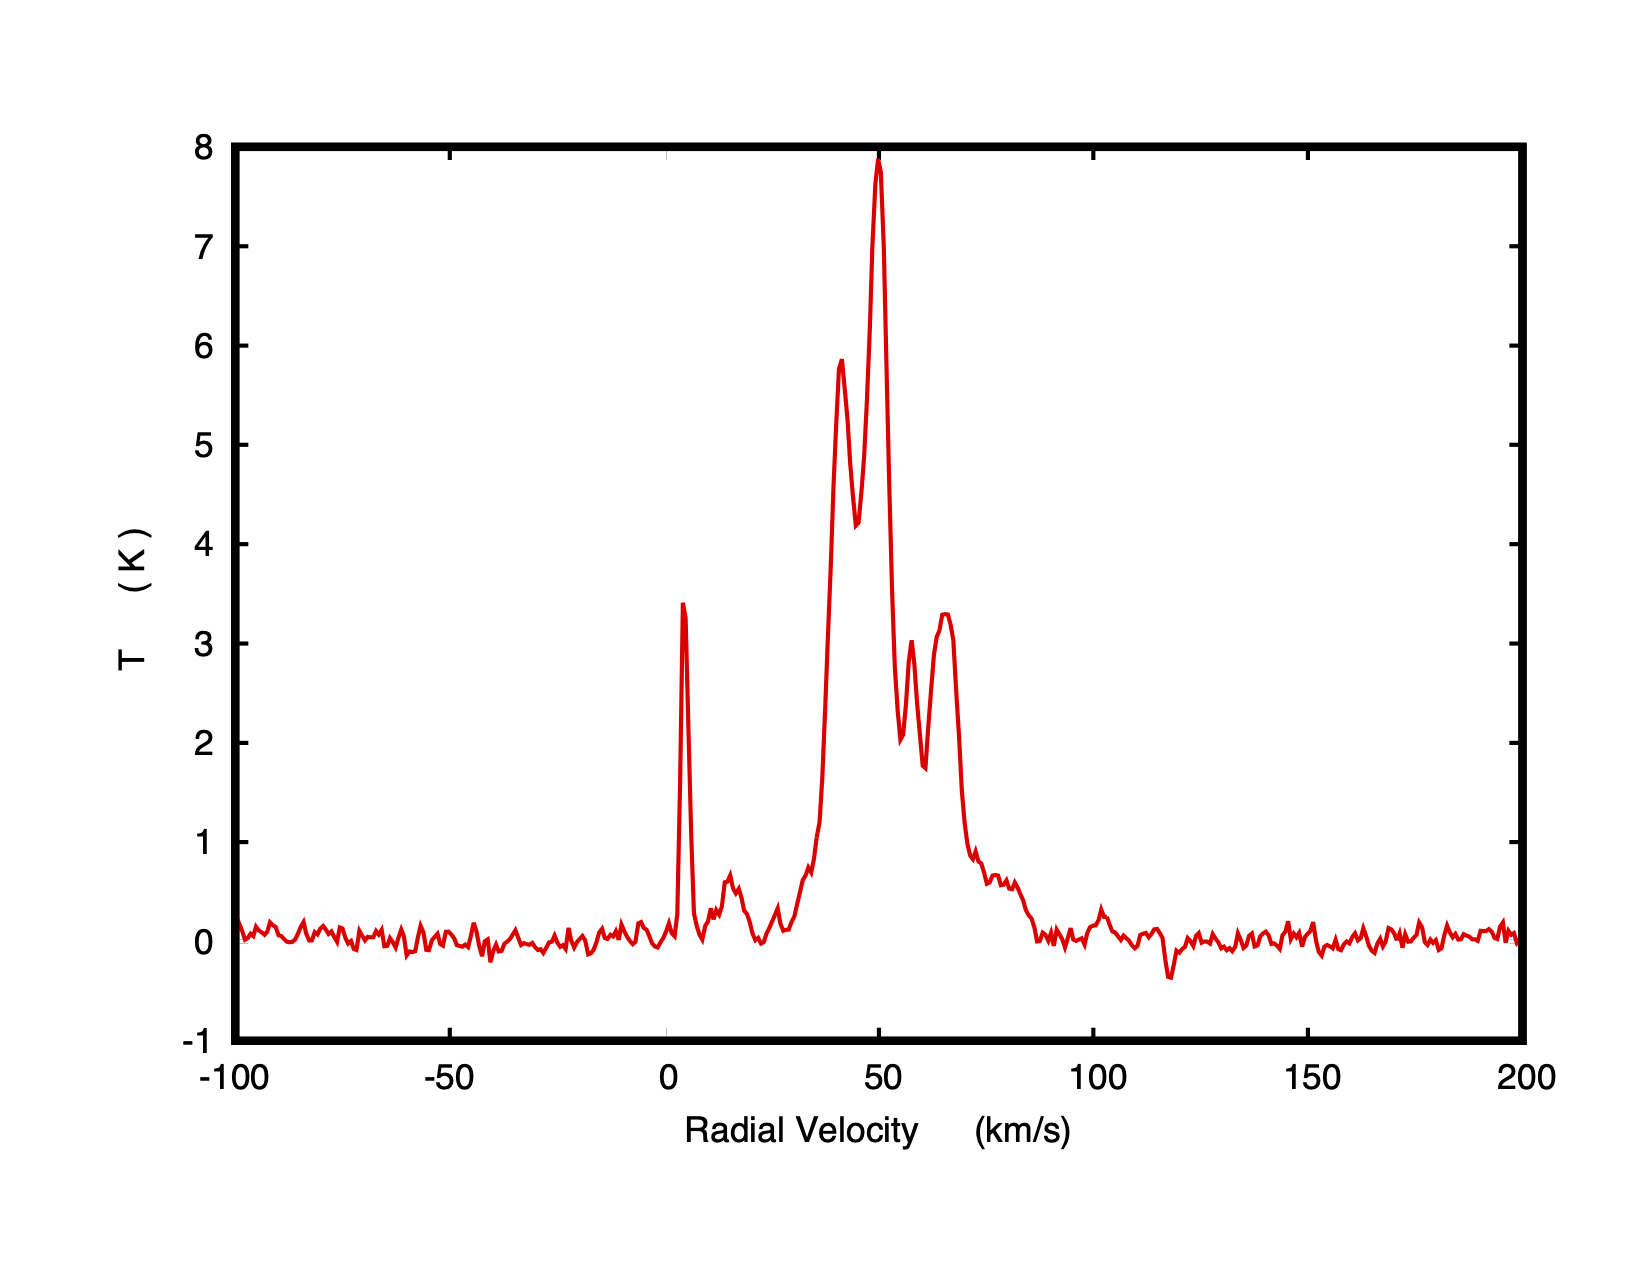
In Figure 3, the distribution of ambient molecular gas in the region of HAWC J1825-134 is shown by integrating the intensity of the 12CO(1-0) line measured by the FUGIN survey (Umemoto et al., 2017) over a range of velocities between 40 and 60 km/s corresponding to the peak in the gas spectrum from the HAWC J1825-134 region (see Figure 4 in Section C). Using the estimation of radial velocity as a function of direction (due to Galactic rotation) the range between 40 and 60 km/s radial velocity at Earth corresponds to a distance between 3 and 4 kpc (Brand & Blitz, 1993). The hundred TeV emission is associated with a very bright peak in the distribution of the molecular gas, which is consistent with a hadronic scenario for the origin of the emission at the highest energies. Furthermore, the best fitted position of HAWC J1825-134 is compatible with the position of the giant molecular cloud 99 of the (Miville-Deschênes et al., 2017) catalogue (see Figure 3). The cloud with an angular extension of 0.36∘ has a radial velocity of 48 km/s corresponding to 3.9 kpc near distance and a mass of 4.5 105 solar masses.
In Figure 3 the best fitted position of the new HAWC source is shown in white cross. Known pulsars, SNRs, stellar clusters, and molecular clouds are marked on the plot. The SNR G018.1-00.1 or the SN progenitors of the pulsars, PSR J1826-1334 or PSR J1826-1256, are not likely the sources of PeV protons because of their ages of 5-9 kyr, 21 kyr and 14 kyr, respectively (Leahy et al., 2014; Ferrand & Safi-Harb, 2012). PeV protons accelerated in these SNRs would have since escaped the whole region, unless the particle diffusion coefficient were locally suppressed by a factor of 1000 for G018.1-00.1 (assuming an age of 5 kyr (Leahy et al., 2014)) or more for the others. Additionally the distance of G018.1-00.1 is 6.4 0.4 kpc (Leahy et al., 2014) and the SNR G018.26-00.2 (SNR distance of 4.6 0.2 kpc) is located beyond 0.5o from the centre of the HAWC emission.
As suggested by (Amato & Arons, 2006) TeV protons could be accelerated in pulsars. PeV protons producing the radiation from HAWC J1825-134 could be accelerated in one of the nearby powerful pulsars, PSR J1826-1334 or PSR J1826-1256. These pulsars have a total energy budget amounting to roughly 1048 ergs (the spin down luminosity of both pulsars is roughly 3 1036 erg/s and their age 15-20 kyr). Roughly 10 of the total energy could account for the total energy budget in CRs from HAWC J1825-134 above 1 TeV. The spin down luminosity might have been higher in previous phases of the pulsars. This would increase the total budget available. On the other hand assuming a spherically symmetric diffusion of the accelerated hadrons from the pulsars, one expects that the trajectory of only a small fraction of these particles would lead them to collide with the gas in the cloud, making the required energy output in CRs from the local pulsars higher than the total spin down luminosity.
Located near the HAWC new point source, the 2MASS young star cluster, [BDS2003] 8, indicated in Figure 3 with a blue cross, is about 1 million years old and at a distance of about 4 kpc from the Earth. The cluster is thus at the same distance from us as GMC 99 (Bica et al., 2003; Kharchenko et al., 2016). The typical total kinetic energy of OB winds in young star clusters is about 5 1038 erg/s, which over the cluster lifetime of 1 million years produces a total of 1.5 1052 ergs. A very small fraction of this energy needs to be channeled into proton acceleration to explain the emission measured from HAWC J1825-134. Both from energetic considerations and from its position, [BDS2003] 8 is the most likely source of the PeV cosmic rays producing HAWC emission. The presence of several turbulent cloud clumps, bubbles (green crosses in Figure 3) and HII regions (cyan crosses in Figure 3) within HAWC J1825-134 is likely to favor the confinement of PeV cosmic rays, which would otherwise quickly escape the region. The discovery of HAWC J1825-134 supports the hypothesis that young star clusters are important contributors to the Galactic CR spectrum up to the knee as argued recently by (Aharonian et al., 2019; Hona et al., 2020).
Finally high energy neutrinos are expected to be produced in the same proton-proton collisions which produce hundred TeV -rays. Indeed, the 1040 TeV event 14 in the public Ice Cube high energy event list (Aartsen et al., 2014) is compatible with originating from the HAWC J1825-134 region. However, due to the angular resolution of this Ice Cube shower event (10-15 deg), it is not possible to conclusively associate it to the HAWC source. On the other hand, first estimations of the detectability of this source for the upcoming northern neutrino telescope, KM3NeT, are promising (Niro et al., 2019).
5 Conclusions
In summary we report the discovery of the -ray source, HAWC J1825-134, whose spectrum extends well beyond 200 TeV without evidence of a cutoff or break in the spectrum. The source is found to be coincident with a region where the density is as high as 700 protons/cm3 and with the giant molecular cloud 99 of (Miville-Deschênes et al., 2017) catalogue. Although from HAWC data we can not exclude that the new source is coincident with the pulsar PSR J1826-1334 location, we found that this scenario is disfavored. Therefore PeV cosmic ray protons colliding with the ambient gas likely produce the observed radiation. We argue that the possible source of these multi PeV cosmic rays is the young star cluster, [BDS2003] 8. The high CR energy density needed to explain the emission can result from effective CR confinement within the turbulent region of HAWC J1825-134. While a definitive association to this young stellar cluster is still to be clarified, HAWC J1825-134 provides the -ray signature of an extreme accelerator along the Galactic Plane and will be an important target for the upcoming neutrino experiments, KM3NeT (Adrian-Martinez et al., 2016) and IceCube-Gen2 (Aartsen et al., 2014), and new -ray observatories like LHAASO Observatory (Bai et al., 2019), the SWGO Observatory (Abreu et al., 2019), and the Cherenkov Telescope Array (Acharya et al., 2018).
Appendix A Modeling studies
The model of the analysis includes two extended two-dimensional Gaussian-shaped sources (HAWC J1825-138 and HAWC J1826-128), one point source (HAWC J1825-134), and an extended GDE component. Other morphologies have been tested, in particular for HAWC J1825-138 a disk-shaped extended and an asymmetric Gaussian. However, none of these models yields a better agreement with data (see Table 2). We also tried an extended source hypothesis for HAWC J1825-134, however the 3ML fit gives large uncertainties for the fitted parameters so instead an upper limit to the extension was calculated, 0.18∘ at 95% CL.
We also tried different spectral assumptions. For a simple power law the 3ML fit does not converge, which is expected based on the curved trend shown by the flux points (see Figure 2 in the main text). A log-parabola (see for instance Eq. 2 in (Abeysekara et al., 2020a) as a reference for a log-parabola spectrum) was tested both for HAWC J1825-138 and HAWC J1826-128 (see Table 2). Finally a simple power law with an energy cut-off for HAWC J1825-134 was tested but again the 3ML fit does not converge. We use the Bayesian Information Criterion (BIC) (Schwarz, 1978) to compare the different models tested. The values are summarized in Table 2. Here, BIC = BICtest - BICref is the difference in BIC between the reference and tested model. The best model is the one minimizing the BIC value.
| Morphological model | BIC |
| HAWC J1825-138 Gaussian | 0 |
| HAWC J1825-138 disk | 37 |
| HAWC J1825-138 asymmetric Gaussian | 23 |
| Spectral model | BIC |
| HAWC J1825-138 Ecut + HAWC J1826-128 Ecut | 0 |
| HAWC J1825-138 logP + HAWC J1826-128 Ecut | 4 |
| HAWC J1825-138 Ecut + HAWC J1826-128 logP | 1.4 |
In order to check the possibility that HAWC J1825-134 comes from statistical fluctuations from either HAWC J1825-138 and/or HAWC J1826-128 we performed a Monte Carlo study where we simulated more than 2600 synthetic maps using the best fitted two-source model and Poisson fluctuations. Then we fitted with 3ML the simulated data sets with both the two-source model and the three-source model. None of these simulations reached the observed TS value, computed according to Eq. 3. To asses the statistical significance of the result, instead of using additional simulations, which is computationally expensive, we estimated the p-value of the observed TS extrapolating the simulated TS distribution. The simulation result shows that the three-source model is preferred at the 5.2 level, showing that the source detection is not likely produced by a source contamination or statistical fluctuations.
Finally, we also found indications of energy dependent morphology for HAWC J1825-138, showing that the higher the energy the smaller the size. However, with the current statistical and systematic uncertainties this cannot be claimed at the moment. We expect that with a larger HAWC dataset it can be confirmed.
Appendix B Uncertainty in the source location and leptonic mechanism
Here we show why the conclusions on the severe electron cooling do not thus change when considering the uncertainty in the location of HAWC J1825-134. Accounting for the statistical and systematic uncertainties in the fitted location of the source, HAWC J1825-134, mentioned in the previous section, we checked that the column density within half a degree around the position of HAWC J1825-134 varies between 2.5 and 5 1022 cm-2, so that the gas density is n 600 cm-3 at 4 kpc, the magnetic field in the region, B 24 Gauss, and the electron cooling time, t 30 yr. If the electrons could travel at light speed they would cover at most the distance of 10 pc. In reality, the distance travelled should be orders of magnitude smaller if the severe suppression of the diffusion coefficient in dense gas regions is taken into account. The conclusions on the severe electron cooling do not thus change when considering the uncertainty in the location of HAWC J1825-134.
Finally let us assume that HAWC J1825-134 is coincident with the position of the pulsar, PSR J1826-1334. In this case one could think that the emission from HAWC J1825-134 is produced through IC scattering off CMB photons by high energy electrons accelerated in loco by the pulsar, if these are not cooled down through synchrotron emission. In order to constrain the magnetic field and thus the synchrotron losses in the region of HAWC J1825-134 we use Suzaku measurements of the X-ray pulsar associated to PSR J1826-1334. The magnetic field B inside the 0.15 deg extended X-ray nebula is 7 G (Uchiyama et al., 2009). Assuming that the same electron population producing the X-ray nebula emits also through IC above several tens of TeV, the predicted IC flux would be one order of magnitude lower than the flux measured by HAWC, following L 0.1(B/10 G) (Aharonian, 2004). We conclude that HAWC J1825-134 is unlikely to be produced by the pulsar, PSR J1826-1334.
Appendix C Gas Distribution
In order to estimate the total gas target for the PeV protons within HAWC J1825-134, 3D (l-b-v) cubes from the FUGIN survey of 12CO(1-0) emission line (HI4PI Collaboration et al., 2016; Umemoto et al., 2017; Voisin et al., 2016) and from the HI4PI survey of atomic hydrogen (HI4PI Collaboration et al., 2016) are integrated over the same range in velocity 40-60 km/s. This velocity range corresponds to a peak in the FUGIN 12CO(1-0) radial velocity spectrum as observed from Earth of HAWC J1825-134 region in Figure 4.
A conversion factor X=1.8 cm-2 K-1 km-1 has been used to translate the 12CO(1-0) column density in molecular hydrogen column density (Dame et al., 2001). The uncertainty on the conversion factor, which is of 30 , is also the source of uncertainty on the gas mass. The average gas column density from the region of HAWC J1825-134 amounts to about N = 3 1022 cm-2, of which about 10 is atomic hydrogen.
The ambient gas density is 700 cm-3, calculated under the assumption that the volume of HAWC J1825-134 is a sphere of radius r = 13 pc, corresponding to an extension of 0.18∘ (upper limit) at a distance of 4 kpc. The total gas mass within HAWC J1825-134 amounts to about 1.6 105 solar masses, of which 1-2 104 solar masses is contained in cold clumps. An estimate of the column density in cold clumps within the region of the new HAWC source can be obtained by making use of the intensity of the 13CO(1-0) line measured by the Galactic Ring Survey (GRS) (Jackson et al., 2006; Simon et al., 2001). This line intensity traces in fact the colder phase of the molecular gas aggregated in very dense gas regions and cloud clumps. The integration of the line over the range of velocities between 40 and 60 km/s yields an average column density of 2 1021 cm-2, corresponding to a total mass in cold clumps of 1.5 104 solar masses.
As we mentioned r=13 pc is an upper limit for the size of HAWC J1825-134 and the gas column density, N = , in a region of half a degree around the fitted position of HAWC J1825-134 varies between 2.5 and 5 1022 cm-2. Since the gas density is roughly n , a smaller size of the HAWC source, r’, would roughly increase the gas density by a factor 13pc/r’. A higher gas density would further support the main conclusion of the paper, namely the hadronic origin of the HAWC emission.
Appendix D Observation of the HAWC J1825-134 region by other -ray observatories
The region of eHWC J1825-134 was observed in TeV photons by H.E.S.S. and VERITAS, two air Cherenkov -ray observatories. The H.E.S.S. collaboration has detected two -ray sources, HESS J1825-137 (Abdalla et al., 2019) and HESS J1826-130 (Abdalla et al., 2020) in the region, whose location, morphology and energy spectra are consistent within uncertainties with HAWC J1825-138 and HAWC J1826-128. The source HAWC J1825-134 is however not detected by H.E.S.S., possibly because of its high-energy nature. Moreover, even if it is considered as point source, a small spatial extension, up to 0.18∘, is not excluded by this analysis which would make its detection more challenging for air Cherenkov observatories. Finally, the region has also been observed by the VERITAS collaboration (Abeysekara et al., 2020b), but with smaller exposure time, and therefore, less sensitivity than the H.E.S.S. observation.
References
- Aartsen et al. (2014) Aartsen, M., et al. 2014, Phys. Rev. Lett., 113, 101101, doi: 10.1103/PhysRevLett.113.101101
- Abdalla et al. (2018) Abdalla, H., et al. 2018, Astron. Astrophys., 612, A1, doi: 10.1051/0004-6361/201732098
- Abdalla et al. (2019) —. 2019, Astron. Astrophys., 621, A116, doi: 10.1051/0004-6361/201834335
- Abdalla et al. (2020) —. 2020, doi: 10.1051/0004-6361/202038851
- Abeysekara et al. (2017a) Abeysekara, A., et al. 2017a, Astrophys. J., 843, 39, doi: 10.3847/1538-4357/aa7555
- Abeysekara et al. (2017b) —. 2017b, Astrophys. J., 843, 40, doi: 10.3847/1538-4357/aa7556
- Abeysekara et al. (2019) —. 2019, Astrophys. J., 881, 134, doi: 10.3847/1538-4357/ab2f7d
- Abeysekara et al. (2020a) —. 2020a, Phys. Rev. Lett., 124, 021102, doi: 10.1103/PhysRevLett.124.021102
- Abeysekara et al. (2020b) —. 2020b, Astropart. Phys., 117, 102403, doi: 10.1016/j.astropartphys.2019.102403
- Abramowski et al. (2016) Abramowski, A., et al. 2016, Nature, 531, 476, doi: 10.1038/nature17147
- Abreu et al. (2019) Abreu, P., et al. 2019. https://arxiv.org/abs/1907.07737
- Acharya et al. (2018) Acharya, B., et al. 2018, Science with the Cherenkov Telescope Array (WSP), doi: 10.1142/10986
- Adrian-Martinez et al. (2016) Adrian-Martinez, S., et al. 2016, J. Phys. G, 43, 084001, doi: 10.1088/0954-3899/43/8/084001
- Adriani et al. (2019) Adriani, O., et al. 2019, Phys. Rev. Lett., 122, 181102, doi: 10.1103/PhysRevLett.122.181102
- Aharonian et al. (2019) Aharonian, F., Yang, R., & de Oña Wilhelmi, E. 2019, Nature Astron., 3, 561, doi: 10.1038/s41550-019-0724-0
- Aharonian (2004) Aharonian, F. A. 2004, Very high energy cosmic gamma radiation: a crucial window on the extreme Universe (World Scientific)
- Albert et al. (2020a) Albert, A., et al. 2020a, Astrophys. J. Lett., 896, L29, doi: 10.3847/2041-8213/ab96cc
- Albert et al. (2020b) —. 2020b. https://arxiv.org/abs/2007.08582
- Albert et al. (2020c) —. 2020c, Phys. Rev. Lett., 124, 131101, doi: 10.1103/PhysRevLett.124.131101
- Amato & Arons (2006) Amato, E., & Arons, J. 2006, Astrophys. J., 653, 325, doi: 10.1086/508050
- Anderson et al. (2014) Anderson, L. D., Bania, T., Balser, D. S., et al. 2014, The Astrophysical Journal Supplement Series, 212, 1, doi: 10.1088/0067-0049/212/1/1
- Bai et al. (2019) Bai, X., et al. 2019. https://arxiv.org/abs/1905.02773
- Bica et al. (2003) Bica, E., Dutra, C. M., Soares, J., & Barbuy, B. 2003, Astron. Astrophys., 404, 223, doi: 10.1051/0004-6361:20030486
- Brand & Blitz (1993) Brand, J., & Blitz, L. 1993, Astronomy and Astrophysics, 275, 67
- Cesarsky & Montmerle (1983) Cesarsky, C. J., & Montmerle, T. 1983, Space Science Reviews, 36, 173, doi: 10.1007/BF00167503
- Churchwell et al. (2006) Churchwell, E., et al. 2006, Astrophys. J., 649, 759, doi: 10.1086/507015
- Crutcher et al. (2010) Crutcher, R. M., Hakobian, N., & Troland, T. H. 2010, Monthly Notices of the Royal Astronomical Society: Letters, 402, L64, doi: 10.1111/j.1745-3933.2009.00802.x
- Dame et al. (2001) Dame, T., Hartmann, D., & Thaddeus, P. 2001, Astrophys. J., 547, 792, doi: 10.1086/318388
- Ferrand & Safi-Harb (2012) Ferrand, G., & Safi-Harb, S. 2012, Adv. Space Res., 49, 1313, doi: 10.1016/j.asr.2012.02.004
- HI4PI Collaboration et al. (2016) HI4PI Collaboration, Ben Bekhti, N., Flöer, L., et al. 2016, A&A, 594, A116, doi: 10.1051/0004-6361/201629178
- Hona et al. (2020) Hona, B., Fleischhack, H., & Huentemeyer, P. 2020, PoS, ICRC2019, 699, doi: 10.22323/1.358.0699
- Jackson et al. (2006) Jackson, J. M., et al. 2006, Astrophys. J. Suppl., 163, 145, doi: 10.1086/500091
- Kharchenko et al. (2016) Kharchenko, N., Piskunov, A., Schilbach, E., Röser, S., & Scholz, R.-D. 2016, Astronomy & Astrophysics, 585, A101, doi: 10.1051/0004-6361/201527292
- Leahy et al. (2014) Leahy, D., Green, K., & Tian, W. 2014, Monthly Notices of the Royal Astronomical Society, 438, 1813, doi: 10.1093/mnras/stt2323
- Manchester et al. (2005) Manchester, R. N., Hobbs, G. B., Teoh, A., & Hobbs, M. 2005, Astron. J., 129, 1993, doi: 10.1086/428488
- Miville-Deschênes et al. (2017) Miville-Deschênes, M.-A., Murray, N., & Lee, E. J. 2017, The Astrophysical Journal, 834, 57, doi: 10.3847/1538-4357/834/1/57
- Niro et al. (2019) Niro, V., Neronov, A., Fusco, L., Gabici, S., & Semikoz, D. 2019. https://arxiv.org/abs/1910.09065
- Parizot et al. (2004) Parizot, E., Marcowith, A., van der Swaluw, E., Bykov, A., & Tatischeff, V. 2004, Astron. Astrophys., 424, 747, doi: 10.1051/0004-6361:20041269
- Rho et al. (2018) Rho, C. D., Ayala, H., & Zhou, H. 2018, PoS, ICRC2017, 741, doi: 10.22323/1.301.0741
- Salesa Greus & Casanova (2020) Salesa Greus, F., & Casanova, S. 2020, PoS, ICRC2019, 781, doi: 10.22323/1.358.0781
- Schwarz (1978) Schwarz, G. 1978, Annals Statist., 6, 461
- Simon et al. (2001) Simon, R., Jackson, J. M., Clemens, D. P., Bania, T., & Heyer, M. H. 2001, Astrophys. J., 551, 747, doi: 10.1086/320230
- Uchiyama et al. (2009) Uchiyama, H., Matsumoto, H., Tsuru, T., Koyama, K., & Bamba, A. 2009, Publ. Astron. Soc. Jap., 61, 189, doi: 10.1093/pasj/61.sp1.S189
- Umemoto et al. (2017) Umemoto, T., Minamidani, T., Kuno, N., et al. 2017, Publications of the Astronomical Society of Japan, 69, doi: 10.1093/pasj/psx061
- Venzon & Moolgavkar (1988) Venzon, D. J., & Moolgavkar, S. H. 1988, Journal of the Royal Statistical Society Series C, 37, 87, doi: 10.2307/2347496
- Vianello et al. (2015) Vianello, G., Lauer, R. J., Younk, P., et al. 2015, The Multi-Mission Maximum Likelihood framework (3ML), https://github.com/threeML. https://arxiv.org/abs/1507.08343
- Voisin et al. (2016) Voisin, F., Rowell, G., Burton, M., et al. 2016, Mon. Not. Roy. Astron. Soc., 458, 2813, doi: 10.1093/mnras/stw473
- Wilks (1938) Wilks, S. 1938, Annals Math. Statist., 9, 60, doi: 10.1214/aoms/1177732360
- Zabalza (2016) Zabalza, V. 2016, PoS, ICRC2015, 922, doi: 10.22323/1.236.0922