A Unified Spectral Model for Accreting Neutron Stars
1 Introduction
Accretion flow around a black hole or a neutron star emits high energy radiations with varying spectral and temporal properties. Observed temporal variations point to the existence of a mechanism, dictated by the flow dynamics and not by the stellar surface or magnetic fields, that is common in both types of compact objects (Psaltis, Belloni, & van der Klis, 1999; Belloni, Psaltis, & van der Klis, 2002; Mauche, 2002). Spectral energy distributions of multiple sources indicate that the Comptonization process, the dominant mechanism for changing states in X-ray, takes place inside the flow which has similar physical properties in both the objects (Barret, 2001; Barret & Olive, 2002; Paizis et al. 2006; Mendez 2006). The two-component advective flows (TCAF, Chakrabarti 1995; Chakrabarti & Titarchuk 1995; Chakrabarti 1997) satisfy an array of such required properties and can thus be treated as a possible common solution when the magnetic field is low (Chakrabarti 2016; Bhattacharjee, & Chakrabarti, 2017; Bhattacharjee, 2018; Bhattacharjee & Chakrabarti, 2019). A TCAF based spectral model for the neutron stars to satisfactorily explain the observed spectral variations is therefore essential. Here we show that additional three physical parameters to existing TCAF solution hitherto applicable only for black holes, one can fit the spectra of accreting neutron stars and reproduce intricate features of two broad classes of sources (Van der Klis 1989), viz., Z and Atoll. We include soft photons from both the Keplerian disk (Shakura & Sunyaev 1973) and the normal boundary layer (Chakrabarti & Sahu, 1997; Bhattacharjee & Chakrabarti, 2017; 2019) of the star and compute the combined Comptonized spectra. Existing models used multiple phenomenological parameters to fit the spectra and provided limited insight into the physical processes and the variation of the geometry of the accretion flow (Bhattacharjee 2018). However, TCAF-based model maintains its robust geometrical configuration away from the compact objects while accommodating boundary layer(s) in the accreting matter around both the black holes and neutron stars. To our knowledge, ours is the first physical model which tries to unify the accretion flow solutions in presence of these compact objects.
2 Method
The TCAF solution (Chakrabarti, 1989; 1990; 1995; Chakrabarti & Titarchuk 1995; Chakrabarti 1997) has been used to explain to spectral and timing properties of stellar mass black holes in a self-consistent manner for multiple transient, persistent and class variable sources (Debnath et al. 2014; Bhattacharjee et al. 2017; Banerjee et al. 2019; Banerjee et al. 2020). The paradigm was also applied to Neutron Stars with some modifications using Monte Carlo simulations for the thermal Comptonization process (Bhattacharjee & Chakrabarti, 2017). We use the empirical results of Bhattacharjee and Chakrabarti (2017, 2019) to modify the spectral code of TCAF for Neutron Stars by adding three new physical parameters (parameters 5-7 below) which are required to capture physics around ever-present boundary layer in Neutron Stars.
2.1 Description of Model
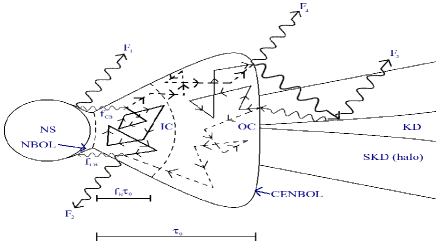
We use the following parameters in the spectral code TCAF Around Neutron Stars or TANS (Figure 1): 1. : disk (or Keplerian) accretion rate (in ), 2. : halo (or sub-Keplerian) accretion rate (in ), 3. : location of the outer shock (=truncation radius of the disk) (in ), 4. : compression ratio of the outer shock, 5. : temperature of the Normal BOundary Layer or NBOL (in keV), 6. : fraction of NBOL photons intercepted by CENBOL (and vice-versa), 7. : transparency factor of the inner cloud. If the optical depth of the entire CENBOL is , inner cloud transparent to the star till , ). Here is the Eddington rate for the Neutron Star and , is its Schwarzchild radius. For the present version of the code we kept the mass of the star constant at . A single suitable normalization (N) is required to match observed spectra with the theoretical one across spectral states. In Fig. 1, we show schematically how the seed soft photons from the NBOL and the KD are Comptonized by CENBOL electrons and are emitted to the observers. The expected TCAF configuration around a Neutron star has two components of accretion, namely, Keplerian Disk (KD) and sub-Keplerian or halo (SKD). The CENtrifugal pressure dominated BOundary Layer (CENBOL), which is the truncation radius of KD, serves as the Comptonizing region. The subsonic post-shock matter inside CENBOL hits the Neutron Star surface after passing through the inner shock which is the outer edge of the Normal BOundary Layer (NBOL). Seed photons from KD and NBOL are intercepted by CENBOL and are reprocessed to higher energy which reach the observers either directly or after getting reflected by the KD or NBOL. NBOL and KD dominantly interact with different regions, namely the Inner Cloud (IC) and the Outer Cloud (OC) respectively, of CENBOL due to proximity effects (Bhattacharjee and Chakrabarti 2017). The separation is characterized by a parameter , where inner cloud extends up to optical depth of from the NBOL. Fraction of photons received by CENBOL from NBOL and vice-versa is determined by . The final spectrum is obtained by combining the four fluxes: , , , and . Here, is the effective flux from NBOL (Blackbody+Thermally reprocessed), is Comptonized flux from the inner cloud, is the Comptonized flux from the outer cloud, and is the effective flux from KD (multicolour Blackbody+Thermally reprocessed).
3 Results
3.1 Computation of Spectra
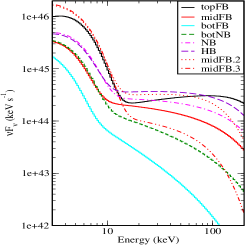
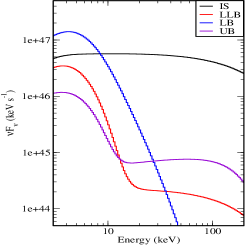
In Fig. 2, we give examples of our computation of a few typical spectra of the generalized flow configuration TANS as the parameters are varied in order to impress that our model is capable of reproducing observed spectra in Horizontal Branch (HB), Normal Branch (NB; Bottom Normal Branch: bot NB), and Flaring Branch (Bottom: bot FB; Middle: mid FB; Top: top FB). The computational parameters for all the cases are listed in Table 1. In Fig. 3 we show that the Island Branch (IS), Lower Left Banana Branch (LLB), Lower Banana Branch (LB), and Upper Banana Branch (UB) spectra can be generated by our model as well. For the set of parameters for these cases, see Table 2.
| No. | Class | ||||||
|---|---|---|---|---|---|---|---|
| S1 | HB | 1.5 | 2.0 | 15.0 | 0.60 | 0.10 | 0.500 |
| S2 | NB | 1.5 | 1.5 | 15.0 | 0.60 | 0.10 | 0.500 |
| S3 | bot NB | 2.0 | 1.0 | 15.0 | 0.60 | 0.50 | 0.500 |
| S4 | bot FB | 2.5 | 0.5 | 15.0 | 0.60 | 0.50 | 0.250 |
| S5 | mid FB | 1.5 | 1.5 | 15.0 | 0.60 | 0.25 | 0.250 |
| S5.2 | mid FB | 1.5 | 2.5 | 30.0 | 1.00 | 0.25 | 0.250 |
| S5.3 | mid FB | 1.5 | 2.5 | 30.0 | 1.00 | 0.10 | 0.125 |
| S6 | top FB | 0.5 | 2.5 | 15.0 | 1.00 | 0.05 | 0.125 |
| No. | Class | ||||||
|---|---|---|---|---|---|---|---|
| S7 | IS | 0.5 | 0.5 | 45.0 | 0.20 | 0.95 | 0.500 |
| S8 | LLB | 1.0 | 1.5 | 15.0 | 1.00 | 0.25 | 0.125 |
| S9 | LB | 0.5 | 0.5 | 30.0 | 0.60 | 0.95 | 0.500 |
| S10 | UB | 2.0 | 2.5 | 15.0 | 1.00 | 0.05 | 0.125 |
3.2 Generation of Z and Atoll tracks
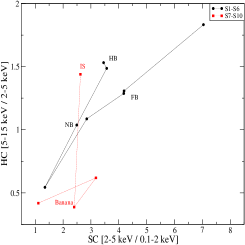
In Fig. 4, we present colour-colour diagrams of the same cases to show that the track characteristics of the transitions observed in Z and atoll sources can also be reproduced by us. These tracks in CCD can be compared with the tracks of observed X-ray spectra of Sco X-1 and 4U 1705-44 (van der Klis 1989). Fig. 2 and Fig. 4 show that the model-generated spectra captures the transitions in 3.0-200.0 keV energy range for a Z type source and traces out the ‘Z’ in the CCD. In Figs. 3 and 4, model generated spectra shows the transitions in the same energy range. The distinct Island state and Banana tracks are seen in Fig. 4 for the set of parameters used in Table 2. For consistency, the normalization (N) is kept constant for all simulated spectra. Both HC and SC were scaled by a multiplicative factor of 5 for S1 to S5 to show variations in the same plot, in Fig. 4. It can be seen by comparing S5 and S6 with S5.2 and S5.3 (Table 1), that the parameters reported here have a complex effect and in no way uniquely represent a particular state in spectra or the CCD.
3.3 X-Ray Spectral Fits
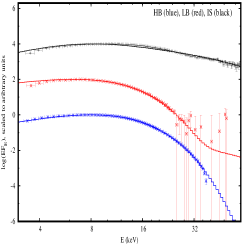
In Fig. 5, we attempt to fit manually a few observed spectra in the keV energy range without adding the absorption properties at low energies. For this purpose we use the standard product data of RXTE/PCA, obtained through NASA’s XAMIN archives and using the HEASOFT package under HEASARC. We obtained reasonable agreement between the theoretical and the observed spectra, especially in the keV range. Below 5 keV, the deviation is due to non-inclusion of absorption. The fit parameters are noted in Table 3. Here, we presented examples of applications of the spectral model TANS for accreting Neutron Stars. We showed that with only seven independent parameters, we can reproduce spectra of all the observed states and also generate the tracks for the transitions between different branches of Z and Atoll sources. Though our code is yet to be integrated with a spectral fit software, we find encouraging signs that observed spectra of several sources could be fitted manually with reasonable accuracy with these seven parameter model alone. In all the cases we do not change the normalization as our spectra from theoretical consideration with self-consistent Comptonization and reflection are generated as a whole across the states and the normalization is needed only to scale these theoretical spectra with the observed spectra. We also report three manually fitted spectra of an IS, a LB and a HB spectrum of two different objects to impress excellent fits are possible. The deviations of the fits at lower energies are primarily due to non-inclusion of the absorption due to inter-stellar medium ().
| Source | ||||||
|---|---|---|---|---|---|---|
| Sco X-1 | 1.5 | 1.0 | 10.0 | 2.10 | 0.65 | 0.325 |
| a4U 1705-44 | 0.5 | 2.5 | 15.0 | 0.60 | 0.925 | 0.950 |
| b4U 1705-44 | 1.5 | 2.5 | 15.0 | 1.80 | 0.25 | 0.425 |
4 Discussion
The model COMPTB (Farinelli & Titarchuk 2011) considers two separate and independent Compton clouds to successfully fit the spectra of multiple Z and Atoll sources (Titarchuk, Seifina & Shrader 2014; Seifina et al. 2015). In our model, the geometry is based on hydrodynamic solutions and thus removes the need for separate Compton clouds to obtain the spectra, which also reduces the number of parameters to seven, as compared to 10+ in the case of COMPTB. We had previously discussed the geometry obtained from TCAF for NS and the COMPTB geometry in Bhattacharjee & Chakrabarti 2017. In future, we would like to carry out a comparative study of spectral fitting using TANS and COMPTB. For the TANS model, we have assumed the neutron star to emit radiation in a spherically symmetric manner, with a uniform temperature . The spread of NBOL over the surface and the distribution of temperature of NBOL, depends on the complex inner boundary conditions of the star as well as the time-dependent behaviour of the accreting matter (for KD reaching NS: Inogamov & Sunyaev 1999; for SKD reaching NS: Bhattacharjee & Chakrabarti 2017, 2019), both of which are beyond the scope of this model. To account for the variation of spread of the boundary layer on the surface of the star and the consequent variation of intercepted fraction of photons from NBOL by CENBOL or vice-versa (both are proportional to the emitting area), we have introduced the factor as a free parameter. Similarly, the density distribution within the Comptonizing region is also time-dependent and grows rapidly very close to the surface, around the density jump or inner shock (Bhattacharjee and Chakrabarti 2019). We also know that the number of scattering a photon undergoes, , which strongly depends on the distribution of optical depth. As a result, most of the scattering required to produce the Comptonized spectra can be limited to a region very close to the NBOL, depending on the optical depth , as measured from the surface of the star. For a strong inner shock (or density jump) with high accretion rates, the density close to NBOL can be high enough where () will saturate close to NBOL. On the opposite end, for weak density jumps near NBOL and lower accretion rates, the optical depth of the cloud can be low enough to allow NBOL photons to scatter throughout the cloud, as and is low. In the model, we include these and other intermediate cases, by introducing the free parameter, transparency factor, . We want to conduct further detailed spectral analysis of multiple Z and Atoll sources to study the behavior of the parameters and , in near future, to modify the model or include more parameters, if needed. A detailed study of the variation of the computed spectra with all the flow parameters will be reported soon.
Acknowledgements.
AB acknowledges the computational support provided by SNBNCBS. SKC acknowledges support from the DST/SERB sponsored Extra Mural Research project (EMR/2016/003918) fund.References
- Banerjee (2019) Banerjee, I., Bhattacharjee, A., Banerjee, A., et al., 2019, Constraining Mass of Cygnus X-1 from Analysis of the Hard State Spectral Data using TCAF Solution, arXiv:1904.11644
- Banerjee (2020) Banerjee, A., Bhattacharjee, A., Debnath, D., et al., 2020, Spectral Analysis of Class Data of GRS 1915+105 Using TCAF Solution, RAA, 20(12), 208
- Barret (2001) Barret, D., 2001, The broad band x-ray/hard x-ray spectra of accreting neutron stars, Advances in Space Research, AdSpR, 28, 307
- Barret & Olive (2002) Barret, D., & Olive, J.-F., 2002, A Peculiar Spectral State Transition of 4U 1705-44: When an Atoll Looks Like a Z, ApJ, 576, 391
- Belloni (2002) Belloni, T., Psaltis, D., & van der Klis, M., 2002, A Unified Description of the Timing Features of Accreting X-Ray Binaries, ApJ, 572, 392
- Bhattacharjee (2018) Bhattacharjee, A. Generalized Flows Around Neutron Stars, Astrophysics and Space Science Proceedings, 53, 93, (2018).
- Bhattacharjee et al. (2017) Bhattacharjee, A., Banerjee, I., Banerjee, A., et al., 2017, The 2004 outburst of BHC H1743-322: analysis of spectral and timing properties using the TCAF solution, MNRAS, 466, 1372
- Bhattacharjee & Chakrabarti (2017) Bhattacharjee, A., & Chakrabarti, S. K., 2017, Monte Carlo simulations of thermal comptonization process in a two-component advective flow around a neutron star, MNRAS, 472, 1361
- Bhattacharjee & Chakrabarti (2019) Bhattacharjee, A., & Chakrabarti, S. K., 2019, Timing Properties of Shocked Accretion Flows around Neutron Stars in the Presence of Cooling, ApJ, 873, 119
- Chakrabarti (1989) Chakrabarti, S. K., 1989, Standing shocks in isothermal rotating winds and accretion, MNRAS, 240, 7
- Chakrabarti (1990) Chakrabarti, S. K., 1990, Standing shocks in isothermal rotating winds and accretion. II - Effects of viscous dissipation, MNRAS, 243, 610
- Chakrabarti (1995) Chakrabarti, S. K. Accretion Disks in Active Galaxies: The Sub-Keplerian Paradigm., Seventeeth Texas Symposium on Relativistic Astrophysics and Cosmology, 759, 546, (1995).
- Chakrabarti (1997) Chakrabarti, S. K., 1997, Spectral Properties of Accretion Disks around Black Holes. II. Sub-Keplerian Flows with and without Shocks, ApJ, 484, 313
- Chakrabarti (2016) Chakrabarti, S. K., 2016, Study of Accretion processes Around Black Holes becomes Science: Tell Tale Observational Signatures of Two Component Advective Flows, arXiv:1604.05955
- Chakrabarti & Sahu (1997) Chakrabarti, S. K., & Sahu, S. A., 1997, Bondi flows on compact objects revisited., A&A, 323, 382
- Chakrabarti & Titarchuk (1995) Chakrabarti, S. K., & Titarchuk, L., 1995, Spectral Properties of Accretion Disks around Galactic and Extragalactic Black Holes, ApJ, 455, 623
- Debnath (2014) Debnath, D., Chakrabarti, S. K., & Mondal, S., 2014, Implementation of two-component advective flow solution in xspec., MNRAS, 440, L121
- Farinelli (2011) Farinelli R., Titarchuk L., 2011, A New Comptonization Model for Weakly Magnetized, Accreting Neutron Stars in Low-Mass X-Ray Binaries, A&A, 525, A102
- Inogamov (1999) Inogamov N. A., Sunyaev R. A., 1999, Spread of matter over a neutron-star surface during disk accretion, Astron. Lett., 25, 269
- Mauche (2002) Mauche, C. W., 2002, Correlation of the Quasi-Periodic Oscillation Frequencies of White Dwarf, Neutron Star, and Black Hole Binaries, ApJ, 580, 423
- Mendez (2006) Méndez, M., 2006, On the maximum amplitude and coherence of the kilohertz quasi-periodic oscillations in low-mass X-ray binaries, MNRAS, 371, 1925
- Paizis (2006) Paizis, A., Farinelli, R., Titarchuk, L., et al., 2006, Average hard X-ray emission from NS LMXBs: observational evidence of different spectral states in NS LMXBs, A&A, 459, 187
- Psaltis (1999) Psaltis, D., Belloni, T., & van der Klis, M., 1999, Correlations in Quasi-periodic Oscillation and Noise Frequencies among Neutron Star and Black Hole X-Ray Binaries, ApJ, 520, 262
- Seifina (2015) Seifina E., Titarchuk L., Shrader C., et al., 2015, BeppoSAX and RXTE Spectral Study of the Low-mass X-Ray Binary 4U 1705-44: Spectral Hardening during the Banana Branch, ApJ, 808, 142
- Shakura & Sunyaev (1973) Shakura, N. I., & Sunyaev, R. A., 1973, Reprint of 1973A&A….24..337S. Black holes in binary systems. Observational appearance., A&A, 500, 33
- Titarchuk (2014) Titarchuk L., Seifina E., Shrader C., 2014, X-Ray Spectral and Timing Behavior of Scorpius X-1. Spectral Hardening during the Flaring Branch, ApJ, 789, 98
- Van Der Klis (1989) van der Klis, M. The Z/atoll Classification, Two Topics in X-Ray Astronomy, Volume 1: X Ray Binaries. Volume 2: AGN and the X Ray Background, 1, 203, (1989).