Slow Control System for PandaX-III experiment
Abstract
The PandaX-III experiment uses high pressure gaseous time projection chamber to search for the neutrinoless double beta decay of 136Xe. A modular slow control system (SCS) has been designed to monitor all the critical parameters of the experiment. It ensures the proper operation of the experiment as well as to provide necessary information for data corrections. The main subsystems of the experiment will be constantly monitored by the data collection module of the SCS, which collects data from sensors and sends them to the centralized database. When an alarm message is generated by the anomaly detection module, it will be sent to an alert website and related on-call experts immediately. A demonstrator of the SCS has been built for the PandaX-III prototype detector. The long-term test of it provided valuable experience for the final design of the SCS for PandaX-III.
1 Introduction
The purpose of the planned PandaX-III experiment [1] is to search for the neutrinoless double beta decay (NLDBD) of 136Xe isotope. It employs a high pressure gaseous time projection chamber (TPC) [2] locating in the CJPL-II, with 140 kg 90% 136Xe-enriched at the pressure of 10 bar. The TPC collects only ionized electron signals with 52 Micromegas detectors [3]. To achieve the required energy resolution of 3% full width at half maximum (FWHM), about 1% of TMA (Trimethylamine) will be mixed with xenon to enhance the ionization. A gas handling system is designed to pump the pipelines and the vessel, as well as to do the circulation to ensure the purity of the working gas. An internal calibration system is to inject 220Rn and 83mKr into the detector through the gas circulation loop [4]. Many parameters need to be monitored during the gas handling. In order to ensure the safe operation of the detector, the high voltage and the current of all the Micromegas need to be monitored. The critical parameters of the other subsystems are also important for the running of the experiment and data analysis. In addition, abnormal states of the detector and the subsystems require a timely alarm to be handled in time.
We designed a slow control system (SCS) for the PandaX-III experiment, borrowed the modular idea from that in the PandaX-4T experiment [5]. A pool of clients collect data from different subsystems of the experiment and send them to the centralized database, which stores the value and timestamp of data. The evolution of data can be viewed through the web-based interface and the abnormal events can be detected. In comparison with that reported in Ref. [5], significant improvements on the data collection module have been made, and a new alert dispatching module has been created in this system, which will send alter messages to an alarm website and related people.
In this report, we present the design of the PandaX-III SCS and the demonstrator in this report. The design of the system, together with the improvements, are presented in Section 2. The integration of system is described in Section 3. The set up and operation of the demonstrator are introduced in Section 4. In the final section, Section 5, we give the conclusion.
2 System design
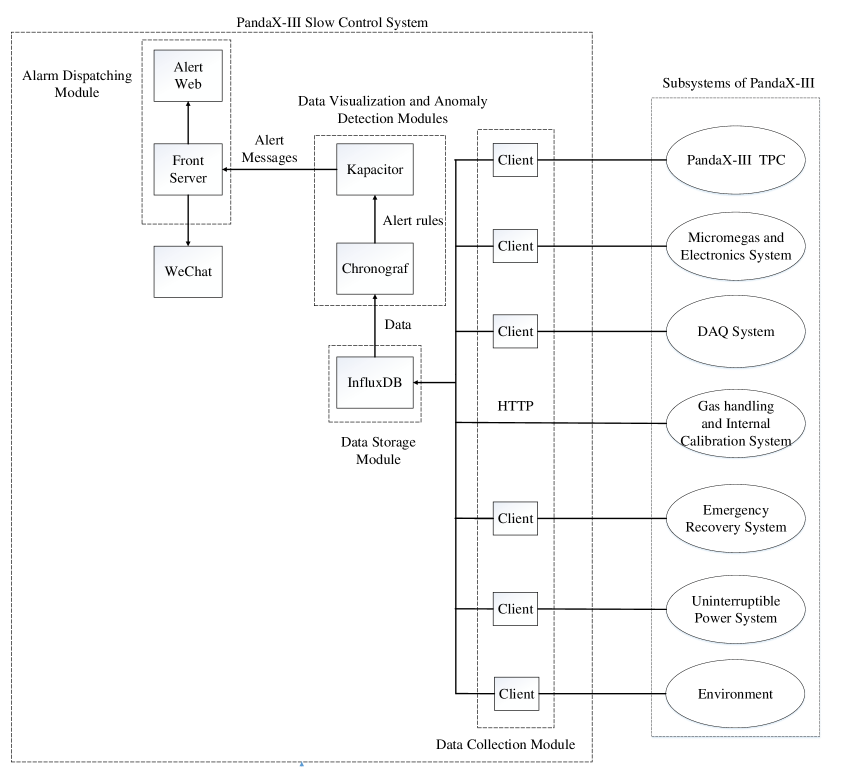
The SCS is composed of five modules, corresponding to the function of data storage, collection, visualization, anomaly detection and alarm dispatching. Each module is loosely coupled with others and can work standalone, simplifying the test and deployment of the system, and improving the fault tolerance. The data storage module provides a database for the whole system. It stores the history data of the monitoring parameters. The data collection module collects data from the subsystems of the experiment and sends them to the data storage module. The visualization module is used to display the evolution of the parameters over time. The anomaly detection module is responsible for the detection of unexpected change of the data and generates alert reports. The alert messages will be delivered to the alarm system and on-duty experts by the alert dispatching module.
2.1 Data storage module
The open-source database software of InfluxDB (version 1.7.9) [6], provided by InfluxData Inc., is used as the data storage module. It is optimized to store the time series data, expressed as measurements within the database. Each measurement is in the form of key-value pairs, where the key is the name and the value is the actual data. Arbitrary keys can be used during the insertion of a measurement. A set of tags, in the form of key-value pairs, can be added to the measurement to provide additional description of the data. Indices are built by InfluxDB automatically based on the tags to enable fast data selection.
InfluxDB provides application programming interfaces (APIs) over the hypertext transfer protocol (HTTP) for data insertion, querying and deletion, with the standard GET, POST, DELETE actions. This feature simplifies the development of related client programs. Once an instance of InfluxDB is started, a local port is exposed for the related access and no more works required, making the deployment of the module quite simple.
2.2 Data collection module
The data collection module contains many data collection clients, where each works independently and relies on specified hardware and software. The purpose of the clients is to acquire and decode the parameter values from the subsystems, and deliver them to the database.
The clients take different forms. For example, a Windows desktop program to control the high voltage (HV), developed with the C# language [7], is extended. So it can send the required data to the InfluxDB database directly. One of the most important form of the client is a Python-based [8] program running on Linux boxes. The program is inherited from that developed in PandaX-4T [5], with four significant improvements:
-
1.
The script is running in the “on-shot” mode (Appendix A.1) currently, which means they will read the data and send them to the database only once, then exit immediately. This mode simplified the management of multiple-processes and schedules, leading to a more robust system. To control the running of the script, we use the “Timer” feature provided by the system service manager [9]. In addition to the “Service” unit file, another “Timer” file is required to accomplish this task. Example codes of the control files for one client is given in Appendix A.2.
-
2.
For each readout values, the corresponding timestamp is determined by the client program currently, while in the previous implementation, it is generated automatically by the InfluxDB when the data is being inserted. Such an update results in more accurate time information, because the lagging from network connections cannot be avoid.
-
3.
The client program will write the readout values to a local file as a temporary data storage when InfluxDB cannot be reached for some reasons, and then fill all these values to the database when it is back, avoiding the loss of slow control information. The codes and an example of test are given in Appendix A.3.
-
4.
Additional types of data sources are supported by the program. The program can read data from text files in the format of comma-separated values(CSV), which are generated by third-party programs to control some of the subsystem periodically. The air conditional control program of the clean room currently being built is an example.
The low cost Raspberry Pi 4 Model B (Pi) single-board computers [10] are used to execute the client program to take data via the RS-485 [11] or RS-232 [12] protocols. During the test, more than ten external devices can be connected to the same Pi, with the help of serial to USB cables, RS-485 hubs and USB hubs. Several instances of the client program are running on the server host the database.
In general, a client program consumes about 20 MB of memory at running. Even the Pi has enough resource for many client programs to work at the same time. We estimate that only five Pi and one x86 server is enough for handling the hundreds of parameters in the SCS of PandaX-III.
2.3 Data visualization and anomaly detection modules
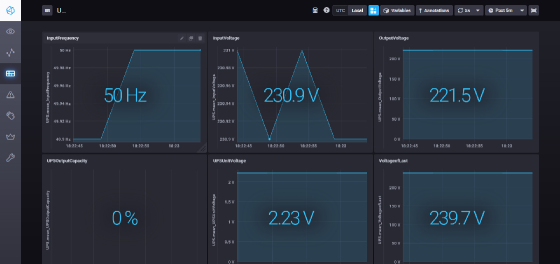
Chronograf (version 1.7.16), another open source software provided by InfluxData [6], is used as the data visualization module. It provides a web-based user interface to visit the data stored in InfluxDB. One can use the function of data explorer to investigate any measurement directly by constructing data queries by clicking mouse. The dashboard function provides an interface for the visualization of selected measurements in a predefined style. The user can create many dashboards, each for a group of interested measurements. The style of a dashboard can be customized easily. The queries constructed by the data explorer can be sent directly to any dashboards. This is convenient when new measurements are added to the database. An example of the dashboard is shown in Fig. 1. User can change the time range to display the data.
InfluxData also provides Kapacitor (version 1.5.3) [6], which is a data processing program integrated tightly with InfluxDB and Chronograf, and is used as the anomaly detection module of the SCS. The software can process incoming data in real time, and find the abnormalities according to rules defined by users using the Tickscript language. For example, a user can set the upper and lower limit for a measurement, then Kapacitor will generate an alert message when the value is out of range. The rules can be created directly in the “Alerting” interface provided by Chronograf. The content of the alert message can be customized. Kapacitor will also deliver the alert message to predefined event handlers, such as an email address or some web APIs operated by third-party Internet service providers. We use the “Post” event handler to send the alert messages to the alert dispatching module.
2.4 Alert dispatching module
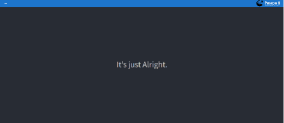
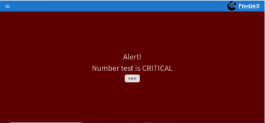
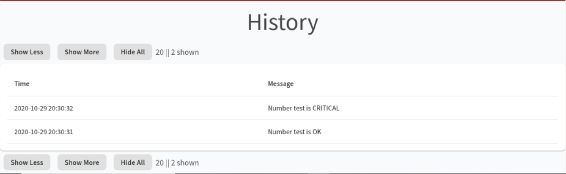
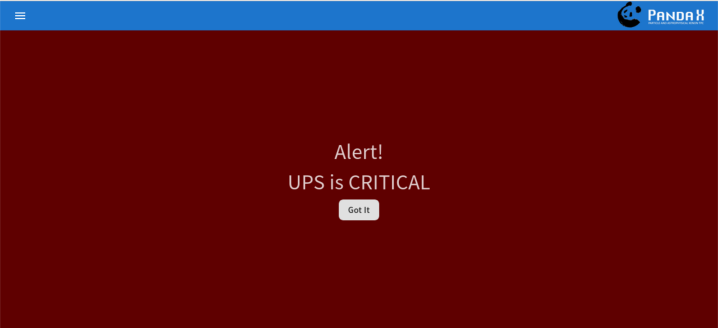
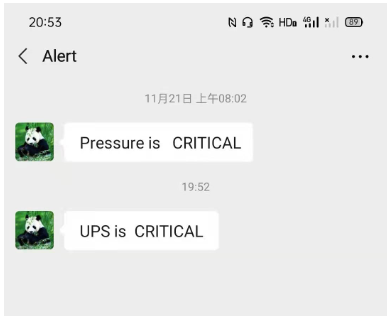
We created a web application as the alert dispatching module. The server-side is developed with the Python language, using the Falcon web framework [13] and the Gunicorn http server [14]. The server-side can accept the alert message produced by the Kapacitor. The message will be displayed on the web page and be sent to the Enterprise WeChat service provided by Tencent [15]. The browser-side of the application is developed with ReactJS [16]. It can display the current alert message and the alert history (see Fig. 2). Alarm sound will be played by the browser when an alert message arrives until it is acknowledged by the onsite people. Besides, remote experts will receive the alert message from the Enterprise WeChat from their smart phones. The list of remote expert names can be configured.
The design of the alert dispatching module enables the onsite people and remote experts to act in time at different scenarios of emergency. For example, when the sparking of the Micromegas detector happens, onsite people are expected to be aware of the situation immediately, and the loud alarm sound can be very convenient. The remote experts may provide necessary help to the onsite people, according to the alert information received.
3 Integration with the PandaX-III facility
The PandaX-III facility consists of six subsystems. The high pressure xenon gas detector is the core component of PandaX-III. The electronics, together with the Micromegas detector, are used to collect and amplify the electron signals. The DAQ system is responsible for the data taking. The gas handling system works for the gas circulation as well as the internal calibration. Xenon gas will be recovered at the time of emergency by the recovery system. Their work conditions are required to be monitored continuously. The uninterruptible power system (UPS) provides backup power supply to the experimental facility as well as the SCS in the occasions of power failure. Besides, the laboratory environment is also to be monitored. The integration of the SCS to these subsystems is shown in Fig. 3.
The data of the detector will be collected by the client programs running on the slow control server due to the short distance from the server rack to the detector. The most important parameters of the detector are the HV and the current of the cathode. They are indicators of the operation state of the experiment. The HV of cathode will be provided by the Matsusada AU HV power supplies [17], and can be readout via the serial to USB cable with RS232 protocol. Besides, a pressure sensor (model PRC-905[18]) produced by the HangZhou RunChen Technology Inc., will be placed inside the chamber to record the inner pressure of the TPC. The output voltage of the pressure sensor (ranging from 15 V) will be converted to digital signals, which will be collected by an instance of the client program via serial cable. A thermocouple will be used to measure the temperature of the TPC. The digital values will be collected and monitored in the same way.
The HV of the Micromegas detector and the input voltage of the front-end card (FEC) [19] are crucial for the collection and readout of the signals. They will be both provided by the CAEN SY2527 [20] multi-channel power supply system. Two slots of the system, with 16 output channels in total, are used for the HV of the Micromegas, while one slot with 8 channels is used for the power supply of the FEC. The values can be visited by the client program linked with a special library provided by CAEN running within the same TCP/IP network.
A Pi will be used to collect the data from the gas handling system. The most critical parameter is the flow rate, which represents the stability of circulation gas flow. The flow rate will be measured by a flow-meter (model MF5008 [21]), which generates analog signals. The signals will be converted to digital values by an analogy-digital converter (ADC) of the type DAM8082 [22], and sent to the SCS using RS485 protocol. The pressures in the gas pipelines and the weights of the quenching gas cylinders (TMA and Isobutane) of the system will be read out by using the same pressure sensor (model PRC-905). All the values are collected in the same way as that of the flow rate and displayed by digital instruments (model WSATC8030423HLP [23]). A RS485 hub (model UT-1208 [24]) will be used to combine the inputs to reduce the consuming of the USB ports. Pressure inside the TPC and power of the Agilent 305FS [25] vacuum pump are key parameters during the pumping process. They represent the status and progress of the process. The pump provides these values to the client program running on the SCS server via the serial to USB cable using the RS232 protocol.
The DAQ system of PandaX-III is developed with the open-source framework of Midas [26]. The number of trigger rates and events are essential to onsite shifters, thus will be monitored by the SCS. These values are sent directly to the InfluxDB by the DAQ system, using the HTTP protocol.
The emergency recovery system is composed of some gas pipelines in the gas handling system, the liquid nitrogen tank, gas recovery cylinders and the dewar. The recovery cylinder will be immersed in liquid nitrogen, which is stored in the dewar as normal and will be replaced regularly. Once the xenon leakage is confirmed, the gas will be recycled into the recovery cylinder. The weight and the pressure of the cylinder, and the level of liquid nitrogen are two key parameters to decide whether the system could work.
The temperature and humidity inside the clean room, in which the experiment runs, will be measured by a temperature and humidity sensor (model AS109, produced by the ASAIR Inc. [27]). A Pi will be deployed to collect the data from the sensor via the serial to USB cable using the RS485 protocol. The air conditioner control system of the cleanroom will generate CSV files to be read by the client program running on the server.
The input voltage of the UPS, which is the most important indicator of the power input, will be collected by the client program running on a Pi via the USB cable with RS232 protocol. The output voltage and the utility frequency, will be collected in the same way.
4 Demonstrator of the Slow Control System
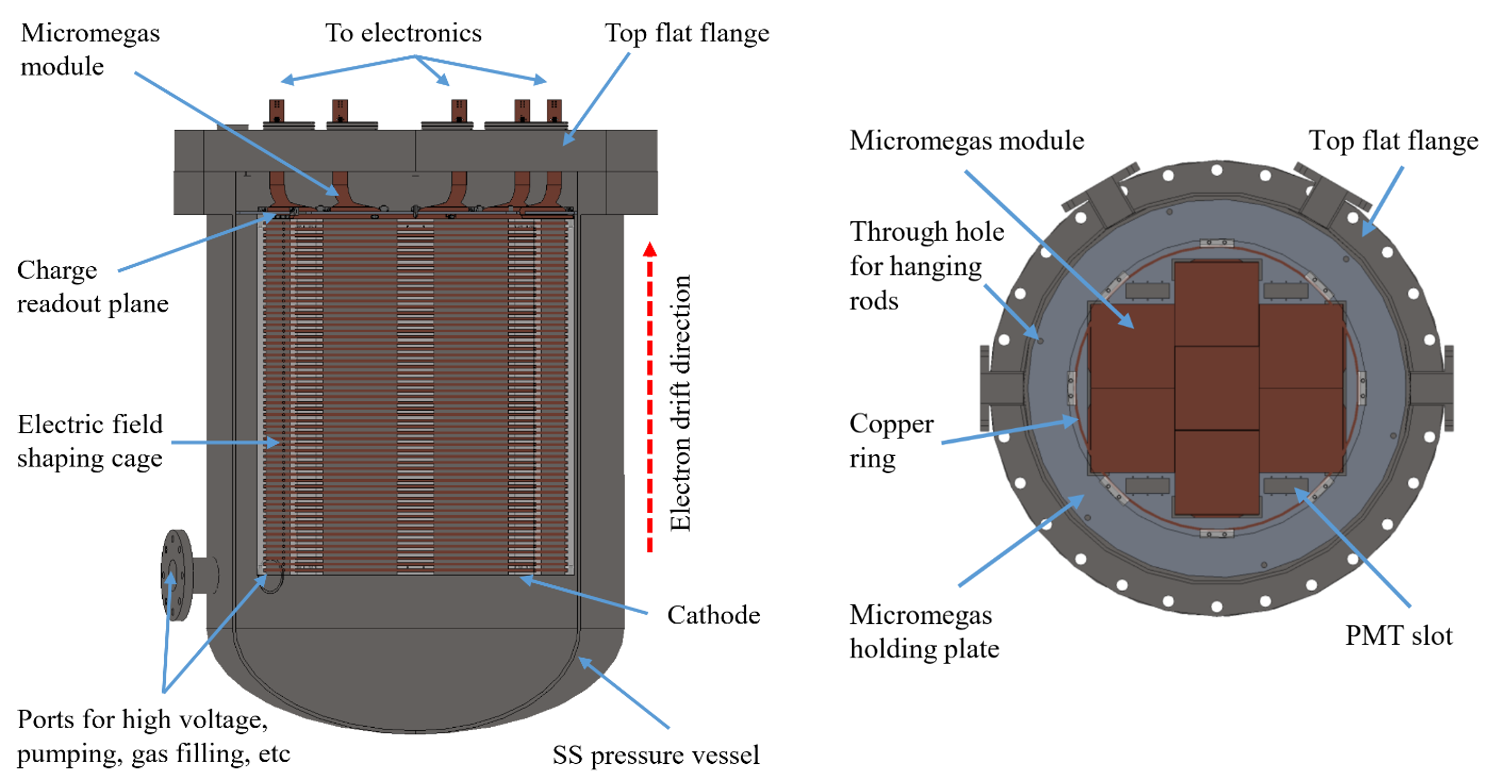
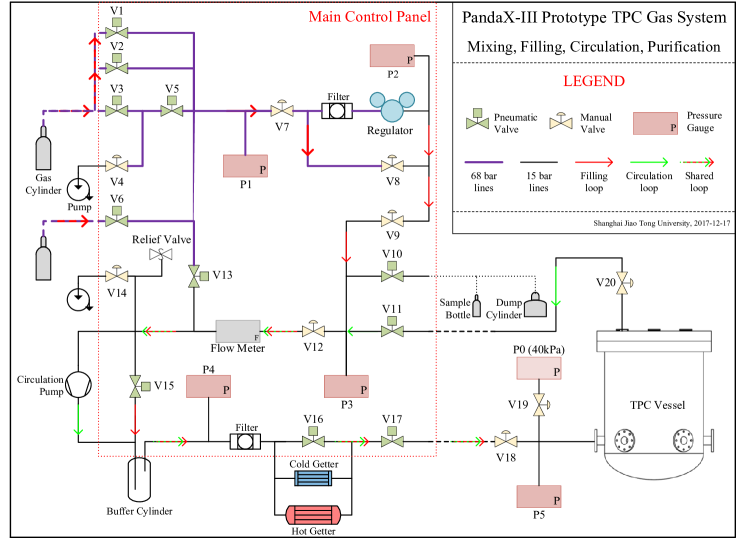
A prototype detector is built to study the performance of high-pressure xenon TPC for neutrinoless double beta decay search. The detailed description of the components of the detector and its subsystems is given in Ref. [28]. As shown in Fig. 4, the detector vessel has an inner volume of about 600 L with a design operating pressure of 15 bar. The active volume in side the TPC is about 270 L, with 78 cm drift distance and a readout plane composed of 7 Micromegas modules. A gas handling system (Fig. 5) is used for the gas filling, circulation, mixing, purification, and recovery of the prototype TPC. We set up a SCS demonstrator (P-SCS) to monitor the key parameters. The pressures in the gas system and the TPC, and the environment temperature/humidity were monitored for long time. The high voltage and current for all the Micromegas and the cathode were monitored during the data taking. Long term operation of the P-SCS had been carried on to test its performance, and to optimize the design of the SCS as well.
4.1 System set up
The modules of data storage, data visualization, anomaly detection and alarm dispatcher are running on a Dell R330 server, which is equipped with a quad core Intel Xeon E5-2403v2 CPU, 8 GB of memory and a hard drive with 1 TB capacity. The operating system is Ubuntu server 18.04 LTS. The same versions of InfluxDB, Chronograf and Kapacitor mentioned in Section. 2 are used. The default ports of 8086 (InfluxDB), 8088 (Chronograf) are not changed during the operation. The alarm dispatcher uses the port of 3000, and is configured to send the alarms to all the local members of the PandaX-III collaboration. Parameters from the gas handling system, the UPS and environment are collected by programs on a Pi, and other parameters are collected by programs running on the server. The main parameters monitored by P-SCS is given in Table 1.
| Subsystems | Critical parameters | Data source |
|---|---|---|
| Prototype TPC | voltage, current | Matsusada AU |
| Micromegas | voltage, current | CAEN N1471, Iseg NHR4220 |
| Gas handling system | pressure, pump power | Agilent 305FS |
| flow rate, pressures | MF5008 | |
| UPS | voltage, utility frequency | SANTAK Castle C3K |
| Environment | temperature, humidity | AS109 |
4.2 System operation
The core modules of the P-SCS have been set up for about one year. The client programs for different subsystems of the prototype detector have been integrated when the corresponding systems are ready. For the TPC and the Micromegas detector, the parameters are monitored only during the data taking. Each run of data taking lasts for hours. Details of the operation of the P-SCS are given below.
-
•
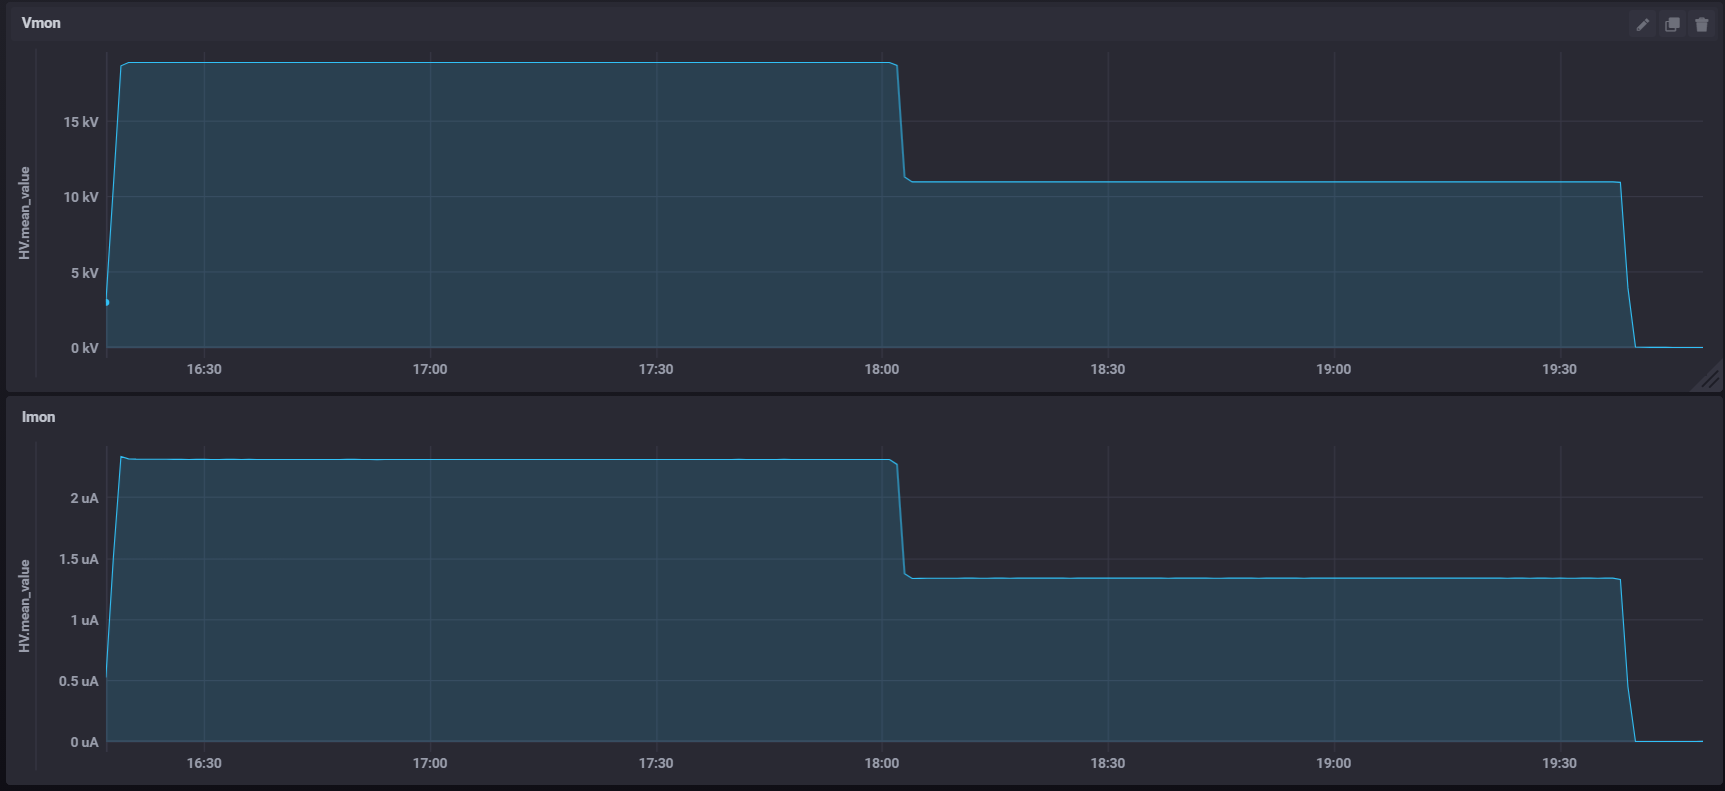
Prototype TPC: The voltage and the current of the cathode are monitored with an interval of 5 s. The interval enables us to obtain a precise picture of the evolution of HV during data taking. An example of the collected data in one data taking run, during which we examined the detector performance with 2 different HVs of the cathode, is given in Fig. 6. One can spot the rising of voltage and current at the beginning, and the dropping of them during the run clearly.
-
•
Micromegas: The voltage and current of the Micromegas detector are monitored with an interval of 1 s. In comparison with that of the TPC, the interval is smaller, which is important for the monitoring of the sparking of the Micromegas in time. The parameters of one Micromegas during a complete data taking run are given in Fig. 7. We increased the voltage from 0 to 350 V for safe operation of the Micromegas at a pace of 3 V/s, accompanied by a small current for charging. Then the voltage was increased to 390 V for data taking. We observed 9 times of sparking, during which the current increased dramatically. The onsite shifter stopped the run and turned down the voltage due to the large number of sparking with current over the threshold of 0.3 A.
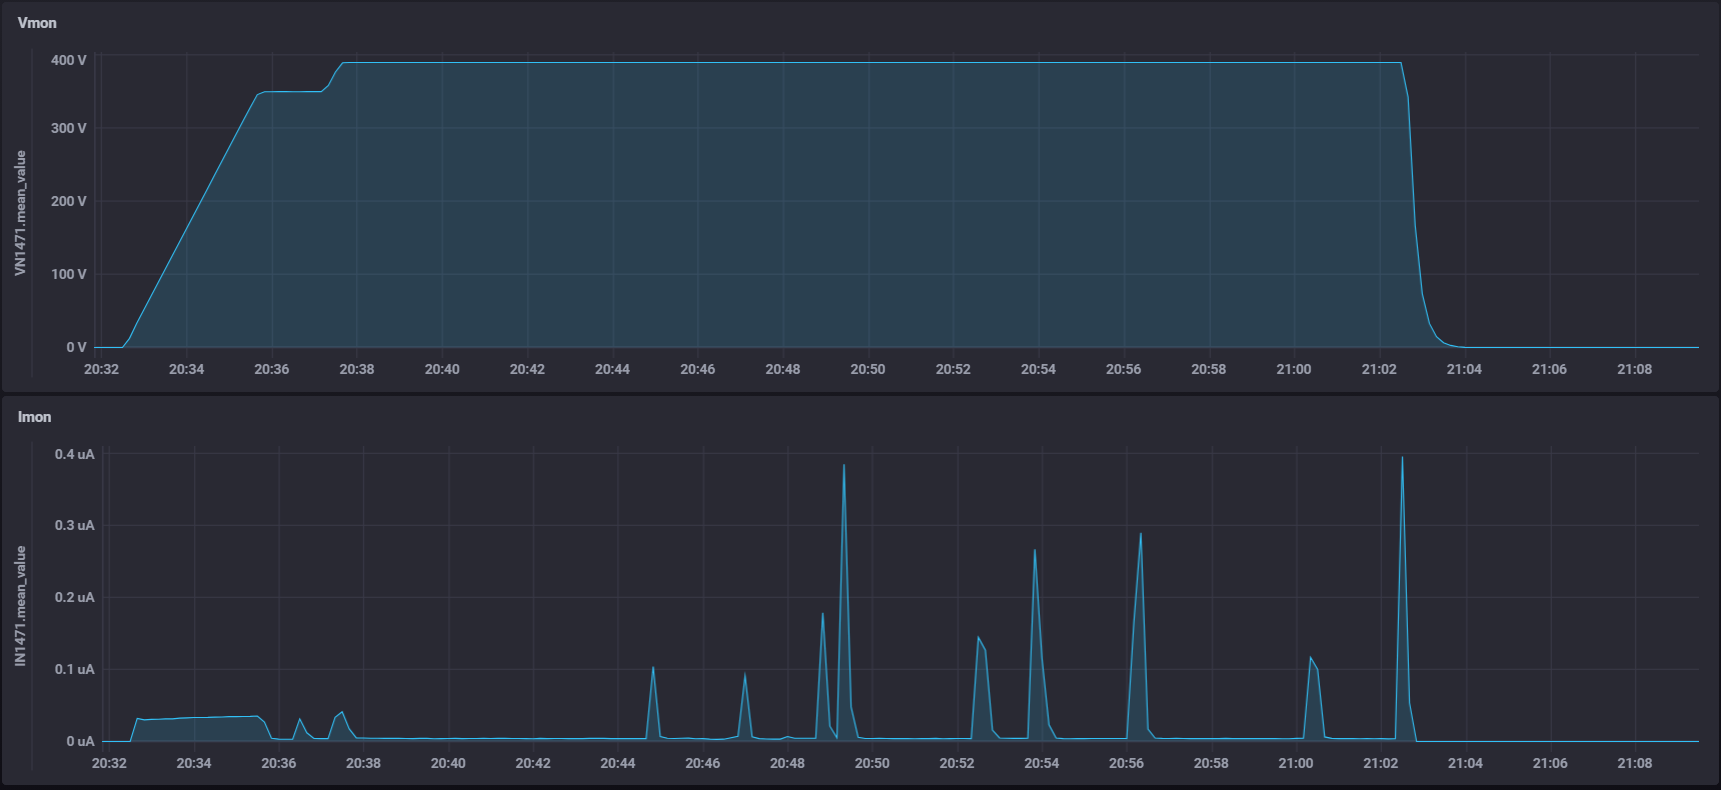
Fig. 7: Voltage (top) and current (bottom) of one Micromegas during a data taking run. -
•
Gas handling system: The pressures within the gas pipelines and weight of the quenching gas cylinders connected in the system are monitored at an interval of 5 s. Fig. 8 shows the evolution of the pressure at both ends of the circulating pump during one of the gas circulation. A positive difference between the pressures should be kept during a normal circulation. No flow-meter was integrated in the pipelines, because the mixed TMA may be corrosive to the rubber O-ring of the flow-meter. In the PandaX-III experiment, flow-meters will be added back by replacing current O-rings with those made of PTFE.
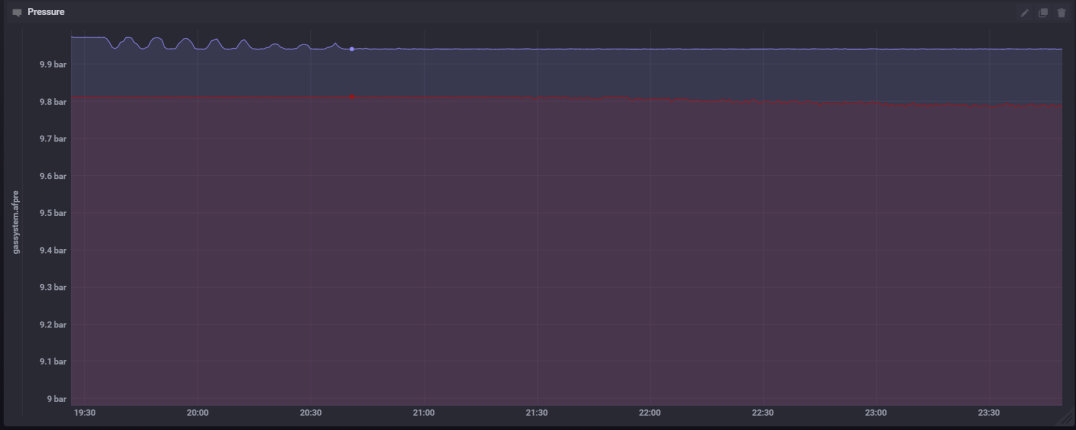
Fig. 8: Pressures at both ends of the pump during one of the gas circulation, P3 and P4 in Fig. 5. The blue curve represents the pressure at the front end of the circulation pump, the red one is the evolution of the pressure at the back end. -
•
Environment: The temperature and humidity of the working space of the detector are monitored with an interval of 5 s since January of 2020. Fig. 9 shows the evolution of these parameters till the writing of the report. A break of about 5 days on the picture was caused by the temporarily removing of the Pi, which served as the data collector. Monitoring of other parameters was not affected by this event. The temperature and humidity changed according to the change of seasons. No failure of the Pi happened during the long time data taking.
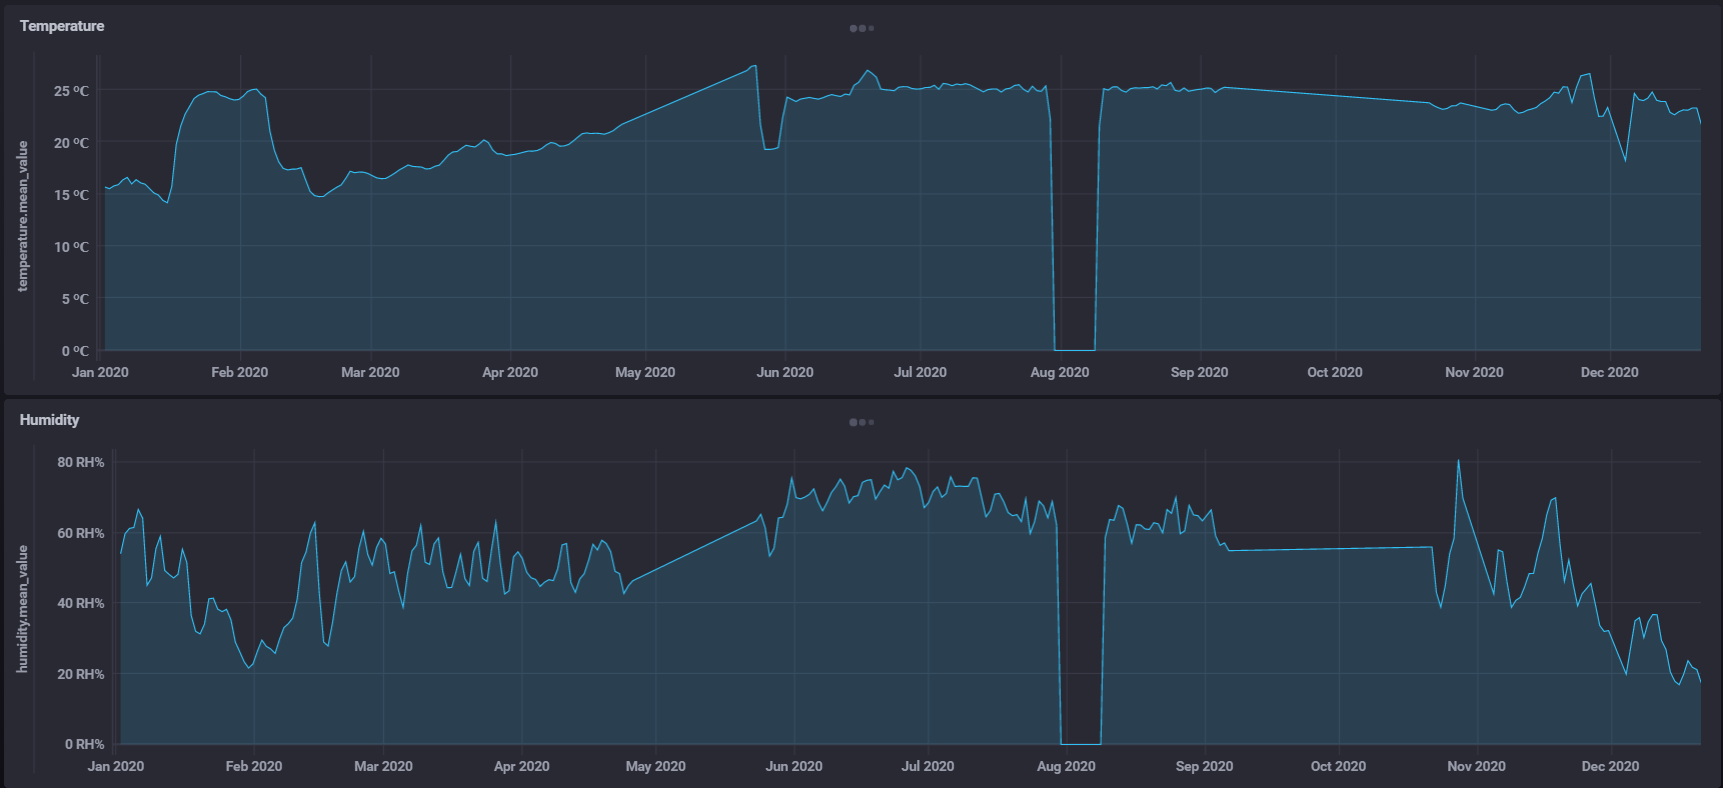
Fig. 9: Evolution of the temperature (top) and humidity (bottom) of the clean room collected by a Pi from Jan., 2020. -
•
UPS: The parameters of the UPS have been monitored since November, 2020, at an interval of 5 s. Evolution of the input voltage is given in Fig. 10. Fluctuation of the voltage implies the quality of the external power supply. Due to the circuit maintenance, the power was cut for two hours on December 22, 2020 and the alert dispatching module displayed the alert message on the alert web (Fig. 11(a)). The local member received the alert message through Enterprise WeChat (Fig. 11(b)) at nearly the same time.
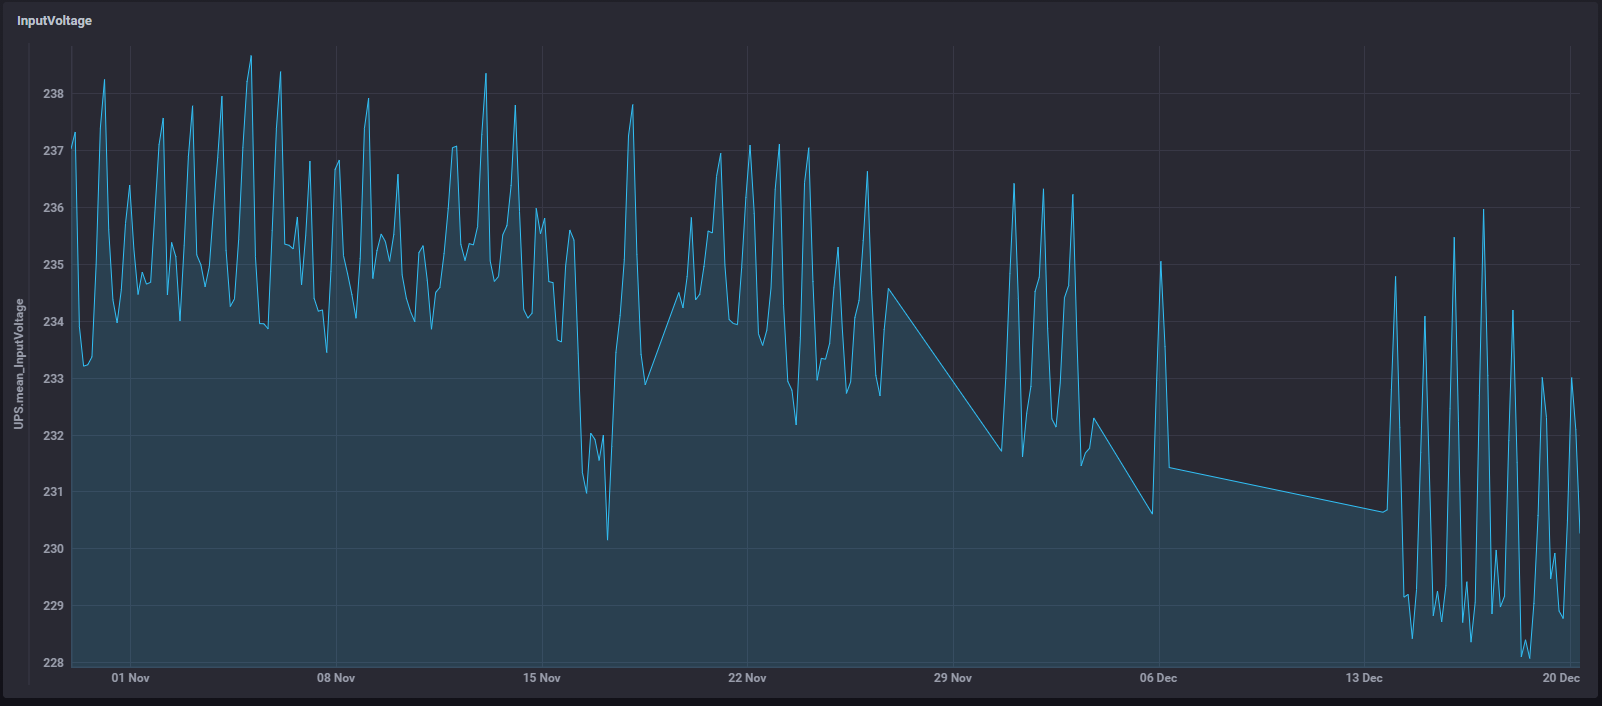
Fig. 10: Input voltage of the UPS from Nov., 2020.
The P-SCS is running since January 1, 2020. The server, which contains most of the modules, works stably. It has been shut down manually for 2 times due to the power cut, but no failure was observed during the normal operation. The CPU and memory consumption of the software are kept at a stable level during normal operation. Increment of the consumption has been observed at the time when a user tried to query data within a large time span, but still at a safe level. This indicates that larger memory and powerful CPUs are required by the SCS server of the PandaX-III experiment. Besides, the Pi used to collect data also shows good stability. To keep the system monitored without interrupt, all the components of the SCS should be driven by the UPS. Though the Pi used in the P-SCS behaves stable, more backups are required to response to the possible failure. We also checked the disk consumption of the system. After one year of the operation, with all the parameters mentioned above, only 4 GB of disk space is consumed by the data. Based on this value, by considering a complete SCS for the PandaX-III experiment, we estimate that about 100 GB of disk space will be consumed each year. The experience from the operation of the P-SCS provides important reference to the future PandaX-III SCS.
5 Conclusion
A SCS with five loosely coupled modules for the PandaX-III experiment is designed. A demonstrator of the SCS is set up to monitor the critical parameters of the prototype detector. All the modules have been tested. The built system behaves stable during the operation of one year. In the near future, a complete SCS will be set up together with the PandaX-III experiment. The system will provide all the critical information of the facilities to the experimentalists, acting as an essential safeguard.
Acknowledgements
This work is supported by the grant from the Ministry of Science and Technology of China (No.2016YFA0400302) and the grants from National Natural Sciences Foundation of China (No.11775142 and No.11905127). We thank the support from the Key Laboratory for Particle Physics, Astrophysics and Cosmology, Ministry of Education. This work is supported in part by the Chinese Academy of Sciences Center for Excellence in Particle Physics (CCEPP). We thank Chen Cheng in PandaX-4T group to give us some suggestions in the design and implementation of the whole system.
References
- [1] X. Chen et al. PandaX-III: Searching for neutrinoless double beta decay with high pressure136Xe gas time projection chambers. Sci. China Phys. Mech. Astron., 60(6):061011, 2017.
- [2] S. Wang. The TPC detector of PandaX-III Neutrinoless Double Beta Decay experiment. JINST, 15(03):C03052, 2020.
- [3] Y. Giomataris. Development and prospects of the new gaseous detector ‘Micromegas’. Nucl. Instrum. Meth. A, 419:239–250, 1998.
- [4] S. Wang. PandaX-III high pressure xenon TPC for Neutrinoless Double Beta Decay search. Nucl. Instrum. Meth. A, 958:162439, 2020.
- [5] P. Ji et al. A low-cost slow control system for the PandaX-4T experiment. Radiat. Detect. Technol. Methods, 3(3):53, 2019.
- [6] InfluxDB, Chronograf, Kapacitor: https://portal.influxdata.com/downloads/.
- [7] C#: https://docs.microsoft.com/en-us/dotnet/csharp/.
- [8] Python: https://www.python.org/.
- [9] Systemd: https://systemd.io/.
- [10] RaspberryPi-4B: https://www.raspberrypi.org/products/raspberry-pi-4-model-b/.
- [11] RS485: https://www.definitions.net/definition/RS-485.
- [12] RS232: https://www.definitions.net/definition/RS-232.
- [13] Falcon: https://falconframework.org/.
- [14] Gunicorn: https://gunicorn.org/.
- [15] WeChat: https://work.weixin.qq.com.
- [16] Reactjs: https://reactjs.org/.
- [17] Matsusada AU power supply: https://www.matsusada.com/product/hvps1/rack/au/.
- [18] PRC-905: http://www.runchentec.com/product_detail/6.html.
- [19] S. Liu et al. Development of the Front-End Electronics for PandaX-III Prototype TPC. IEEE Trans. Nucl. Sci., 66(7):1123–1129, 2019.
- [20] SY2527 Universal Multichannel Power Supply System and N1471 HV Power Supply Module (USB): https://www.caen.it/download/.
- [21] MF5008: https://www.aitoly.com.
- [22] DAM8082: http://www.c-control.cn/mobile/.
- [23] WSATC8030423HLP: http://www.runchentec.com/product_detail/17.html.
- [24] UT-1208: http://www.szutek.com/pro_view-98.html.
- [25] TwisTorr 305 FS: https://www.agilent.com/search/?Ntt=305FS.
- [26] Midas: https://midas.triumf.ca.
- [27] Asair AS109: http://www.aosong.com/products-52.html.
- [28] H. Lin et al. Design and commissioning of a 600 L Time Projection Chamber with Microbulk Micromegas. JINST, 13(06):P06012, 2018.
Appendix A The client program
A.1 Set up of the client program
In the “on-shot” mode, the client program will be executed only once. The key function is given below.
A.2 Set up of the timer
The example files to setup the systemd Timer service for the monitoring of the TPC is given below.
The “Serivce” file:
The “Timer” file:
A.3 Set up of data buffer
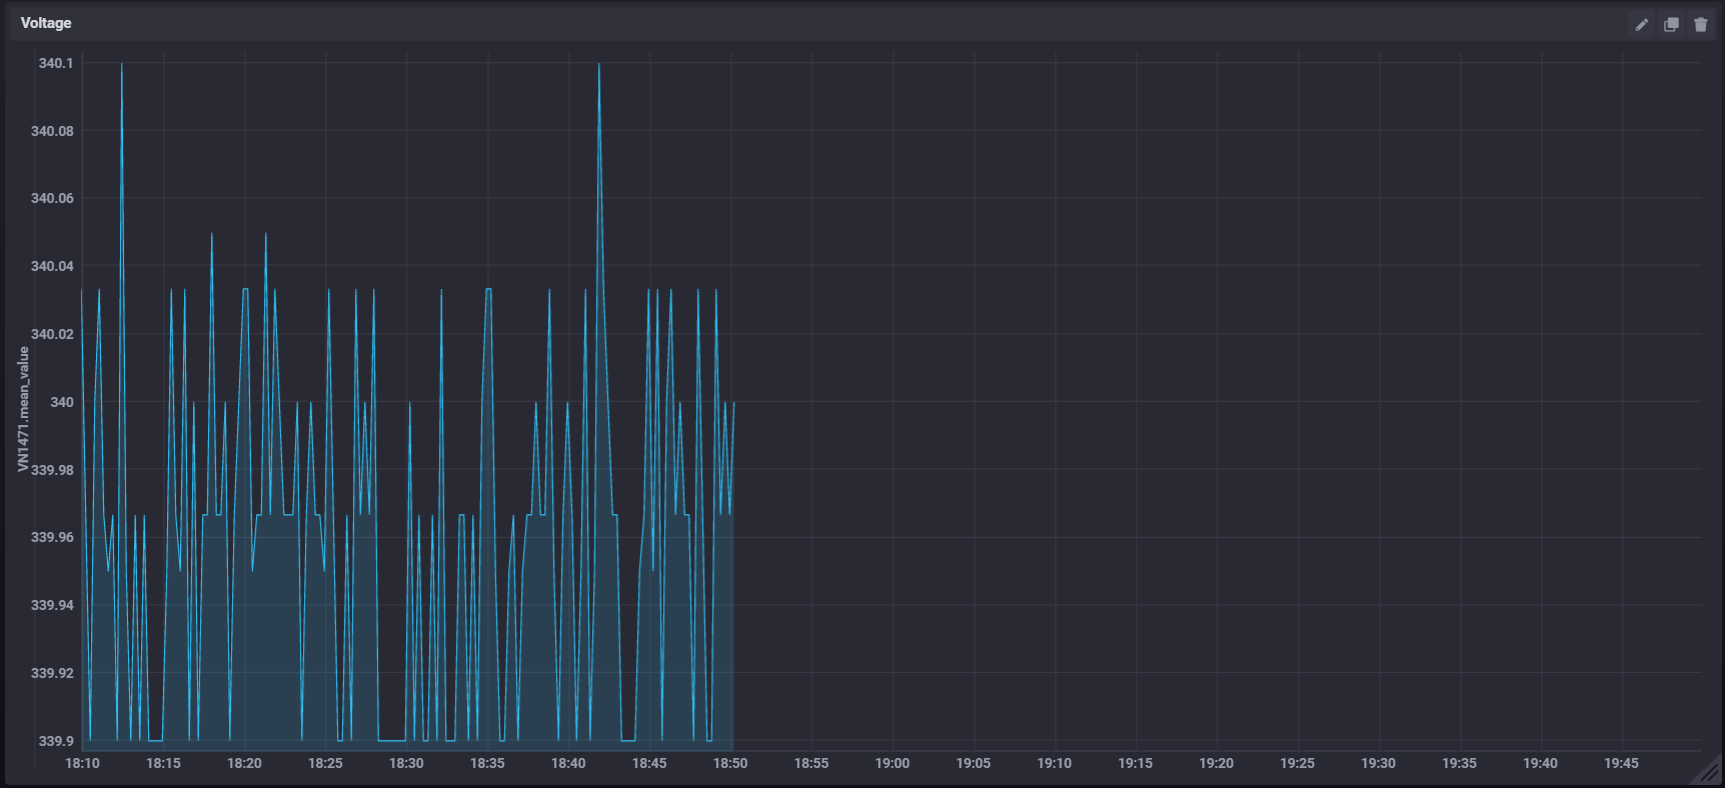
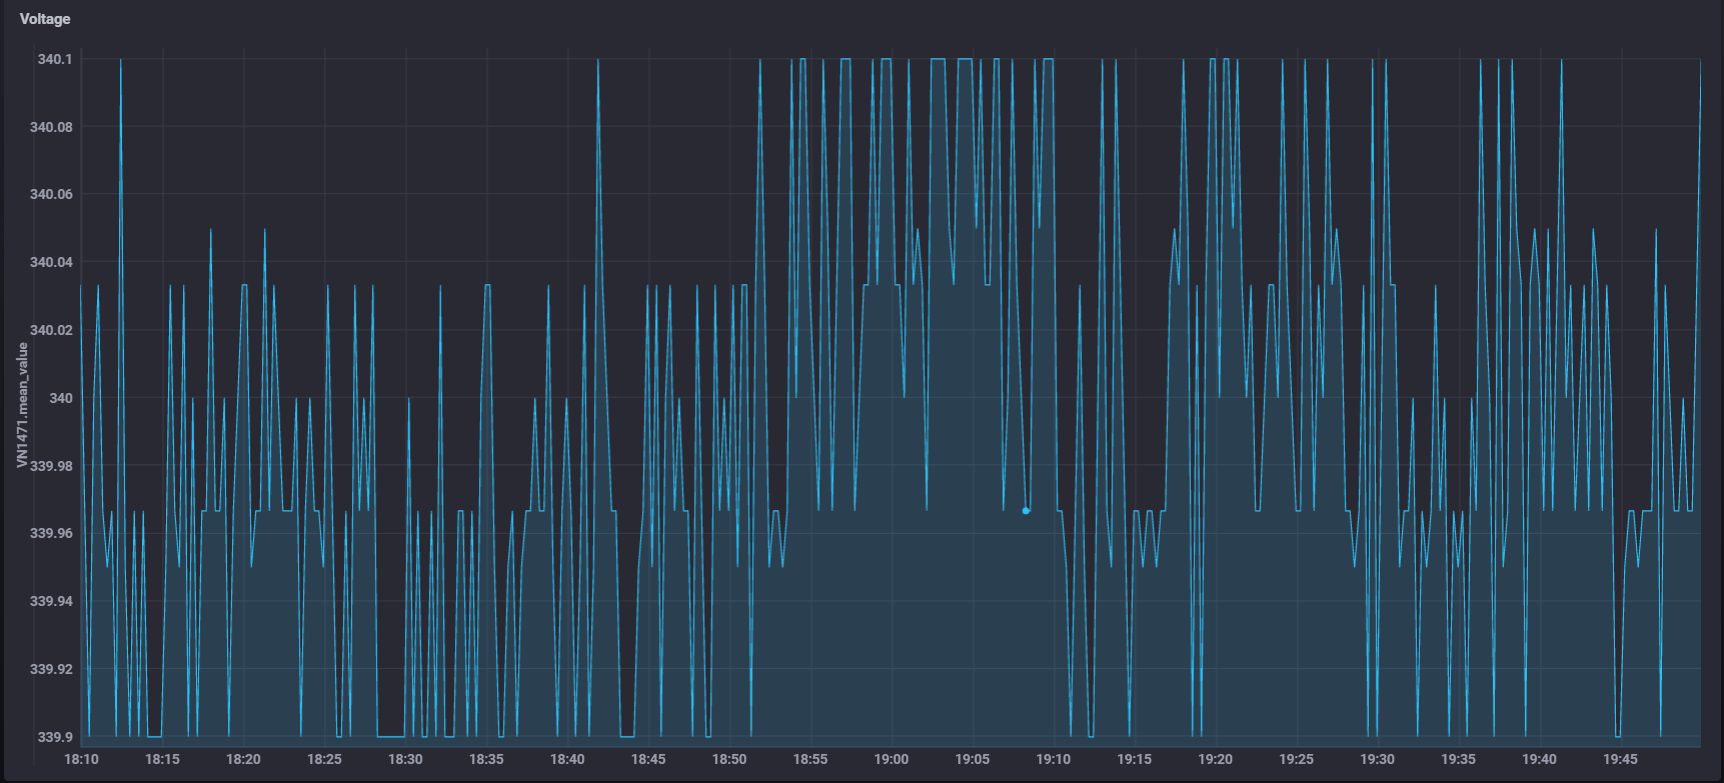
The data buffer is implemented as a queue of fixed length. Once the client program disconnects with InfluxDB, the readout values will be stored in this queue, and written to a local text file when the queue is full. When the connection is back, the values in the queue and the text file will be posted to InfluxDB again. The related code is given below:
Fig. 12 shows an example of voltage monitoring of one Micromegas, the network was disconnected for about one hour. Then all the buffered information was restored when the network is back.