Yontan et al.
*Talar Yontan, Istanbul University, Faculty of Science, Department of Astronomy and Space Sciences, 34119, University, Istanbul, Turkey.
A Study of Open Clusters Frolov 1 and NGC 7510 using CCD UBV Photometry and Gaia DR2 Astrometry
Abstract
We present reddening, photometric metallicity, age and distance estimates for the Frolov 1 and NGC 7510 open clusters based on CCD UBV photometric and Gaia data. Photometric observations were collected using the 1-m telescope of the TÜBİTAK National Observatory. Gaia DR2 proper motion data in the direction of two groupings were used to identify cluster membership. We determined mean proper motion values () = (, ) and (, ) mas yr-1 for Frolov 1 and NGC 7510, respectively. We used two-colour diagrams to obtain colour excesses for Frolov 1 and NGC 7510 as and mag, respectively. We derived the photometric metallicity of Frolov 1 as [Fe/H] = 0.030.03 dex and adopted a solar metallicity for NGC 7510. Based on these reddening and metallicities we determined the distance moduli and ages of the clusters via fitting PARSEC isochrones to the cluster colour-magnitude diagrams. Isochrone fitting distances for Frolov 1 and NGC 7510 are and pc, respectively, which correspond to the ages Myr and Myr. We also calculated mean Gaia distances and compared them with those given in the literature and in this study, concluding that our results are in good agreement with previous work. Finally, we calculated the mass function slopes as being for Frolov 1 and for NGC 7510.
keywords:
Galaxy: open cluster and associations: individual: Frolov 1, NGC 7510 – stars: Hertzsprung Russell (HR) diagram, , , , , , , , and (\cyearXXXX), \ctitleA Study of Open Clusters Frolov 1 and NGC 7510 using CCD UBV Photometry and Gaia DR2 Astrometry, \cjournalAN, \cvolXXX;XX:X–X.
1 Introduction
Open clusters are valuable tools in understanding numerous features of the Galaxy and stellar evolution. As such a grouping is formed from the collapse of a molecular cloud, the metallicities, distances and ages of a cluster’s stars are similar although masses differ from star to star. The study of open clusters with different individual ages gives insight into stellar properties and evolution stages. In addition to this, inter-relations between the accurately determined astrophysical parameters (such as distance-metallicity and age-metallicity) of numerous open clusters enable us to understand the chemical and temporal evolution of their surroundings, such as the Galactic disc. Open clusters are gravitationally weakly bound systems of limited volumes and stellar numbers (compared to globular clusters, for example), with their component stars sharing similar spatial velocities. The main astrophysical parameters (colour excess, metallicity, distance, and age) of a cluster can be obtained from the colour-magnitude (CMD) and two-colour (TCD) diagrams through comparison with the results of stellar models, such as isochrones. Open clusters have different morphologies (Trumpler, 1930): some clusters are more prominent than surrounding field stars because of their relative stellar over-densities, while it can be difficult to distinguish the sparse clusters from the field stars. These properties affect the observed characteristics and distributions in the CMDs and TCDs of the open clusters such as main sequence, turn off, and the red clump regions. To determine precise astrophysical parameters, not only are features in the CMDs and TCDs important but also the accurate selection of cluster member stars, together with the use of homogeneous data and methods during analysis. Studies by different authors of the same open cluster can have quite different values for astrophysical parameters (Dias et al., 2002; Netopil et al., 2016). The quality of data combined with outdated isochrones, cluster membership determination techniques, and analysis methods can affect the results and cause degeneracy between determined parameters of clusters (Anders et al., 2004; King et al., 2005).
The Gaia data release 2 (Gaia DR2, Gaia collaboration et al., 2018) provides unprecedented astronomical information for more than 1.3 billion objects. These data contain positions (, ), parallaxes () and proper motions () with a limiting magnitude of mag. For mag and mag, the uncertainties of parallaxes are up to 0.04 mas and 0.1 mas respectively. Uncertainties of the proper motion components are up to 0.06 mas yr-1 in the magnitude range up to mag, dropping to 0.2 mas yr-1 by mag. Such precise data allow us to sensitively select physical cluster members as well as to calculate mean proper motion components and Gaia distance values for these open clusters (c.f. Cantat-Gaudin et al., 2018; Cantat-Gaudin & Anders, 2020).
| Cluster | [Fe/H] | Reference | |||||||
| (mag) | (mag) | (pc) | (dex) | (Myr) | (pc) | (mas yr-1) | (mas yr-1) | ||
| Frolov 1 | 0.60 | 13.90 | 2,560 | — | 46 | — | -5.910.65 | -1.351.22 | (1) |
| 0.650.06 | 14.300.20 | 2,864254 | 0.030.03 | 3510 | 2,800136 | -3.020.10 | -1.750.08 | (2) | |
| NGC 7510 | 0.90 | 14.38 | 2,075 | — | 16 | — | -3.630.89 | -0.922.00 | (1) |
| 1.050.05 | 15.500.20 | 2,818247 | 0 | 186 | 3,450477 | -3.660.07 | -2.170.06 | (2) | |
| 0.86 | 14.25 | 2,075 | — | 38 | — | — | — | (3) | |
| 1.16 | 16.07 | 3,125 | — | — | — | — | — | (4) | |
| 1.00 | 14.40 | 3,160450 | — | 10 | — | — | — | (5) | |
| 1.12 | 15.92 | 3,090 | — | 10 | — | — | — | (6) | |
| 0.90 | 15.50 | 3,480420 | — | 22 | — | — | — | (7) |
In this study, the main goal was to derive structural, astrophysical and astrometric parameters of two poorly studied clusters in the northern hemisphere based on wide-field CCD UBV photometry. We analysed Gaia DR2 astrometric data () in conjunction with these images, utilising independent methods to investigate mean proper motion, Gaia distance, main astrophysical parameters (reddening, metallicity, distance and age) and the mass functions for these two clusters: Frolov 1 and NGC 7510. The calculated physical parameters for the clusters are given in Table 1. Information about previous studies of two clusters is given below.
1.1 Frolov 1
Frolov (1977) presented photographic photometry of four open clusters in the constellation Cassiopeia, including Frolov 1 (, , ) which he noted is composed of a low density of faint stars. No deep CCD observations or similar studies are available in the literature for Frolov 1. Kharchenko et al. (2005, 2013) give a general analysis of the stars located in the cluster, as detected from the ASCC-2.5 (Kharchenko, 2001) and Tycho-2 catalogues (Høg, et al., 2000). They determined the distance and age of Frolov 1 as 2,560 pc and yr, respectively.
1.2 NGC 7510
This cluster is located in Cepheus (with coordinates , , ) and classified as Trumpler II3r (Lynga, 1987). There is substantial variation in literature estimates for the distance of NGC 7510. While Trumpler (1930) determined the distance of the cluster as 5,040 pc, Buscombe (1953) calculated this value as 2,200 pc. Johnson et al. (1961) indicated that this difference in estimated cluster distance is caused by an inhomogeneous interstellar medium in the direction of the cluster. Hoag et al. (1961) studied 91 stars within mag in the UBV system with photoelectric and photometric observational techniques. They determined the reddening, distance, and age of the cluster via their CMD as mag, pc, and Myr, respectively. A detailed study of UBV photographic photometry of NGC 7510 was made by Fenkart & Schroeder (1985). They analysed 314 stars located through the cluster region within mag using and CMDs and calculated the distance modulus, , and reddenings as 16.07, 0.88, and 1.16 mag, respectively. Sagar & Griffiths (1991) utilized CCD BVI photometric observations of the cluster. They analysed 592 cluster stars down to a limiting magnitude of 21, showing that the reddening of NGC 7510 is inhomogeneous and changes between mag. In the study, the distance moduli was determined as mag and the age of the cluster was calculated from the CMDs as Myr. NGC 7510 was also studied by Barbon & Hassan (1996). In the study, photographic UBV observations of stellar fields located in the cluster region were collected using the 182 and 122 cm telescopes at Asiago. Stellar magnitudes were measured with iris photometry from a total of 20 photographic plates consisting of eight, six and six exposures in the , , and filters, respectively. Barbon & Hassan (1996) standardised these magnitudes via the UBV photoelectric observations of Hoag et al. (1961). They constructed a TCD of the cluster stars. Fitting the ZAMS of Iriarte (1958) on this diagram, the colour excesses of the NGC 7510 were determined as and mag. The de-reddened distance modulus of the cluster was calculated via main-sequence matching on the CMD as ( mag. Using the same diagram and Bertelli et al. (1994)’s isochrones, Barbon & Hassan (1996) determined the age of the cluster as 10 Myr. To conclude the literature review, we note that Paunzen et al. (2005) analysed the peculiar stars in NGC 7510 with CCD photometry and investigated the reddening, distance modulus, distance and age of the cluster finding mag, mag, pc, and Myr respectively.
2 Observations
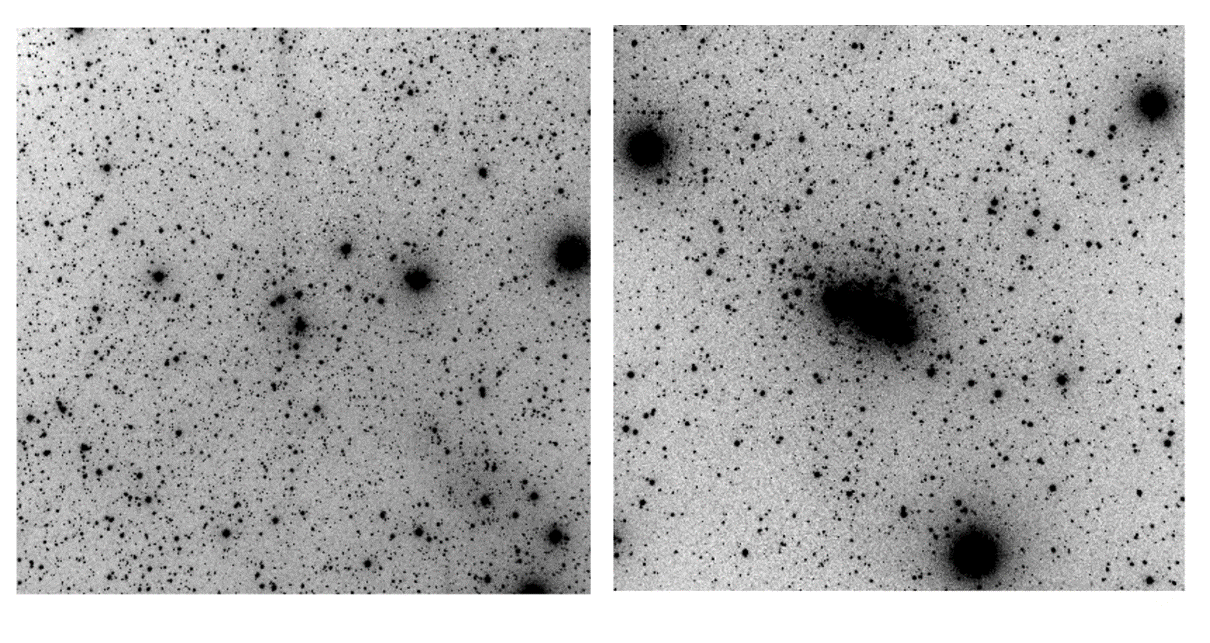
The observations of the two open clusters were performed using a Fairchild 486 BI 4k4k CCD camera with Johnson-Cousins UBV filters attached to the Cassegrain focus of the 1-m Ritchey Chretien telescope (T100) of the TÜBİTAK National Observatory (TUG) located in Antalya, Turkey. The pixel scale of the telescope-camera system is pixel-1, which gives about a field of view on the sky. The gain and readout noise of the CCD are 0.57 electrons ADU-1 and 4.11 electrons, respectively. We used long and short observation exposure times to obtain a range of limiting and saturation magnitudes for the , and filters, allowing good detection of both brighter and fainter stars located in the cluster regions. Inverse coloured band images of the two clusters are displayed in Fig. 1. The short and long exposure frames were separately combined to form two longer duration images for analysis, for each filter and cluster. The observational log is given in Table 2. Photometric calibrations were based on Landolt (2009) standard stars. A total of 88 stars in 13 selected areas were observed. Details are given in Table 3. The air masses () were between 1.2 and 1.9 for the standard stars monitored during the observation nights. For the photometric calibrations, we observed standard stars of Landolt (2009) in UBV bands during the observing run. Standard CCD reduction techniques were applied using IRAF111IRAF is distributed by the National Optical Astronomy Observatories packages for the pre-processing of all the images which were taken. Astrometric corrections were applied using PyRAF222PyRAF is a product of the Space Telescope Science Institute, which is operated by AURA for NASA and astrometry.net333http://astrometry.net routines together with our own scripts for the cluster images. Using IRAF’s aperture photometry packages, we measured the instrumental magnitudes of Landolt (2009) stars. Then we applied multiple linear fits to these magnitudes and derived photometric extinction and transformation coefficients for each observing night (Table 4). Source Extractor (SExTractor) and PSF Extractor (PSFEx) routines (Bertin & Arnouts, 1996) were applied to measure the instrumental magnitudes of the objects located in the cluster fields. We applied aperture corrections to these magnitudes and transformed them to standard magnitudes in the Johnson photometric system using transformation equations as described by Janes & Hoq (2013).
| Cluster | Observation | Filter / (Exposure Time (s)) | ||
|---|---|---|---|---|
| Date | ||||
| Frolov 1 | 02.11.2016 | 253 | 23 | 1.24 |
| 12002 | 12002 | 6002 | ||
| NGC 7510 | 06.11.2018 | 604 | 65 | 35 |
| 18001 | 605 | 305 | ||
| Date | Star Field | |||
|---|---|---|---|---|
| SA92 | 6 | 1 | ||
| SA93 | 4 | 1 | ||
| SA95 | 9 | 2 | ||
| SA96 | 2 | 3 | ||
| SA97 | 2 | 1 | ||
| 02.11.2016 | SA98 | 19 | 1 | 1.22 - 1.88 |
| SA110 | 10 | 1 | ||
| SA111 | 5 | 1 | ||
| SA112 | 6 | 2 | ||
| SA113 | 15 | 1 | ||
| SA114 | 5 | 1 | ||
| SA92 | 6 | 1 | ||
| SA93 | 4 | 1 | ||
| SA94 | 2 | 1 | ||
| SA95 | 9 | 1 | ||
| SA96 | 2 | 2 | ||
| 06.11.2018 | SA97 | 2 | 2 | 1.23 - 1.87 |
| SA98 | 19 | 1 | ||
| SA99 | 3 | 1 | ||
| SA110 | 10 | 1 | ||
| SA111 | 5 | 1 | ||
| SA112 | 6 | 1 | ||
| SA114 | 5 | 1 |
| Filter/Colour index | Observation Date | ||||
|---|---|---|---|---|---|
| 02.11.2016 | 0.3620.085 | -0.3190.111 | – | – | |
| 0.2470.043 | -0.0680.043 | 1.0130.062 | 1.2650.061 | ||
| 0.1140.002 | – | – | – | ||
| – | – | 1.3040.163 | 3.7290.122 | ||
| – | – | 0.0770.011 | 1.3770.030 | ||
| 06.11.2018 | 0.5210.062 | -0.1220.069 | – | – | |
| 0.2270.046 | -0.0210.052 | 0.9320.077 | 1.5120.068 | ||
| 0.1240.018 | – | – | – | ||
| – | – | 0.9860.102 | 3.7180.093 | ||
| – | – | 0.0730.007 | 1.5700.028 |
| Frolov 1 | NGC 7510 | |||||||||||
|---|---|---|---|---|---|---|---|---|---|---|---|---|
| ( 8, 12] | 11 | 0.001 | 0.005 | 0.001 | 0.001 | 0.002 | 8 | 0.001 | 0.002 | 0.002 | 0.001 | 0.002 |
| (12, 14] | 84 | 0.002 | 0.010 | 0.002 | 0.001 | 0.002 | 81 | 0.003 | 0.005 | 0.004 | 0.001 | 0.003 |
| (14, 15] | 115 | 0.003 | 0.010 | 0.003 | 0.001 | 0.003 | 77 | 0.003 | 0.007 | 0.003 | 0.001 | 0.003 |
| (15, 16] | 188 | 0.001 | 0.007 | 0.003 | 0.001 | 0.004 | 164 | 0.004 | 0.012 | 0.006 | 0.001 | 0.004 |
| (16, 17] | 394 | 0.002 | 0.013 | 0.003 | 0.001 | 0.006 | 315 | 0.008 | 0.026 | 0.011 | 0.001 | 0.006 |
| (17, 18] | 754 | 0.004 | 0.026 | 0.006 | 0.001 | 0.012 | 544 | 0.017 | 0.047 | 0.023 | 0.001 | 0.013 |
| (18, 19] | 1169 | 0.009 | 0.053 | 0.013 | 0.002 | 0.025 | 577 | 0.036 | 0.082 | 0.053 | 0.001 | 0.023 |
| (19, 20] | 1775 | 0.019 | 0.078 | 0.031 | 0.003 | 0.055 | 112 | 0.071 | 0.103 | 0.129 | 0.002 | 0.035 |
| (20, 22] | 1665 | 0.040 | 0.125 | 0.067 | 0.005 | 0.099 | 7 | — | — | — | — | — |
3 Data Analysis
3.1 Photometric data
Photometric catalogues listing all the detected stars in the cluster regions are available electronically for Frolov 1 and NGC 7510. We identified 6,155 sources for Frolov 1 and 1,885 sources for NGC 7510, before constructing their photometric and astrometric catalogues. Both of the catalogues contain positions (), apparent magnitudes, & colours, proper motion components () along with trigonometric parallaxes () from the Gaia DR2, and membership probabilities () as calculated in this study. Magnitude and colour inaccuracies of Johnson (, , ) and Gaia DR2 (, ) photometries are adopted as internal errors. We calculated mean photometric errors as a function of magnitude intervals (see Table 5). It can be seen from Table 5 that the mean internal errors in the UBV data for stars brighter than are smaller than 0.05 mag for Frolov 1 and 0.07 mag for stars brighter than mag in NGC 7510. Moreover, mean internal errors in Gaia DR2 data for the stars brighter than mag are smaller than 0.005 and 0.002 mag for Frolov 1 and NGC 7510, respectively.
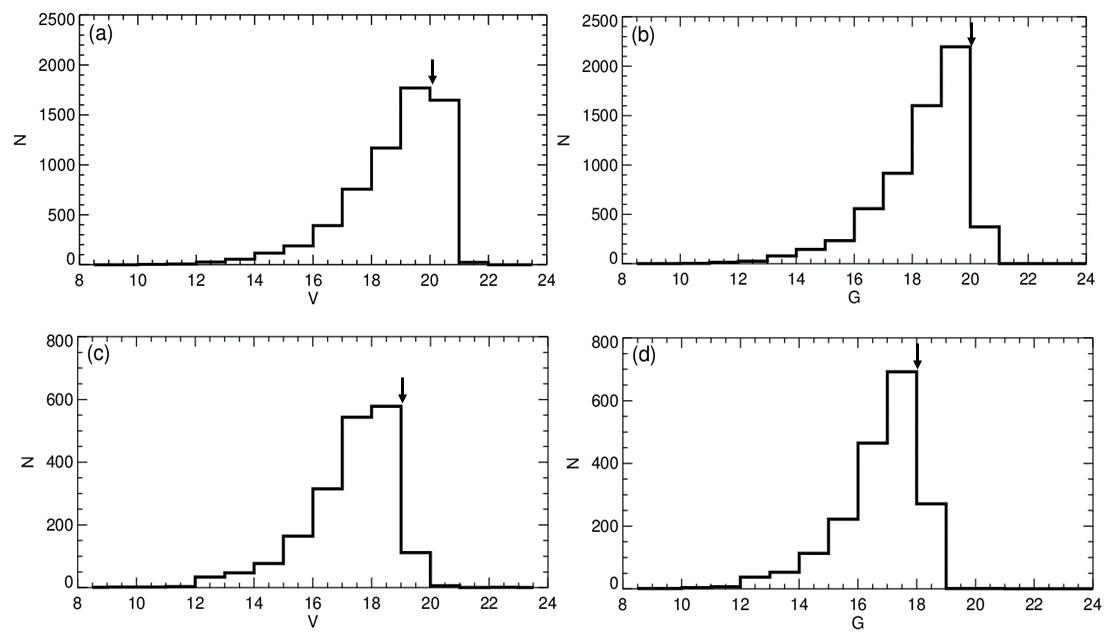
In order to determine precise astrophysical parameters, we quantified the quality of data by taking into account the photometric completeness limit. The exposure duration used during observations creates a limiting magnitude where counting completeness drops away from unity. The clusters studied were not strongly affected by blending of the point spread functions. To find this limit, we constructed and magnitude histograms of the two clusters. As can be seen from Fig. 2, we concluded that stellar counts reduce for magnitudes fainter than for Frolov 1 and mag for NGC 7510, respectively. As shown in Fig. 2, the apparent magnitudes corresponding to the magnitude limits are 20 and 18 mag for Frolov 1 and NGC 7510, respectively. Thus we adopted these values as cluster photometric completeness limits. During further analyses we used the stars brighter than the completeness limits adopted for two clusters.
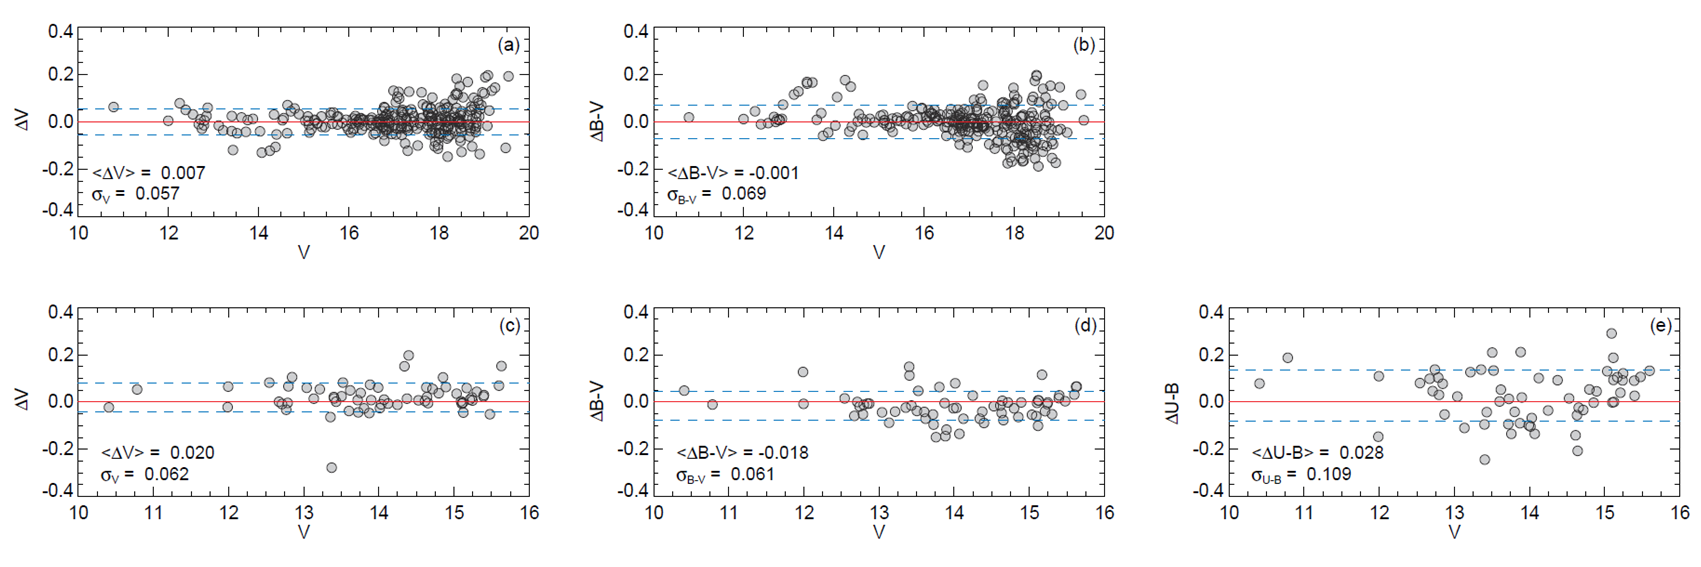
Because Frolov 1 is a poorly studied cluster, there are no available CCD data for this cluster. Therefore we made comparisons to the literature for only our photometric data for NGC 7510 alone, using the CCD BVI data of Sagar & Griffiths (1991) and the photographic UBV observations given by Barbon & Hassan (1996). We compared against the magnitude and colour measurements from these two studies (Fig. 3) and the colour indices with Barbon & Hassan (1996). Fig 3a-b. denotes the comparison between this study and Sagar & Griffiths (1991). The horizontal axis presents our measurements, while the vertical axis gives the differences between two studies. Based on these comparisons, the mean differences of magnitude and colours are derived as and mag. These measurements applied for only the cross-identified 302 stars brighter than mag in the two studies. The lower panel of Fig. 3c-e represents the comparison between this study and Barbon & Hassan (1996). The meanings of the horizontal and vertical axes are the same as for Fig. 3a-b. In this comparison, the mean differences in magnitude and colours are derived as , , and mag. These measurements are based on only the cross-identified 63 stars brighter than mag in both the studies. These comparisons show that photometric measurements in this study are in good agreement with the previous studies.
3.2 Cluster radius and radial stellar surface density
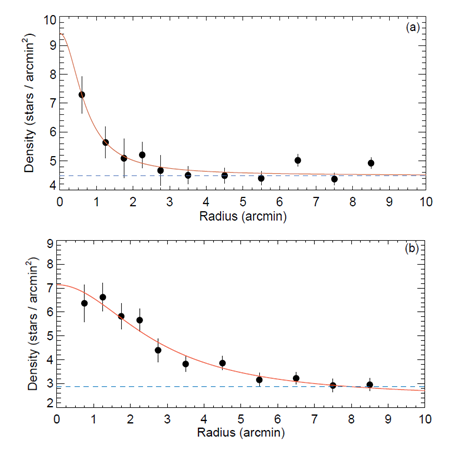
The two open clusters analysed in this study have different morphologies: NGC 7510 shows a relatively strong central condensation, while Frolov 1 seems to be a sparse cluster in that its region is dominated by field stars. Even though Frolov 1 has a sparse distribution, structural analyses showed it exhibits the structure of a cluster. In this study, such structural parameters of the two clusters were derived via radial density profile (RDP) fitting to star counts in successive annuli from the cluster centres. We adopted from the SIMBAD database444http://simbad.u-strasbg.fr/simbad/ central coordinates for the clusters. We constructed circles from a cluster’s centre to different angular distances and calculated stellar densities. Then we plotted the angular distance from the centre versus stellar densities, fitting to the RDP model of King (1962) through a minimisation technique (see Fig. 4). The King (1962) formula is expressed as . Here, denotes the centred cluster radius, while , , and present central density, core radius, and background density respectively. The results of the best fits for Frolov 1 and NGC 7510 are shown in Fig. 4 with dashed blue lines which represent the background density. As seen in Fig. 4 the RDPs are getting flatter at arcmin for Frolov 1 and arcmin for NGC 7510, before merging with the background stellar density. Therefore in further analyses we take into account only the stars within these radial distances. The RDP results for Frolov 1 are a central stellar density , a background stellar density stars arcmin-2, and a core radius arcmin. Results for NGC 7510 are , stars arcmin-2 and arcmin. Results are also listed in Table 6.
| Cluster | |||
|---|---|---|---|
| (stars arcmin-2) | (arcmin) | (stars arcmin-2) | |
| Frolov 1 | 4.9231.164 | 0.6891.110 | 4.4970.130 |
| NGC 7510 | 4.7710.022 | 2.7160.019 | 2.3740.011 |
3.3 Membership Selection
Contamination by field stars may cause the inaccurate calculation of a cluster’s main parameters. For this reason, one should properly separate the cluster members from field stars. In particular, it is important to define the physical members of cluster such as main-sequence stars, giant stars (if they exist in the cluster), and stars that are located near the main- sequence turn off point before starting astrophysical calculations. The most reliable determination of the physical member stars would be to know the radial velocities, distances, and proper motions of the stars present in cluster field. However, today there is no available sky survey to measure radial velocities of all stars. As cluster stars have the same physical formation conditions they hold similar directions of movement. This makes the proper motion of stars an important tool to determine physical members of a given cluster. Therefore, membership calculations utilising various statistical methods take into account proper motion components as main parameters. In order to calculate the membership probabilities () in the Frolov 1 and NGC 7510 imaged fields, we used Gaia DR2 proper motion components of stars and applied the non-parametric method given by Balaguer-Nunez et al. (1998). This method determines the distributions of field and cluster stars empirically according to their mean cluster and stellar proper motion components. The data distributions were derived considering the technique of kernel estimation with a circular Gaussian kernel function.
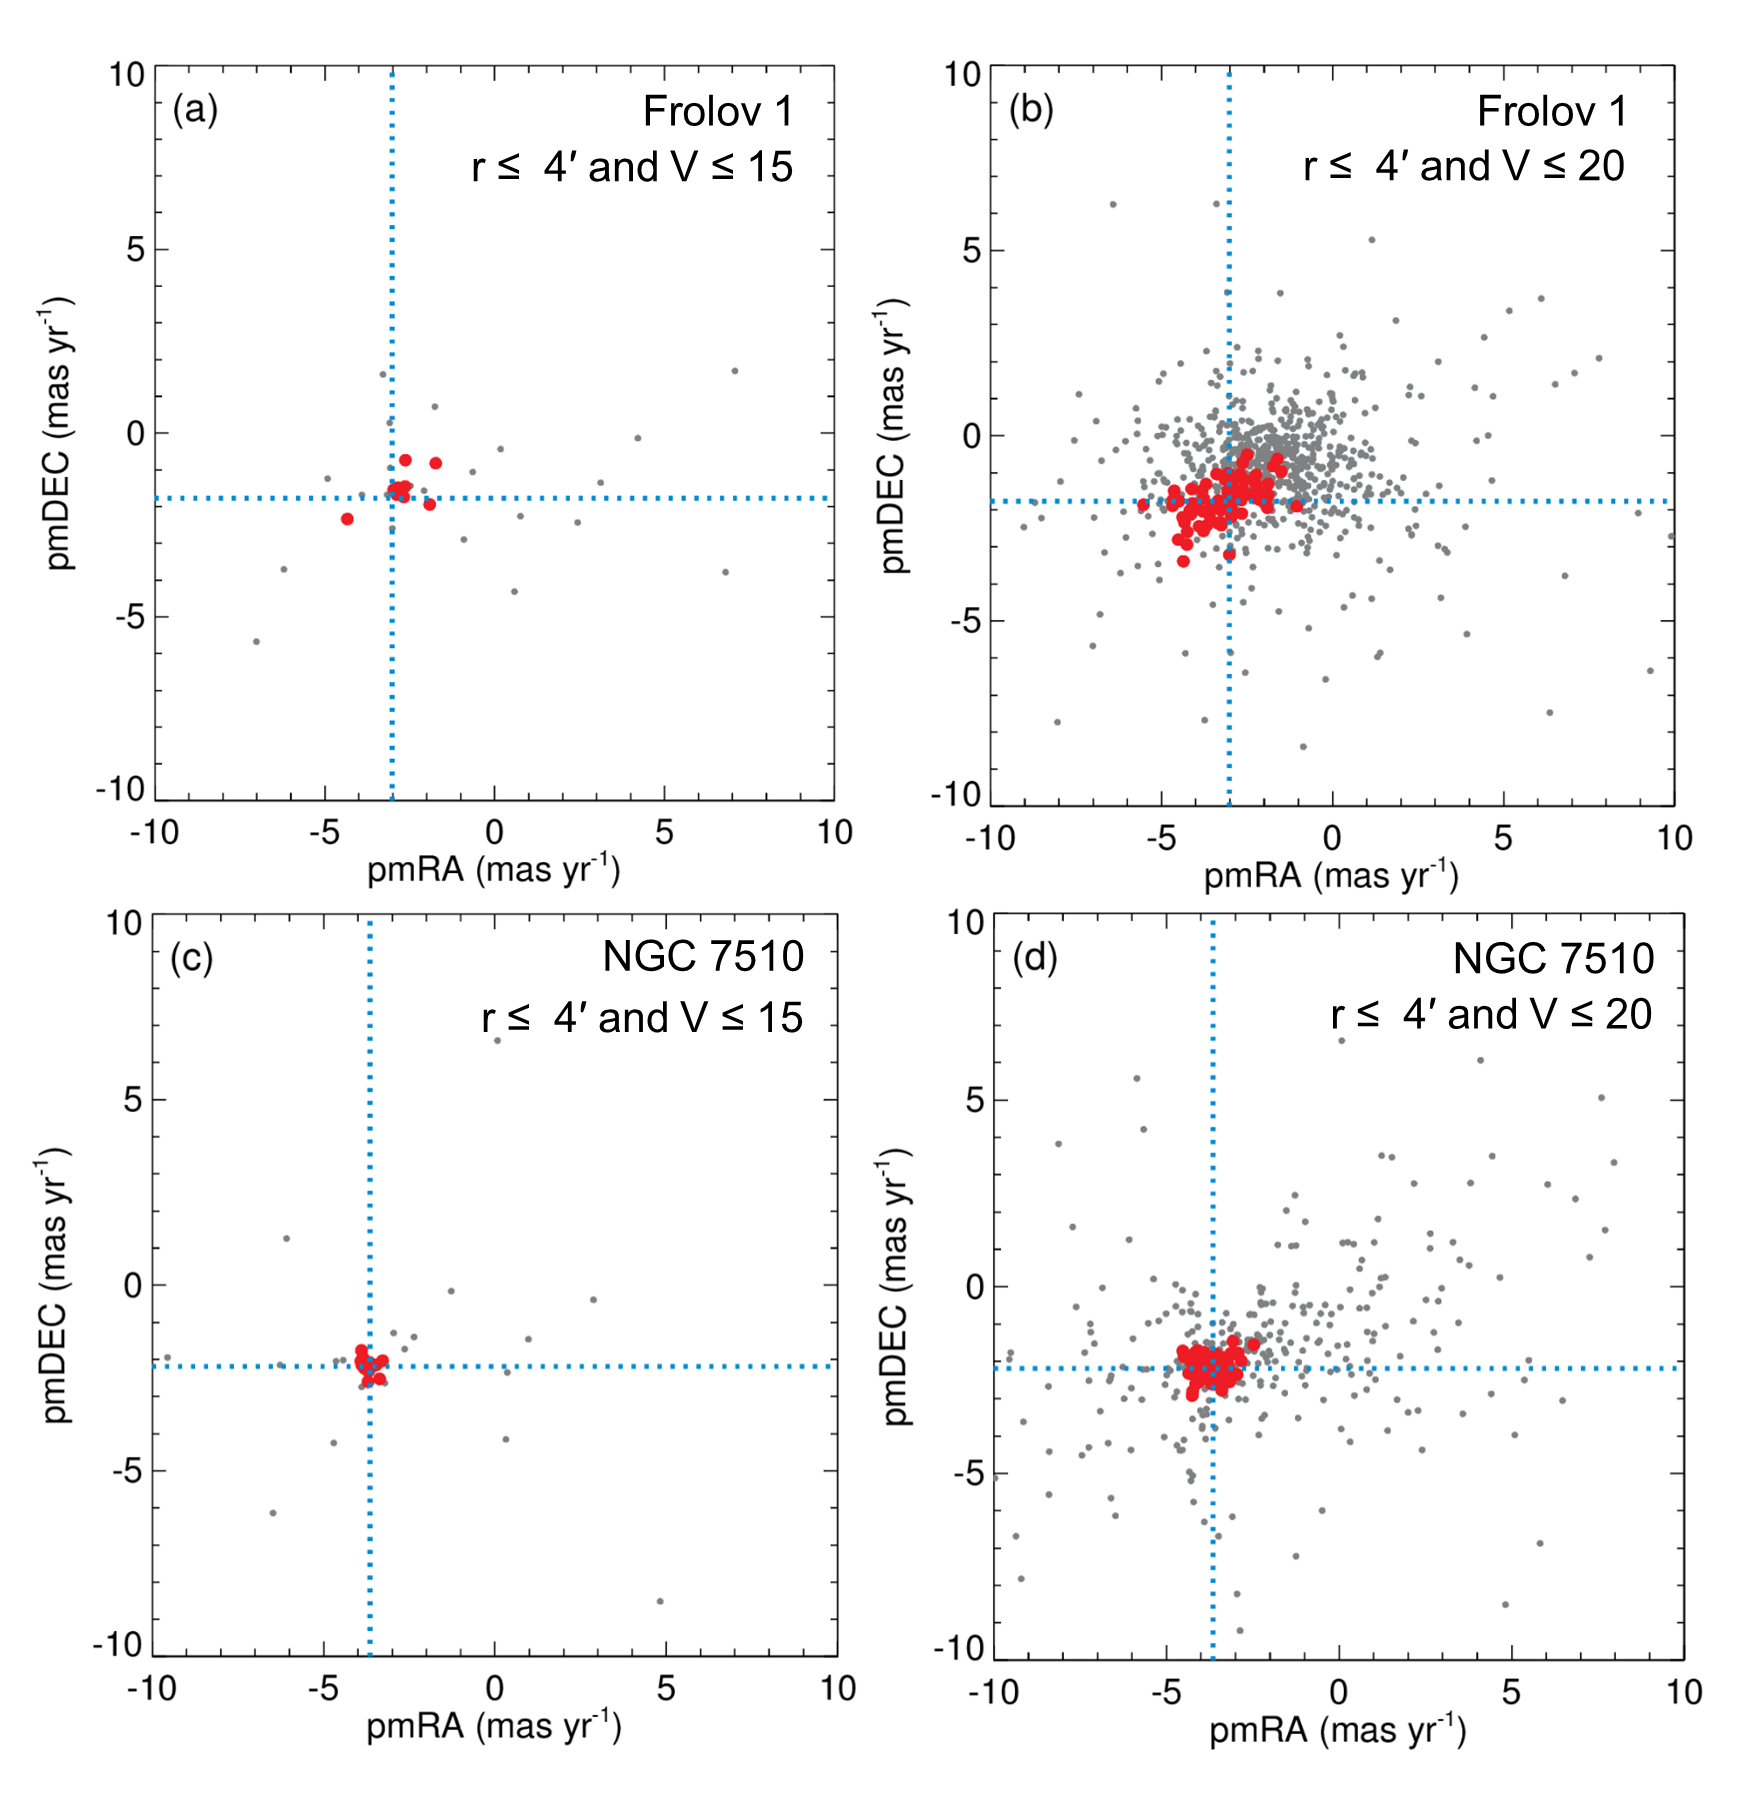
We selected the stars whose membership probabilities are as the most probable cluster members and took them into account for further analysis. Before starting the determination of fundamental astrophysical parameters, we constructed vector point diagrams (VPDs) as functions of apparent magnitudes for the two clusters in Fig. 5 to check the distribution of the cluster members in proper motion space. Generally, the member stars of open clusters are dominant in bright apparent magnitudes, which allows them to be more easily distinguished from field stars. In accordance with this thought, we plotted the VPDs employing stars whose magnitudes are within mag and brighter than the -completeness limits determined above for the two clusters. Considering the examples of the clusters containing bright and faint stars in Fig. 5, it can be seen that their positions in the VPDs do not change and they are clustered in different regions than field stars despite some scattered data.
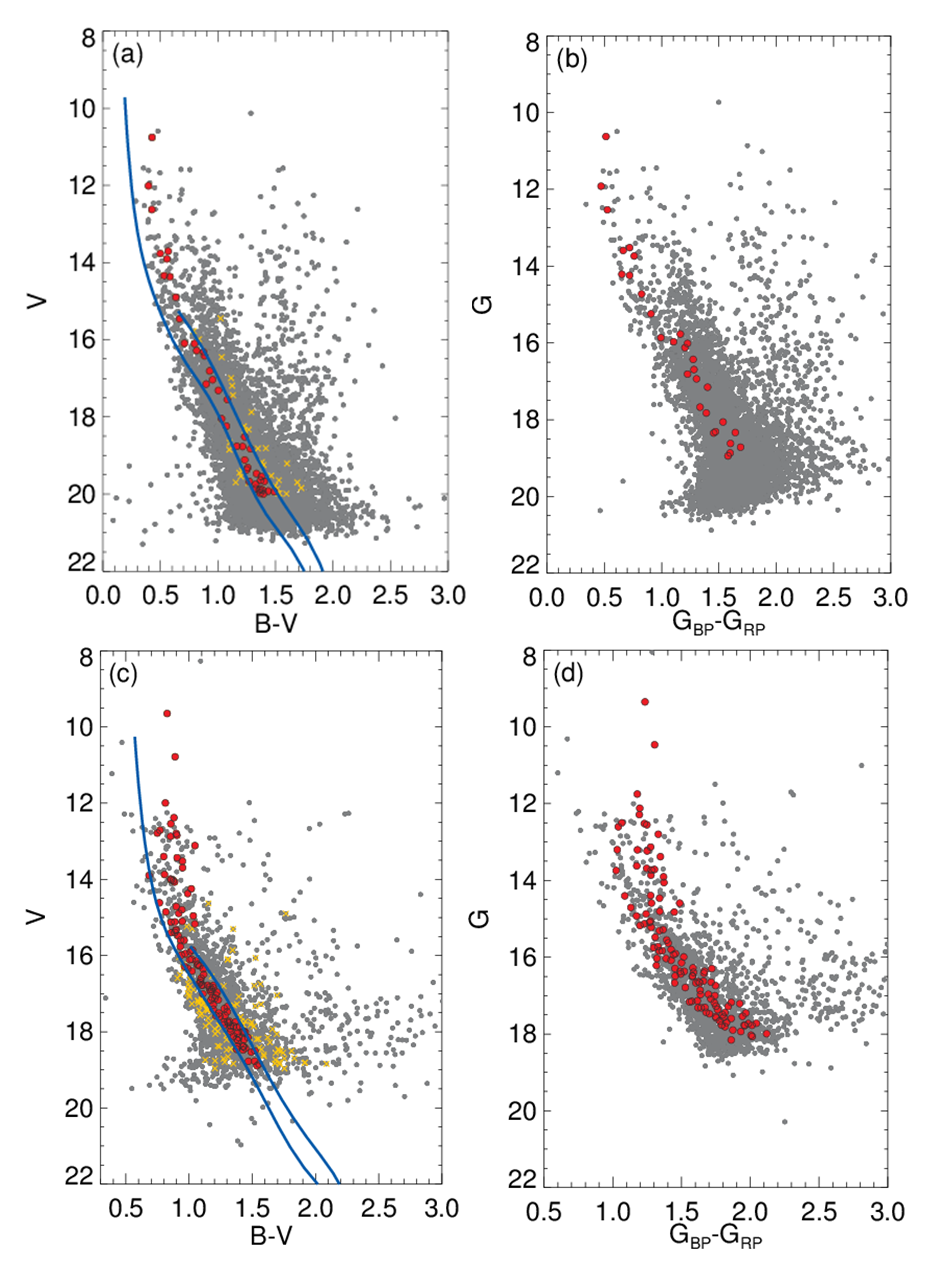
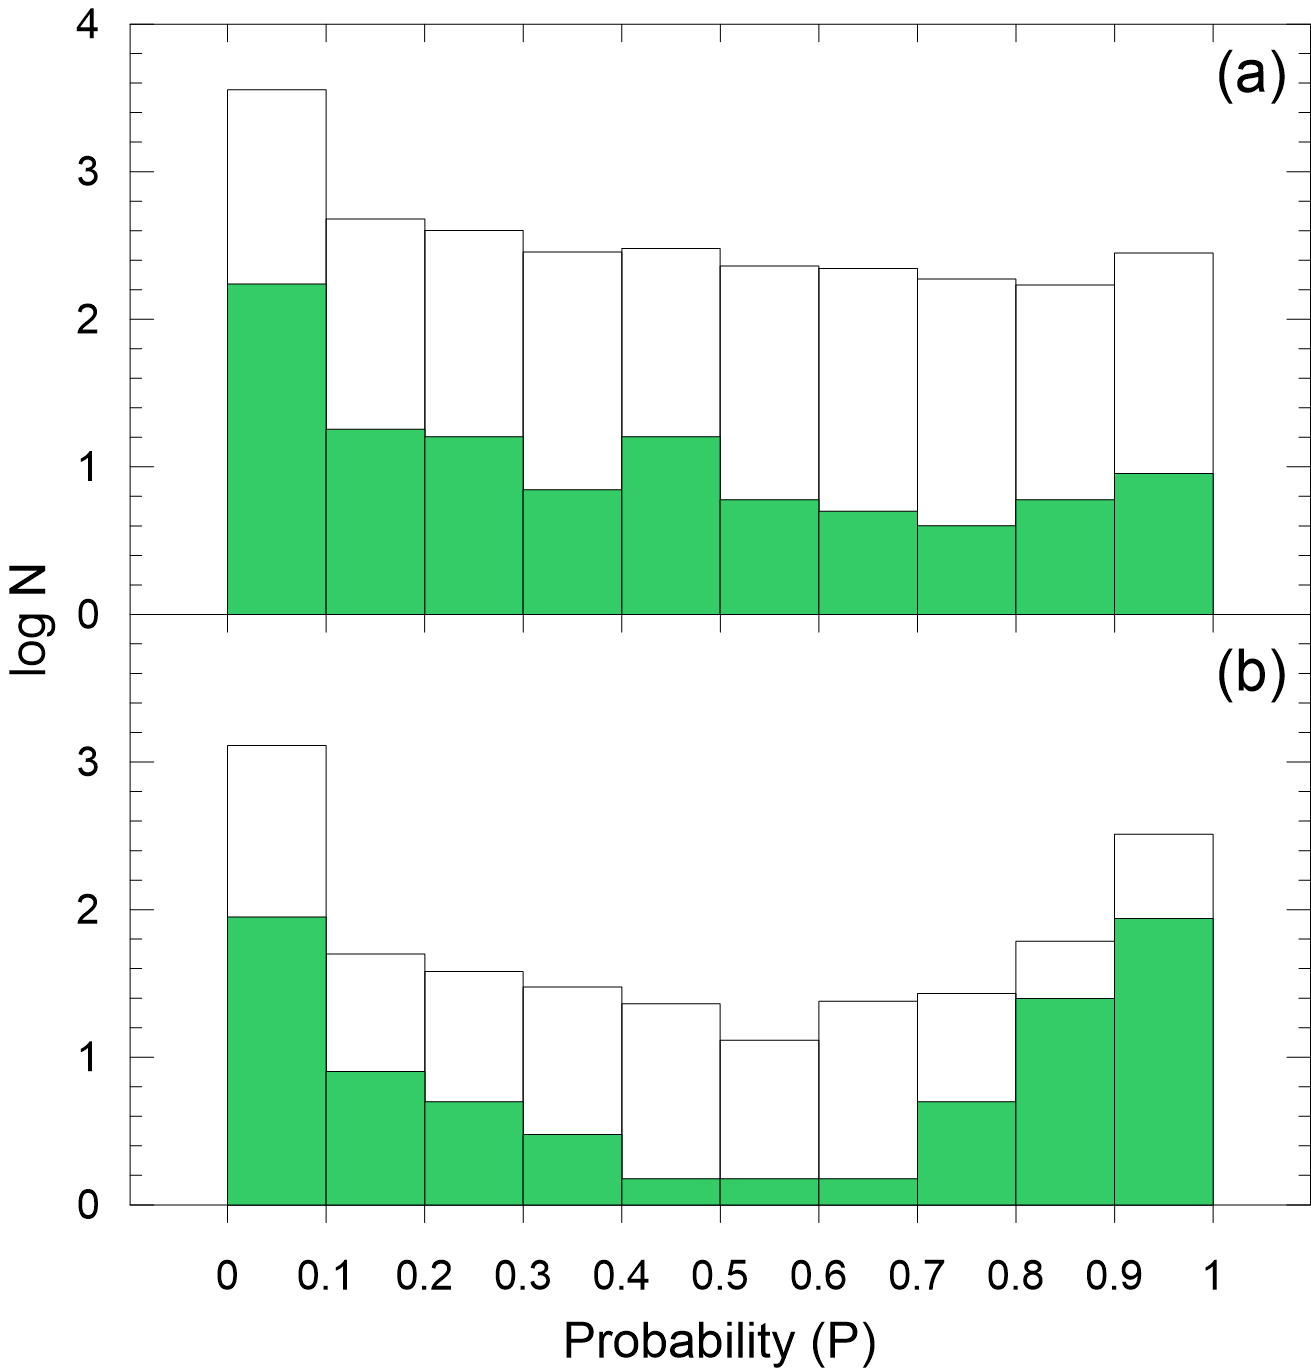
To take into account the binary star effect in the main-sequence of the clusters, we constructed CMDs of the stars located through Frolov 1 and NGC 7510 before fitting the zero age main-sequence (ZAMS) of Sung et al. (2013) to these diagrams of the most probable member stars (). Next we shifted the fitted ZAMS 0.75 mag (Fig. 6) to brighter magnitudes in order to account for binary stars. We made sure that the most likely main-sequence, turn-off, and giant stars of the clusters were selected. The stars whose membership probabilities were , located in the fitted ZAMS regions, and positioned within the clusters’ calculated radii described above were adopted as the most likely member stars of the clusters and used in the subsequent analyses. These resulted in 46 and 119 ‘member’ stars for Frolov 1 and NGC 7510, respectively. The CMDs with fitted ZAMS are shown in Fig. 6a,c. Also, we show the distribution of field stars and these most probable member stars on CMDs based on Gaia DR2 photometry (Fig. 6b,d). Fig. 6 shows that the member stars selected using the astrometric and photometric methods are more scattered in the Gaia CMDs. The histograms of the membership probabilities of the stars in the fields of Frolov 1 and NGC 7510 are presented in Fig. 7. The mean proper motion components of stars selected as cluster members in Frolov 1 and NGC 7510 are (, =() and (, )=() mas yr-1, respectively.
4 Cluster Parameters
This section is a summary of the methods utilized to determine the fundamental parameters of Frolov 1 and NGC 7510 (for background details on methodology see Ak et al., 2016; Bilir et al., 2016; Bostancı et al., 2018; Yontan et al., 2019; Banks et al., 2020). We obtained reddening and metallicity estimates by fitting observational models on the TCDs, while distance moduli and ages were determined simultaneously via fitting theoretical isochrones on CMDs.
4.1 Reddening
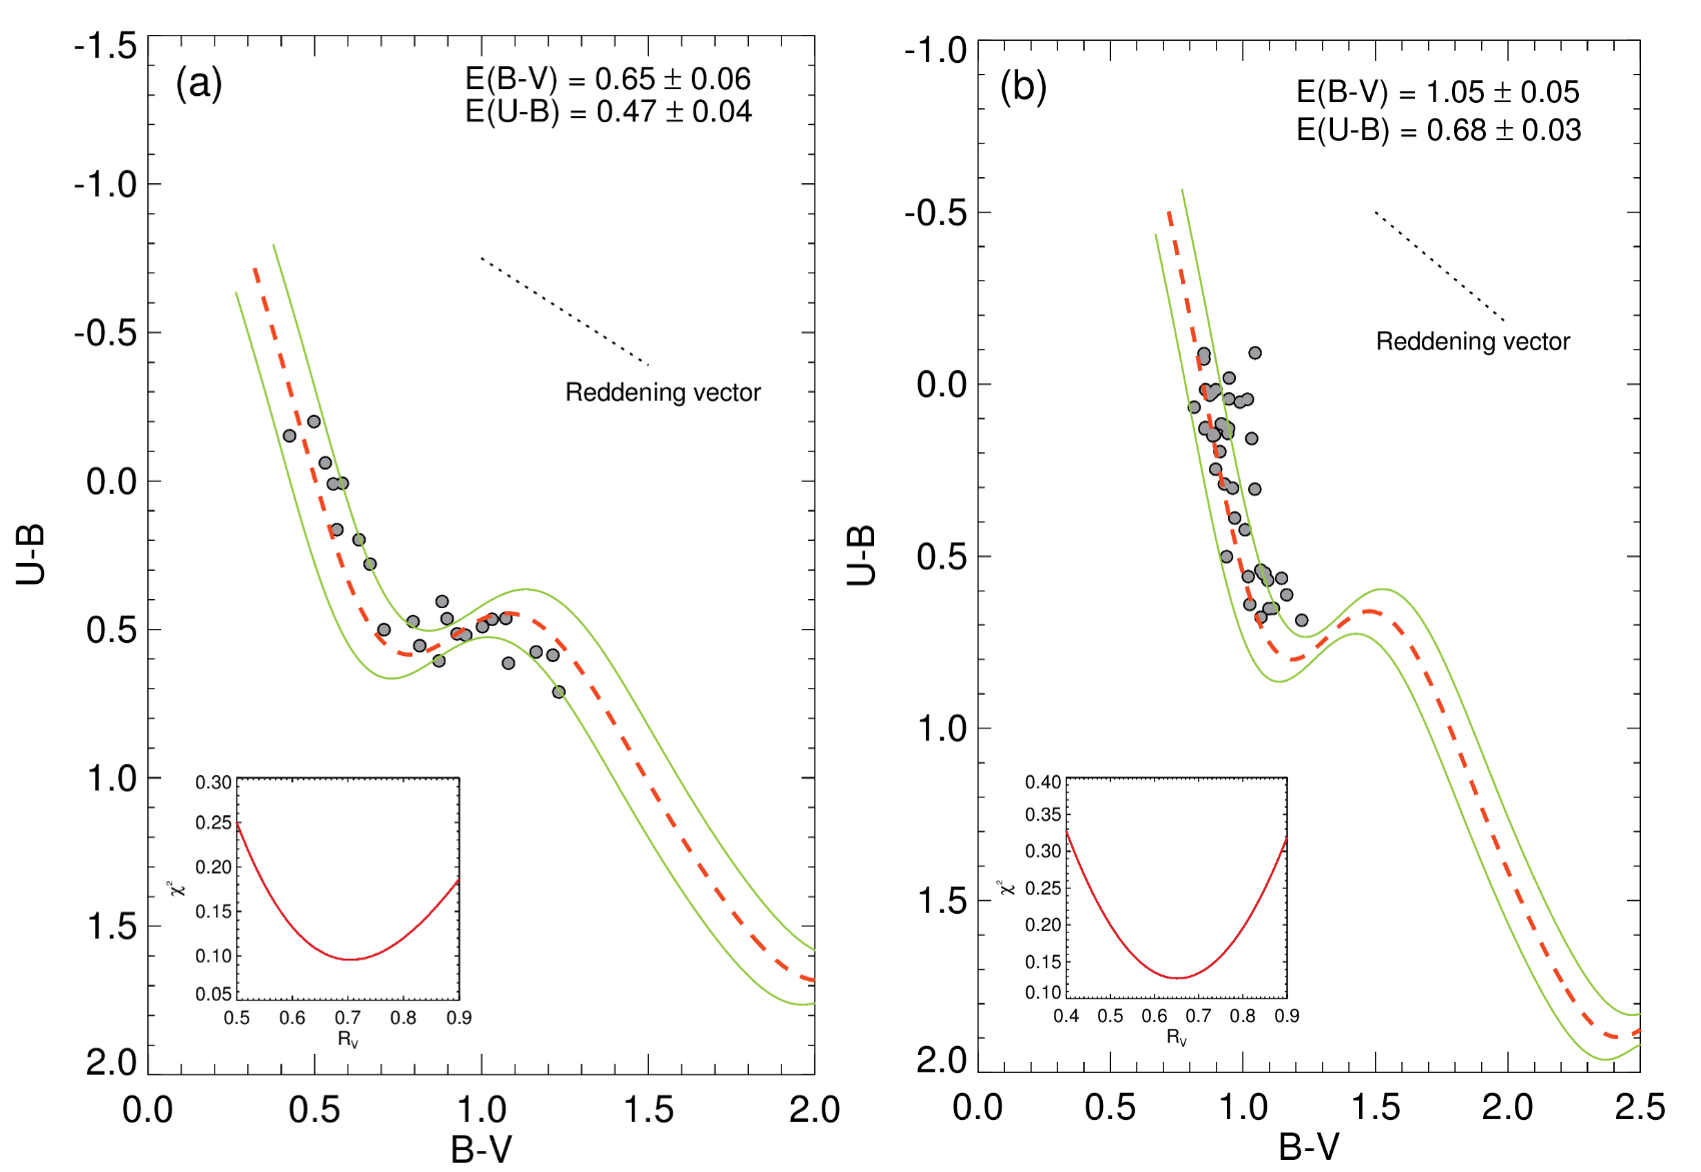
Because TCDs and CMDs are affected by interstellar reddening, one should first determine and colour excesses. To derive these parameters, we selected main-sequence stars within and magnitude ranges for Frolov 1 and NGC 7510, respectively. Then we plotted TCDs for these stars and compared their positions with the solar metallicity de-reddened ZAMS of Sung et al. (2013). To obtain the selective absorption coefficient () for each cluster, the ZAMS was fitted within with steps of 0.01 mag utilizing a optimization method (see inner panels of Fig. 8). values corresponding to the minimum were accepted for each of the clusters. This method led to the estimated the values of 0.72 and 0.65 for Frolov 1 and NGC 7510, respectively. The fitting process also derived best fitting values for the colour excesses of the two clusters. These colour excesses were determined as mag for Frolov 1 and mag for NGC 7510. The colour excesses were calculated as . The presented errors are standard deviations. The TCDs with the best fit ZAMS are shown as Fig. 8.
4.2 Metallicity
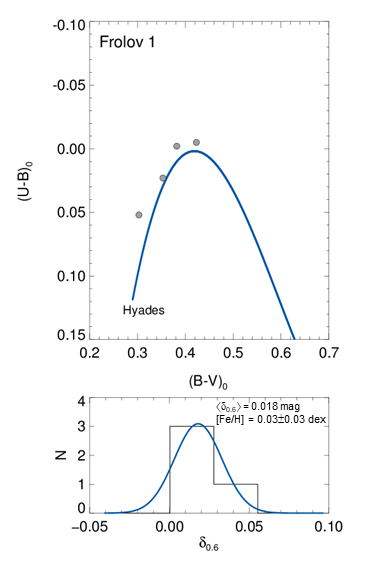
Metallicity of the two clusters has not been derived in the earlier studies in the literature. To obtain photometric metallicities we used the method described by Karaali et al. (2011). Because the method utilises F-G type main-sequence stars, we took into account the main-sequence stars whose colour index range is mag (Eker et al. 2018; 2020) and with membership probabilities during these analyses. We constructed de-reddened TCDs with the selected F-G type stars and the Hyades main-sequence. Then, we calculated the difference between the colour indices of the cluster stars and Hyades stars whose de-reddened colour indices are the same. This difference is described as the UV excess of the stars and calculated via the equation . Here, H and S represent the Hyades and cluster stars, respectively, which have same colour indices. Normalising the UV excess differences according to mag (i.e. ), we constructed the histogram of normalised values of the stars and then fitted the distribution with a Gaussian. From the Gaussian peak, we determined the metallicity of open clusters using the following equation as given by Karaali et al. (2011):
| (1) | |||
We could determine photometric metallicity only for Frolov 1 as there are no F-G type main-sequence stars within the colour index mag interval for NGC 7510. We identified four F-G type main-sequence stars to calculate the photometric metallicity of Frolov 1. TCD and normalised UV-excesses distribution are shown in Fig. 9. Uncertainty of the measurements is the statistical uncertainty width of the best fit Gaussian model. The metallicity [Fe/H] which represents the peak value for the distribution was determined as [Fe/H]= dex for Frolov 1. Going forward, in the absence of additional information, we adopted the metallicity of NGC 7510 as the solar value ([Fe/H] = 0 dex).

To derive the age of the clusters, we transformed the [Fe/H] metallicities to the mass fraction , considering the following equations that analytically improved PARSEC isochrones (as given by Bovy555https://github.com/jobovy/isodist/blob/master/isodist/
Isochrone.py):
| (2) |
| (3) |
Here, and represent all elements heavier than helium and the intermediate operation function, respectively. denotes the solar mass fraction, which was taken as 0.0152 (Bressan et al., 2012). As a result of these calculations, we measured for Frolov 1.
4.3 Distance moduli and the ages of the clusters
Distance moduli and the ages of the clusters were determined by comparing the , , and CMDs with theoretical isochrones procured from the PARSEC synthetic stellar library (Bressan et al., 2012). For Frolov 1, since the reddening and metallicity were derived separately from TCDs and UV excesses according to distribution of member stars on these diagrams, as mentioned above, we kept reddening and metallicities as constants during the distance moduli and age calculations. To avoid degeneracies between the parameters it is important to measure astrophysical parameters separately. Indeed reddening and age values in particular can suffer from degeneracies and uncertainties of these parameters can be higher than expected (Bilir et al., 2010; Yontan et al., 2015; Bostancı et al., 2015). In order to achieve the best fit of isochrones during the calculations, we fitted them on CMDs with an emphasis on the main-sequence and turn-off members of the clusters. Errors estimates for the ages were determined visually by shifting isochrones to cover all main-sequence member stars. We used the relations given by Carraro et al. (2017) in determining the error estimates for the distance moduli and distances. For the age estimates made using the CMD, the PARSEC isochrone has been reddened according to the equation of . We calculated the coefficient (1.2803) in the equation from Wang & Chen (2019)’s selective absorption coefficients.The best fitting ischrone for Frolov 1 was , giving an age of Myr and a distance of pc. For NGC 7510, the best fitting isochrone was , giving an age of Myr and a distance of pc. These isochrones are over-plotted in the , and CMDs given as Fig. 10. Different distance estimations will be discussed later in connection with the Gaia measurements in Section 4.4.
Since Frolov 1 and NGC 7510 are relatively young ( Myr) open clusters, there can still be cluster members that are pre-main sequence stars (PMS). This may affect the determination of the astrophysical parameters of the clusters. In this study we considered the evolutionary properties of the PARSEC isochrones which were fitted to member stars in different luminosity classes, leading to possible PMS limits for the two clusters being determined. These limits are and mag for Frolov 1 and NGC 7510, respectively, and are shown as thick horizontal lines in Fig. 10. Additionally the and completeness magnitude limits of the two clusters are shown as the thin horizontal black lines on the same figures. Since Gaia and bands are located in blue and red part of the optical electromagnetic spectrum and they are wider than the UBV bands, pre-main sequence stars are more prominent on Gaia CMDs. In estimating the age and distance of the two clusters, it was concluded that the PARSEC isochrones that had been fitted to the most probable cluster member stars were not affected by the PMS stars within the theoretical limits in this study (see Fig. 10).
4.4 Distance comparisons and mean proper motions of the clusters
We calculated mean values of the proper motion components and Gaia distances for the two clusters from Gaia DR2 astrometric data (Gaia collaboration et al., 2018). Using the linear equation of (mas), we transformed the Gaia trigonometric parallaxes to Gaia distances for each star that was selected as a member of Frolov 1 and NGC 7510. Then we constructed the distance histograms, fitted Gaussian curves to them (Fig. 11), and derived mean Gaia distances (). The stated uncertainties in distances are one standard deviation.
Just after the Gaia DR2 (Gaia collaboration et al., 2018), many researchers found different trigonometric parallax zero-point values based on different objects (i.e. Arenou et al., 2018; Lindegren et al., 2018; Riess et al., 2018). These values vary between and mas (Lindegren et al., 2018; Stassun & Torres, 2018). Lindegren et al. (2018) used a sample of quasars with Gaia DR2 and proposed a mas value for the offset correction to trigonometric parallaxes. However, Stassun & Torres (2018) used a Gaia DR2 data of eclipsing binary systems whose magnitudes are brighter than mag and with distances within kpc, finding evidence for a systematic offset of mas. The zero point-offset corrections of Gaia DR2 parallaxes can be tested by considering the distance of the open clusters determined by isochrone fitting method and the distances obtained from Gaia DR2 parallaxes. In this study, to examine the offsets of the two cluster distances, we converted the distances calculated by isochrone fitting and Gaia DR2 trigonometric parallaxes (Table 7) to parallaxes using the equation of (pc) and the differences between them () were calculated. For Frolov 1, isochrone fitting and Gaia distances translate to and mas, respectively. These values are and mas for NGC 7510. The differences in the sense are and mas for Frolov 1 and NGC 7510, respectively. Both these results are in good agreement with the values given in different studies (i.e. Arenou et al., 2018; Lindegren et al., 2018; Riess et al., 2018; Stassun & Torres, 2018). As a result of these distance comparisons we concluded that trigonometric parallax corrections are not statistically notable. In this study, we did not apply a zero-point offset correction for Gaia DR2 trigonometric parallaxes of the cluster member stars. Arenou et al. (2018) suggest that examining different samples of sources can change the derived parallax zero-point values.

Recently Bailer-Jones et al. (2018) (hereafter BJ18) indicated that using a linear method for measuring distances from trigonometric parallaxes does not give precise results. Based on this finding, they improved the geometric approach to calculate distances of stars, making use of probability distributions for the distances of stars. Bailer-Jones et al. (2018) applied a geometric approach to 1.33 billion objects in the Gaia DR2 catalogue) to estimate distances and distance errors. In this context, to understand how different results from linear and geometric approaches are, we sourced distances of cluster member stars given in the catalogue of Bailer-Jones et al. (2018). In calculating the mean distances of the two clusters, Gaia stars with a relative parallax error of less than 0.5 were taken into account. Then we constructed the two distance histograms of these values and fitted Gaussian curves to derive the mean distances. We compared the two distance distributions, as shown in Fig. 11. Calculated distances from three different methods are listed in Table 7 for the two clusters. In Table 7, we can clearly see that the distances determined with isochrone fitting are more compatible with the ones from Bailer-Jones et al. (2018).
In this study, as mentioned in Section 3.3, we used the methods given by Balaguer-Nunez et al. (1998) and calculated membership probabilities based on Gaia DR2 proper motions. Cantat-Gaudin et al. (2018) studied 401,488 stars in 1,229 open clusters and determined both their membership probabilities and mean proper motions from photometric and astrometric data of the Gaia DR2 (Gaia collaboration et al., 2018). To estimate membership probabilities, they applied a different calculation method which is given by Krone-Martins & Moitinho (2014). As Frolov 1 is not examined in the study of Cantat-Gaudin et al. (2018), we could only compare the results of NGC 7510 with their results. In Table 7, it can be clearly seen that the mean proper motion values calculated in this study and Cantat-Gaudin et al. (2018) are in good agreement. However, methods differ from each other across the three studies, so the coherence of the results indicates that the member stars were selected accurately and isochrone fitting is still reliable for distance estimations of open clusters. Also, one should remember that the astrophysical parameters determined with independent methods in this study, as well as distances calculated from different three methods, are compatible. So, we can conclude that the results obtained in the study have not suffered from parameter degeneracy.
4.5 Mass functions
We used the best fitting PARSEC isochrones for the two clusters to determine the present-day mass functions (MFs). Taking into account main-sequence stars, we first specified a high degree polynomial function between theoretical band absolute magnitudes and masses, and identified an absolute magnitude-mass relation. Then, we calculated band absolute magnitudes of cluster member stars according to the derived distance moduli of the clusters. Following this, using the derived relation we measured masses of the most likely cluster member stars for each cluster. Taking the relation of (where, and are number of stars in a mass interval with central mass and slope of the MF, respectively) we determined mass function slopes. MF slopes were derived within as for Frolov 1, and across for NGC 7510. The resulting MF slopes are in good agreement with Salpeter (1955)’s value of . The best linear fits are shown as Fig. 12 and results are listed in Table 8 for both clusters.

| This Study | Cantat-Gaudin et al. (2018) | Bailer-Jones et al. (2018) | ||||||
|---|---|---|---|---|---|---|---|---|
| Cluster | ||||||||
| (pc) | (pc) | (mas yr-1) | (mas yr-1) | (pc) | (mas yr-1) | (mas yr-1) | (pc) | |
| Frolov 1 | 2,864254 | 2,800136 | 3.020.10 | 1.750.08 | – | – | – | 2,827285 |
| NGC 7510 | 2,818247 | 3,450477 | 3.660.07 | 2.170.06 | 3,178 | 3.660.13 | 2.190.13 | 3,040479 |
| Cluster | Mass Range | ||
|---|---|---|---|
| Frolov 1 | 24 | -1.210.18 | 1 5 |
| NGC 7510 | 83 | -1.420.27 | 2 10 |
5 Summary and Conclusion
We performed a study based on CCD UBV photometric and Gaia DR2 photometric and astrometric data of the open clusters Frolov 1 and NGC 7510. In Table 1 we listed derived basic parameters. We summarise the results of analyses as follows:
-
1.
We determined estimates for the reddening, metallicity, distance modulus, distance, and age of each cluster through the analysis of CCD UBV photometric data.
-
2.
Since the determination of cluster parameters is affected by many conditions, such as dense stellar regions, membership selection, high/differential extinction, and different analysis methods, degeneracies can result between reddening and age parameters (Anders et al., 2004; King et al., 2005) and in turn cause large discrepancies in estimates for the same cluster as studied by different authors. To avoid parameter degeneracy, we analysed the two clusters using independent methods and obtained the main astrophysical parameters separately.
-
3.
Fitting the RDP of King (1962), we derived structural properties for each cluster (Table 6). During the analyses we used the radii where stellar densities are flattened and converge with the background stellar density as the outer cutoff limits. These values are and arcmin for Frolov 1 and NGC 7510, respectively. Although the central stellar density and background stellar density values of Frolov 1 show that the cluster has a low stellar density concentration, from the RDP fitting results we conclude that Frolov 1 shows cluster structure.
-
4.
In order to obtain physical member stars of the clusters, we used Gaia DR2 proper motion values. In addition to this, we derived mean proper motion components for Frolov 1 as () mas yr-1, and for NGC 7510 as ) mas yr-1. We only could compare the results of NGC 7510 with Cantat-Gaudin et al. (2018) and found good agreement between the two studies.
-
5.
From the comparison of TCDs of the two clusters with the ZAMS (Sung et al., 2013), we derived colour excesses mag for Frolov 1 and mag for NGC 7510.
-
6.
Photometric metallicity could be obtained for Frolov 1 as [Fe/H]= dex, which corresponds to . Since there is a lack of F-G stars within mag range in NGC 7510, we adopted a metallicity for the cluster as being the solar value ([Fe/H]=0 dex, corresponding to ).
-
7.
Taking reddening and metallicity parameters as constants, we derived distance moduli and ages of two clusters via fitting theoretical isochrones to , , and CMDs. We found the distance modulus for Frolov 1 as being mag ( pc) together with an age Myr, while for NGC 7510 we found mag ( pc) and Myr respectively. These results are in agreement with those given by different authors.
-
8.
Mass functions were derived as for Frolov 1 and for NGC 7510. These mass function slopes are in good agreement with the value of Salpeter (1955).
6 Acknowledgments
This study has been supported in part by the Scientific and Technological Research Council (TÜBİTAK) 119F014. We thank TÜBİTAK for partial support towards using the T100 telescope via project numbers 15AT100-738 and 18CT100-1396. We also thank the on-duty observers and members of the technical staff at the TÜBİTAK National Observatory (TUG) for their support before and during the observations. This research made use of the WEBDA database, operated at the Department of Theoretical Physics and Astrophysics of the Masaryk University. This work also made use of data from the European Space Agency (ESA) mission Gaia666https://www.cosmos.esa.int/gaia, processed by the Gaia Data Processing and Analysis Consortium (DPAC)777https://www.cosmos.esa.int/web/gaia/dpac/consortium. Funding for the DPAC has been provided by national institutions, in particular those participating in the Gaia Multilateral Agreement.
References
- Ak et al. (2016) Ak, T., Bostancı, Z. F., Yontan, T., et al., 2016, Ap&SS, 361, 126
- Anders et al. (2004) Anders, P., Bissantz, N., Fritze-v. Alvensleben, U., de Grijs, R., 2004, MNRAS, 347, 196
- Arenou et al. (2018) Arenou, F., Luri, X., Babusiaux, C., Fabricius, C., et al., 2018, A&A, 616, 29
- Bailer-Jones et al. (2018) Bailer-Jones, C. A. L., Rybizki, J., Fouesneau, M., Mantelet, G., Andrae, R., 2018, ApJ, 156, 58
- Balaguer-Nunez et al. (1998) Balaguer-Nunez, L., Tian, K. P., Zhao, J. L., 1998, A&AS, 133, 387
- Banks et al. (2020) Banks, T., Yontan, T., Bilir, S., Canbay, R., 2020, JApA, 41, 6
- Barbon & Hassan (1996) Barbon, R., Hassan, S.M., 1996, A&AS, 115, 325
- Bertelli et al. (1994) Bertelli, G., Bressan, A., Chiosi, C., Fagotto, F., Nasi, E., 1994, A&AS, 106, 275
- Bertin & Arnouts (1996) Bertin, E., Arnouts, S., 1996, A&AS, 117, 393
- Bilir et al. (2010) Bilir, S., Güver, T., Khamitov, I., Ak, T., Ak, S., Coşkunoğlu, K. B., Paunzen, E., Yaz, E., 2010, Ap&SS, 326, 139
- Bilir et al. (2016) Bilir, S., Bostancı, Z. F., Yontan, T., et al., 2016, AdSpR, 58, 1900
- Bostancı et al. (2015) Bostancı, Z. F., Ak, T., Yontan, T., et al., 2015, MNRAS, 453, 1095
- Bostancı et al. (2018) Bostancı, Z. F., Yontan, T., Bilir, S., et al., 2018, Ap&SS, 363, 143
- Bressan et al. (2012) Bressan, A., Marigo, P., Girardi, L., Salasnich, B., Dal Cero, C., Rubele, S., Nanni, A., 2012, MNRAS, 427, 127
- Buscombe (1953) Buscombe, W., 1953, ApJ, 118, 459
- Cantat-Gaudin et al. (2018) Cantat-Gaudin, T., Jordi, C., Vallenari, A., Bragaglia, A., et al., 2018, A&A, 618A, 93
- Cantat-Gaudin & Anders (2020) Cantat-Gaudin, T., Anders, F., 2020, A&A, 633A, 99
- Carraro et al. (2017) Carraro, G., Sales Silva, J. V., Moni Bidin, C., Vazquez, R. A., 2017, ApJ, 153, 20
- Dias et al. (2002) Dias, W. S., Alessi, B. S., Moitinho, A., Lépine, J. R. D., 2002, A&A, 389, 871
- Eker et al. (2018) Eker, Z., Bakış, V., Bilir, S., et al., 2018, MNRAS, 479, 5491
- Eker et al. (2020) Eker, Z., Soydugan, F., Bilir, S., et al., 2020, MNRAS, 496, 3887
- Fenkart & Schroeder (1985) Fenkart, R. P., Schroeder, A., 1985, A&AS, 59, 83
- Frolov (1977) Frolov, V. N., 1977, Astronomicheskii Tsirkulyar, No. 957, 6
- Gaia collaboration et al. (2018) Gaia Collaboration, Brown, A. G. A., Vallenari, A., Prusti, T., et al., 2018, A&A, 616, 1
- Hoag et al. (1961) Hoag, A. A., Johnson, H. L., Iriarte, B., Mitchell, R. I., Hallam, K. L., Sharpless, S., 1961, PUSNO, 17, 343
- Høg, et al. (2000) Høg, E., Fabricius, C., Makarov, V. V., et al., 2000, A&A, 355, L27
- Iriarte (1958) Iriarte, B., 1958, ApJ, 127, 507
- Janes & Hoq (2013) Janes, K., Hoq, S., 2013, AJ, 141, 92
- Johnson et al. (1961) Johnson, H. L., Hoag, A. A., Iriarte, B., Mitchell, R. I., Hallam, K. L., 1961, Bulletin/Lowell Observatory, 113, 5, Bulletin (Lowell Observatory) 133
- Karaali et al. (2011) Karaali, S., Bilir, S., Ak, S., Yaz, E., Coşkunoğlu, B., 2011, PASA, 28, 95
- Kharchenko (2001) Kharchenko, N. V., 2001, KFNT, 17, 409
- Kharchenko et al. (2005) Kharchenko, N. V., Piskunov, A. E., Roeser, S., Schilbach, E., Scholz, R. -D., 2005, A&A, 438, 1163
- Kharchenko et al. (2013) Kharchenko, N. V., Piskunov, A. E., Schilbach, E., Röser, S., Scholz, R.-D., 2013, A&A, 558, A53
- King (1962) King, I., 1962, AJ, 67, 471
- King et al. (2005) King, I. R., Bedin, L. R., Piotto, G., Cassisi, S., Anderson, J., 2005, AJ, 130, 626
- Krone-Martins & Moitinho (2014) Krone-Martins, A., Moitinho, A., 2014, A&A, 561. 12
- Landolt (2009) Landolt, A. U., 2009, AJ, 137, 4186
- Lindegren et al. (2018) Lindegren, L., Hernández, J., Bombrun, A., et al., 2018, A&A, 616, 55
- Lynga (1987) Lynga, G., 1987, Catalogue of Open Cluster Data, 5th edition, CDS, Strasbourg
- Netopil et al. (2016) Netopil, M., Paunzen, E., Heiter, U., Soubiran, C., 2016, A&A, 585A, 150
- Paunzen et al. (2005) Paunzen, E., Netopil, M., Iliev, I. K., Maitzen, H. M., Claret, A., Pintado, O. I., 2005, A&A, 443, 157
- Riess et al. (2018) Riess, A. G., Casertano, S., Yuan, Wenlong, et al., 2018, ApJ, 861, 13
- Sagar & Griffiths (1991) Sagar, R., Griffiths, W. K., 1991, MNRAS, 250, 683
- Salpeter (1955) Salpeter, E. E., 1955, ApJ, 121, 161
- Stassun & Torres (2018) Stassun, K. G., Torres, G., 2018, ApJ, 862,61
- Sung et al. (2013) Sung, H., Lim, B., Bessell, M. S., Kim, J. S., Hur, H., Chun, M., Park, B., 2013, JKAS, 46, 103
- Trumpler (1930) Trumpler, R. J., 1930, LicOB, 420, 154
- Wang & Chen (2019) Wang, S., Chen, X., 2019, ApJ, 877, 116
- Yontan et al. (2015) Yontan, T., Bilir, S., Bostancı, Z. F., et al., 2015, Ap&SS, 355, 267
- Yontan et al. (2019) Yontan, T., Bilir, S., Bostancı, Z. F., et al., 2019, Ap&SS, 364, 20