School of Science and Technology
NOVA University Lisbon
Portugal
Explainable Abstract Trains Dataset
Abstract
The Explainable Abstract Trains Dataset is an image dataset containing simplified representations of trains. It aims to provide a platform for the application and research of algorithms for justification and explanation extraction. The dataset is accompanied by an ontology that conceptualizes and classifies the depicted trains based on their visual characteristics, allowing for a precise understanding of how each train was labeled. Each image in the dataset is annotated with multiple attributes describing the trains’ features and with bounding boxes for the train elements.
1 Introduction
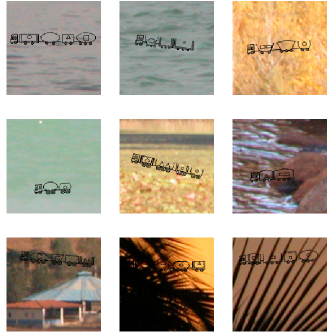
We introduce the Explainable Abstract Trains Dataset111Available at https://bitbucket.org/xtrains/dataset/ (XTRAINS), an annotated image dataset focused on explainability, built with the objective of facilitating the research of algorithms for justification and explanation extraction. The XTRAINS dataset contains images of pixel art representations of trains, inspired by the trains developed by J. Larson and R. S. Michalski in [2], as shown in Figure 1.
The XTRAINS dataset was built for and used in [1] to illustrate a method to produce symbolic justifications for the output of artificial neural networks. It is accompanied by an ontology, shown in Figure 6 (in Appendix 0.A), designed to conceptualize and describe the train representations in this dataset. The ontology provides ground-truth knowledge regarding how each image was labeled, allowing for ontology learning methods, such as the ones described in [4] to be benchmarked in this dataset. The provided bounding boxes allow for attribution methods [6, 8] and salience mapping [7, 9] methods to be tested, using evaluation metrics, e.g., like the one described in [5].
2 Image Composition
Each image in the dataset portrays a single train representation over a background image. All background images are random fragments from the images in the McGill Calibrated Colour Image Database [3]. A train is composed by a locomotive and a set of wagons that may have some contents. Each train representation is characterized as follows:
-
•
- Wagons
-
The set of wagons contained in the train, further described below. The number of wagons in a train is equal to the integer part of a value sampled from a truncated normal distribution constrained to the interval , with a mean of , and a standard deviation of .
- •
-
•
- Couplers’ height
-
The height at which each coupler is attached, one of possible heights. The height is uniformly distributed between those values.
-
•
- Wagons’ spacing
-
The number of pixels separating each wagon, one of possible values. The separation is uniformly distributed between those values.
-
•
- Position and angle
-
The trains’ position and angle inside an image. A train’s position is randomly selected taking into consideration the train’s dimensions to ensure that the train is always visible in the image. The angle of each train is sampled from a truncated normal distribution constrained to the interval , with a mean of , and a standard deviation of .
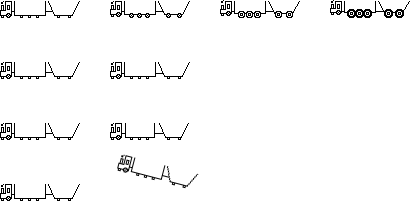
The effect of varying the wheel size, couplers’ height, wagons’ spacing and the position and angle of a train is shown, respectively, in each row of Figure 2.
A wagon is characterized as follows:
-
•
- Length
-
The wagon’s length in pixels. A wagon has a length of pixels with a probability of and a length of pixels with a probability of .
-
•
- Wall shape
-
The shape of the wagon’s walls, one of available shapes.
-
•
- Roof shape
-
The shape of the wagon’s roof, one of available shapes.
-
•
- Amount of visible wheels
-
The number of visible wheels in a wagon, one of possible values.
-
•
- Contents
-
The contents carried by a wagon, further described below.
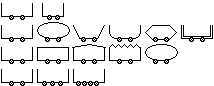
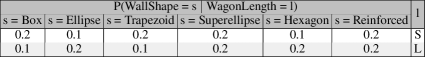
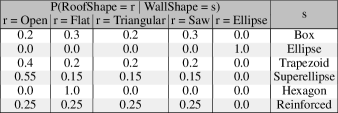
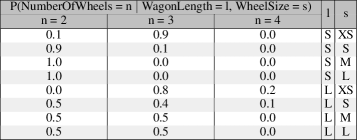
The values of a wagons’ wall shape, roof shape and amount of wheels are conditioned by the wagon’s length and by each others’ values, with probability mass functions of these features presented, respectively, in Figure 8, 9 and 10 (in Appendix 0.B). The effect of individually varying each feature is depicted in Figure 3.
The contents of a wagon, if any, are characterized as follows:
-
•
- Shape
-
The shape of the content, one of available shapes.
-
•
- Size
-
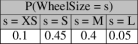
The size of the content, one of available sizes.
-
•
- Quantity
-
The content’s quantity, one of possible values.
-
•
- Position
-
The position of the contents inside a wagon. This value is dependent on the contents’ shape, size, and quantity and on the trains’ length and wheel size, ensuring that the contents are always inside the wagon.
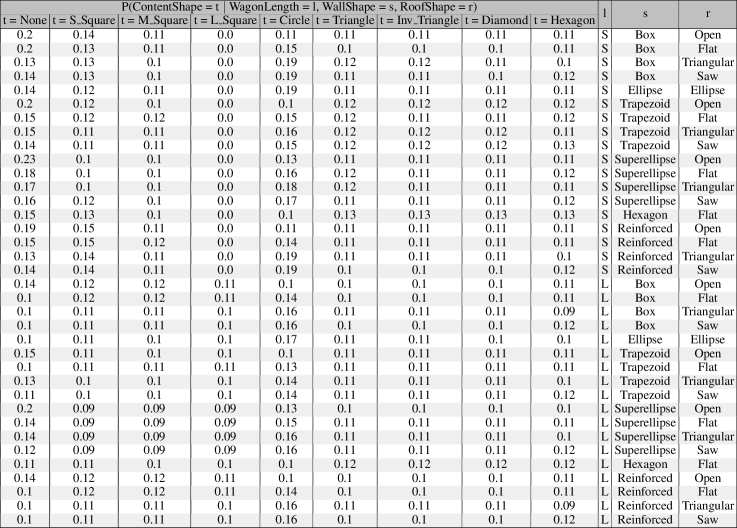
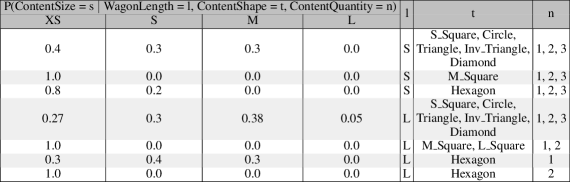
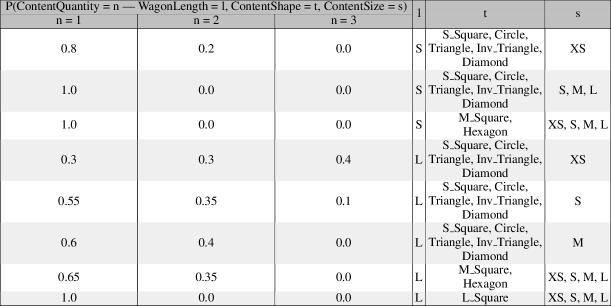
The probabilities associated with the values of the shape, size, and quantity of a wagons’ content are conditioned by the wagon’s length, wall shape, and roof shape and by each others’ values, and can be seen, respectively, in Figures 11, 12, and 13 (in Appendix 0.B). The effect of varying each of these features individually is illustrated, respectively, in each row of Figure 4.

Additionally, we associate to the floor and each wall of a wagon a probability of it being thicker, drawing it with a thickness of pixels, instead of . Noise was also deliberately introduced in the form of missing pixels from the trains’ representations, up to of the trains’ pixels might not be drawn. The resulting effect is depicted in Figure 5, the first train has no thick walls or missing pixels and the fourth train shows both effects combined.

3 Dataset Annotations
All images in the dataset are annotated with binary attributes, shown in Figure 14 (in Appendix 0.C), such as indicating if there is any wagon with wheels visible in the image, and with numeric attributes, shown in Figure 15 (in Appendix 0.C), like indicating the angle of the train inside an image. The values for those attributes were either obtained directly when generating each image, e.g., the value of the attribute , indicating the number of wagons in an image, or obtained through reasoning with the axioms in the datasets’ ontology, e.g., , indicating a train with, at least, long wagons or wagons. Furthermore, each image was also annotated with bounding boxes for the following elements:
-
•
Train;
-
•
Train’s Wagon;
-
•
Wagon’s Contents;
-
•
Wagon’s Roof;
-
•
Wagon’s Wheels.
4 Image Generator
We also make available an image generator222Available at https://bitbucket.org/xtrains/dataset/ capable of generating the XTRAINS dataset. This generator has multiple parameters, e.g., to define the length of the trains’ wagons, or to define the different possible amounts of wheels of a wagon, which are set to be in accord with the descriptions provided above. By changing the values of these parameters, it is possible to generate new datasets with different characteristics.
5 Conclusion
The XTRAINS dataset has a total images over multiple different classes of trains. We hope that the large number of different annotations provided, coupled together with the knowledge embedded in the provided ontology make the XTRAINS dataset useful to benchmark different methods and techniques, notably in the area of Explainable AI.
Acknowledgements
The authors would like to thank the support provided by Calouste Gulbenkian Foundation through its Young Talents in AI program, by FCT project ABSOLV (PTDC/CCI-COM/28986/2017), and by FCT strategic project NOVA LINCS (UIDB/04516/2020).
References
- [1] Manuel de Sousa Ribeiro and Joao Leite. Aligning artificial neural networks and ontologies towards explainable AI. In The Thirty-Fifth AAAI Conference on Artificial Intelligence, AAAI’21. AAAI Press, 2021.
- [2] J. Larson and Ryszard S. Michalski. Inductive inference of VL decision rules. SIGART Newsl., 63:38–44, 1977.
- [3] Adriana Olmos and Frederick A. A. Kingdom. A biologically inspired algorithm for the recovery of shading and reflectance images. Perception, 33(12):1463–1473, 2004. PMID: 15729913.
- [4] Ana Ozaki. Learning description logic ontologies: Five approaches. where do they stand? Künstliche Intell., 34(3):317–327, 2020.
- [5] Karl Schulz, Leon Sixt, Federico Tombari, and Tim Landgraf. Restricting the flow: Information bottlenecks for attribution. In 8th International Conference on Learning Representations, ICLR 2020, Addis Ababa, Ethiopia, April 26-30, 2020. OpenReview.net, 2020.
- [6] Avanti Shrikumar, Peyton Greenside, Anna Shcherbina, and Anshul Kundaje. Not just a black box: Learning important features through propagating activation differences. CoRR, abs/1605.01713, 2016.
- [7] Karen Simonyan, Andrea Vedaldi, and Andrew Zisserman. Deep inside convolutional networks: Visualising image classification models and saliency maps. In Yoshua Bengio and Yann LeCun, editors, 2nd International Conference on Learning Representations, ICLR 2014, Banff, AB, Canada, April 14-16, 2014, Workshop Track Proceedings, 2014.
- [8] Matthew D. Zeiler and Rob Fergus. Visualizing and understanding convolutional networks. In David J. Fleet, Tomás Pajdla, Bernt Schiele, and Tinne Tuytelaars, editors, Computer Vision - ECCV 2014 - 13th European Conference, Zurich, Switzerland, September 6-12, 2014, Proceedings, Part I, volume 8689 of Lecture Notes in Computer Science, pages 818–833. Springer, 2014.
- [9] Bolei Zhou, Aditya Khosla, Àgata Lapedriza, Aude Oliva, and Antonio Torralba. Object detectors emerge in deep scene cnns. In Yoshua Bengio and Yann LeCun, editors, 3rd International Conference on Learning Representations, ICLR 2015, San Diego, CA, USA, May 7-9, 2015, Conference Track Proceedings, 2015.
Appendix 0.A Ontology

Appendix 0.B Train Features’ Probability Mass Function
Appendix 0.C Dataset Attributes

