Visuo-Locomotive Complexity as a Component of
Parametric Systems for Architecture Design
Abstract
A people-centred approach for designing large-scale built-up spaces necessitates systematic anticipation of user’s embodied visuo-locomotive experience from the viewpoint of human-environment interaction factors pertaining to aspects such as navigation, wayfinding, usability. In this context, we develop a behaviour-based visuo-locomotive complexity model that functions as a key correlate of cognitive performance vis-a-vis internal navigation in built-up spaces. We also demonstrate the model’s implementation and application as a parametric tool for the identification and manipulation of the architectural morphology along a navigation path as per the parameters of the proposed visuospatial complexity model. We present examples based on an empirical study in two healthcare buildings, and showcase the manner in which a dynamic and interactive parametric (complexity) model can promote behaviour-based decision-making throughout the design process to maintain desired levels of visuospatial complexity as part of a navigation or wayfinding experience.
Keywords: Visual Perception – Environmental Psychology – Architecture Design – Parametric Design – Cognitive Computational Modelling – Spatial Cognition – AI and Design
Publication Note
This is a preprint of the contribution published as part of the proceedings of ICoRD 2021: 8th International Conference on Research into Design, IDC School of Design (IIT Mumbai, India).
ICoRD 2021, www.idc.iitb.ac.in/icord2021/.
The overall scientific agenda driving this research may be consulted here:
The DesignSpace Group / www.design-space.org
Select publications related to this research are available at:
www.codesign-lab.org/select-papers (under DesignSpace)
1 Introduction
The design of navigation and wayfinding systems within large-scale built-up spaces is a particularly challenging task: research in behavioural, computational, and mixed-methods interdisciplinary approaches in spatial cognition, architecture design cognition, and artificial intelligence for design have shown that diverse morphological and ecological aspects pertaining to space, perception, and human factors constitute a correlate of visuo-locomotive cognitive experience in built-up space from the viewpoint of tasks as navigation and wayfinding (Bhatt and Schultz, 2017; Bhatt, 2018; Bhatt et al., 2014; Kondyli and Bhatt, 2018; Devlin, 2014; O’Neill, 1991; Weisman, 1981).
Visuo-Locomotive Experience During Navigation Visuo-locomotive experience most broadly refers to the embodied cognitive experience of environmental space through a multimodal perceptual integration, e.g., encompassing visual, locomotive and auditory exploration (Bhatt and Schultz, 2017; Bhatt et al., 2014). From the viewpoint of this paper, examining the embodied experience of users through interaction with the architectural space during active locomotion includes quantitative measurements and qualitative analysis of a range of aspects including visual attention (e.g. fixation, saccades), fine-grained behaviour (e.g., stopping, looking around, interacting with other people), orientation tasks, spatial memory (e.g. sketch maps, questionnaires) etc (details in papers Bhatt et al. (2016b); Kondyli and Bhatt (2018)). The focus of this paper is on visuo-locomotive experience as it pertains to aspects of visuospatial and locomotive complexity as articulated in this research.
Visuospatial and Locomotive Complexity To measure the effect of the architectural space on the visuo-locomotive experience we take into consideration behavioural data of perceived visuospatial stimuli with respect to the attributes involved in the dynamic scene (e.g. form, colours, layout) (Fig. 1). Even though a combination of these attributes can result to complex scenes, people are able to form a coherent percept amid numerous regions and identify properties and semantics of a scene at a glance (Potter, 1976). Visual complexity has been broadly defined as the level of detail and intricacy contained within the image or a scene (Snodgrass and Vanderwart, 1980). Its effect on visual attention and spatial cognition, and corresponding measurement methodologies have been investigated in disciplines such as cognitive science, psychology, computer science, or marketing (Cavalcante et al., 2014; Moacdieh and Sarter, 2015; Rosenholtz et al., 2007; Madan et al., 2018). With the term visuospatial and locomotive complexity we consider the combination of visual and spatial characteristics that both coexist in dynamic naturalistic scenes where a person navigates (Kondyli and Bhatt, 2018; Kondyli et al., 2020) 111Henceforth, we use the terms visuospatial and visuo-locomotive complexity interchangeably. Other factors influencing embodied visuo-locomotive experience in space are familiarity, nature of the task (e.g. exploration, wayfinding), individual differences (e.g. age, spatial skills) etc. However these aspects are beyond the scope of this paper.. Although complexity can provide an interesting and cognitively stimulating environment (Cassarino and Setti, 2016), excessive visual or spatial complexity can impact cognitive processes involved in visuo-locomotive experience of people in everyday tasks such as navigation or wayfinding (Boeing, 2018; Fortenbaugh et al., 2008; Feldman, 2004).
In this paper we study the visuospatial complexity of the architectural space from the human-centred perspective of embodied visuo-locomotive experiences. We present a cognitive model of visuospatial and locomotive complexity that embeds empirical knowledge on the effect of environmental and dynamic attributes on human behaviour and we define a scale of complexity. We introduce the model to a parametric design system and demonstrate how a designer can identify Classets of complexity for a particular path or a segment of it, as well as modify the morphology of space along a path in order to maintain complexity to a preferable level. As currently there is no universally accepted or empirically defined scale for visuospatial complexity our method aims to organise and link the different attributes involved and their contribution to a visuospatial complexity scale, however, more empirical studies are needed to support our classification.
2 A Model of Visuo-Locomotive Complexity for Spatial Design
To model visuospatial complexity based on its effect on humans during active locomotion, we examine the attributes involved in the naturalistic dynamic scene and how they evolve along a navigation path. We combine empirical results from previous studies on visual and spatial complexity metrics together with the result of a behavioural study in two healthcare facilities in the Parkland Hospital (Kondyli et al., 2018). We consider visuospatial and locomotive complexity as an implicit measure of cognitive load (Harper et al., 2009) and inefficient navigation, and we use the behavioural analysis along the path (through a combination of behavioural metrics such as delays, visual search performance, ask for help, loss of orientation, etc.) to identify locations with high complexity and further examine the present environmental and dynamic attributes.
| VISUOSPATIAL COMPLEXITY | Proportional relationship to complexity and Description |
|---|---|
| A1. Quantitative Attributes | |
| SIZE | (+/-) The dimensions of the physical space, the area coved by the visual stimulus. |
| CLUTTER | (+) |
| Quantity | (+) No. components (objects, people, shapes etc.) |
| Variety of Colours | (+) No. colours |
| Variety of Shapes/Objects | (+) No. shapes / objects |
| Objects Density | (+) No. objects in a defined area |
| Edges Density | (+) No. edges of objects, No. of polygon vertices of a perimeter (fractal dimension) |
| Luminance | (-) Amount of light emitted / reflected from the scene |
| Saliency | (-) Prominent elements based on characteristics of colour, luminance and contrast |
| Target-background similarity | (+) Compare similarity in luminance, contrast, structure, orientation, etc. |
| A2. Structural Attributes | |
| Repetition | (-) Recurrence of (groups) elements or characteristics on a line/a grid/ a pattern |
| Symmetry | (-) Resilience to transformation (reflectional/rotational/translational/helical/fractal) |
| Order | (-) Organised elements based on a recognised structure, fractal dimension, axial lines |
| Homogeneity/Heterogeneity | (-) Being all the same kind or diverse (single shape repeated - multiple distinct shapes) |
| Regularity | (-) Variations in a placement rule across a surface/line (polygons - abstract shapes) |
| Openness | (-) The ratio between empty and full space |
| Grouping | (-) No. elements that are part of a group |
| Rotation Metric∗ | (+) Accumulated degrees of rotation angle during locomotion, No. of turns |
| Visibility∗ | (-) Visual range from a vantage point, visual connectivity between points |
| Interconnection Density∗ | (+) No. of directional choices in each node (e.g. decision point, junction) |
| A3. Dynamic Attributes | |
| Motion | (+) No. people or objects moving in the scene |
| Flicker | (+) Abrupt changes over-time (in luminance, colours, etc.) |
| Speed | Direction | (+) The rate of change of position with respect to time | Move or facing towards |
Measuring Visuo-Locomotive Experience The model (Table 1) derives from a taxonomy of objective physical attributes from the scene analysis that affects visuospatial perception and cognitive functions (e.g. driving, walking) (Kondyli et al., 2020). However, embodied cognitive experience whilst in motion along a path cannot be investigated based on a discrete analysis of a series of singular scenes. Therefore, the model is enriched with attributes pertaining to visuo-locomotive complexity such as rotation metric, visibility, interconnection density (Kondyli and Bhatt, 2018). The attributes are categorised into:
A1. Quantitative Attributes. Referring to objective environmental attributes such as low-level (edge, colors) and middle-level (corners, orientation) features of the scene. Studies on visual attention mostly on real-world static scenes, have shown how these environmental attributes can lead to a overabundance of information (known as clutter), work as distractors, and impact the visual search performance (Henderson et al., 2009; Rosenholtz et al., 2007; Park et al., 2014). Clutter in architectural space may also involve the fractal dimension, referring to the number of polygon vertices of a perimeter of a space. Manifest cues, such as signage and landmarks, are part of clutter however because of their semantic significance as navigation aid objects they constitute major visual attention targets.
A2. Structural Attributes. Refer to the relation that the elements form due to positioning in space, or the overall distribution on the viewing scene. The presence of regularities, symmetry, repetition, or order simplifies the scene (Feldman, 2004; Van der Helm, 2000) while randomised arrangements contribute to higher complexity classes. Homogeneity/Heterogeneity, regularity of shapes and objects, grouping of elements in space, openness of space and their relationship to complexity have been previously introduced in the fields of urban design and architecture (Boeing, 2018; Salingaros, 2014). These attributes formulate the environmental structure along the navigation path, and impact the holistic legibility of the environment, including aspects of interconnection density (Weisman, 1981; O’Neill, 1991), visibility (e.g. visual range, line of sight) (Benedikt, 1979), rotational locomotion (Kondyli and Bhatt, 2018). On the contrary, wayfinding studies show the value of architectural differentiations and breaks in the structural order as a design tool for distinguished areas that facilitate navigation (Baskaya et al., 2004).
A3. Dynamic Attributes. Studying active embodied locomotion, such as navigation, involves studying dynamic parts of the scene, as for example people or moving objects or the ratio of changes per meter. Dynamic attributes have a major impact on visual attention patterns, as clusters of attention often coincide with semantically rich objects such as eyes, hands (Mital et al., 2011). Moreover, cortical analysis shows a selective response to moving elements on the scene, meaning that people are able to notice moving objects even if they are not looking for them (Rosenholtz et al., 2007).
3 An Empirical Basis for a Visuospatial Complexity Scale
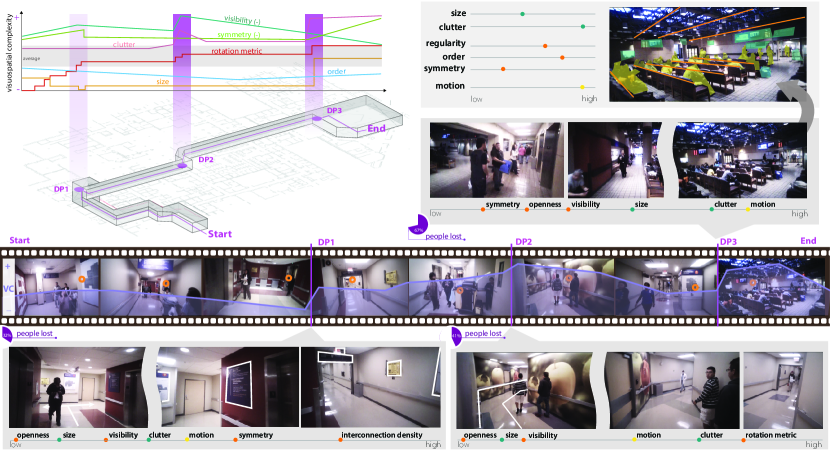
Case study in Parkland Hospital In a behavioural case study conducted in two large-scale healthcare facilities (Old and New) in Parkland Hospital in Texas (USA), 25 participants performed a navigation task from the Emergency room to the Pharmacy. We employed a range of sensors for measuring embodied visuo-locomotive experience and navigation performance (e.g. eye-tracking, egocentric video, external camera based video, questionnaires, orientation task) and detect locations in the path where a number of participants were disoriented or confused (details in (Bhatt et al., 2016b; Kondyli et al., 2018)).
Behavioural and Environmental Analysis The correlations between the environmental and the behavioural analysis suggest that peculiar geometries (non symmetrical, not regular), narrow, long and high cluttered corridors are places where people tend to be frequently confused. Additionally, the presence of a combination of these attributes leads to low visibility and a great angle of rotation by the participant along the path that aggravate the navigation performance. For instance, in Decision Point 2 in the Old Parkland Hospital, we record 41% of participants having a disorientation or confusion event (e.g. stop, hesitation, look around, intensive visual search to both directions, etc. (Kondyli and Bhatt, 2018), Fig. 1). The place is characterised by narrow non-symmetrical and non-regular long cluttered corridors, that leads to reduced visibility. The place is also regularly occupied by dynamic attributes such as moving obstacles, pedestrian, people on wheelchairs moving in various directions. However, the questionnaires show that the landmark in the corridor (apple posters in bottom row of Fig. 1) was visually accessible and well recorded in spatial memory.
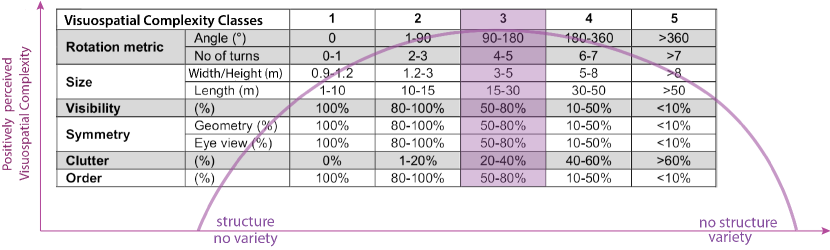
The effect of combined attributes These observations suggest that the combination of attributes present in the scene can have a counterbalancing effect on the overall visuospatial complexity level, however further empirical work is needed to define the combinations of attributes that can lead to this outcome. For instance, high clutter increases the visuospatial complexity level but it can be mitigated with a well organised structural scene. Another consideration about finding balance in the visuospatial complexity scale is inspired by convex function of disorder (Shiner et al., 1999) and complex adaptive systems (Gershenson and Fernández, 2012), suggesting that a positive effect from the perceived visuospatial complexity is expected to reach an optimum between variety and structure (Fig. 2). For example, highly symmetrical spaces with repetitive features are related to low visuospatial complexity, but they have a negative effect on navigation performance as there is no architectural differentiation or distinctive object to assist cognitive mapping (Baskaya et al., 2004). Consequently, in the process of developing a scale for visuospatial complexity, we consider that humans prefer to experience information at a comfortable rate (too little deprives the senses and too much overloads them (Boeing, 2018)), and so we suggest a moderate visuospatial complexity class as a design aim (Fig. 2). This design aim should be adjusted based on the specific design groups (e.g. children, older adults, people with cognitive decline) in order to provide a suitable motivating environment.
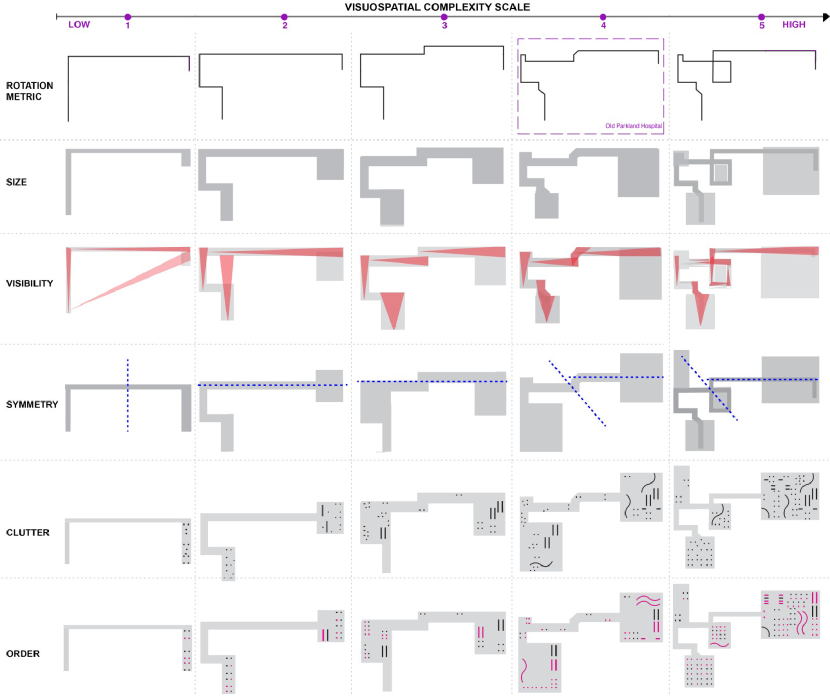
Empirically model complexity Classes As an example of the modelling process we focus on selected attributes for demonstration reasons, and we define in approximation the Classes based on the behavioural analysis of the navigation study (Kondyli and Bhatt, 2018; Kondyli et al., 2018). The Classes are defined based on the empirical results and the proportional relation between each attribute and visuospatial complexity (Table 1). Further empirical work is needed for the verification of the numeric and percentage classification (Fig. 2). Specifically, Rotation metric is defined by the number of turns along the path (or along a segment of the path) as well as by the accumulating degrees of the angle the person performs while navigating. For the definition of Size, we combine the three dimensions of space and calculate the average along the path or the segment. Visibility is defined based on the percentage of the visual range a navigator has while walking from the different segments towards the end of the path. Symmetry is calculated in respect to the layout geometry, as well as by analysing the symmetry in the 3D scene the navigator encounters along the path. Clutter is defined by the percentage of space covered by 3D elements in the total path (or each segment), and Order refers to the related organisation of these elements in space, calculated by the percentage of the area that reflects a known structure (e.g. grid, circle, rectangular, spiral, square). To calculate the visuospatial complexity class in an aggregative level for the overall path, we combine the corresponding values of each attribute and provide an average result with a numerical indication between 1 and 5 (Fig. 2).
4 Parametric Modelling of Visuospatial Complexity
By parametrising selective attributes in respect to the scale of visuospatial complexity, and monitoring the relations between them, we develop a parametric model that runs two main operations: identification of the visuospatial complexity class of a given morphology, and manipulation of the morphology to correspond to a preferred class (e.g. moderate Class 3, Fig. 2). We approach the parametric model from the perspective of the human-navigator, using the navigation path as the first component and the main geometrical input to the model. The parametric tool promotes interactive design decision-making based on the visuospatial complexity model (Table 1) that can be useful for: comparing different versions of a design in terms of the visuospatial complexity Classes, identifying the class and manipulating the morphology in relation to a selected attribute or in aggregative level for all attributes, comparing buildings in relation to their visuospatial complexity Class, manipulating morphologies to eliminate or increase the visuospatial complexity Class.
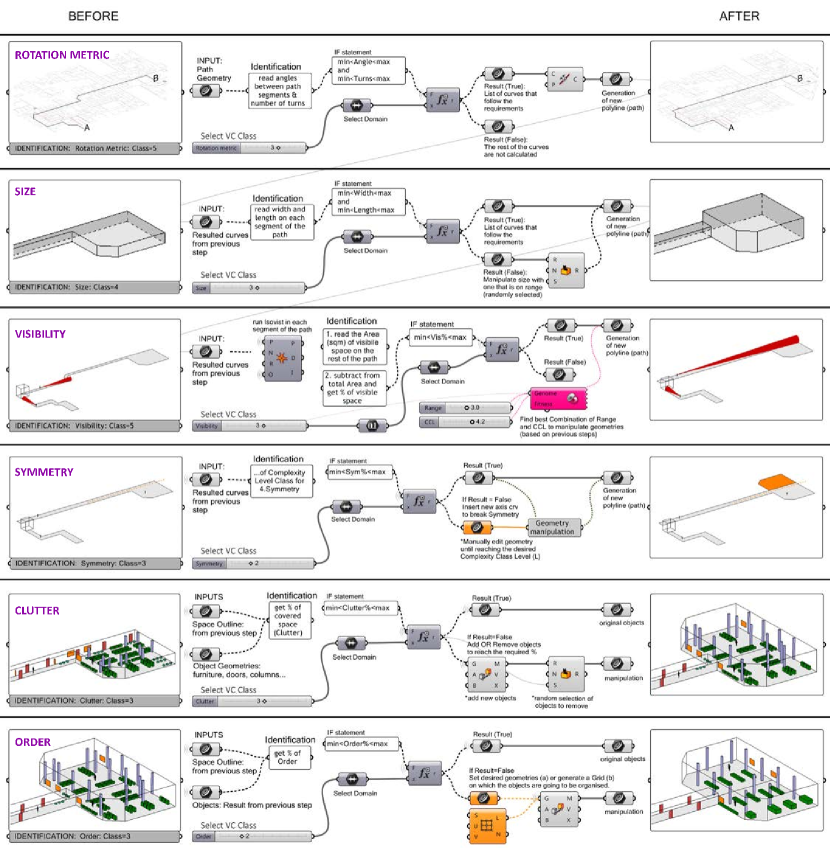
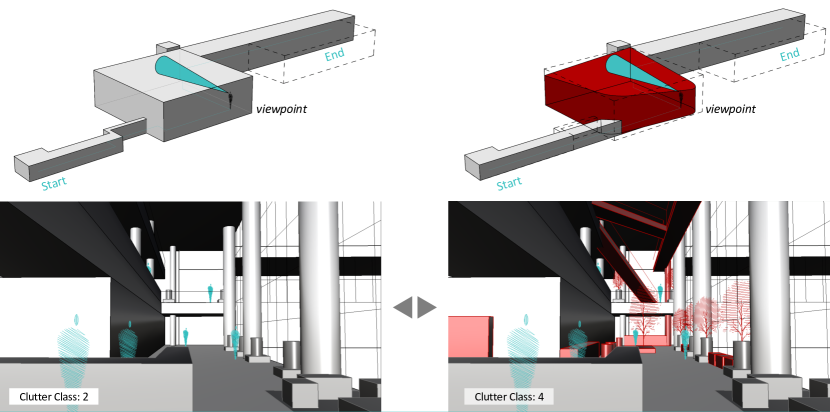
Class Identification and Morphology Manipulation The identification function receives as an input a polyline representing the navigation path, it analyses the characteristics of the path and categorises them into Classes based on the visuospatial complexity model (e.g. purple dashed rectagular in Fig. 3). By manipulating the morphology of space along the navigation path, we can expand or eliminate the visuospatial complexity by “controlling” the parametric “sliders” between the defined Classes of each attribute (Fig. 3). In the Old Parkland Hospital example (Fig. 4), we aim at maintaining a moderate Class 3 of visuospatial complexity along the path. The identification function gave the result of an overall visuospatial complexity Class 4. The manipulation function (based on the selected group of attributes) can be used to introduce changes in the morphology (e.g. geometry, arrangement of elements), to reduce the overall visuospatial complexity. Specifically, Rotation metric simplifies the geometry of the path based on the angles of turns between the segments. The Size function modifies the three dimensions of the segments of the path to fit the requirements of the Class. The Visibility reports the percentage of visible space from each segment towards the end point of the path and suggests alternative combination between visual range and Classes using an evolutionary solver (Galapagos for Grasshopper3D). The Symmetry function introduces new symmetry axes to manipulate the geometry in order to fit the requirements of the respective Class, while the Clutter and Order functions, add or remove objects and organise them in groups.
The manipulation function can be used in the overall or in particular segments of the path to moderate, or eliminate the visuospatial complexity level. However, it can also contribute to indicating areas where visuospatial complexity can be increased to fulfil design requirements while the designer can closely monitor how these changes affect the visuospatial complexity level. For instance, the analysis of the path at the New Parkland Hospital suggests low overall visuospatial complexity (Class 2). We use the manipulation functionality for the segment of the path that involves the entrance lobby and we extent the level of visuospatial complexity from Class 2 to Class 4 without interrupting the average complexity level for the overall path. Thus, we can reassure an acceptable navigability experience for the users while experimenting with objects at the entrance lobby (Fig. 5).
5 Summary
Architects are confronted with anticipating the effect of their design decisions on users’ cognitive experience —termed visuo-locomotive experience— as they move along a navigation path. Towards this end, cognitive assistive technologies for design can be useful during the different steps of the design process if they incorporate empirical knowledge from behavioural studies in real-world built environments (Bhatt and Schultz, 2017; Bhatt et al., 2014; Kondyli et al., 2018; Kondyli and Bhatt, 2018). Parametric design systems provide the flexibility and adaptability needed, however currently their established functions are numerically and geometrically oriented. By introducing the dimension of human behaviour in parametric design systems, such as high-level cognitive design requirements, and parameters of morphological formulation emanating therefrom, we can promote people-centred architecture design from the first steps of the design process (Bhatt and Schultz, 2017; Kondyli et al., 2018).
The ability to analyse and manipulate the morphology of an environment (and resulting navigation paths) based on people-centred aspects, such as the scale of visuospatial and locomotive complexity and its effects on visuo-locomotive experience, is useful for the evaluation of design decisions and prediction of design performance especially for the initial stages of the design process. We have demonstrated how a parametric design system that incorporates behavioural knowledge can facilitate early design decisions especially for large-scale built environments such as hospitals, airports and museums where it is crucial to predict navigation performance of users at varying levels of visuo-locomotive complexity.
Identification of suitable attributes to quantify an optimal level of visuospatial complexity for better cognitive performance (e.g., during navigation) needs to be investigated by empirical work. Towards this direction, our next steps include the use of the parametric functions developed to generate a series of immersive virtual environments that systematically differ in the class of visuospatial complexity the proposed model. In a series of case studies in VR we employ behavioural metrics (e.g. behavioural mapping, eye-tracking, orientation task, etc.) to measure the effect of the defined attributes and their combinations on the navigation performance and better inform our model of visuo-locomotive complexity.
References
- Baskaya et al. [2004] A. Baskaya, C. Wilson, and Y. Z. Özcan. Wayfinding in an unfamiliar environment: Different spatial settings of two polyclinics. Environment and Behavior, 36(6):839–867, 2004.
- Benedikt [1979] M. L. Benedikt. To take hold of space: Isovists and isovist fields. Environment and Planning B: Planning and Design, 6(1):47–65, 1979.
- Bhatt [2018] M. Bhatt. Embodied architecture design : On people-centered design of visuo-locomotive cognitive experiences. Cognitive Processing, 19(Suppl. 1):S5–S5, 2018.
- Bhatt and Freksa [2015] M. Bhatt and C. Freksa. Spatial computing for design—an artificial intelligence perspective. In J. S. Gero, editor, Studying Visual and Spatial Reasoning for Design Creativity, pages 109–127, Dordrecht, 2015. Springer Netherlands. ISBN 978-94-017-9297-4.
- Bhatt and Schultz [2017] M. Bhatt and C. Schultz. People-Centered Visuospatial Cognition: Next-Generation Architectural Design Systems and Their Role in Design Conception, Computing, and Communication, pages 207–232. Springer International Publishing, Cham, 2017. ISBN 978-3-319-56466-1.
- Bhatt et al. [2009] M. Bhatt, F. Dylla, and J. Hois. Spatio-terminological inference for the design of ambient environments. In K. S. Hornsby, C. Claramunt, M. Denis, and G. Ligozat, editors, Spatial Information Theory, 9th International Conference, COSIT 2009, Aber Wrac’h, France, September 21-25, 2009, Proceedings, volume 5756 of Lecture Notes in Computer Science, pages 371–391. Springer, 2009. doi: 10.1007/978-3-642-03832-7\_23. URL https://doi.org/10.1007/978-3-642-03832-7_23.
- Bhatt et al. [2012] M. Bhatt, C. P. L. Schultz, and M. Huang. The shape of empty space: Human-centred cognitive foundations in computing for spatial design. In M. Erwig, G. Stapleton, and G. Costagliola, editors, 2012 IEEE Symposium on Visual Languages and Human-Centric Computing, VL/HCC 2012, Innsbruck, Austria, September 30 - October 4, 2012, pages 33–40. IEEE, 2012. doi: 10.1109/VLHCC.2012.6344477. URL https://doi.org/10.1109/VLHCC.2012.6344477.
- Bhatt et al. [2014] M. Bhatt, C. P. L. Schultz, and M. Thosar. Computing narratives of cognitive user experience for building design analysis: KR for industry scale computer-aided architecture design. In Principles of Knowledge Representation and Reasoning: Proc. of the 14th International Conference, KR 2014, Vienna, Austria. AAAI Press, 2014.
- Bhatt et al. [2016a] M. Bhatt, J. Suchan, V. Kondyli, and C. P. L. Schultz. Embodied visuo-locomotive experience analysis: immersive reality based summarisation of experiments in environment-behaviour studies. In E. Jain and S. Jörg, editors, Proceedings of the ACM Symposium on Applied Perception, SAP 2016, Anaheim, California, USA, July 22-23, 2016, page 133. ACM, 2016a. doi: 10.1145/2931002.2948720. URL https://doi.org/10.1145/2931002.2948720.
- Bhatt et al. [2016b] M. Bhatt, J. Suchan, C. P. L. Schultz, V. Kondyli, and S. Goyal. Artificial intelligence for predictive and evidence based architecture design. In D. Schuurmans and M. P. Wellman, editors, Proceedings of the Thirtieth AAAI Conference on Artificial Intelligence, February 12-17, 2016, Phoenix, Arizona, USA, pages 4349–4350. AAAI Press, 2016b. URL http://www.aaai.org/ocs/index.php/AAAI/AAAI16/paper/view/12431.
- Boeing [2018] G. Boeing. Measuring the complexity of urban form & design. Urban Design Intern, 2018.
- Cassarino and Setti [2016] M. Cassarino and A. Setti. Complexity as key to designing cognitive-friendly environments for older people. Frontiers in Psychology, 7, 2016.
- Cavalcante et al. [2014] A. Cavalcante, A. Mansouri, L. Kacha, A. K. Barros, and e. al. Measuring streetscape complexity based on the statistics of local contrast and spatial frequency. PLOS ONE, 9(2):1–13, 02 2014.
- Devlin [2014] A. Devlin. Wayfinding in healthcare facilities: Contributions from environmental psychology. Behavioral sciences (Basel, Switzerland), 4:423–436, 12 2014.
- Feldman [2004] J. Feldman. How surprising is a simple pattern? quantifying “eureka!”. Cognition, 93, 2004.
- Fortenbaugh et al. [2008] F. C. Fortenbaugh, J. C. Hicks, and K. A. Turano. The effect of peripheral visual field loss on representations of space: evidence for distortion and adaptation. Investigative Ophthalmology & Visual Science, 49(6), 2008.
- Gershenson and Fernández [2012] C. Gershenson and N. Fernández. Complexity and information. Complexity, 18(2):29–44, 2012.
- Harper et al. [2009] S. Harper, E. Michailidou, and R. Stevens. Toward a definition of visual complexity as an implicit measure of cognitive load. ACM Transactions on Applied Perception, 6(2):1–18, 2009.
- Henderson et al. [2009] J. Henderson, M. Chanceaux, and T. Smith. The influence of clutter on real-world scene search: Evidence from search efficiency and eye movements. Journal of Vision, 9(1)(32):1–8, 2009.
- Kondyli and Bhatt [2018] V. Kondyli and M. Bhatt. Rotational locomotion in large-scale environments: A survey and implications for evidence-based design practice. Built Environment, 44(2):241–258, 2018.
- Kondyli et al. [2018] V. Kondyli, M. Bhatt, and T. Hartmann. Precedent based design foundations for parametric design: The case of navigation and wayfinding. Advances in Computational Design, 3(4):339–366, 10 2018.
- Kondyli et al. [2020] V. Kondyli, M. Bhatt, and J. Suchan. Multimodal interaction in autonomous driving. towards human visual perception driven standardisation and benchmarking. In STAIRS @ ECAI 2020: 9th European Starting AI Researchers Symposium (STAIRS)., at ECAI 2020, the 24th European Conference on Artificial Intelligence (ECAI), 2020.
- Madan et al. [2018] C. Madan, J. Bayer, M. Gamer, B. Lonsdorf, and T. Sommer. Visual complexity and affect: Ratings reflect more than meets the eye. Frontiers in Psychology, 8, 2018.
- Mital et al. [2011] P. K. Mital, T. J. Smith, R. L. Hill, and J. M. Henderson. Clustering of gaze during dynamic scene viewing is predicted by motion. Cognitive Computation, 3(1):5–24, 2011.
- Moacdieh and Sarter [2015] N. Moacdieh and N. Sarter. Display clutter: A review of definitions and measurement techniques. Human Factors, 57(1):61–100, 2015.
- O’Neill [1991] M. O’Neill. Evaluation of a conceptual model of architectural legibility. Envir & Behav, 1991.
- Park et al. [2014] S. Park, T. Konkle, and A. Oliva. Parametric coding of the size and clutter of natural scenes in the human brain. Cerebral Cortex, 2014.
- Potter [1976] M. Potter. Short-term conceptual memory for pictures. Journal of experimental psychology. Human learning and memory, 2:509–22, 1976.
- Rosenholtz et al. [2007] R. Rosenholtz, Y. Li, and L. Nakano. Measuring visual clutter. Journal of Vision, 7, 2007.
- Salingaros [2014] N. Salingaros. Complexity in architecture and design. Oz Journal, 36:18–25, 2014.
- Shiner et al. [1999] J. Shiner, M. Davison, and P. Landsberg. Simple measure for complexity. Physical Rev E., 1999.
- Snodgrass and Vanderwart [1980] J. Snodgrass and M. Vanderwart. A standardized set of 260 pictures: Norms for name agreement, image agreement, familiarity, and visual complexity. Jour of Experimental Psychology, 1980.
- Van der Helm [2000] P. Van der Helm. Simplicity versus likelihood in visual perception: From surprisals to precisals. Psychological Bulletin, 126:770–800, 2000.
- Weisman [1981] G. Weisman. Evaluating architectural legibility: wayfinding in the built environment. 01 1981.