The outburst of a 60 min AM CVn reveals peculiar color evolution: implications for outbursts in long period double white dwarfs
Abstract
We report on multi-wavelength observations during quiescence and of the first detected outburst of the min orbital period AM CVn SDSS J113732+405458. Using X-ray and UV observations we determined an upper limit duration of the event of about one year. The amplitude of the outburst was remarkably small, of around one magnitude in and 0.5 magnitudes in . We have also investigated the color variations of SDSS J113732+405458 and other long period AM CVns in outbursts and identified a track on the color-magnitude diagram that is not compatible with the predictions of the disk instability model, suggesting that some outbursts in long period AM CVns are caused by enhanced mass-transfer. To our knowledge, these are the first studies of the color evolution in AM CVns. During quiescence we measured an X-ray luminosity for SDSS J113732+405458 of erg/s in the 0.5-10 keV band. This indicates a very low accretion rate, in agreement with the disk instability model for long period systems. However, such a model predicts stable disks at somewhat long periods. The discovery of this system outburst, along with similarities to the long period system SDSS J080710+485259 with a comparably long, weak outburst, indicates that these enhanced mass-transfer events may be more common in long period AM CVns. A larger sample would be needed to determine empirically at what period, if any, the disk instability stops functioning entirely. Finally, we identified an infrared excess in the quiescence spectrum attributable to the donor. This makes SDSS J113732+405458 the second AM CVn to have a directly detected donor.
keywords:
Stars: Individual: SDSS J113732+405458 – Accretion discs – Stars: White Dwarfs – Cataclysmic Variables – Binaries: close – X-rays: binaries1 Introduction
Binaries with orbital periods () shorter than 70 min (e.g. Green et al., 2020, and references therein) in which the primary star is a white dwarf (WD) accreting from a He-rich secondary star are known as AM CVns. After reaching the period minimum (e.g. Tutukov et al., 1985), which depends on the formation channel (see Solheim, 2010, for a review), these ultracompact white dwarf binaries evolve towards longer orbital periods, decreasing their mass-transfer rate () as their orbit widens (e.g. Deloye & Bildsten, 2003; Deloye et al., 2007). Under the disk instability model (DIM, e.g. Smak, 1983; Lasota et al., 2008; Cannizzo & Nelemans, 2015; Cannizzo & Ramsay, 2019) commonly used to explain the outburst activity of AM CVns, the value of determines the stability of the accretion disk and then the presence of accretion outbursts. In the DIM, a disk is cold and stable if the is everywhere lower than a critical value of the mass accretion rate. The latter depends mainly on parameters such as the mass and size of the accretor, as well as the metallicity of the disk (Lasota et al., 2008). From these conditions it results that long period AM CVns should have a cold and stable disk (because they have very low values) and therefore show no outbursts. The period limit between outbursting sources and those with cold and stable disks is nonetheless quite uncertain (e.g. Kotko et al., 2012).
Using data from the Sloan Digital Sky Survey (SDSS), Carter et al. (2014) identified He emission lines and a lack of H, the signatures of AM CVn stars, in the spectrum of SDSS J113732+405458 (hereafter, SDSS 1137). The authors also determined a period of min using the radial velocity variations of the emission lines and reported a SDSS- magnitude of 19 mags during quiescence. Thanks to the recent development of multi-band sky surveys such as the Zwicky Transient Facility (ZTF, Masci et al., 2019), the long term behavior of SDSS 1137 has been monitored. Located at RA=11:37:32.32, Dec=+40:54:58.3, the first detected outburst of SDSS 1137 was recorded by ZTF in 2018. In the next sections we present the analysis of the event at different bands and discuss the implications of our results in the context of the DIM.
| Instrument | Band | Exposure | Magnitude | Flux | Luminosity | |
|---|---|---|---|---|---|---|
| (Å) | (s) | (Vega) | erg/s/cm2 | erg/s | ||
| Swift/UVOT | 1 928 | 17 695 | ||||
| ” | 3 465 | 12 420 | ||||
| ” | 4 392 | 8 290 | ||||
| ” | 5 468 | 19 150 | ||||
| OM | 3 472 | 3 635 | ||||
| Swift/XRT | 0.3-10 keV | - | 25 000 | - | ||
| EPIC-pn | 0.5-10 keV | - | 11 000 | - |
2 OBSERVATIONS AND DATA ANALYSIS
In this work we have analyzed data ranging from the X-rays to the near Infrared (NIR) to study the behavior of SDSS 1137 during outburst and quiescence.
2.1 X-ray and UV data
A data set of X-ray and observations was obtained under XMM-Newton program ID (PI Maccarone) on 2017-12-21. An exposure time of 11 ks was obtained in X-rays with EPIC-pn and 3.6 ks were gathered with OM- in imaging mode. SDSS 1137 was also detected multiple times within the field of view of the Neil Gehrels Swift Observatory (Swift) with the XRT and UVOT detectors. The first observation was obtained on 2005-02-17 and the last one on 2005-03-21. A total of 25 ks were obtained with XRT and 57.5 ks with UVOT in the filters , and (see Table 1 for more details).
For the X-ray spectral analysis we used the standard products for EPIC-pn from the XMM-Newton pipeline processing system111https://www.cosmos.esa.int/web/xmm-newton/sas-threads. The OM- magnitude of SDSS 1137 was calibrated by converting the count rate obtained from the standard products to the Vega and AB systems222https://www.cosmos.esa.int/web/xmm-newton/sas-watchout-uvflux. The Swift XRT data were first reprocessed using xrtpipeline and analyzed following the corresponding standard threads333https://www.swift.ac.uk/analysis/xrt/. Fitting of the spectra of the XMM-Newton and XRT data was performed using XSPEC v12.11.0 (Arnaud, 1996). We combined the longest XRT observations in which the object was detected and performed a fit. For the EPIC-pn and the XRT data the best fit was an absorbed power-law model (TBabs*pegpwrlw). We set the value of the neutral H column (NH) to the Galactic value ( cm-2) and binned the data to 5 and 20 counts per bin for XRT and EPIC-pn, respectively. Given the small number of counts in XRT we used C-statistics for the fit, while for EPIC-pn we used Chi-squared.
For the UVOT photometric analysis we considered a circular region of around the source and estimated the sky background using a region near the source with a radius of . We then followed the corresponding UVOT threads444https://www.swift.ac.uk/analysis/uvot/. We created light curves with the UVOT data, but no outbursts were identified in the period covered by these observations.
2.2 Optical data
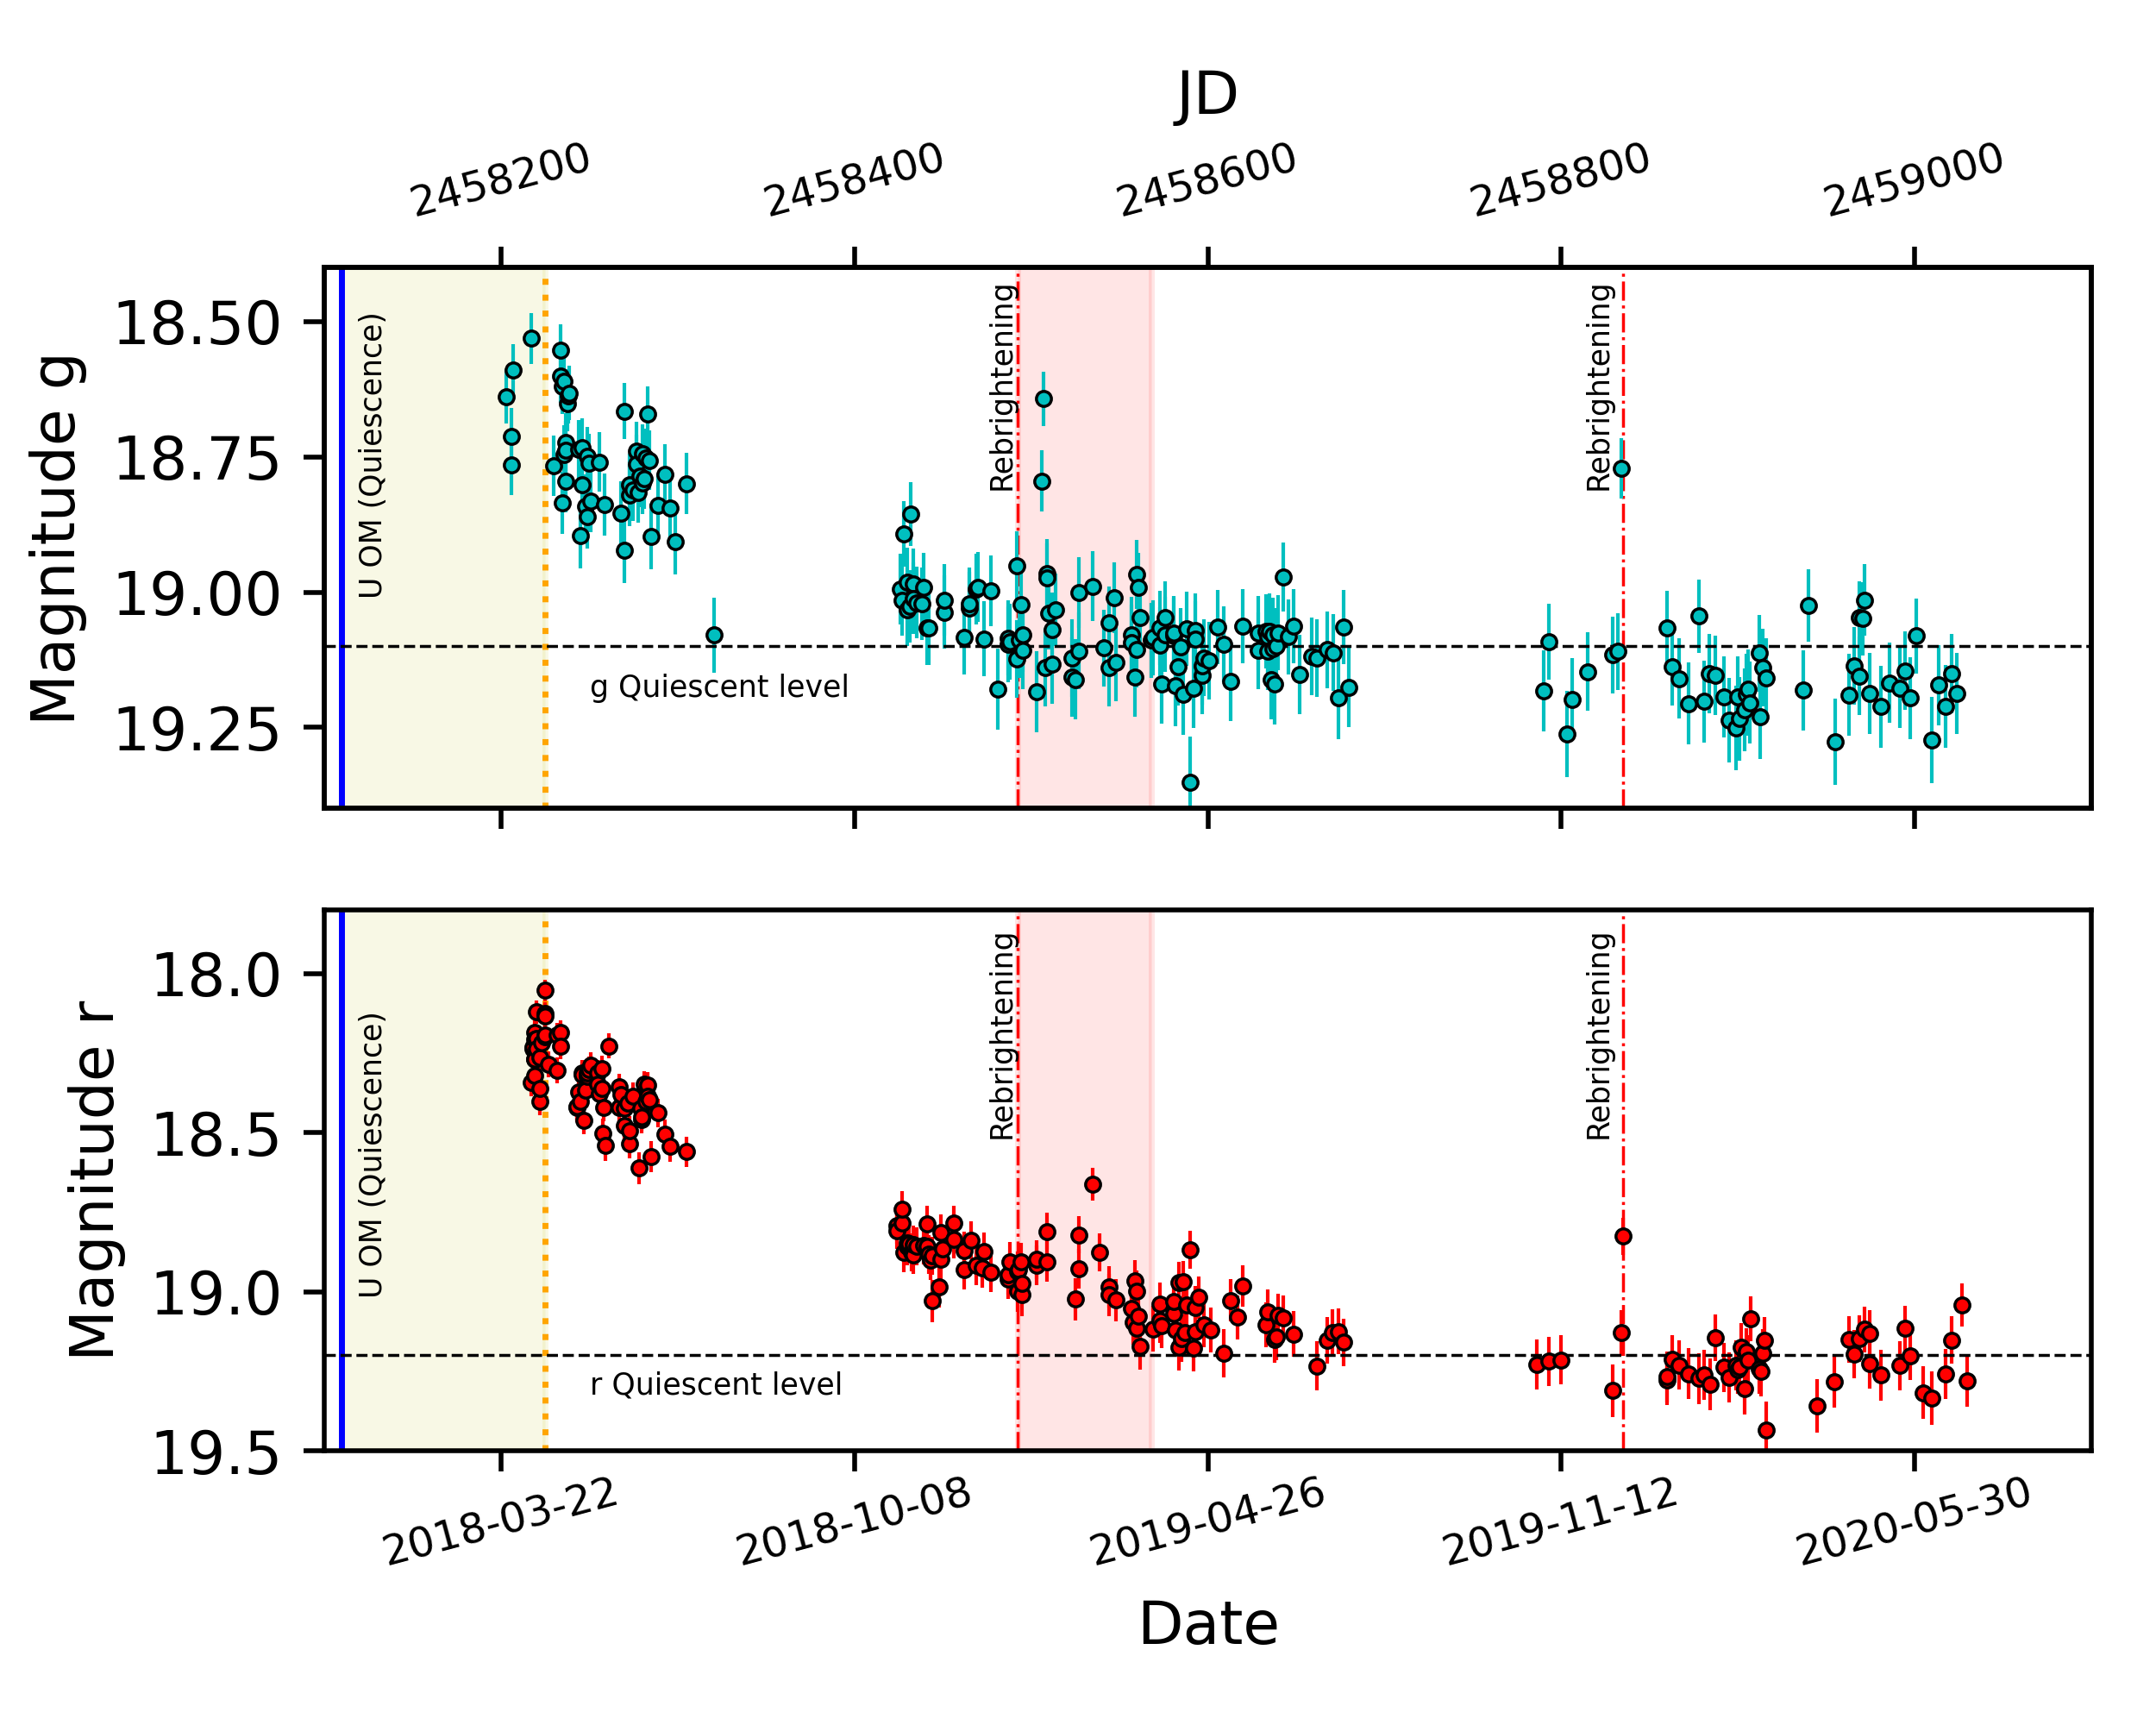
Public ZTF data in the and bands were also used in our analysis. The first ZTF measurement was obtained on 2018-03-25 and the last one on 2020-06-29 (Fig. 1). There were two gaps in the data coverage due to the source’s occultation. We only considered ZTF measurements with good quality flags and excluded points with airmass since the differential chromatic refraction that produces color biases dominates above that value (Masci et al., 2019).
Data from the Catalina Sky Survey (Drake et al., 2009) show no outbursts between 2005-12-08 and 2013-06-07 and the binary was not found in the DASCH database (Grindlay et al., 2009). Data from the ASAS (Kochanek et al., 2017) database show only 3 solid measurements spread in the period 2012-01-11 to 2020-08-01, but several observations performed within minutes from these points just provided upper limits and do not support the measurement values, suggesting that the 3 measurements are likely due to instrumental fluctuations. Available Pan-STARRS data (Chambers et al., 2016) did not reveal any outbursts. We also used data from the AllWISE archive obtained in 2010 during the cryogenic phase (Wright et al., 2010) in the and bands where the object was detected. Only good measurements were taken into account.
To compare the outburst behaviour of long period AM CVns, we have also collected photometric data for the systems SDSS J080710+485259 (hereafter SDSS 0807, min) and SDSS J141118+481257 (SDSS 1411, min). For the superoutburst of SDSS 0807 (Rivera Sandoval et al., 2020) we used ZTF data in the and bands, while for the superoutburst of SDSS 1411 we collected AAVSO data in and due to the superior coverage compared to ZTF for that source (Rivera Sandoval & Maccarone, 2019). We also determined the color evolution of these sources by pairing observations obtained in the above mentioned filters. For SDSS 1137 and SDSS 0807 we combined data points obtained within 1 day. For SDSS 1411 we have paired data points taken within 1.2 hrs from each other in the and bands, and later averaged the pairs in bins of 0.5 days given the much shorter duration of the superoutburst and to reduce inhomogeneities in the data acquisition. We have only focused on the second part of the event which was recorded between 2018-05-31 and 2018-06-11. The very first part of the superoutburst of SDSS 1411 has no good coverage in both bands and so it has been excluded.
3 RESULTS
3.1 The multi-wavelength light curve of SDSS 1137
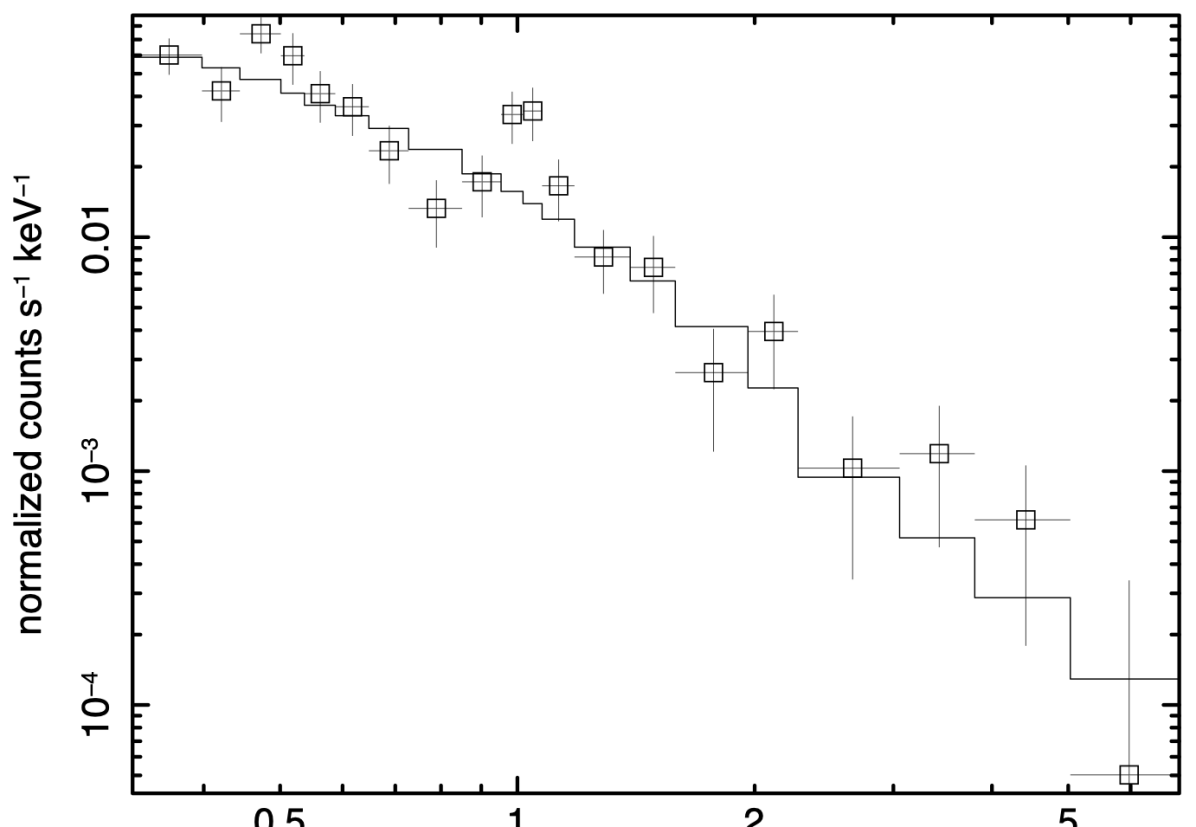
The X-ray spectral fit of the EPIC-pn data showed that the spectrum of the binary could be described by an absorbed power-law with a photon index and had a count rate in the keV band of counts s-1 (Fig. 2). This corresponds to a flux erg s-1 cm-2 equivalent to a luminosity erg s-1 at the distance of pc (Gaia Collaboration, 2020). These values are consistent with the ones obtained with XRT in the range keV: and erg s-1 cm-2. The larger uncertainty in the Swift values is due to the smaller number of counts detected, since XRT is much less sensitive than EPIC-pn. All errors are provided at confidence level.
From the OM- data we obtained a magnitude of mag in the Vega system which is consistent with that from UVOT- (), suggesting that on 2017-12-21 SDSS 1137 was still in quiescence. The consistency in the X-ray values of both telescopes also supports a scenario in which both measurements were obtained in quiescence. However, the long term lightcurve (Fig. 1) with the ZTF data shows that on 2018-03-25 the binary was above its Pan-STARRS and SDSS- quiescent level of 19.2 mags (Carter et al., 2014), revealing an outburst555Note that in this particular case we have not named the event a superoutburst despite its long duration. Reasons will be explained in Sec. 4. which reached its peak around 2018-04-16666After the submission of this manuscript, we became aware of the existence of additional data that may suggest that the outburst reached its maximum much earlier than here described. The findings reported in this document are based solely on the available data from the databases mentioned in Sec. 2.. ASAS data from 2017-12-21 to 2018-03-29 indicate that SDSS 1137 was never detected above 18 mags777The ASAS data point of 18.09 mags on 2017-12-26 is considered an upper limit for the reasons mentioned in Sec.2., thus imposing an upper limit of 1 mag on the amplitude of the outburst. The duration of the event is difficult to determine given the peculiar behavior in the and bands: SDSS 1137 seems to have reached quiescence much earlier in than in (this behavior will be discussed in the next section). Consequently, we placed the end of the outburst when there was a period of increasing activity in the band (around 2019-01-08), which was also observed in the filter, suggesting that likely there were additional smaller rebrightenings in that period. Since they occurred during the decay of the outburst, it is possible that they might be echo outbursts. Afterwards there seems to be another period of increasing brightness starting on 2019-12-17 more visible in the band, where consecutive measurements follow a trend. The fact that the increase in activity is observed in both filters, together with the relative low air-mass values, good photometric flags, as well as small amplitude show that that rebrightening is real and likely due to a smaller outburst888It is unclear whether that rebrightening could be an echo outburst or a normal outburst..
3.2 Spectral energy distribution
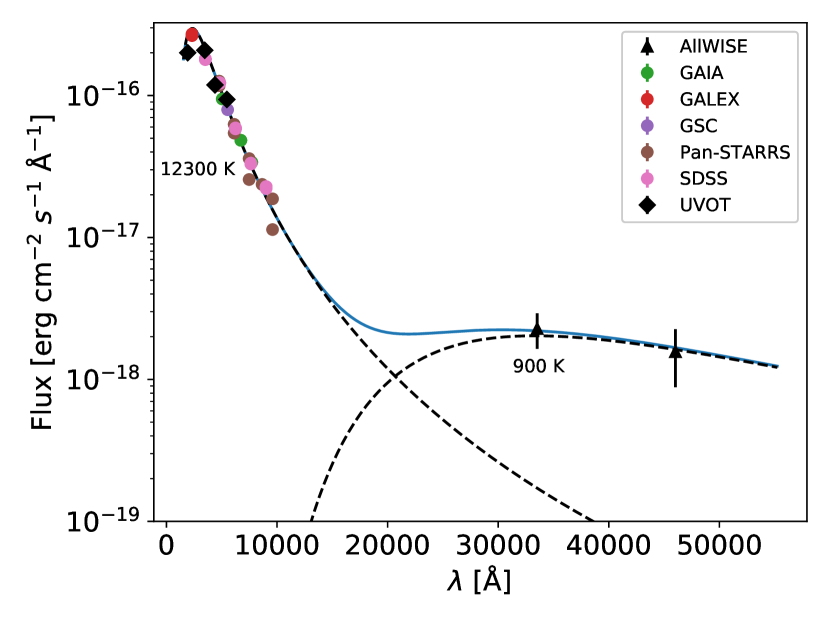
We plotted the spectral energy distribution (SED) of the binary and performed a black-body fit of the data points in order to determine its temperature and normalization. We combined our UVOT measurements, the available information from the SDSS, Gaia (Gaia Collaboration et al., 2018), Pan-STARRS, as well as AllWISE data of SDSS 1137, all obtained during quiescence (i.e. before December 2017). Data for the fit was deredened using (Schlegel et al., 1998; Green et al., 2019) and .
From our SED analysis using observations from the NUV to the NIR (Fig. 3) it is clear that a single black-body can not reproduce all observations. The AllWISE data show that there is a significant NIR excess. Based on these results we have then added another black-body component. We did not fix any parameter and obtained temperatures of K for the hottest component and K for the coldest one999The errors on the temperature of the second black-body are large, as are the ones on its normalization, because we only have two data points from the AllWISE survey for the fit..
4 DISCUSSION
The detected outburst activity in SDSS 1137 is an unprecedented event considering its large orbital period. In fact, with P min, it is the longest period outbursting AM CVn detected so far. Since the distance to the binary is known ( pc), we have derived an absolute UVOT- magnitude mag during quiescence. In the same state and at its orbital period the optical emission is mostly coming from the accreting WD because the disk is cold. This result is consistent with what is expected for a massive WD accretor with (Bildsten et al., 2006). A massive accretor is also supported by the small radius obtained from the normalization of the hottest black-body in our SED analysis. The expected ( K) is also very well consistent with the one we have obtained from our SED fit (Fig. 3). Assuming a massive WD (), Bildsten et al. (2006) predict that the average accretion rate for a min system is around . For SDSS 1137, if we consider the obtained X-ray luminosity and even (unrealistically) all the UV emission as coming from the accretion process101010Considering our SED fitting the obtained UV luminosity is likely coming mostly from the accreting WD, but for the mass accretion calculation using we have considered the observed UV luminosity in order to obtain a better estimate than just using the X-rays., we determine a mass-accretion rate during quiescence of , for and a radius of (similar to Sirius B). This rate is in fact smaller than the one of the critical mass-accretion value for a similar mass WD and the viscosity parameter (Lasota et al., 2008), which is , in agreement with expectations for the DIM that the disk should be stable. Furthermore, our determined quiescent value is an order of magnitude smaller than the one estimated by Ramsay et al. (2018) which is (determined during quiescence by fitting a model consisting of a WD plus a steady-state accretion disk model to the SED of SDSS 1137). The large difference may be due to the parameters considered. Ramsay et al. (2018) assumed an accretor with and an inclination value of , but, more importantly, these authors varied the size of the accretion disk to reach a good fit. They determined the inner and outer radii to be and , respectively. Therefore, the discrepancy in could also be due to the real size of the disk. Unfortunately, during outburst we cannot determine the value of the mass accretion rate since we do not have X-ray nor UV coverage, and using the optical values is not appropriate.
It is interesting to note that the (one order of magnitude) smaller observed X-ray and UV luminosities of SDSS 1137 during quiescence (see Table 1), when compared to other long period systems such as GP Com (Ramsay et al., 2005) and SDSS 1411 (Rivera Sandoval & Maccarone, 2019), also support a very low accretion rate, as expected for its evolutionary stage. From our observations of SDSS 1137 we also see that the binary mostly emits in blue bands as occurs in other disk accreting AM CVns. The X-ray emission is an order of magnitude smaller than the UV one, and the X-ray spectrum is also soft (consistent with the one of SDSS 1411 within errors). This suggests that the X-ray component is less important in AM CVns with disks than the UV component.
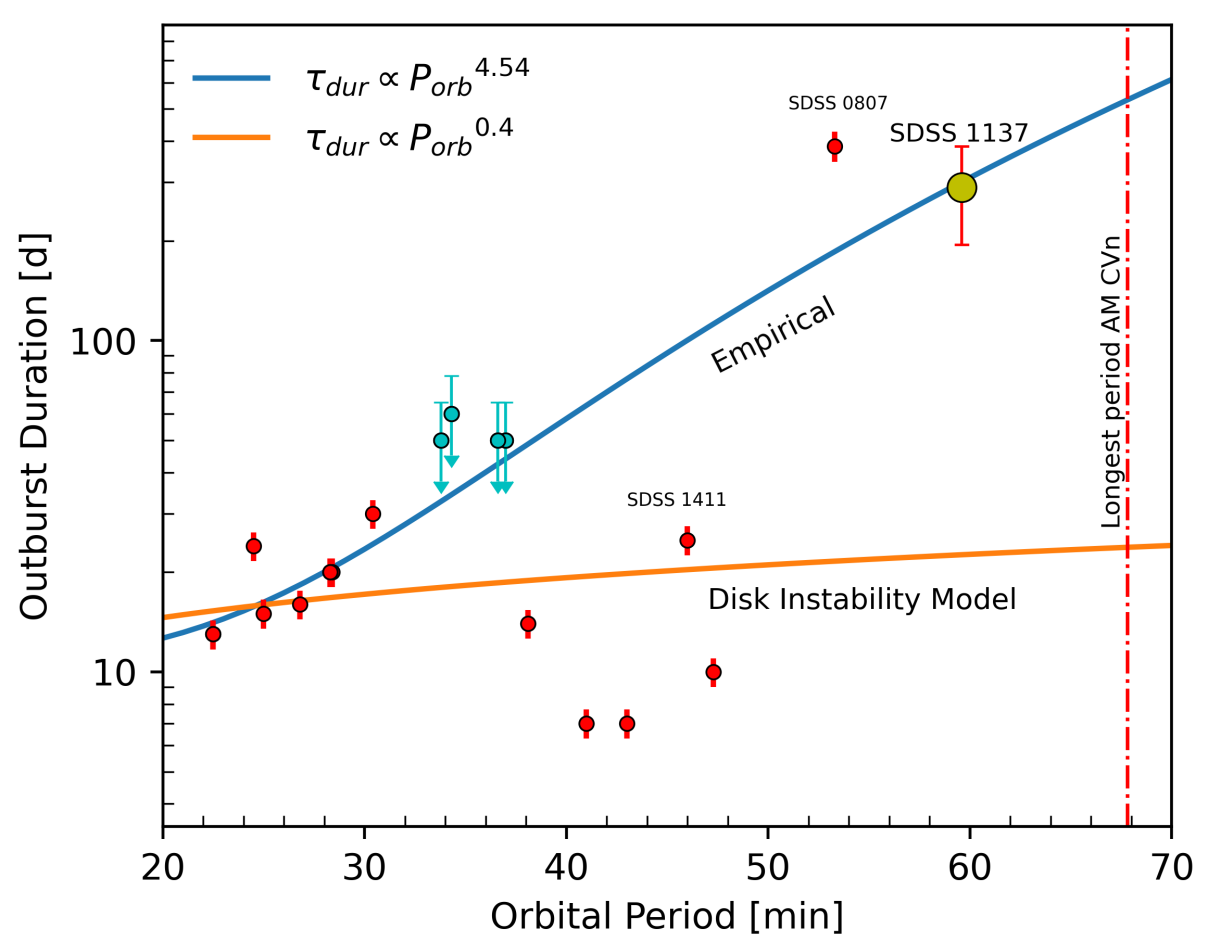
The main uncertainty in the lightcurve of Fig. 1 is the duration of the outburst. This is due to the poor photometric coverage at early epochs (between 2017-12-21 and 2018-03-25), as well as the instrumental fluctuations and relatively large photometric uncertainties of the ZTF data, especially in the band. However, an upper limit can be established considering the observation date of the XMM-Newton data (2017-12-21) and the beginning of the first rebrightening, which then imply an outburst duration of days. For comparison purposes we have plotted that value in the outburst duration vs orbital period relation for AM CVns (Fig. 4). This duration is comparable to that of the recently reported value for SDSS 0807 (Rivera Sandoval et al., 2020), for which the first detected superoutburst lasted 390 days. It is clear that these 2 systems do not follow expectations from the DIM. They exceed by several times their expected duration, suggesting that there are additional mechanisms at work causing the outbursts of (long period) AM CVn binaries.
4.1 Color evolution during outbursts of AM CVns: evidence of enhanced mass-transfer
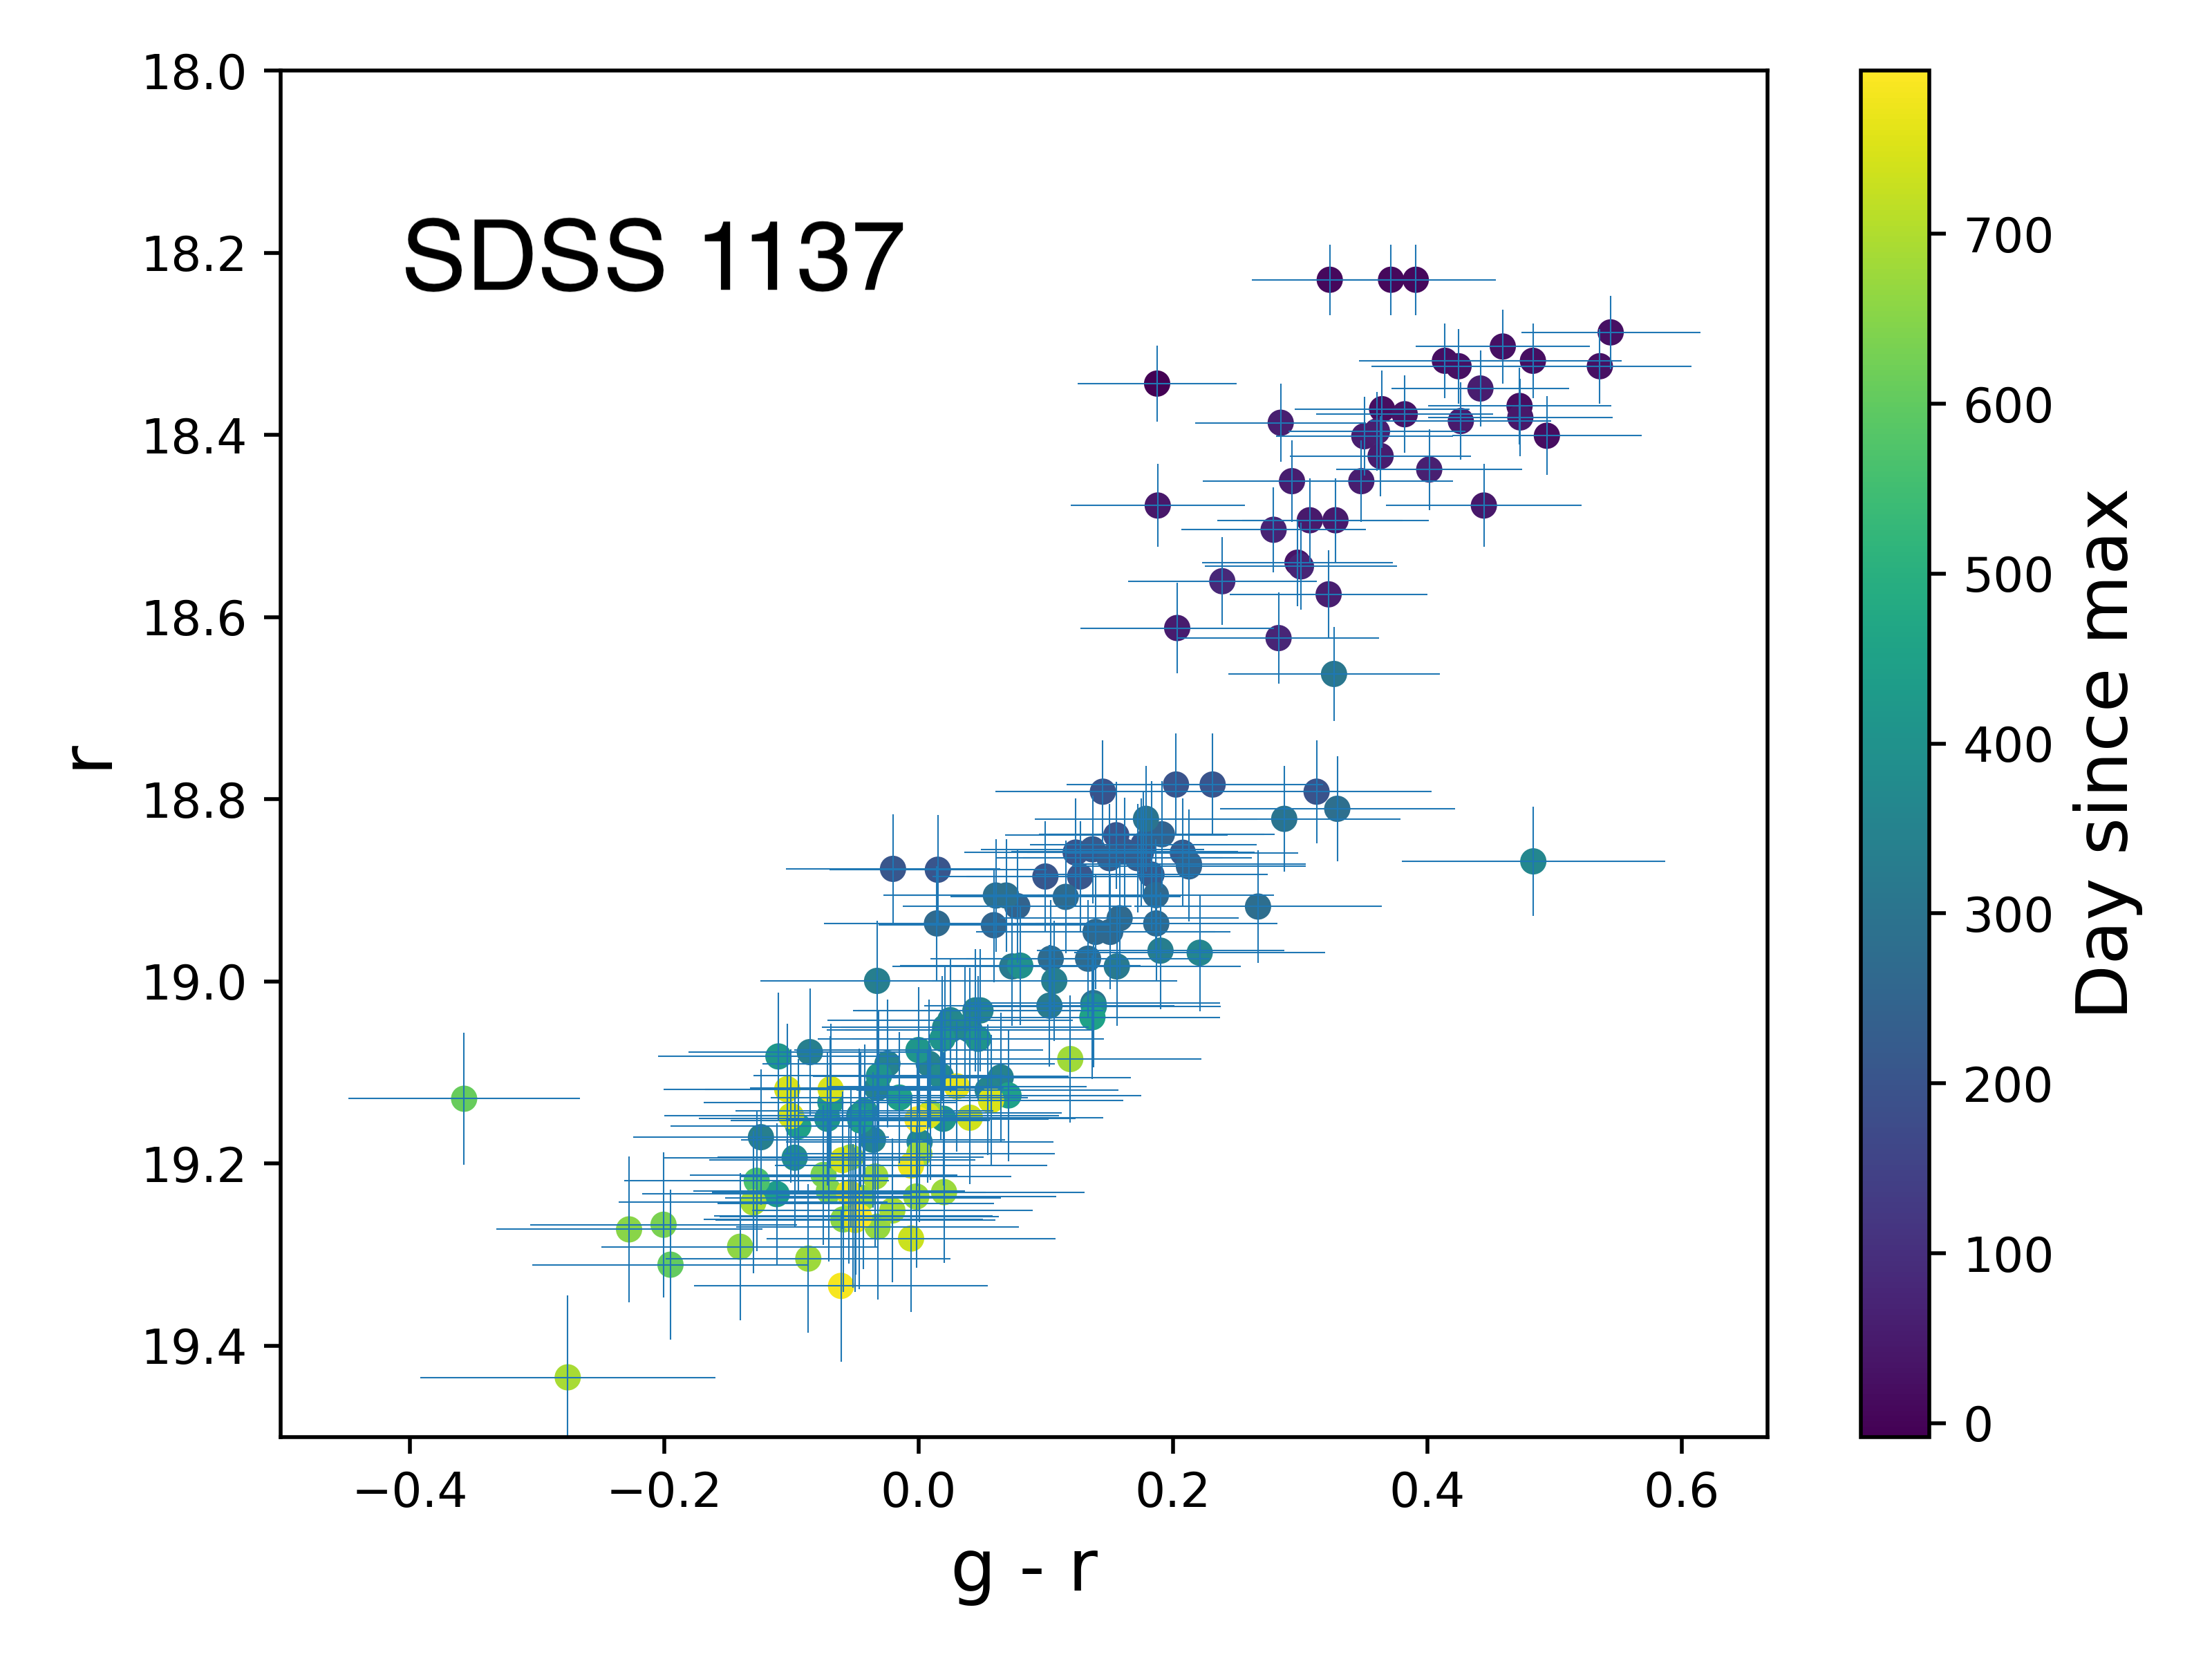
In order to investigate the mechanism(s) that drive outbursts in long period AM CVns, we performed an analysis of the color evolution during outburst of the 3 AM CVns SDSS 1137, SDSS 0807 and SDSS 1411, which are long period outbursting systems for which we have coverage in more than one band. In Fig. 5 and 6 we show the color magnitude diagram results for each binary at different stages during the outburst. One can see that SDSS 1137 and SDSS 0807 follow a completely different pattern in their evolution compared to the one of SDSS 1411. The latter seems to be consistent with the path followed by cataclysmic variables of the type dwarf novae (DNe, Bailey, 1980; Hameury et al., 2020) and it can be well explained under the DIM.
In the case of SDSS 1137 the color evolution track starts with a red color and large brightness. This is due to the fact that there are no multiple close pairs ( day) of data in the bands ZTF- and ZTF- before maximum (see Fig. 1). The binary then becomes bluer as it decays from the outburst, reaching its bluest when it is back in quiescence. This is due to the dominant emission of the accreting WD. One should note that despite the large errors in color, it is clear that even during the peak, the binary never reached the temperatures (visible through its colors) necessary to ionize He, the dominant element in the disk. Though the disk became hotter and the binary brighter than in quiescence, the disk never dominated the emission generated by the other components in the system (the accreting WD and likely the hot spot). This is an extremely important result as it then suggests that the observed outburst was unlikely related to instabilities in the accretion disk. Instead, it is likely that other mechanisms such as enhanced mass-transfer from the companion are responsible for such behavior. Under this scenario the additional mass travels through the accretion disk heating it up, but not triggering a major instability. That would explain the long rise time (), as the mass travels all the way from the outer edge to the inner parts, while the disk remains in the low , cold state. The mechanisms causing the mass-transfer enhancements are unknown, but they could be similar to those hypothesized for some anomalous cataclysmic variables of the type Z Cam (Hameury & Lasota, 2014), for example the donor’s magnetic activity. However, since in the case of long AM CVns the donor is likely a WD, the magnetic fields would need to be large (e.g. Moussa, 2020). This is probably unrealistic considering the expected masses for AM CVn donors, but further modeling and observations are needed to investigate that. Mass-transfer changes could also be due to spots on the donor (Landi Degl’Innocenti, 1976; Hameury & Lasota, 2014; Kilic et al., 2015), in which case magnetic fields would be involved as well. Additionally, it has been shown that mechanisms such as the irradiation of the companion in AM CVns (Warner, 1995; Hameury et al., 1997; Deloye et al., 2007; Kotko et al., 2012; Warner, 2015) and on the WD donors in ultra-compact X-ray binaries (Lü et al., 2017) plays an important role, severely influencing the evolution of these systems by triggering high mass-transfer rates, extending the donor’s adiabatic expansion phase (Deloye et al., 2007) to longer periods and likely affecting their period distribution across their evolution. Also, irradiation has been shown to be an important ingredient in the modeling of outbursts (e.g. Kotko et al., 2012). Additional mechanisms that may lead to fluctuations in the donor’s mass-transfer (e.g. pulsations) remain to be investigated.
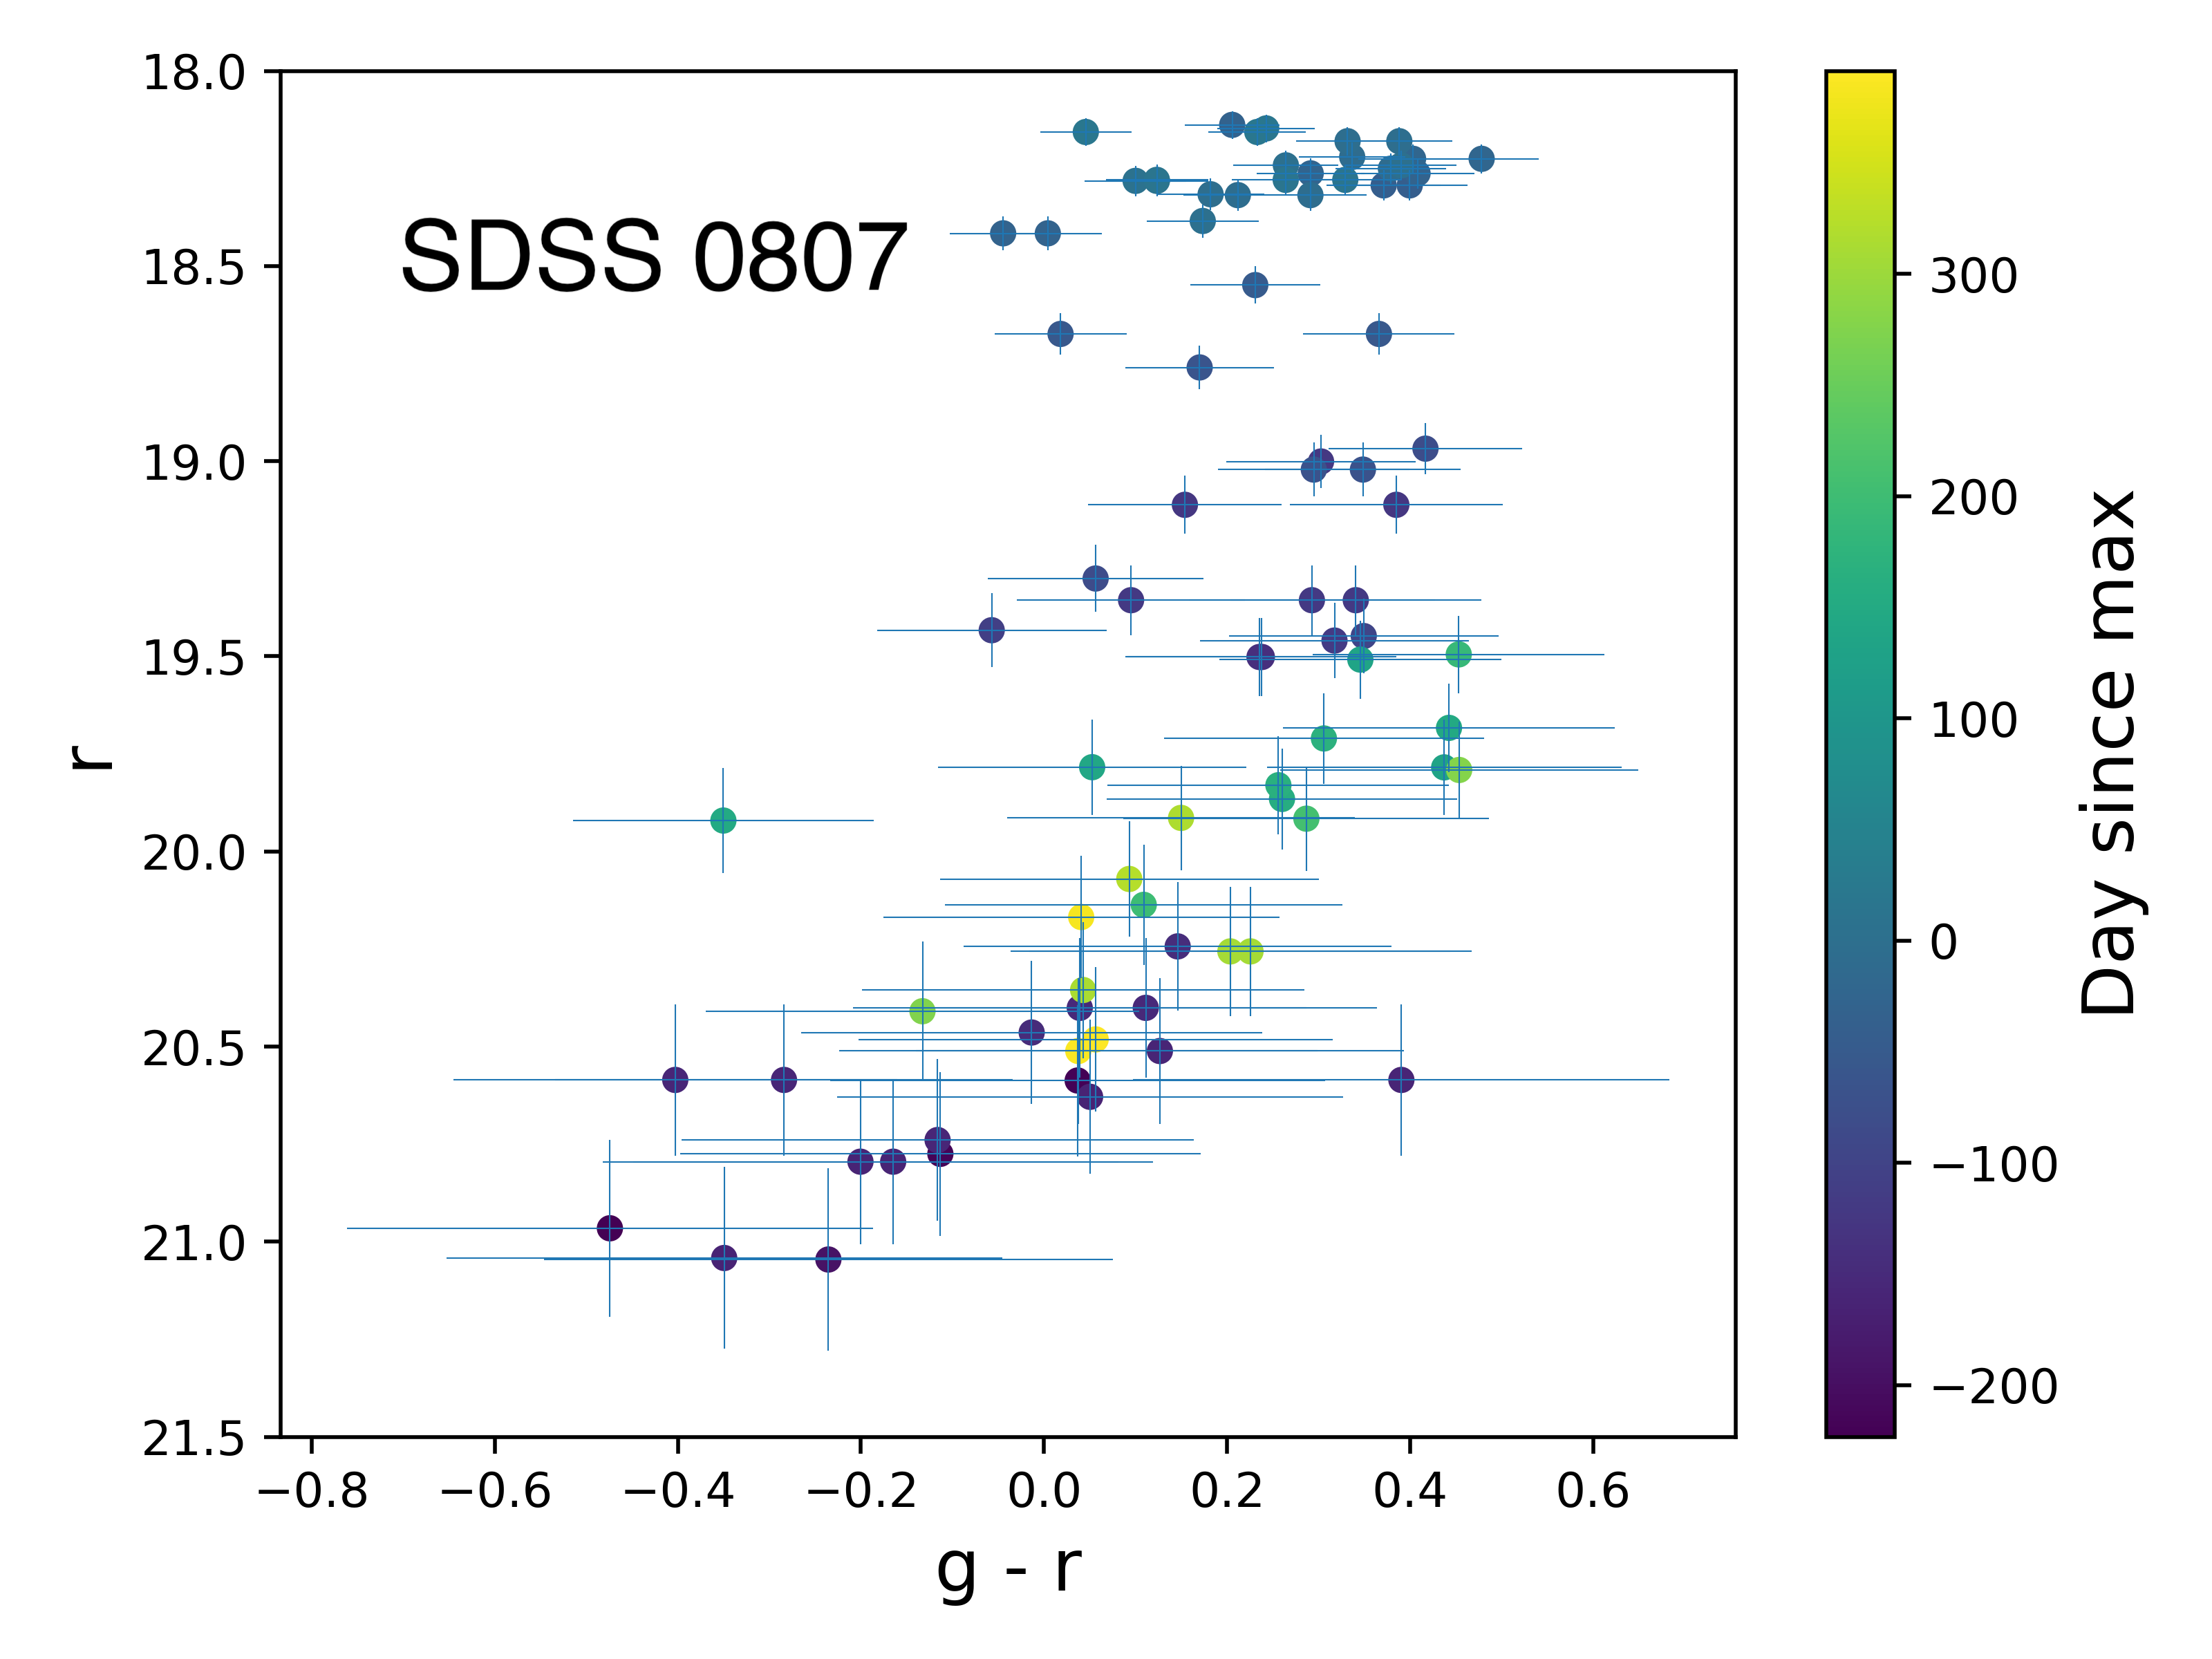
For the binary SDSS 0807 we observe a somewhat similar cycle, but with a few differences. During quiescence the binary is blue, which is due to the dominating emission from the primary WD. During the rise phase of the superoutburst the binary becomes redder and brighter, again due to the accretion disk becoming hotter. However, unlike SDSS 1137, this system turns to blue colors near the peak of the superoutburst suggesting the disk emission became dominant at this stage. This may indicate that eventually an instability was triggered in the disk, or that the mass flow across the disk, induced by the enhanced transfer, substantially heated up the disk. As the system returned back to quiescence the system became less bright. However, based on data up to mid-2020 (Rivera Sandoval et al., 2020), the binary had not reached full quiescence, and the colors remained redder when compared to colors before the outburst.
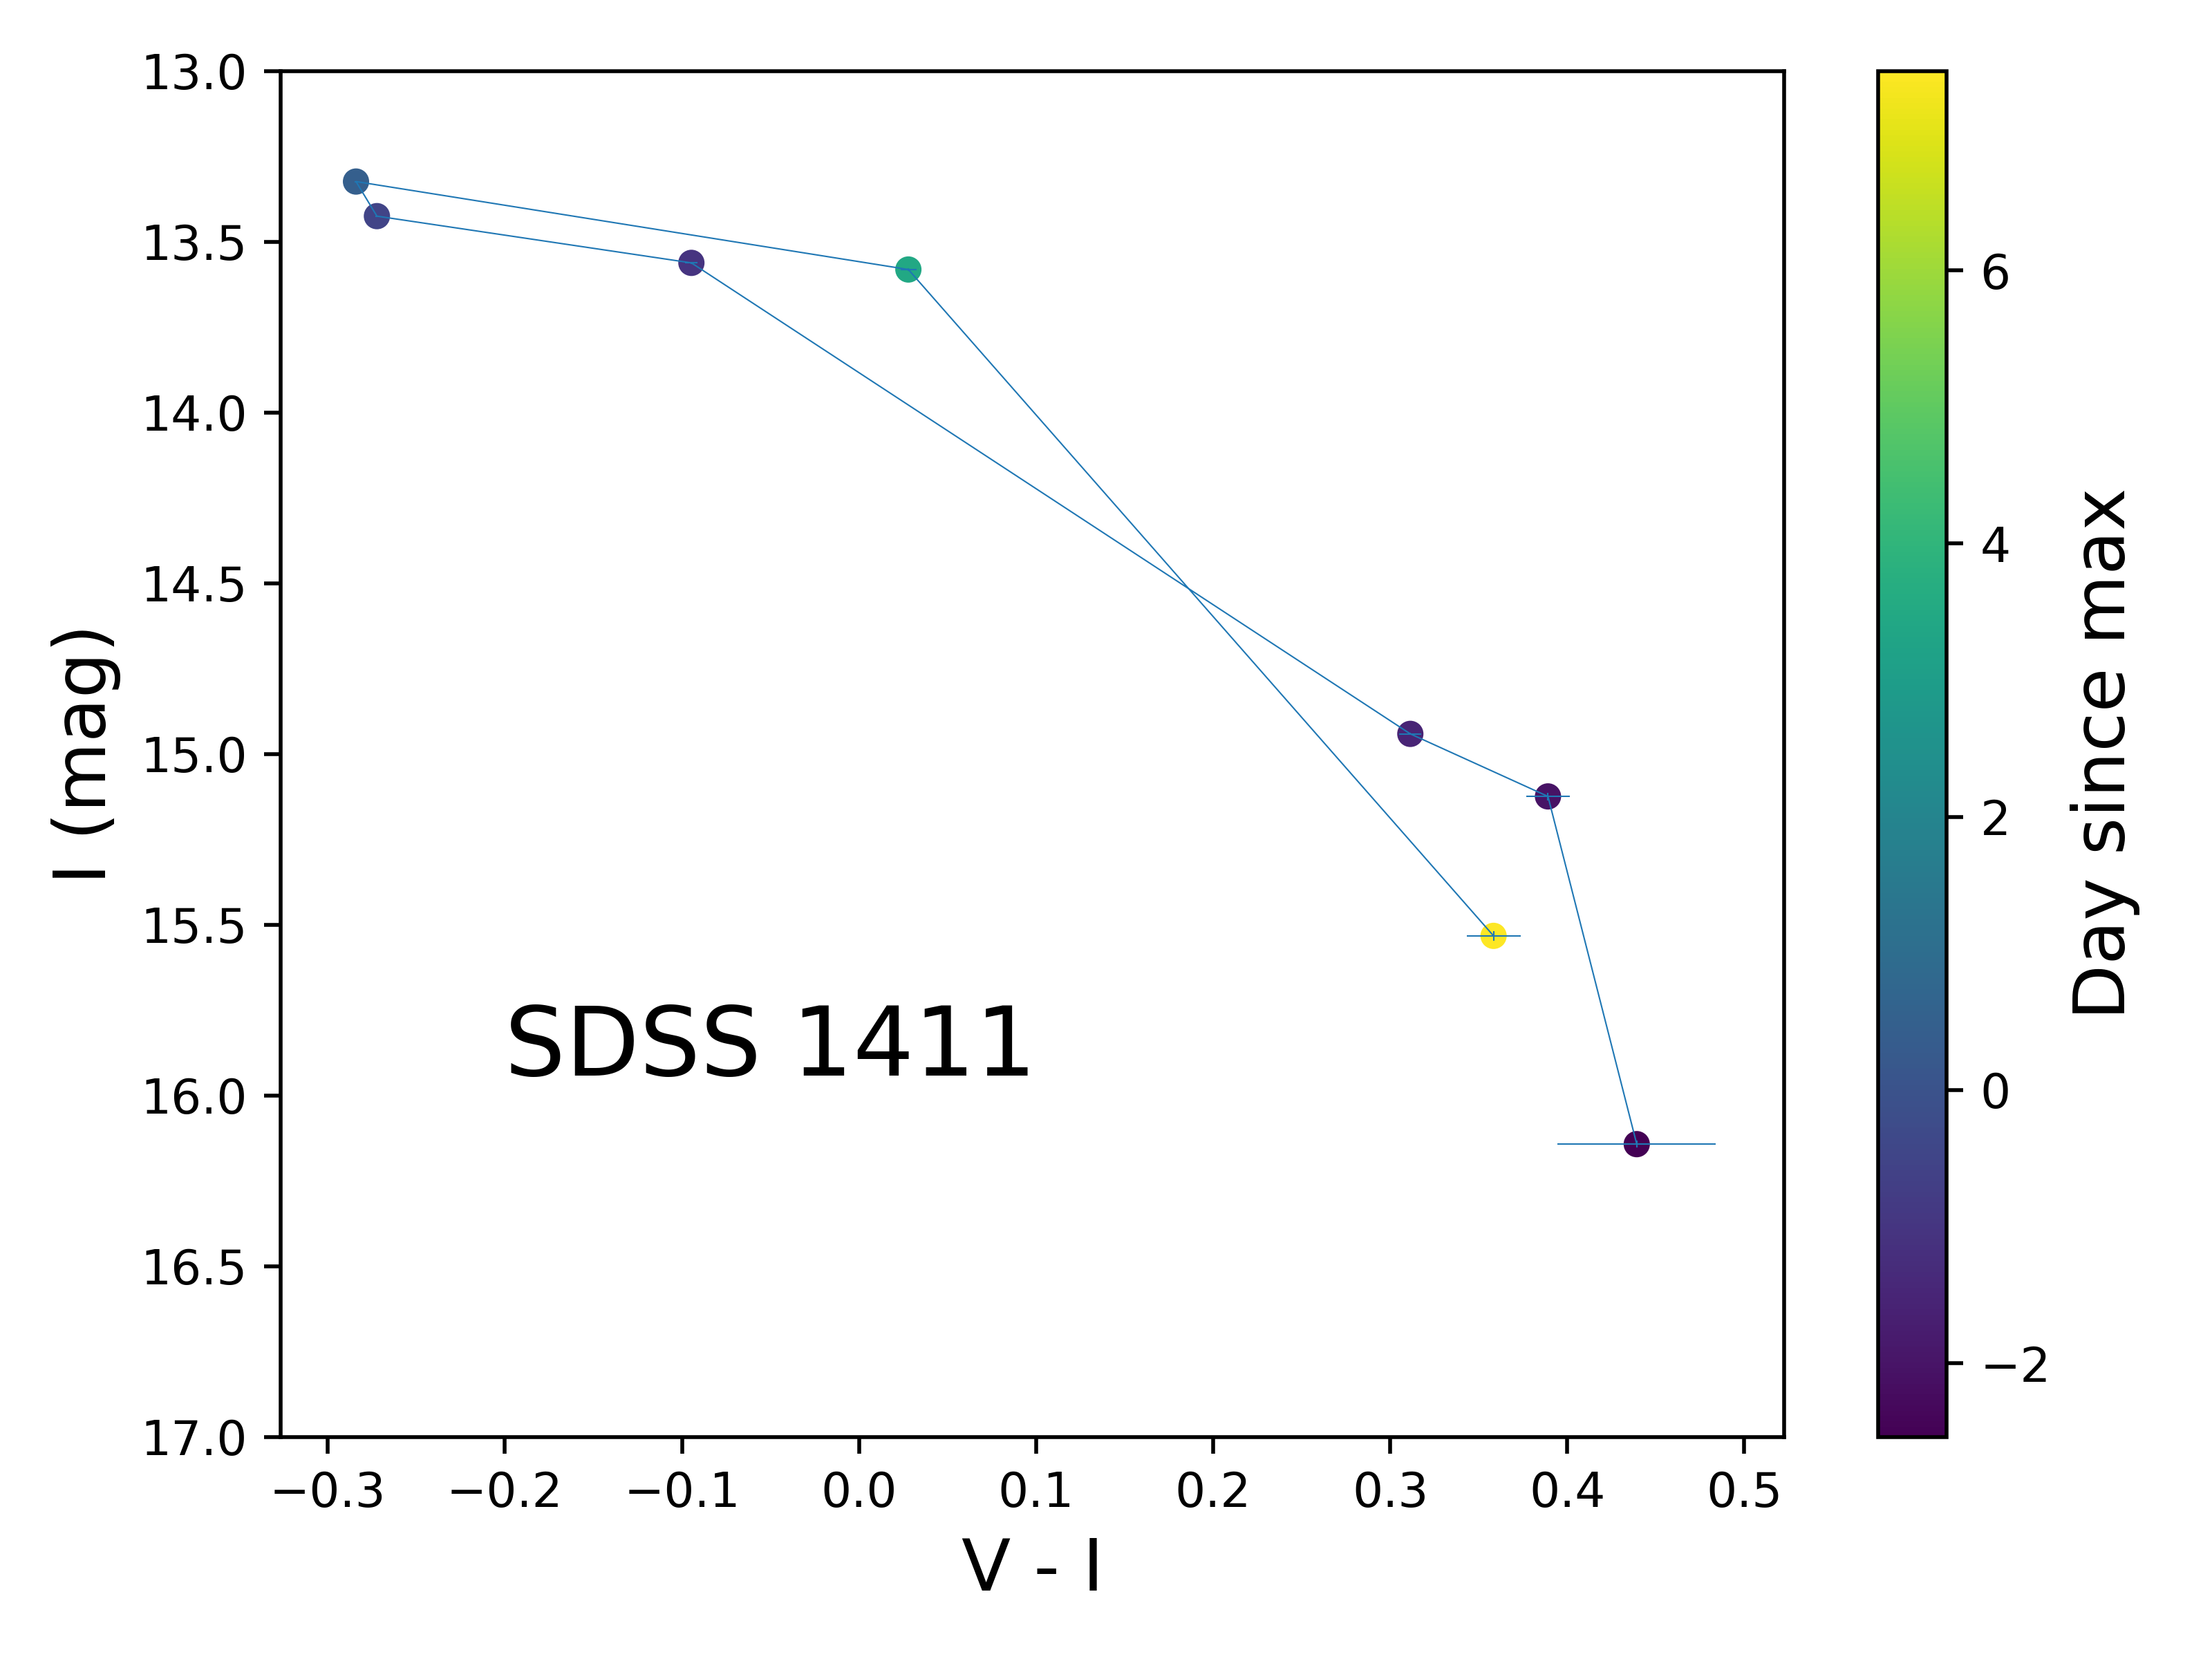
Contrary to the previously described cases, the AM CVn SDSS 1411 clearly becomes bluer as it moves on the rising phase of the outburst, and it is bluest and brightest during the peak. Afterwards the binary becomes redder and fainter reaching colors similar to those before the superoutburst. This behavior is very well consistent with the one for DNe outburst (Hameury et al., 2020), which explains why SDSS 1411 agrees with expectations from the DIM for He dominated disks (Fig. 4 and Cannizzo & Ramsay, 2019).
It is also worth to note the low amplitude of the outburst in SDSS 1137. It has been previously shown that the empirical relation between the orbital period and the outburst amplitude derived by Levitan et al. (2015) seems to fail for long period AM CVn (Rivera Sandoval & Maccarone, 2019; Rivera Sandoval et al., 2020). This is not surprising considering that such relation was derived for systems with orbital periods no longer than 37 min. In the case of SDSS 0807, the low amplitude could be explained (at least partially) as due to inclination effects, but the relatively small radial velocity of SDSS 1137 ( km/s, Carter et al., 2014) compared to the one of SDSS 0807 (or even SDSS 1411) argues against a similar explanation. Metallicity has an important effect on the amplitude of outbursts in AM CVns (Kotko et al., 2012), making the amplitude smaller as the metallicity increases. However, while metallicity could have influenced the particularly small amplitude of SDSS 1137, it is more likely that such amplitude is due to the nature of the outburst itself, i.e. not related to disk instabilities as we have discussed above.
It is interesting to note a trend in the outburst behaviour as a function of the period. The shortest period source in our sample, SDSS 1411 ( min), shows a disk instability since the beginning of the outburst. As we move to a longer period, SDSS 0807 ( min), mass-transfer enhancement seems to be the main mechanism at onset, but eventually a disk instability was probably triggered (or at least the disk was substantially heated up by the enhanced mass transfer). Finally, at even longer periods, SDSS 1137 ( min), the triggering process seems to be still mass-transfer enhancement, but the disk is too cold to ever dominate the emission/lightcurve. Of course, these periods are by no means definitive limits between the different behaviours, but they do seem to indicate a trend.
In order to investigate the period limit (if any) between enhanced mass-transfer driven outbursts and those due to disk instabilities, more long period AM CVns in outburst have to be studied. Some authors (e.g. Kotko et al., 2012) have placed such period limit between 50 and 65 min, with the exact limit depending on the mass of the accreting WD and the metallicity of the disk. For example, for a massive WD (1 M⊙) and a pure He disk that limit seems to be around 65 min. Thus, it is possible that if the accretor in SDSS 1137 is a massive one, disk instability outburst can eventually be triggered (additionally to the mass-transfer ones like the one presented in this paper), but likely with an extremely long recurrence time.
4.2 The companion of SDSS 1137
From our SED analysis we determined the existence of a NIR excess which could be attributed to the companion star, making this the second direct detection of the donor in a non-direct impacting AM CVn (the other one is SDSS J1505+065 recently reported by Green et al., 2020). The detected NIR excess helps explaining the extreme red colors of SDSS 1137 which make the binary a clear outlier in the vs color-color diagram (Carter et al., 2014). Considering the color, the companion would be consistent with a star of spectral type L or T (Pecaut & Mamajek, 2013). That spectral type is then consistent with the one of SDSS J1505+065. However, the detection of broad N emission lines in the red parts of the spectrum of SDSS 1137 seems to rule out a highly evolved He star donor (Carter et al., 2014) and instead, it favors a WD scenario (Nelemans et al., 2010). In this paper we are unable to be more specific regarding the type of donor given the few NIR measurements available and the large photometric uncertainties in the two AllWISE data points which also affect the SED fit of Fig. 3. In fact, the temperature and normalization of the second black-body fit are only indicative, but they demonstrate a clear NIR excess in the SED.
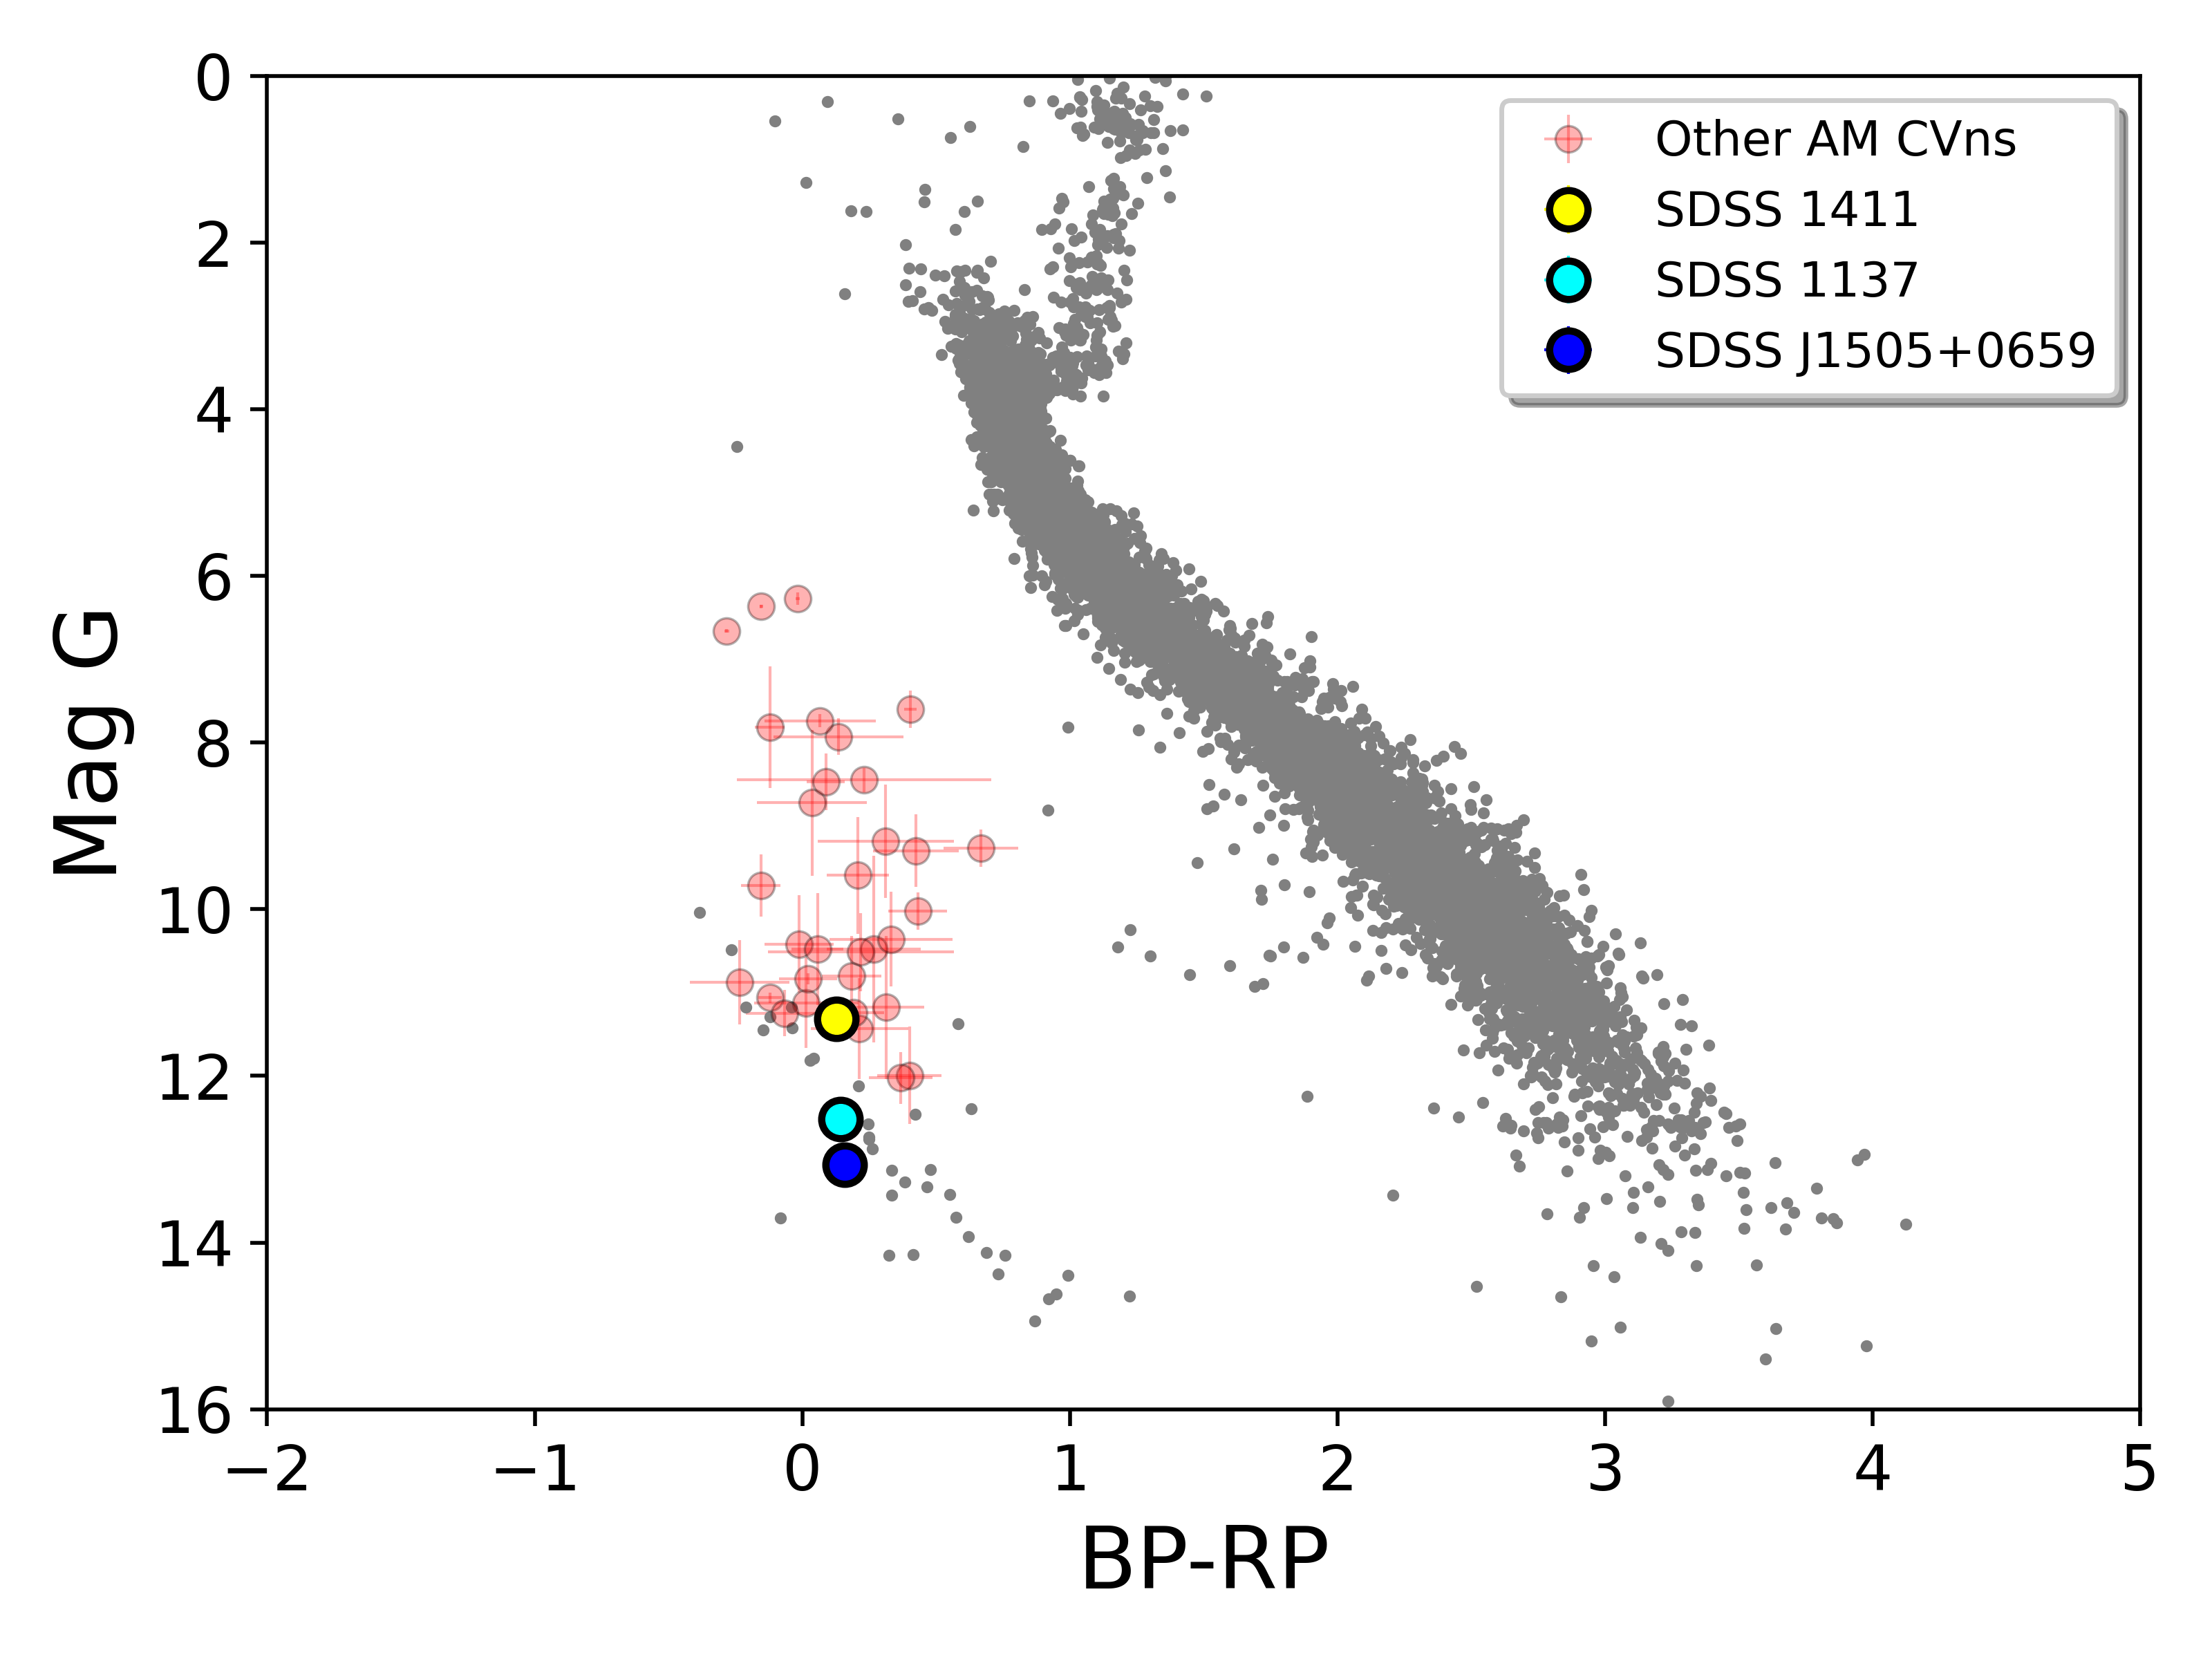
We have further compared the position of SDSS 1137 and SDSS J1505+065 in a Gaia Color-Magnitude Diagram in Fig.7. Both AM CVn systems lie on the WD cooling sequence, confirming that the contribution from the companion is really low. Instead, the emission is dominated by the accreting WD with the brightness of the object correlated to their orbital period, i.e. longer orbital period AM CVns are older and therefore fainter.
Note that given the current observations, we cannot discard the presence of a circumbinary disk, the emission of which peaks in the NIR (e.g. Spruit &
Taam, 2001; Dubus et al., 2004). More data are required in order to investigate each scenario.
While writing this manuscript we became aware that Sunny Wong et al. (2021) were writing a research note reporting the detection of the same long duration outburst.
Acknowledgements
We thank the anonymous referee for her/his comments which improved this manuscript. We also thank Dr. J.M. Hameury for useful discussion. LERS is supported by an Avadh Bhatia postdoctoral Fellowship at the University of Alberta. This paper is based on observations obtained with the Samuel Oschin 48-inch Telescope at the Palomar Observatory as part of the Zwicky Transient Facility project. ZTF is supported by the National Science Foundation under Grant No. AST-1440341 and a collaboration including Caltech, IPAC, the Weizmann Institute for Science, the Oskar Klein Center at Stockholm University, the University of Maryland, the University of Washington, Deutsches Elektronen-Synchrotron and Humboldt University, Los Alamos National Laboratories, the TANGO Consortium of Taiwan, the University of Wisconsin at Milwaukee, and Lawrence Berkeley National Laboratories. Operations are conducted by COO, IPAC, and UW. This work has made use of data from the European Space Agency (ESA) mission Gaia (https://www.cosmos.esa.int/gaia), processed by the Gaia Data Processing and Analysis Consortium (DPAC, https://www.cosmos.esa.int/web/gaia/dpac/consortium). Funding for the DPAC has been provided by national institutions, in particular the institutions participating in the Gaia Multilateral Agreement. The authors also acknowledge the SDSS, AAVSO and VizieR data bases for providing part of the data presented in this manuscript.
Data Availability
All data used in this document are public and they can be found in the ZTF, XMM-Newton and Swift archives and on the VizieR and AAVSO webpages.
References
- Arnaud (1996) Arnaud K. A., 1996, in Jacoby G. H., Barnes J., eds, Astronomical Society of the Pacific Conference Series Vol. 101, Astronomical Data Analysis Software and Systems V. p. 17
- Bailey (1980) Bailey J., 1980, MNRAS, 190, 119
- Bildsten et al. (2006) Bildsten L., Townsley D. M., Deloye C. J., Nelemans G., 2006, ApJ, 640, 466
- Cannizzo & Nelemans (2015) Cannizzo J. K., Nelemans G., 2015, ApJ, 803, 19
- Cannizzo & Ramsay (2019) Cannizzo J. K., Ramsay G., 2019, AJ, 157, 130
- Carter et al. (2014) Carter P. J., et al., 2014, MNRAS, 439, 2848
- Chambers et al. (2016) Chambers K. C., et al., 2016, arXiv e-prints, p. arXiv:1612.05560
- Deloye & Bildsten (2003) Deloye C. J., Bildsten L., 2003, ApJ, 598, 1217
- Deloye et al. (2007) Deloye C. J., Taam R. E., Winisdoerffer C., Chabrier G., 2007, MNRAS, 381, 525
- Drake et al. (2009) Drake A. J., et al., 2009, ApJ, 696, 870
- Dubus et al. (2004) Dubus G., Campbell R., Kern B., Taam R. E., Spruit H. C., 2004, MNRAS, 349, 869
- Gaia Collaboration (2020) Gaia Collaboration 2020, VizieR Online Data Catalog, p. I/350
- Gaia Collaboration et al. (2018) Gaia Collaboration et al., 2018, A&A, 616, A1
- Green et al. (2019) Green G. M., Schlafly E., Zucker C., Speagle J. S., Finkbeiner D., 2019, ApJ, 887, 93
- Green et al. (2020) Green M. J., et al., 2020, MNRAS, 496, 1243
- Grindlay et al. (2009) Grindlay J., Tang S., Simcoe R., Laycock S., Los E., Mink D., Doane A., Champine G., 2009, in Osborn W., Robbins L., eds, Astronomical Society of the Pacific Conference Series Vol. 410, Preserving Astronomy’s Photographic Legacy: Current State and the Future of North American Astronomical Plates. p. 101
- Hameury & Lasota (2014) Hameury J. M., Lasota J. P., 2014, A&A, 569, A48
- Hameury et al. (1997) Hameury J. M., Lasota J. P., Hure J. M., 1997, MNRAS, 287, 937
- Hameury et al. (2020) Hameury J. M., Knigge C., Lasota J. P., Hambsch F. J., James R., 2020, A&A, 636, A1
- Kilic et al. (2015) Kilic M., et al., 2015, ApJ, 814, L31
- Kochanek et al. (2017) Kochanek C. S., et al., 2017, PASP, 129, 104502
- Kotko et al. (2012) Kotko I., Lasota J. P., Dubus G., Hameury J. M., 2012, A&A, 544, A13
- Landi Degl’Innocenti (1976) Landi Degl’Innocenti E., 1976, ApJ, 209, 208
- Lasota et al. (2008) Lasota J. P., Dubus G., Kruk K., 2008, A&A, 486, 523
- Levitan et al. (2015) Levitan D., Groot P. J., Prince T. A., Kulkarni S. R., Laher R., Ofek E. O., Sesar B., Surace J., 2015, MNRAS, 446, 391
- Lü et al. (2017) Lü G., Zhu C., Wang Z., Iminniyaz H., 2017, ApJ, 847, 62
- Masci et al. (2019) Masci F. J., et al., 2019, PASP, 131, 018003
- Moussa (2020) Moussa M., 2020, Annals of Physics, 420, 168263
- Nelemans et al. (2010) Nelemans G., Yungelson L. R., van der Sluys M. V., Tout C. A., 2010, MNRAS, 401, 1347
- Pecaut & Mamajek (2013) Pecaut M. J., Mamajek E. E., 2013, ApJS, 208, 9
- Ramsay et al. (2005) Ramsay G., Hakala P., Marsh T., Nelemans G., Steeghs D., Cropper M., 2005, A&A, 440, 675
- Ramsay et al. (2018) Ramsay G., et al., 2018, A&A, 620, A141
- Rivera Sandoval & Maccarone (2019) Rivera Sandoval L. E., Maccarone T. J., 2019, MNRAS, 483, L6
- Rivera Sandoval et al. (2020) Rivera Sandoval L. E., Maccarone T. J., Pichardo Marcano M., 2020, ApJ, 900, L37
- Schlegel et al. (1998) Schlegel D. J., Finkbeiner D. P., Davis M., 1998, ApJ, 500, 525
- Smak (1983) Smak J., 1983, Acta Astron., 33, 333
- Solheim (2010) Solheim J. E., 2010, PASP, 122, 1133
- Spruit & Taam (2001) Spruit H. C., Taam R. E., 2001, ApJ, 548, 900
- Sunny Wong et al. (2021) Sunny Wong T. L., van Roestel J., Kupfer T., Bildsten L., 2021, Research Notes of the American Astronomical Society, 5, 3
- Tutukov et al. (1985) Tutukov A. V., Fedorova A. V., Ergma E. V., Yungelson L. R., 1985, Soviet Astronomy Letters, 11, 52
- Warner (1995) Warner B., 1995, Ap&SS, 225, 249
- Warner (2015) Warner B., 2015, Mem. Soc. Astron. Italiana, 86, 129
- Wright et al. (2010) Wright E. L., et al., 2010, AJ, 140, 1868