Phase Diagram of Active Brownian Spheres: Crystallization and the Metastability of Motility-Induced Phase Separation
Abstract
Motility-induced phase separation (MIPS), the phenomenon in which purely repulsive active particles undergo a liquid-gas phase separation, is among the simplest and most widely studied examples of a nonequilibrium phase transition. Here, we show that states of MIPS coexistence are in fact only metastable for three-dimensional active Brownian particles over a very broad range of conditions, decaying at long times through an ordering transition we call active crystallization. At an activity just above the MIPS critical point, the liquid-gas binodal is superseded by the crystal-fluid coexistence curve, with solid, liquid, and gas all coexisting at the triple point where the two curves intersect. Nucleating an active crystal from a disordered fluid, however, requires a rare fluctuation that exhibits the nearly close-packed density of the solid phase. The corresponding barrier to crystallization is surmountable on a feasible timescale only at high activity, and only at fluid densities near maximal packing. The glassiness expected for such dense liquids at equilibrium is strongly mitigated by active forces, so that the lifetime of liquid-gas coexistence declines steadily with increasing activity, manifesting in simulations as a facile spontaneous crystallization at extremely high activity.
Introduction.– The equilibrium crystallization of hard spheres [1] is the canonical example of entropically driven ordering of particle configurations: For a range of volume fractions , a fluid of hard spheres in three dimensions (3D) undergoes a symmetry breaking transition into coexisting disordered (fluid) and ordered (solid) phases [2, 3, 4, 5, 6, 7, 8, 9, 10, 11]. Boltzmann statistics provide an unambiguous physical interpretation of the driving force for this transition: the free volume generated by ordering permits a more diverse set of particle configurations, whose entropy is the sole contribution to the free energy of hard spheres. This order-disorder transition is entirely geometric in origin and is controlled solely by .
The influence of nonconservative dynamics on the melting transition of hard spheres is an open and important subject in nonequilibrium statistical mechanics: How do driven dynamics compete with entropic geometric forces to create or destroy order? To this end, active Brownian particles (ABPs) have emerged as a paradigmatic minimal model of driven systems and have aided in advancing our general understanding of nonequilibrium phase behavior [12, 13, 14]. In the athermal limit, the ABP model has only two distinct control parameters, both geometric in character. Dimensional analysis reveals one as and the other as the ratio of the persistence (or “run”) length of a free particle’s trajectory to the particle size . This run length provides a convenient and direct measure of the time-irreversible motion of active particles, allowing for a continuous departure from reversible dynamics () [15, 16, 17] where equilibrium hard-sphere physics should be precisely recovered.
Further motivating the study of active crystallization is the knowledge that for finite run lengths, ABPs exhibit a distinct geometric transition that has garnered considerable interest: the so-called motility-induced phase separation (MIPS) [18, 19, 20, 12]. This uniquely nonequilibrium phenomenon requires no interparticle attraction, yet appears to be a genuine liquid-gas transition, with no evidence of rotational symmetry breaking between the coexisting phases in 3D [21, 22, 23, 24, 25]. The apparent and conspicuous absence of an ordered phase for activities in the vicinity of the MIPS phase boundary raises the intriguing question: Does the crystallization transition disappear as the system departs from equilibrium?
In this Letter we aim to clarify the relationship between MIPS and crystallization out of equilibrium. To this end, we present results of extensive simulations of active Brownian hard spheres, conducted over a broad range of conditions. The majority of computational work on ABP ordering transitions has focused on repulsive disks in 2D [26, 27, 28, 29, 30, 31, 32], where the relationship between MIPS and crystallization is obscured by complications that long muddied the nature of freezing even for hard disks at equilibrium [33, 34]. We instead construct phase diagrams for active Brownian hard spheres in 3D, where the order-disorder transition is straightforward in the equilibrium limit. These results reveal that the crystallization coexistence region in fact expands with increasing activity, engulfing the MIPS phase boundary everywhere except for a narrow range of control parameters. Slightly above the critical activity, the solid-fluid phase boundary intersects the liquid-gas binodal, forming an active triple point where solid, liquid, and gas may coexist. The proximity of the triple and critical points renders nearly the entirety of the MIPS phase boundary metastable, with solid-fluid coexistence being the globally stable configuration. The frequent observation of liquid-gas coexistence (and its apparent stability) is due to the remarkably narrow region of the phase diagram where nucleation of an active crystal from a disordered fluid can be readily observed. By locating these regions, we are able to identify the rate-limiting features of the active crystal nucleation landscape.
Model system.– We consider the simplest active system that captures the equilibrium crystallization limit for vanishing activity: 3D active Brownian hard spheres. Each of the particles experiences three forces: a drag force proportional to the particle velocity , a conservative (pairwise) interparticle force , where is the set of all particle positions, and an active self-propelling force . The particle orientations independently obey diffusive 3D rotary dynamics where the stochastic angular velocity has mean and variance and is the characteristic reorientation time. We take the interparticle force to result from a Weeks-Chandler-Anderson potential [35] (characterized by a Lennard-Jones diameter and energy ) and take , , and to be the characteristic units of force, length and time, respectively. The overdamped Langevin equation for the dimensionless velocity naturally follows as
| (1) |
where . The dimensionless force depends on the reduced positions and is fully characterized by the “stiffness” parameter .
Despite our use of a continuous potential, the hard-sphere limit is very closely approached in these simulations. Lacking translational Brownian motion (which attenuates the influence of activity on the phase behavior 111Thermal energy adds an additional dimension to the phase diagram that measures its strength relative to activity, . In the limit that , thermal effects dominate, and active phase behavior vanishes for all . Our study aims to establish the active (i.e., athermal ) limit.), and inertia (which also profoundly alters active phase behavior [37]), these particles strictly exclude volume with a diameter set by . Continuous repulsions act only at distances between and , a range that quickly becomes negligible as increases. We use a stiffness for which , effectively achieving hard-sphere statistics. Holding to remain in this hard-sphere limit, the system state is independent of the active force magnitude and is fully described by two geometric parameters: the volume fraction and the dimensionless intrinsic run length .
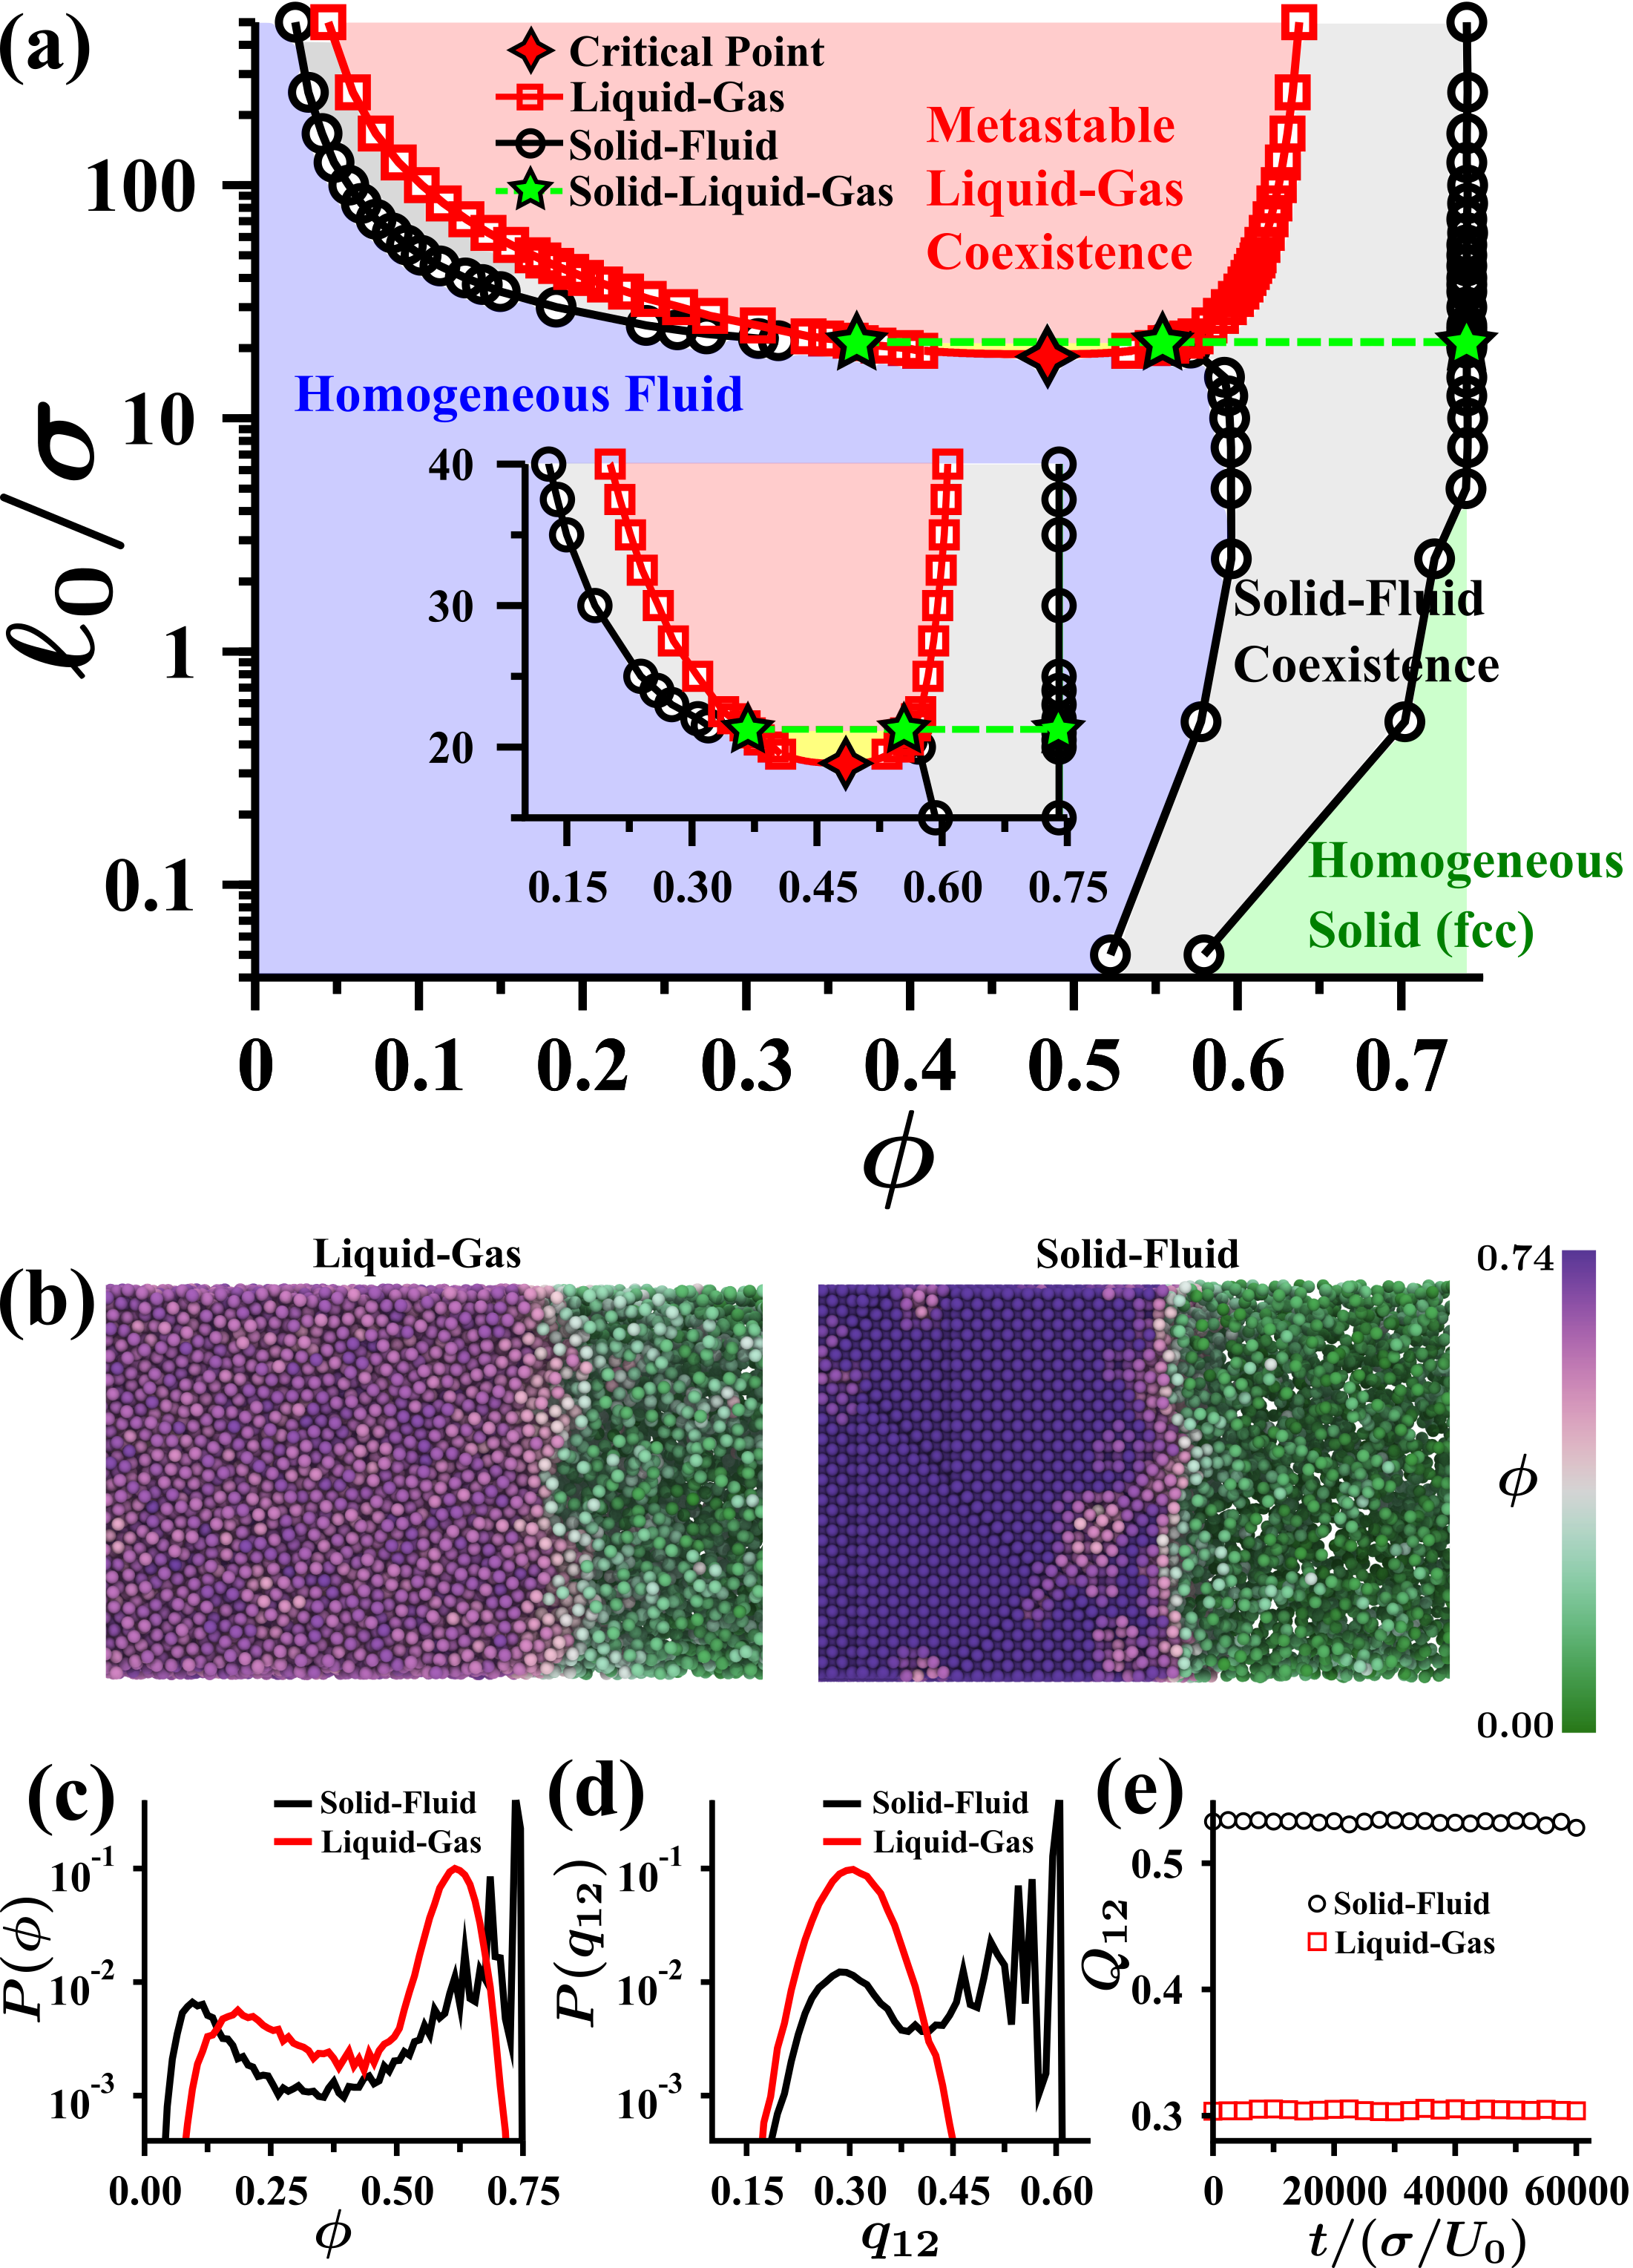
Phase diagram.– The phase diagram of 3D active hard spheres is presented in Fig. 1. Initially homogeneous [39] systems prepared within the liquid-gas binodal are often observed to spontaneously phase separate, the widely reported MIPS. For all activities within the 3D MIPS phase boundary, the coexisting phases differ only in density, appearing to share precisely the same symmetry, shown in Fig. 1(b). More quantitatively, Figs. 1(c) and (d) show the probability distribution of local density to be bimodal, while (the per-particle Steinhardt-Nelson-Ronchetti order parameter [40] measuring 12-fold rotational symmetry) is Gaussian distributed to a good approximation.
The critical point associated with this liquid-gas transition is found by assuming critical scaling of the order parameter, which we take to be the difference between liquid- and gas-phase densities . Defining the reduced activity as , the order parameter is anticipated to scale as (). By fitting the coexisting densities nearest to the critical point [39], we extract a critical activity and critical exponent . The latter value agrees suggestively (and perhaps fortuitously) with the 3D Ising universality class. A full critical scaling analysis [41, 42, 43, 44, 45] (such as those recently performed on 2D active systems [46, 59, 47, 48, 49]) will be required to confirm the robustness of this apparent agreement. The critical density is found to be .
The order-disorder transition, by contrast, is notably absent from the literature on 3D ABPs, a direct consequence of formidable nucleation barriers that will be described below (see Fig. 2). To access this transition, we devise a simulation protocol [39] that biases the system to form face-centered-cubic (fcc) crystals, later established as the stable ordered phase for this system. In a nutshell, we initialize the particles in a perfect fcc configuration at and perform a uniaxial extension to sweep through and identify regions of solid-fluid coexistence. Long simulations [39] are run to verify the stability of the observed coexistence. The resulting coexisting solid and fluid densities are reported in our phase diagram [Fig. 1(a)] with a typical configuration shown in Fig. 1(b).
Importantly, solid-fluid coexistence was observed to be a stable configuration for a range of at all values of activity – including those in which MIPS is observed. At small activities, where particle motion is nearly reversible [39], systems approach the well-established hard-sphere coexistence densities [2, 9] of and . At , for instance, we find and . With increasing activity, we observe a rapid departure from this reversible limit; coexisting densities of both phases increase markedly. The solid packing fraction quickly approaches the close-packed volume fraction and remains near this value for all .
In contrast to the solid density, the activity dependence of the fluid is nonmonotonic and defines some of the central features of the phase diagram. As the activity is increased from zero, the fluid density rapidly increases to a volume fraction of (at ), then decreases upon reaching the critical activity for MIPS. The fluid density continues to decrease with activity until intersecting the MIPS binodal () slightly above the critical point. The intersection of these coexistence curves results in an active triple point 222Three-phase coexistence occurs at a single point in the pressure-activity plane but for a continuous range of in the density-activity plane. where gas, liquid, and solid phases can coexist at the densities marked in Fig. 1(a).
Above the triple activity, the fluid that coexists with the solid phase has a density that is strictly less than the MIPS gas-phase density. As a result, above the three-phase coexistence line, the liquid-gas binodal is entirely engulfed by the solid-fluid coexistence boundary [see Fig. 1(a)]. In an equilibrium context, encapsulation of the liquid-gas binodal by the crystal-fluid phase boundary is a familiar and generic feature of simple substances below their triple temperature [61, 62, 63]. Equilibrium requirements that free energy be convex and extensive further guarantee that the phase boundary with more extreme densities (typically crystal-fluid) corresponds to the more stable coexistence. Leveraging the tools of large deviation theory [50], a similar conclusion can be drawn even for systems out of equilibrium [39]. For our ABPs at activities above , states of liquid-gas coexistence should therefore crystallize irreversibly. We observe that systems above the triple point and within the MIPS binodal can nevertheless persist for very long times in a state of liquid-gas coexistence. We now aim to verify that these states are globally unstable.
Homogeneous nucleation and stability.– Despite recent progress in the development of importance sampling techniques for nonequilibrium systems [64, 65, 66, 67, 68, 69, 70, 71, 72, 73], the ability to comprehensively survey the phase behavior of many-particle active systems [74, 75, 76, 77] remains limited. In the absence of these tools, we make an appeal to two-state rate theory to identify the relative stability of the two coexistence scenarios. Observing one form of coexistence (e.g., liquid-gas) spontaneously transition to the other (e.g., solid-fluid), and failing to observe the reverse transition, would provide compelling evidence for the global stability of the latter coexistence scenario (and, naturally, the metastability of the former). However, long simulations at many such state points reveal no transitions. For example, Fig. 1(e) shows the time evolution of the global order parameter (the particle-averaged ) at (, ). This points to the looming larger question: Can we observe the unbiased nucleation of an active crystal from a disordered fluid? We therefore turn to understanding the general forces that sculpt the crystal nucleation landscape and their dependencies on the state parameters (, ).
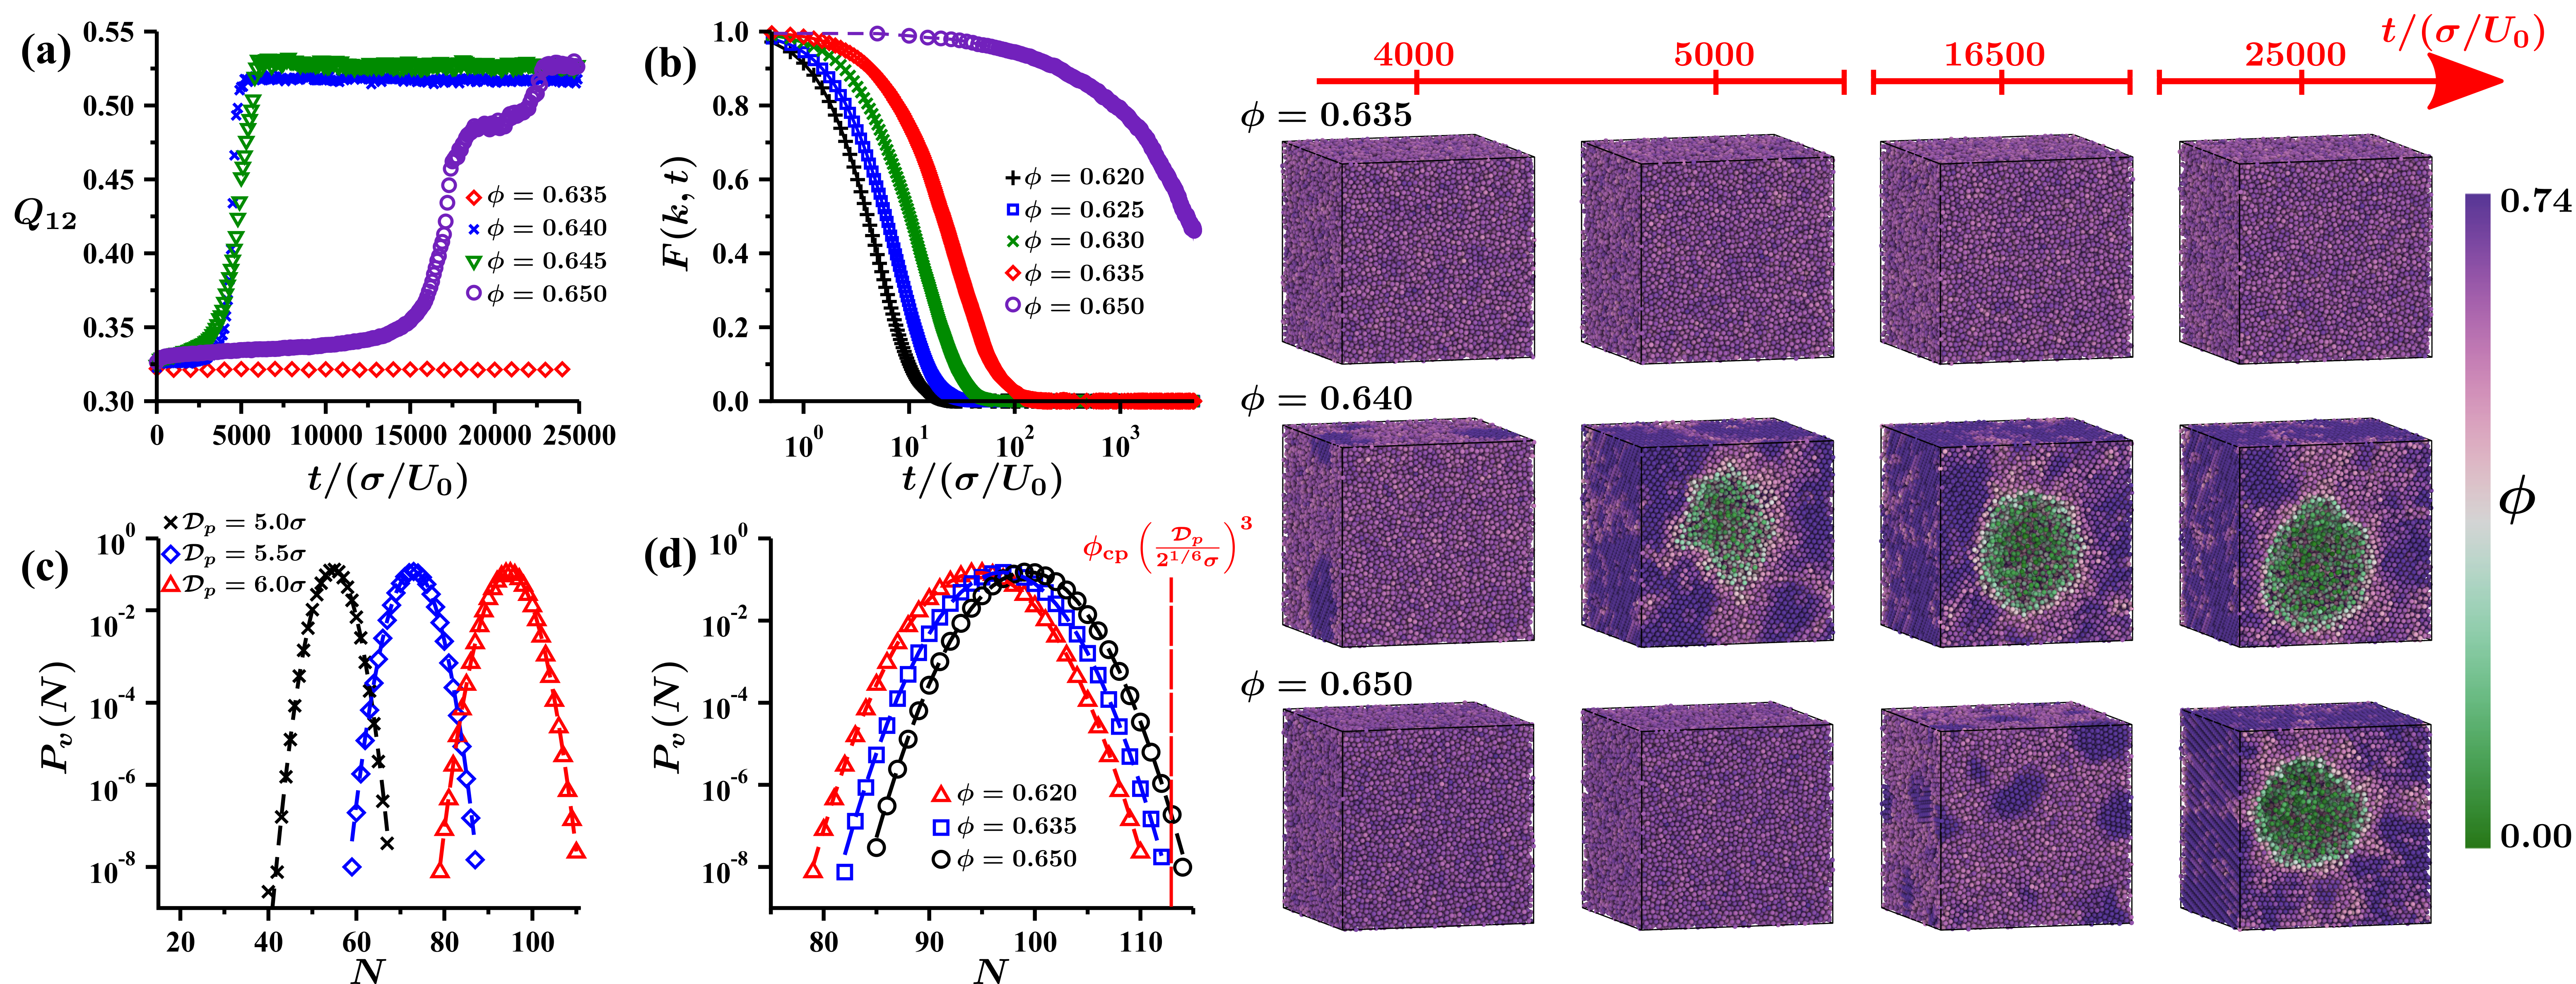
Figure 2 surveys the crystal nucleation landscape at dense packing fractions outside of the liquid-gas binodal ( for ). In this region of the phase diagram, solid-fluid coexistence is the unambiguously stable system state. We prepare these metastable high-density fluids by the isotropic compression of less-dense fluids [39]. A disordered fluid at is observed to remain a liquid on all accessible timescales. Fluids at , by contrast, readily nucleate a tightly packed active crystal (fcc), which grows into a single ordered domain that coexists with a fluid (gas) bubble [see Fig. 2(a)]. The crystal symmetry and coexisting densities are consistent with those obtained from our crystal seeding procedure. Crystal nucleation remains facile up to (near maximal packing [78]), the limiting density at which a hard-sphere fluid can still relax.
The remarkably narrow window of density () where active crystal growth can be observed makes evident why the 3D active order-disorder transition has, to our knowledge, previously eluded observation. That this nucleation window occurs near maximal packing can be understood from general ideas of classical nucleation theory, which has successfully described the nucleation of 2D active liquids [79, 80, 81]. In this framework, the characteristic crystal nucleation rate should be governed by the product of the inverse fluid relaxation time and the probability of forming the critical nucleus in the course of spontaneous fluctuations 333In equilibrium, this probability follows from the critical nucleus free energy barrier height (along the appropriate reaction coordinate), e.g., ..
High densities are generally considered inhospitable for nucleation, since fluids typically vitrify near maximal packing, i.e., diverges. Highly active fluids, however, exhibit no sign of glassy dynamics up to a density of (at least 444We cannot characterize the dynamics of the active fluids at and , as the nucleation time is comparable to the fluid relaxation time. The short lifetime of these fluids also precludes the inclusion of these densities in the structural analysis presented in Figs. 2(b) and 2(c).) , as evidenced by the self-component of the dynamic structure factor [Fig. 2(b)]. Significant arrest only occurs upon reaching the geometrically frustrated maximal random limit, consistent with the emerging active glass literature [51, 52, 53, 54, 55, 56, 57].
In the absence of vitrification, dense liquids can be favorable for nucleation, since they promote fluctuations that feature solidlike local density. We quantify this enhancement of by calculating the probability to observe particles in a spherical probe volume of diameter . Much like hard spheres at equilibrium [84], the distribution is Gaussian for many standard deviations, even for large densities and relatively small probe diameters [see Fig. 2(c)]. For comparable in size to a plausible critical nucleus (), solidlike local densities are highly atypical at for fluids at all densities we have studied, shown in Fig. 2(d). For , such extreme local density fluctuations are so unlikely as to be unobserved in our long simulations. Near , they become discernible (while still rare), consistent with our observations of successful crystal nucleation.
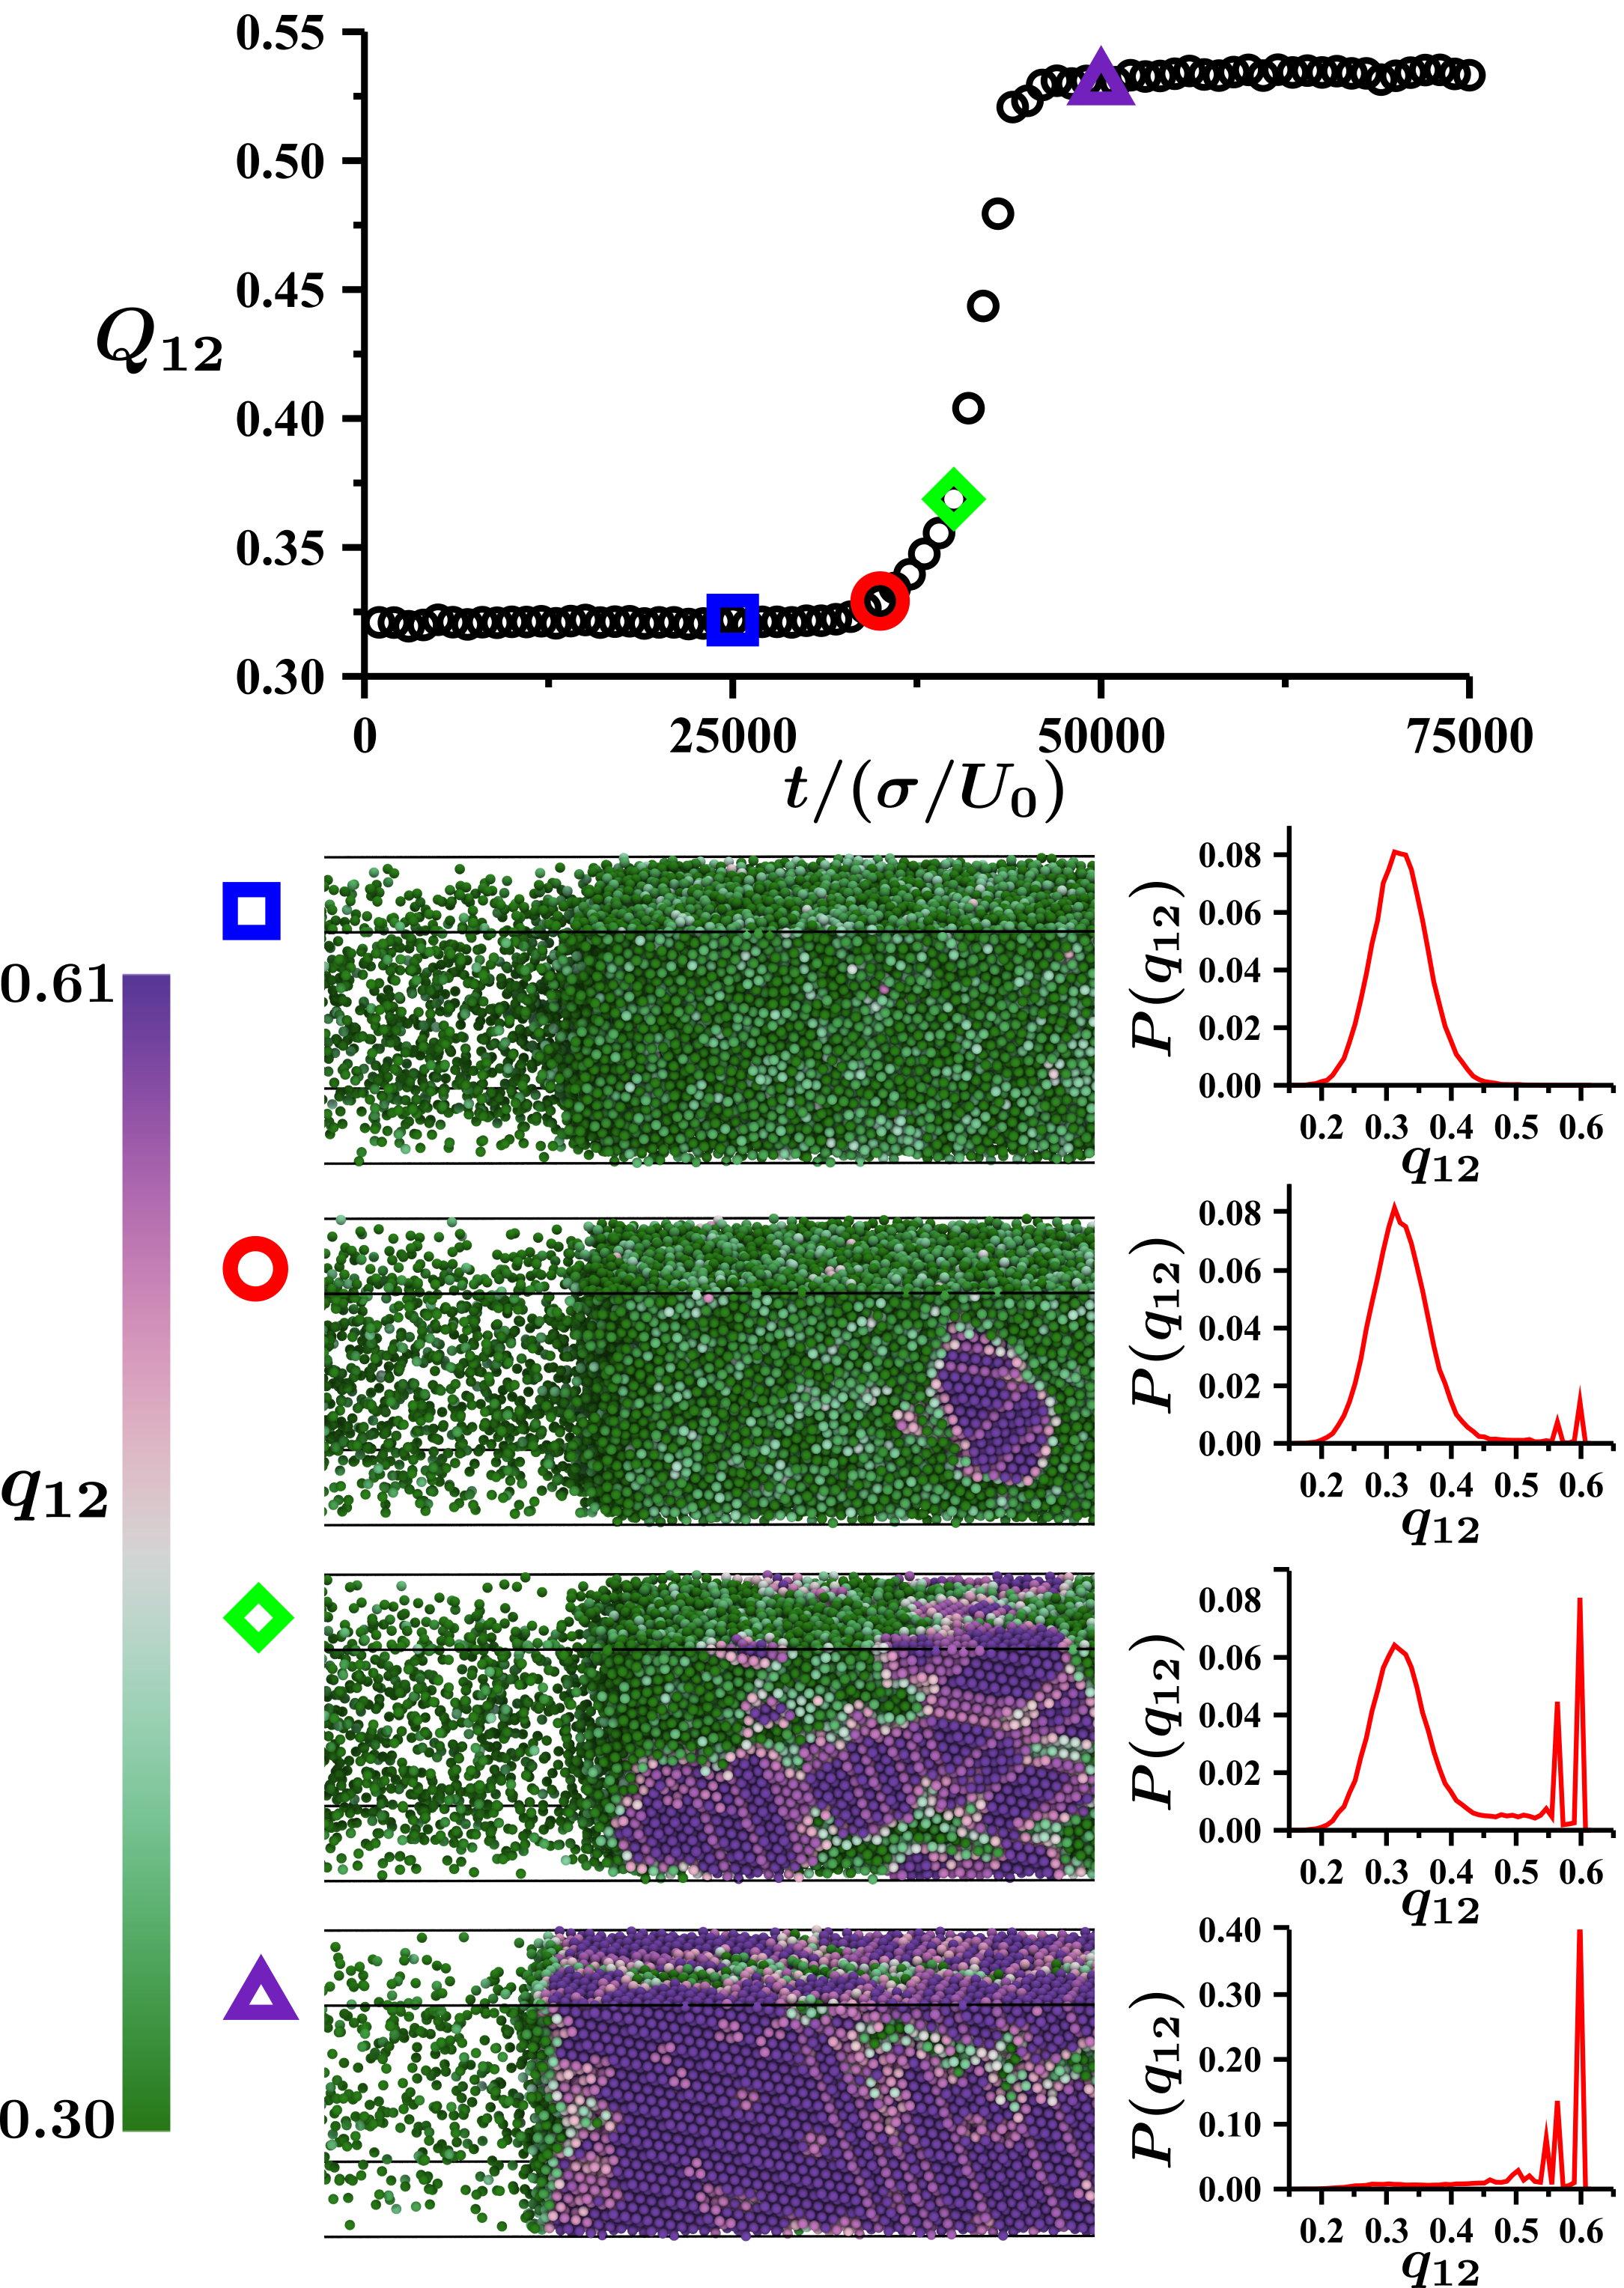
Discussion and conclusions.– The near close-packed density of active crystals severely restricts the region of the phase diagram where crystallization can feasibly be observed in simulations, in stark contrast to the broad range of conditions in which MIPS is readily observable (via nucleation or spinodal decomposition). Sufficiently close-packed local fluctuations occur with non-negligible probability only in fluids that are almost maximally packed. Direct observation of transitions from liquid to solid, such as in Fig. 3, is thus feasible at very high activity, where the liquid phase is extremely dense. At low activities, the MIPS liquid-phase density is simply too low to nucleate an active crystal on accessible timescales, as exemplified by the long trajectory of Fig. 1(e) with liquid density . In this low-activity case we lack the direct evidence of spontaneous transitions to judge the metastability of liquid-gas coexistence. Based on theoretical considerations [39], however, the densities of coexisting phases we observe in simulations constitute strong indirect evidence to this effect. We therefore conclude that MIPS is in fact metastable above the triple point activity. Consequently, liquid-gas coexistence is only the globally stable state in the narrow interval 555We emphasize that in the athermal hard-sphere limit, no adjustable parameters are available to tune the relative location of the critical and triple points – the close proximity of these points (and the resulting stability implications) is an intrinsic property of the system. between the critical and triple points [see Fig. 1(a) inset and videos in Supplemental Material [39]].
The phase diagram presented in this work bears a striking resemblance to the phase diagram of traditional equilibrium molecular or colloidal systems with short-ranged attractions [61, 62, 63]. However, attempting to directly equate activity to an “effective attraction” has proven to be difficult [86, 87, 25]. We therefore anticipate that 3D active hard spheres will serve as an important system to generalize the equilibrium arguments used in the construction of solid-fluid phase boundaries (and triple points) to nonequilibrium systems. Moreover, additional examination of active phase behavior in 3D may prove insightful for further understanding the role of dimensionality in the rich phase behavior (such as “bubbly liquids” [88, 89, 31]) reported in 2D. Finally, while active freezing has primarily been experimentally interrogated in 2D [90, 91, 92], we hope that our study will aid in guiding ongoing efforts [93] to realize 3D active crystals.
Acknowledgements.
A.K.O. acknowledges support from the Schmidt Science Fellowship in partnership with the Rhodes Trust. P.L.G. was supported by the U.S. Department of Energy, Office of Basic Energy Sciences, through the Chemical Sciences Division (CSD) of Lawrence Berkeley National Laboratory (LBNL), under Contract No. DE-AC02-05CH11231. This research used the Savio computational cluster resource provided by the Berkeley Research Computing program. We gratefully acknowledge the support of the NVIDIA Corporation for the donation of the Titan V GPU used to carry out part of this work.References
- Alder and Wainwright [1957] B. J. Alder and T. E. Wainwright, J. Chem. Phys. 27, 1208 (1957).
- Hoover and Ree [1968] W. G. Hoover and F. H. Ree, J. Chem. Phys. 49, 3609 (1968).
- Pusey and van Megen [1986] P. N. Pusey and W. van Megen, Nature (London) 320, 340 (1986).
- Pusey et al. [1989] P. N. Pusey, W. van Megen, P. Bartlett, B. J. Ackerson, J. G. Rarity, and S. M. Underwood, Phys. Rev. Lett. 63, 2753 (1989).
- Rintoul and Torquato [1996] M. D. Rintoul and S. Torquato, Phys. Rev. Lett. 77, 4198 (1996).
- Auer and Frenkel [2001] S. Auer and D. Frenkel, Nature (London) 409, 1020 (2001).
- Torquato [2002] S. Torquato, Random Heterogeneous Materials, Interdisciplinary Applied Mathematics, Vol. 16 (Springer, New York, 2002).
- Zaccarelli et al. [2009] E. Zaccarelli, C. Valeriani, E. Sanz, W. C. K. Poon, M. E. Cates, and P. N. Pusey, Phys. Rev. Lett. 103, 135704 (2009).
- Pusey et al. [2009] P. N. Pusey, E. Zaccarelli, C. Valeriani, E. Sanz, W. C. Poon, and M. E. Cates, Phil. Trans. R. Soc. A. 367, 4993 (2009).
- Richard and Speck [2018a] D. Richard and T. Speck, J. Chem. Phys. 148, 124110 (2018a).
- Richard and Speck [2018b] D. Richard and T. Speck, J. Chem. Phys. 148, 224102 (2018b).
- Cates and Tailleur [2015] M. E. Cates and J. Tailleur, Annu. Rev. Condens. Matter Phys. 6, 219 (2015).
- Bechinger et al. [2016] C. Bechinger, R. Di Leonardo, H. Löwen, C. Reichhardt, G. Volpe, and G. Volpe, Rev. Mod. Phys. 88, 045006 (2016).
- Mallory et al. [2018] S. A. Mallory, C. Valeriani, and A. Cacciuto, Annu. Rev. Phys. Chem. 69, 59 (2018).
- Fodor et al. [2016] É. Fodor, C. Nardini, M. E. Cates, J. Tailleur, P. Visco, and F. van Wijland, Phys. Rev. Lett. 117, 038103 (2016).
- Speck [2016] T. Speck, Europhys. Lett. 114, 30006 (2016).
- Mandal et al. [2017] D. Mandal, K. Klymko, and M. R. DeWeese, Phys. Rev. Lett. 119, 258001 (2017).
- Fily and Marchetti [2012] Y. Fily and M. C. Marchetti, Phys. Rev. Lett. 108, 235702 (2012).
- Redner et al. [2013] G. S. Redner, M. F. Hagan, and A. Baskaran, Phys. Rev. Lett. 110, 055701 (2013).
- Buttinoni et al. [2013] I. Buttinoni, J. Bialké, F. Kümmel, H. Löwen, C. Bechinger, and T. Speck, Phys. Rev. Lett. 110, 238301 (2013).
- Wysocki et al. [2014] A. Wysocki, R. G. Winkler, and G. Gompper, Europhys. Lett. 105, 48004 (2014).
- Stenhammar et al. [2014] J. Stenhammar, D. Marenduzzo, R. J. Allen, and M. E. Cates, Soft Matter 10, 1489 (2014).
- Nie et al. [2020] P. Nie, J. Chattoraj, A. Piscitelli, P. Doyle, R. Ni, and M. P. Ciamarra, Phys. Rev. Research 2, 023010 (2020).
- Omar et al. [2020] A. K. Omar, Z.-G. Wang, and J. F. Brady, Phys. Rev. E 101, 012604 (2020).
- Turci and Wilding [2021] F. Turci and N. B. Wilding, Phys. Rev. Lett. 126, 038002 (2021).
- Bialké et al. [2012] J. Bialké, T. Speck, and H. Löwen, Phys. Rev. Lett. 108, 168301 (2012).
- Fily et al. [2014] Y. Fily, S. Henkes, and M. C. Marchetti, Soft Matter 10, 2132 (2014).
- Cugliandolo et al. [2017] L. F. Cugliandolo, P. Digregorio, G. Gonnella, and A. Suma, Phys. Rev. Lett. 119, 268002 (2017).
- Digregorio et al. [2018] P. Digregorio, D. Levis, A. Suma, L. F. Cugliandolo, G. Gonnella, and I. Pagonabarraga, Phys. Rev. Lett. 121, 098003 (2018).
- Klamser et al. [2018] J. U. Klamser, S. C. Kapfer, and W. Krauth, Nat. Commun. 9, 5045 (2018).
- Caporusso et al. [2020] C. B. Caporusso, P. Digregorio, D. Levis, L. F. Cugliandolo, and G. Gonnella, Phys. Rev. Lett. 125, 178004 (2020).
- Caprini et al. [2020] L. Caprini, U. M. B. Marconi, C. Maggi, M. Paoluzzi, and A. Puglisi, Phys. Rev. Research 2, 023321 (2020).
- Mermin and Wagner [1966] N. D. Mermin and H. Wagner, Phys. Rev. Lett. 17, 1133 (1966).
- Bernard and Krauth [2011] E. P. Bernard and W. Krauth, Phys. Rev. Lett. 107, 155704 (2011).
- Weeks et al. [1971] J. D. Weeks, D. Chandler, and H. C. Andersen, J. Chem. Phys. 54, 5237 (1971).
- Note [1] Thermal energy adds an additional dimension to the phase diagram that measures its strength relative to activity, . In the limit that , thermal effects dominate, and active phase behavior vanishes for all . Our study aims to establish the active (i.e., athermal ) limit.
- Mandal et al. [2019] S. Mandal, B. Liebchen, and H. Löwen, Phys. Rev. Lett. 123, 228001 (2019).
- Anderson et al. [2020] J. A. Anderson, J. Glaser, and S. C. Glotzer, Comput. Mater. Sci. 173, 109363 (2020).
- Note [2] See Supplemental Material at [URL], which includes Refs. [15, 16, 17, 50, 58, 35, 38, 40, 24, 41, 42, 43, 44, 45, 46, 47, 48, 49, 51, 52, 53, 54, 55, 56, 57], for videos illustrating various consequences of the phase diagram, additional theoretical considerations, simulation and calculation details, and supporting information for constructing the phase diagram.
- Steinhardt et al. [1983] P. J. Steinhardt, D. R. Nelson, and M. Ronchetti, Phys. Rev. B 28, 784 (1983).
- Binder [1981] K. Binder, Z. Phys. B Condens. Matter 43, 119 (1981).
- Binder [1987] K. Binder, Ferroelectrics 73, 43 (1987).
- Rovere et al. [1988] M. Rovere, D. W. Hermann, and K. Binder, Europhys. Lett. 6, 585 (1988).
- Rovere et al. [1990] M. Rovere, D. W. Heermann, and K. Binder, J. Phys. Condens. Matter 2, 7009 (1990).
- Rovere et al. [1993] M. Rovere, P. Nielaba, and K. Binder, Z. Phys. B Condens. Matter 90, 215 (1993).
- Siebert et al. [2018] J. T. Siebert, F. Dittrich, F. Schmid, K. Binder, T. Speck, and P. Virnau, Phys. Rev. E 98, 030601(R) (2018).
- Maggi et al. [2021] C. Maggi, M. Paoluzzi, A. Crisanti, E. Zaccarelli, and N. Gnan, Soft Matter 17, 3807 (2021).
- [48] F. Dittrich, T. Speck, and P. Virnau, arXiv:2010.08387.
- [49] K. Adachi and K. Kawaguchi, arXiv:2012.02517.
- Touchette [2009] H. Touchette, Phys. Rep. 478, 1 (2009).
- Ni et al. [2013] R. Ni, M. A. Cohen Stuart, and M. Dijkstra, Nat. Commun. 4, 2704 (2013).
- Berthier [2014] L. Berthier, Phys. Rev. Lett. 112, 220602 (2014).
- Flenner et al. [2016] E. Flenner, G. Szamel, and L. Berthier, Soft Matter 12, 7136 (2016).
- Berthier et al. [2017] L. Berthier, E. Flenner, and G. Szamel, New J. Phys. 19, 125006 (2017).
- Berthier et al. [2019] L. Berthier, E. Flenner, and G. Szamel, J. Chem. Phys. 150, 200901 (2019).
- Nandi et al. [2018] S. K. Nandi, R. Mandal, P. J. Bhuyan, C. Dasgupta, M. Rao, and N. S. Gov, Proc. Natl. Acad. Sci. U.S.A. 115, 7688 (2018).
- [57] S. C. Takatori and K. K. Mandadapu, arXiv:2003.05618.
- Chakraborti et al. [2016] S. Chakraborti, S. Mishra, and P. Pradhan, Phys. Rev. E 93, 052606 (2016).
- Partridge and Lee [2019] B. Partridge and C. F. Lee, Phys. Rev. Lett. 123, 068002 (2019).
- Note [3] Three-phase coexistence occurs at a single point in the pressure-activity plane but for a continuous range of in the density-activity plane.
- Rein Ten Wolde and Frenkel [1997] P. Rein Ten Wolde and D. Frenkel, Science 277, 1975 (1997).
- Dijkstra et al. [1999] M. Dijkstra, J. M. Brader, and R. Evans, J. Phys. Condens. Matter 11, 10079 (1999).
- Haxton et al. [2015] T. K. Haxton, L. O. Hedges, and S. Whitelam, Soft Matter 11, 9307 (2015).
- Giardina et al. [2011] C. Giardina, J. Kurchan, V. Lecomte, and J. Tailleur, J. Stat. Phys. 145, 787 (2011).
- Klymko et al. [2018] K. Klymko, P. L. Geissler, J. P. Garrahan, and S. Whitelam, Phys. Rev. E 97, 032123 (2018).
- Ray et al. [2018] U. Ray, G. K.-L. Chan, and D. T. Limmer, J. Chem. Phys. 148, 124120 (2018).
- Das and Limmer [2019] A. Das and D. T. Limmer, J. Chem. Phys. 151, 244105 (2019).
- Whitelam et al. [2020] S. Whitelam, D. Jacobson, and I. Tamblyn, J. Chem. Phys. 153, 044113 (2020).
- Ray and Chan [2020] U. Ray and G. K.-L. Chan, J. Chem. Phys. 152, 104107 (2020).
- Helms and Chan [2020] P. Helms and G. K.-L. Chan, Phys. Rev. Lett. 125, 140601 (2020).
- Oakes et al. [2020] T. H. E. Oakes, A. Moss, and J. P. Garrahan, Mach. Learn. Sci. Technol 1, 35004 (2020).
- Kuznets-Speck and Limmer [2021] B. Kuznets-Speck and D. T. Limmer, Proc. Natl. Acad. Sci. U.S.A. 118, e2020863118 (2021).
- Rose et al. [2021] D. C. Rose, J. F. Mair, and J. P. Garrahan, New J. Phys. 23, 013013 (2021).
- Nemoto et al. [2019] T. Nemoto, É. Fodor, M. E. Cates, R. L. Jack, and J. Tailleur, Phys. Rev. E 99, 022605 (2019).
- GrandPre and Limmer [2018] T. GrandPre and D. T. Limmer, Phys. Rev. E 98, 060601(R) (2018).
- GrandPre et al. [2021] T. GrandPre, K. Klymko, K. K. Mandadapu, and D. T. Limmer, Phys. Rev. E 103, 012613 (2021).
- Keta et al. [2021] Y.-E. Keta, É. Fodor, F. van Wijland, M. E. Cates, and R. L. Jack, Phys. Rev. E 103, 022603 (2021).
- Torquato et al. [2000] S. Torquato, T. M. Truskett, and P. G. Debenedetti, Phys. Rev. Lett. 84, 2064 (2000).
- Richard et al. [2016] D. Richard, H. Löwen, and T. Speck, Soft Matter 12, 5257 (2016).
- Redner et al. [2016] G. S. Redner, C. G. Wagner, A. Baskaran, and M. F. Hagan, Phys. Rev. Lett. 117, 148002 (2016).
- Levis et al. [2017] D. Levis, J. Codina, and I. Pagonabarraga, Soft Matter 13, 8113 (2017).
- Note [4] In equilibrium, this probability follows from the critical nucleus free energy barrier height (along the appropriate reaction coordinate), e.g., .
- Note [5] We cannot characterize the dynamics of the active fluids at and , as the nucleation time is comparable to the fluid relaxation time. The short lifetime of these fluids also precludes the inclusion of these densities in the structural analysis presented in Figs. 2(b) and 2(c).
- Crooks and Chandler [1997] G. E. Crooks and D. Chandler, Phys. Rev. E 56, 4217 (1997).
- Note [6] We emphasize that in the athermal hard-sphere limit, no adjustable parameters are available to tune the relative location of the critical and triple points – the close proximity of these points (and the resulting stability implications) is an intrinsic property of the system.
- Farage et al. [2015] T. F. F. Farage, P. Krinninger, and J. M. Brader, Phys. Rev. E 91, 042310 (2015).
- Rein and Speck [2016] M. Rein and T. Speck, Eur. Phys. J. E 39, 84 (2016).
- Tjhung et al. [2018] E. Tjhung, C. Nardini, and M. E. Cates, Phys. Rev. X 8, 031080 (2018).
- Shi et al. [2020] X.-q. Shi, G. Fausti, H. Chaté, C. Nardini, and A. Solon, Phys. Rev. Lett. 125, 168001 (2020).
- Briand and Dauchot [2016] G. Briand and O. Dauchot, Phys. Rev. Lett. 117, 098004 (2016).
- Briand et al. [2018] G. Briand, M. Schindler, and O. Dauchot, Phys. Rev. Lett. 120, 208001 (2018).
- Huang et al. [2020] T. Huang, V. R. Misko, S. Gobeil, X. Wang, F. Nori, J. Schütt, J. Fassbender, G. Cuniberti, D. Makarov, and L. Baraban, Adv. Funct. Mater. 30, 2003851 (2020).
- [93] N. Sakaï and C. P. Royall, arXiv:2010.03925.