Melinda: A Multimodal Dataset
for Biomedical Experiment Method Classification
Abstract
We introduce a new dataset, Melinda, for Multimodal biomEdicaL experImeNt methoD clAssification. The dataset is collected in a fully automated distant supervision manner, where the labels are obtained from an existing curated database, and the actual contents are extracted from papers associated with each of the records in the database. We benchmark various state-of-the-art NLP and computer vision models, including unimodal models which only take either caption texts or images as inputs, and multimodal models. Extensive experiments and analysis show that multimodal models, despite outperforming unimodal ones, still need improvements especially on a less-supervised way of grounding visual concepts with languages, and better transferability to low resource domains. We release our dataset and the benchmarks to facilitate future research in multimodal learning, especially to motivate targeted improvements for applications in scientific domains.
1 Introduction
Biocuration, the activity of manually organizing biological information, is a crucial yet human-effort-intensive process in biomedical research (ISB 2018). Organizing such knowledge in a structured way is important for accelerating science since it facilitates downstream tasks such as scientific information retrieval (Craven, Kumlien et al. 1999; Mohan et al. 2018; Burns et al. 2018; Burns, Li, and Peng 2019), and question answering (Ben Abacha et al. 2019; Nguyen et al. 2019; He et al. 2020).
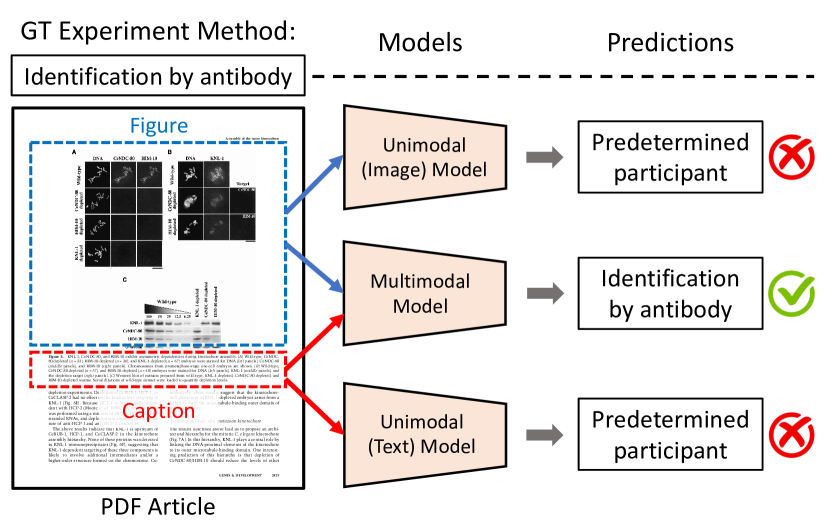
One such curation task is recognizing experiment methods, which identifies the underlying experimental protocols that result in the figures in research articles. It can be formulated as a multi-class classification task, which takes as inputs the figures and their captions, and outputs the corresponding experiment types that generate the figures, as illustrated in Figure 1.
The task is inherently multimodal as biocurators need to take both the figure and the caption into consideration to make their decisions (Demner-Fushman et al. 2012).111Although different experiment methods tend to generate visually different results, the differences can be subtle and the captions often help distinguish these subtle differences among figures. While scientists can do the task with perfect accuracy, the requirements of manual labeling from experts hinder the scalability of the process. It is thus imperative to develop advanced language and computer vision multimodal tools to help accelerate the aforementioned scientific discovery process.
However, automatically identifying the experiment methods poses significant challenges for multimodal processing tools. One major challenge is how to ground the visual concepts to language. Most current visual-linguistics multimodal models (Li et al. 2019; Lu et al. 2019; Su et al. 2020; Chen et al. 2020) rely on a robust object detection module to identify predefined objects for grounding finer granularity of visual and linguistics concepts. However, as it requires extra efforts from experts, scientific images often lack ground truth object annotations, and the transfer of pretrained detection models suffers from significant domain shifts. As a result, this specific domain would appreciate multimodal models particularly with less-supervised grounding paradigms. In addition, it is expensive to collect annotations from domain experts; the lack of sizable benchmark datasets hinders the development of multimodal models tailored to the biomedical domain.
To spur research in this area, we introduce Melinda, a dataset for Multimodal biomEdicaL experImeNt methoD clAssification that is created through a fully automated distantly supervised process (Mintz et al. 2009). Specifically, we leverage an existing biomedical database, IntAct222https://www.ebi.ac.uk/intact/ (Orchard et al. 2013), to get the experiment method labels, and then properly extract the actual contents from papers pointed by the records in IntAct to pair with the obtained labels. Melinda features 2,833 figures paired with their corresponding captions.We further segment captions into sub-captions referring to different sub-figures in the images, resulting in a total of 5,371 data records along with the labels of the experiment methods used to generate the sub-figures.
We benchmark several state-of-the-art models on the proposed experiment method classification task, including unimodal vision and language models and multimodal ones. Experiments suggest that multimodality is helpful for achieving better performances. However, the performances are still far from expert human-level, which suggests several area of improvements, including less reliance on object detection for grounding linguistic representations with visual sources, as well as finer-grained multimodal groundings.
Our work sheds light on future research in: (1) more generally applicable multimodal models, and (2) better transfer learning techniques in low resource domains such as scientific articles (Gururangan et al. 2020). We summarize our main contributions as follows:
-
•
A multimodal dataset mapping compound figures and associated captions from biomedical research articles to the labels of experiment methodologies , to help spur the research on multimodal understanding for scientific articles.
-
•
We conducted extensive experiments to benchmark and analyze various unimodal and multimodal models against the proposed dataset, suggesting several future directions for multimodal models in scientific domain.
2 The Melinda Dataset
We introduce a new multimodal dataset, Melinda, for biomedical experiment method classification. Each data instance is a unique tuple consisting of a figure, an associated sub-caption for the targeted sub-figure(s), and an experiment method label coming from the IntAct database. IntAct stores manually annotated labels for experiment method types, paired with their corresponding sub-figure identifiers and ids to the original paper featuring the figures333IntAct only stores these ids as pointers, and our collection pipeline extracts the actual contents according to these pointers., and structures them into an ontology. Each major category have different levels of granularity. This work mainly focuses on two major categories of experiments for identifying molecular interactions: participant identification (Par) and interaction detection (Int) methods444Molecular interaction experiments require two types of assay: participant detection methods identify the molecules involved in the interaction and the interaction detection methods identify the types of interactions occurring between the two molecules. , each has two levels of granularity, coarse and fine (choice of the granularity depends on downstream applications). Samples of data and their labels are as exemplified in Figure 2 (more are in the appendix).
Each record in IntAct consists of the aforementioned expert curated information to a specific article in the Open Access PubMed Central555A publicly available subset of the PubMed collections: https://www.ncbi.nlm.nih.gov/pmc/tools/openftlist/ (OA-PMC). According to the IntAct guideline, figure captions are sufficiently descriptive for justifying the underlying methods of the figures, and hence are properly extracted instead of including the body of text in the articles. The details of the dataset collection procedures and its statistics are described in the following sections.
Experiment Method Labels
Par(coarse) : predetermined
participant
Par(fine) : predetermined
Int(coarse) : imaging
technique
Int(fine) : fluorescence
imaging
Experiment Method Labels
Par(coarse) : identification
by antibody
Par(fine) : western
blot
Int(coarse) : affinity
chromatography
Int(fine) : anti-bait
coip
2.1 Data Collection Pipeline
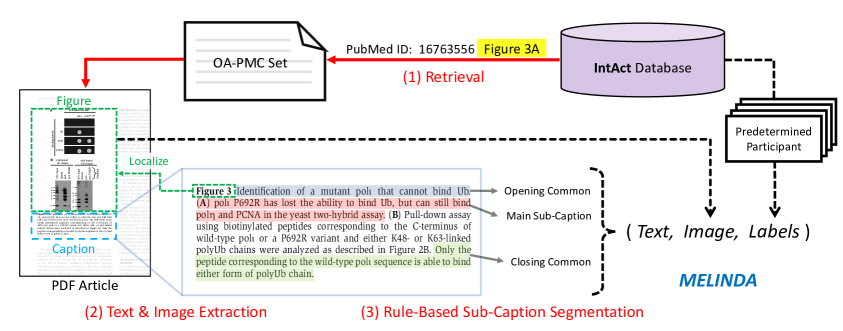
Our dataset is collected through three main procedures, as illustrated in Figure 3: (1) Obtain the experiment method labels and sub-figure identifiers from IntAct. (2) Localize the indicated figures and their captions in the pointed PDF articles. (3) Segment the captions into sub-captions so each can target a sub-figure of the figures obtained in step (2). As the overall procedure adopts a fully automated distant supervision approach, our dataset could be seamlessly expanded as additional articles being added to the OA-PMC set.
Ground Truth IntAct Label Extraction. By properly parsing and mapping the PSI-MI2.5666An XML format: http://psidev.info/mif formatted IntAct records, each individually extracted instance can form a unique tuple of , where the sub-figure-id is a concatenation of the PubMed id of an article and the sub-figure identifier.
Text and Image Extraction. The OA-PMC paper ids are then used to search and download the indicated PDF articles. The textual and image contents are extracted using an in-house PDF interpreter, which leverages spatial indexing over each page to support content extractions. We extract contiguous word blocks across the articles, and the figure captions are localized by detecting the keywords ‘Fig’ or ‘Figure’. The corresponding figures are cropped out by searching for large rectangular regions with low text densities nearby the captions. Note that although the classification task concerns sub-figures, we do not further segment a figure into sub-figures as we expect the models to be equipped with the capability of attending to the right sub-figures given the captions. Moreover, there are captions cross-referencing multiple sub-figures, and thus full figures should be preserved.
Sub-Caption Segmentation. Captions for compound figures are first tokenized into sentences followed by a text cleansing preprocessing, and then grouped into proper corresponding sub-captions through the following steps: (1) Descriptions before the first sentence containing sub-figure identifiers, e.g. ”(A)”, ”(A-C)”, are extracted as the opening common text. (2) The sentence containing a detected sub-figure identifier and all of its subsequent ones until the next sentence containing different identifier(s) is found, are extracted as the main sub-caption for that particular identifier. (3) Descriptions after the last sentence containing identifiers, are regarded as the closing common text, as researchers may put some summary texts at the end. Hence, a proper sub-caption is a concatenation of all of the above, which ensures no relevant contents of a sub-caption is overlooked. More details of our data collection pipeline can be found in the appendix and our released code repository777The data collection pipeline and our benchmark models can be found at https://github.com/PlusLabNLP/melinda..
| Quality | Descriptions | % |
|---|---|---|
| \faFrownO | Imperfect crop of the figures, i.e. accidentally cropped out some parts | 8 |
| \faSmileO | Perfect crop of figures but with some small additional nuisances e.g. partial captions, other figures, etc. | 34 |
| Perfect nuisance-free crop of figures with proper boundaries | 58 |
| Quality | Descriptions | % |
|---|---|---|
| \faFrownO | Extracted captions do not match the original captions in the PDF or the extracted figures (caption-figure mismatch) | 4 |
| \faSmileO | Extracted and segmented sub-captions match the original sub-captions in the PDF and caption-figure matched | 10 |
| Sub-captions matched the original sub-captions in the PDF with common parts preserved and caption-figure matched | 86 |
2.2 Data Quality Assessment
Since our dataset is created by distant supervision from IntAct, for which if we perfectly pair the labels with corresponding figures and subcaptions, the expert human performances should remain 100%. Therefore, the quality of the data instances rely on the quality of content extraction and pairing. In order to estimate the quality of the extracted contents, we randomly sample 100 instances for a manual inspection. With the corresponding original papers provided, we ask three non-domain-expert annotators to assess the quality mainly in terms of how good the image cropping is and how accurate the caption extractions are (the results were computed via majority vote). The inter-annotator agreement Fleiss’ Kappa for the following results are 0.804 for images and 0.676 for captions assessments.
Table 2(a) shows the inspection results of the extracted (and cropped) images on if they are missing any important regions, or containing any noises. Among the sampled images, (i.e. ) of the images are showing reasonably good quality, with of them missing some details due to the cropping. The quality of the extracted (and segmented) sub-captions, as well as whether they match the associated sub-figure images, is summarized in Table 2(b). Over of the sampled data can be regarded as good, while of them have issues such as partial texts missing. It is worth noting that even in this proportion of data which misses some details, the majority parts of the captions (and the figures) are still properly preserved.
2.3 Dataset Details
General Statistics.
| Type | Counts | |||
| Total Unique Articles | 1,497 | |||
| Total Unique Images | 2,833 | |||
| Total Data Instances | 5,371 | |||
| Train / Val / Test | 4,344 / 449 / 578 | |||
| Type-Token Ratio | 29,384 / 501,091 = 0.059 | |||
| Type | Mean | Std | Min | Max |
| Tokens in a Caption | 93.29 | 47.33 | 3 | 491 |
| Sentences in a Caption | 5.23 | 2.36 | 1 | 27 |
| Tokens in a Sentence | 17.83 | 12.27 | 1 | 256 |
|
Hierarchy | # IntAct Labels |
|
||||
|---|---|---|---|---|---|---|---|
| Participant | Coarse | 7 | 7 | ||||
| Fine | 48 | 45 | |||||
| Interaction | Coarse | 18 | 15 | ||||
| Fine | 122 | 85 |
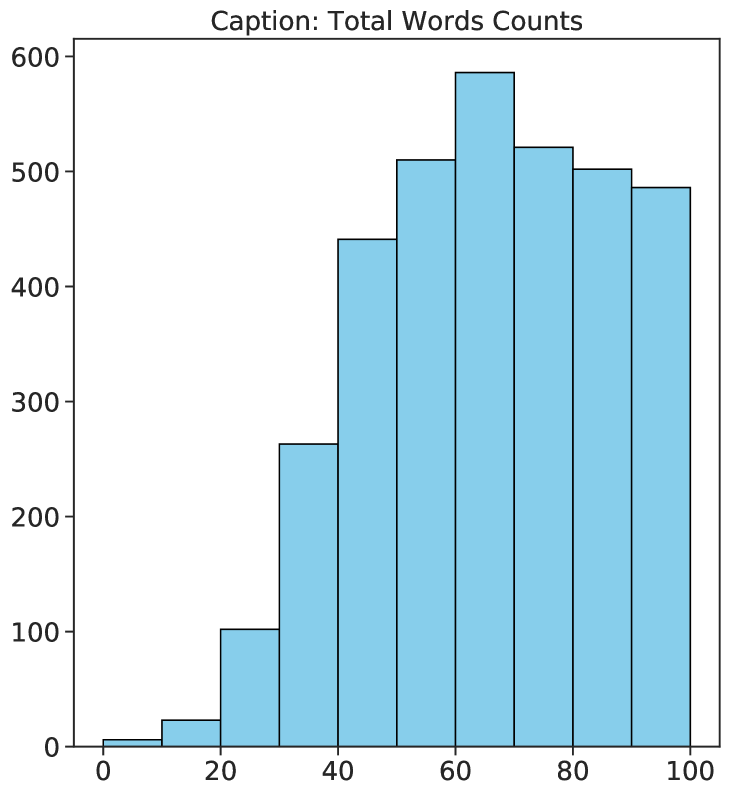
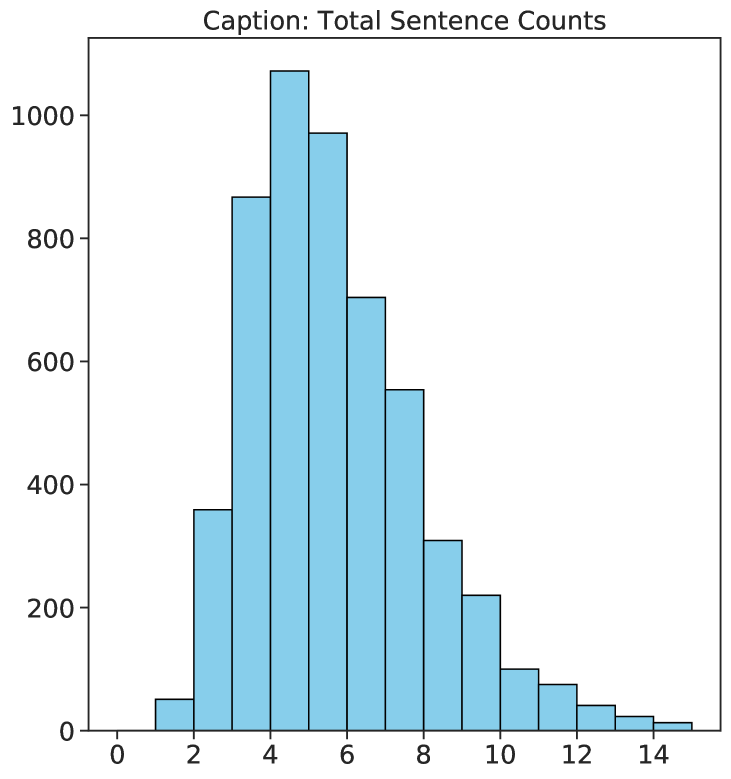
There are in total 5,371 data instances in our dataset, generated from 1,497 OA-PMC articles, with 2,833 uniquely extracted images, as summarized in table 3. The total unique label counts of each level in the original IntAct database as well as our collected dataset is summarized in Table 4. Figure 5(a) shows the histogram of caption word counts of the whole dataset, where the words are tokenized by applying simple NLTK word tokenizer on each caption, and the histogram of sentence counts in a caption is as shown in Figure 5(b). The top-30 frequent words (stop words and punctuation excluded) of the whole dataset are visualized in Figure 5, with lemmatization applied.
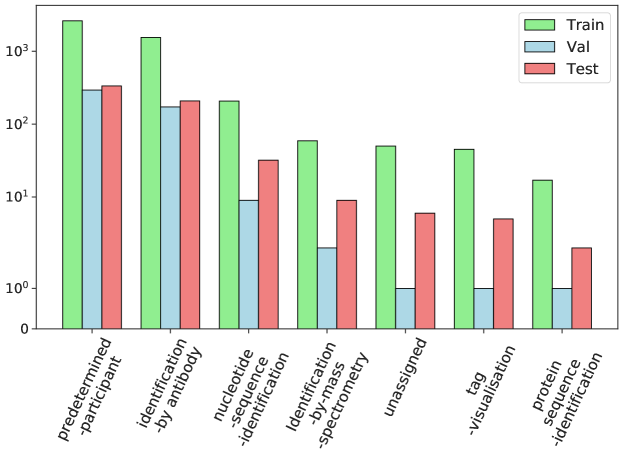
Data Splits. We split the whole dataset into three subsets: train, validation, and test sets, with a ratio of . In order to prevent models from exploiting certain patterns in the same research article to make predictions during the test time, we assure that no data records extracted from the same paper is split into different subsets, i.e. denote id as the paper id from OA-PMC, . Additionally, we ensure that the labels are distributed evenly in the three sets according to the coarse participant method, as illustrated in Figure 6.
3 Benchmark Models
We benchmark several state-of-the-art vision, language and multimodal models against our dataset, that differ primarily by the modalities they encode. Specifically, we consider unimodal models which take either an image (image-only) or a caption (caption-only) as input, and multimodal models that take both. All the output layers for classification are multi-layer perceptrons (MLPs) followed by a softmax layer.
3.1 Unimodal Models
-
•
Image-Only: We adopt a variant of convolutional neural networks, ResNet-101 (He et al. 2016), and initialize the networks with two sets of pretrained weights: (1) ImageNet classification task (Deng et al. 2009), and (2) backbone of Mask R-CNN on object detection task (He et al. 2017). We finetune the final three ResNet blocks (from a total of five), given the consistency of early level features across visual domains (more details in the appendix).
-
•
Caption-Only: We mainly consider the two de-facto variants of language models: LSTM-based (Hochreiter and Schmidhuber 1997), and transformer-based (Vaswani et al. 2017) models. Our LSTM models take input word embeddings from Bio-GloVe (300-d) (Burns, Li, and Peng 2019). For transformer-based models, we consider two state-of-the-art pretrained masked language models (MLM): BERT (Devlin et al. 2019) trained on scientific corpora, dubbed SciBERT (Beltagy, Lo, and Cohan 2019), and RoBERTa (Liu et al. 2019b).
We experiment caption-only models with and without the masked language finetuning on the caption sentences of our dataset, by constructing a corpus where each sentence is a caption from the train and validation sets. We use RoBERTa-large and uncased version of SciBERT to initialize the language models’ weights.
| Modalities | Models | Variants | Par | Int | Par | Int |
|---|---|---|---|---|---|---|
| — | Majority Baseline | — | 55.88 | 63.67 | 48.96 | 23.18 |
| Image-Only | ResNet-101 | init. from ImageNet | 63.84 | 70.24 | 50.87 | 28.50 |
| init. from MSCoCo | 59.52 | 70.07 | 50.35 | 29.20 | ||
| Caption-Only | LSTM w. BioGloVe | — | 59.20 | 68.02 | 49.00 | 35.30 |
| RoBERTa | w/o MLM finetuning | 74.60 | 86.00 | 60.00 | 64.70 | |
| w. MLM finetuning | 75.40 | 88.60 | 63.00 | 67.10 | ||
| SciBERT | w/o MLM finetuning | 76.60 | 86.70 | 62.10 | 65.70 | |
| w. MLM finetuning | 77.70 | 87.00 | 64.90 | 67.10 | ||
| Multi-Modal | NLF | w/o language part MLM finetuning | 76.60 | 88.10 | 61.10 | 67.30 |
| w. language part MLM finetuning | 73.70 | 87.90 | 62.80 | 70.20 | ||
| SAN | w/o language part MLM finetuning | 72.30 | 88.60 | 61.90 | 70.40 | |
| w. language part MLM finetuning | 71.60 | 88.90 | 62.80 | 70.40 | ||
| ViL-BERT | w. MLM | 78.20 | 90.64 | 66.26 | 72.15 | |
| w. MLM & NSP | 78.60 | 90.83 | 65.57 | 72.84 | ||
| w. MLM & NSP & visual-MLM | 76.47 | 90.48 | 64.19 | 71.80 | ||
| VL-BERT | w. MLM | 78.02 | 89.96 | 66.49 | 74.65 | |
| w. MLM & visual-MLM | 77.90 | 89.76 | 65.82 | 74.02 |
3.2 Multimodal Models
-
•
Naive Late Fusion (NLF): The images and captions are encoded by its best performing unimodal models – ResNet (ImageNet weights) and SciBERT respectively, which are then concatenated (late fusion) and fed into MLPs.
- •
-
•
ViL-BERT: Vision-and-Language BERT (Lu et al. 2019), an extension of BERT model which learns a joint visual-and-linguistics representation through co-attentional transformer layers on top of unimodal visual and textual streams. The model has two major proxy pretraining objectives: (1) textual and visual masked learning, where the visual stream requires the model to predict missing masked-out regions of input images (visual-MLM), and (2) image-text alignment prediction, which extends BERT’s next sentence prediction (NSP).
-
•
VL-BERT: As the concurrent work to ViL-BERT, the visual-linguistics BERT model (Su et al. 2020) (VL-BERT) performs the multimodal co-attention in an early fusion manner with a single stream of transformer models. VL-BERT also adopts textual and visual masked learning pretraining objectives, while excluding the image-text multimodal alignment prediction.
The two multimodal BERT models are initialized with the SciBERT pretrained weights directly to their textual parts. For both ViL-BERT and VL-BERT, the visual-MLM leverages region of interests (ROIs) proposed by the object detection module, as well as the predicted class labels with high confidences. Due to significant domain shifts between the pretrained object detectors and our dataset, we experiment inclusion and exclusion of various of their proposed pretraining objectives (mainly concerning the visual masked prediction) when finetuning on our dataset.
3.3 Training Details.
The hyper-parameters for each model are manually tuned against our dataset, and the trained model checkpoints used to evaluate are selected by the best performing ones on the validation set. All models are trained independently for each method type. More details of the hyper-parameters and experimental setups can be found in the appendix.
4 Experiments and Analysis
Our experiments aim to: (1) Benchmark the performances of the baseline models described in the previous section, and (2) compare and analyze how and what these models learn.
Quantitative Results. Table 6 summarizes the model performances on the test set, including the majority baseline that selects the most frequent classes in different label types. All the models, after training on the train set, outperform the majority baseline by large margins, which indicates the sizable training set is effective in transferring knowledge learned from these pretrained models. The image-only models, despite not having indicators of which sub-figure to look at, still surpass the majority baseline, which we hypothesize that the models still learn the salience in the images to make the correct predictions. Both transformer-based caption-only models benefit from the masked language finetuning on our dataset, we hypothesize that such finetuning objective can alleviate severe domain shifts between the original pretraining corpora and our Melinda corpus. Among all the models, the two visual-linguistics multimodal models show the best performances on all types of labels, especially on the fine-grained types (i.e. Par and Int). We believe that when granularity is finer, more subtle complementary multimodal understanding is required. The non-transformer-based multimodal models (NLF and SAN), however, are either on par or worse than the best caption-only models, SciBERT, suggesting that the attention mechanism in transformers may be a substantially better basis for grounding multimodal and complementary information.
The image-only models initialized with classification weights outperforms the one with detection weights, which may hint that the object detectors can be more prone to the common objects seen in their original training datasets. Such hypothesis is also shown in the performance comparisons within the visual-linguistics multimodal models, where they tend to perform better without the visual-MLM objective. However, within ViL-BERT, the multimodal alignment objective shown to be beneficial in most label types. In general, there are still huge gaps between model accuracies and expert human performances (~100% accuracy), especially for the fine-grained types.
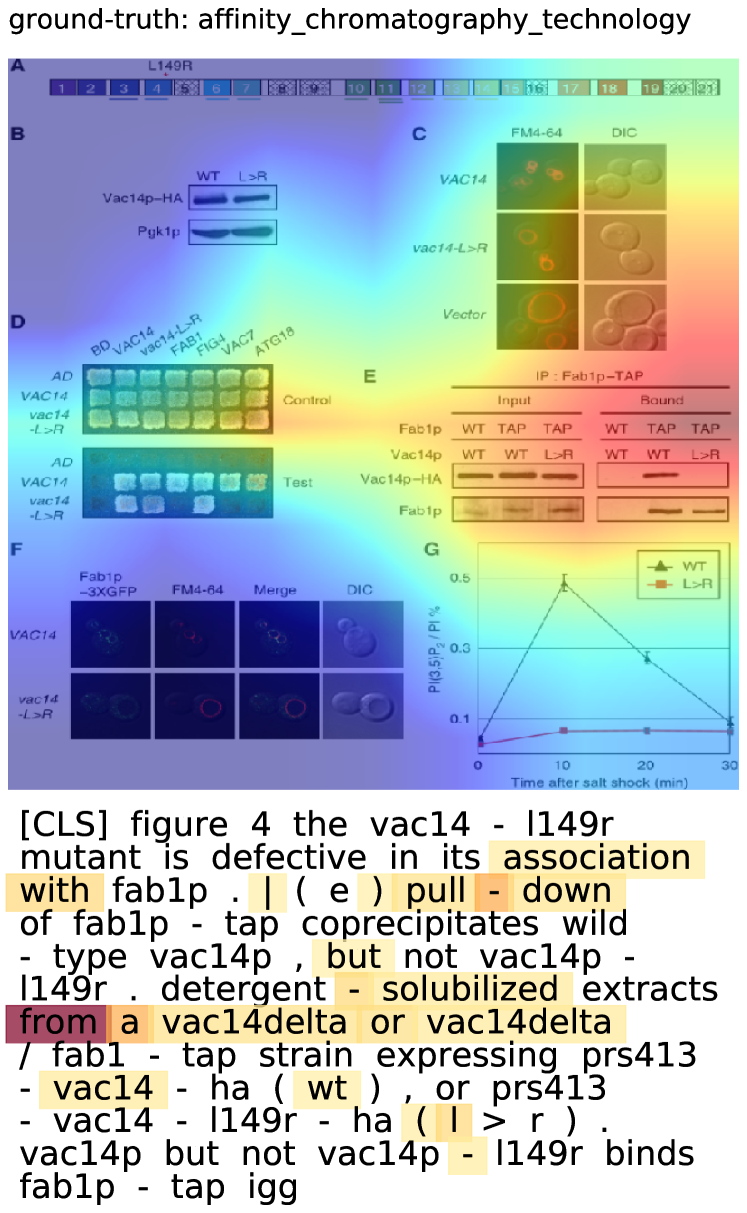
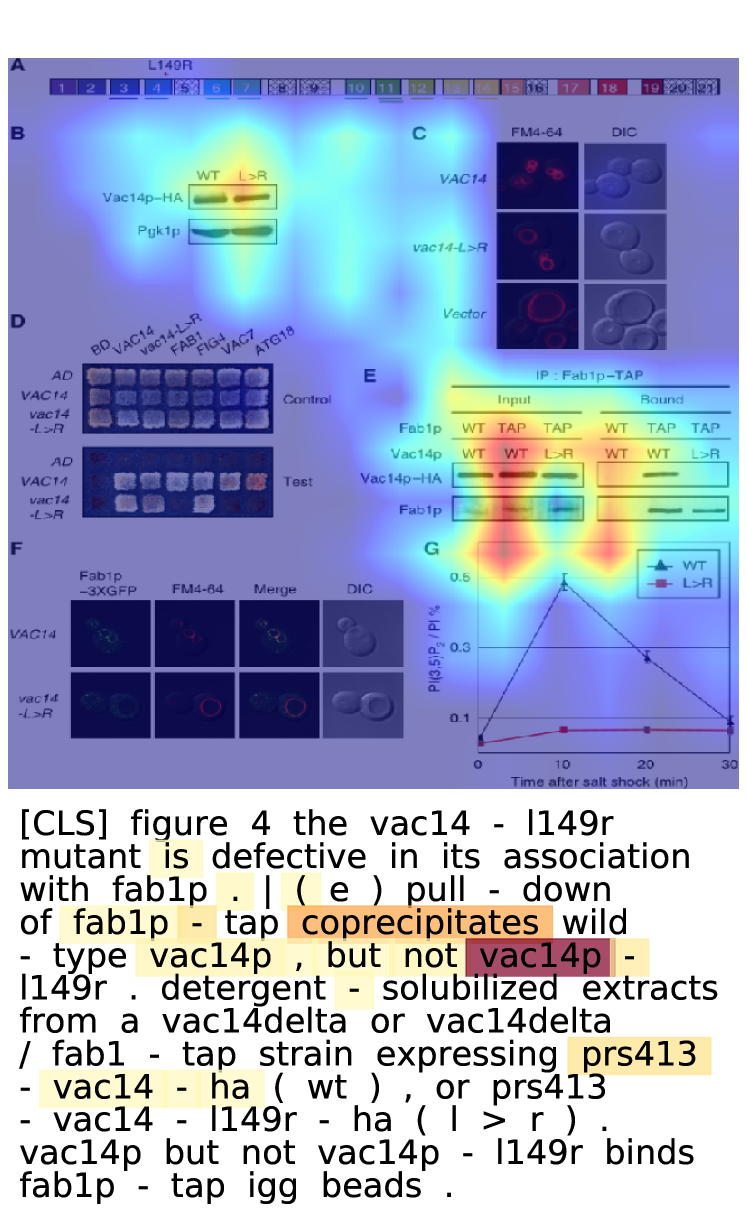
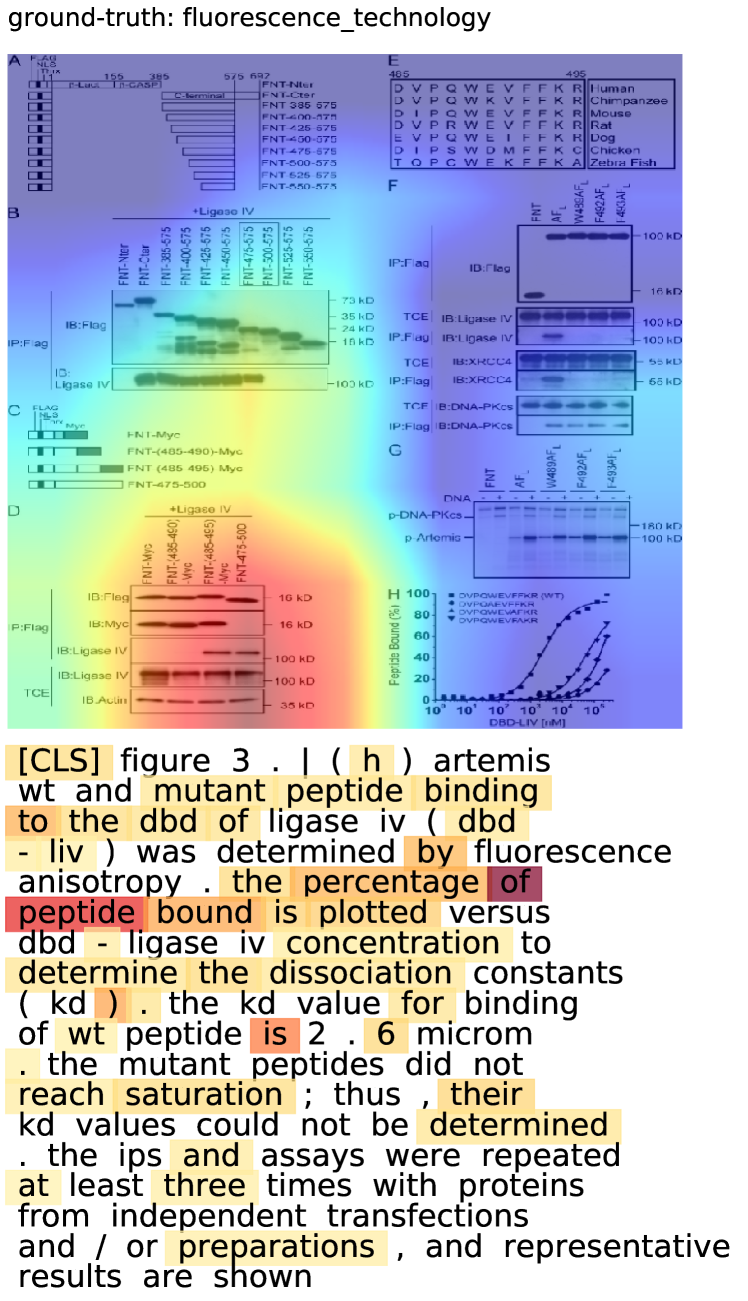
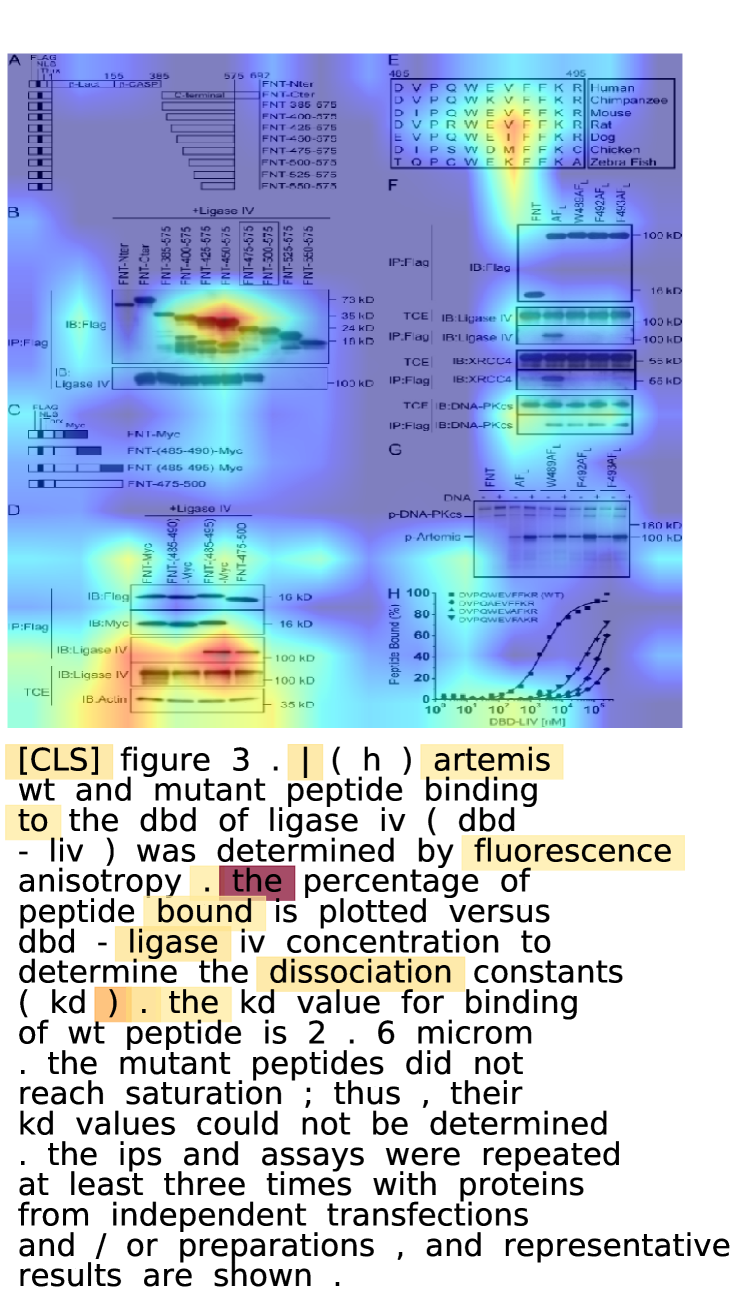
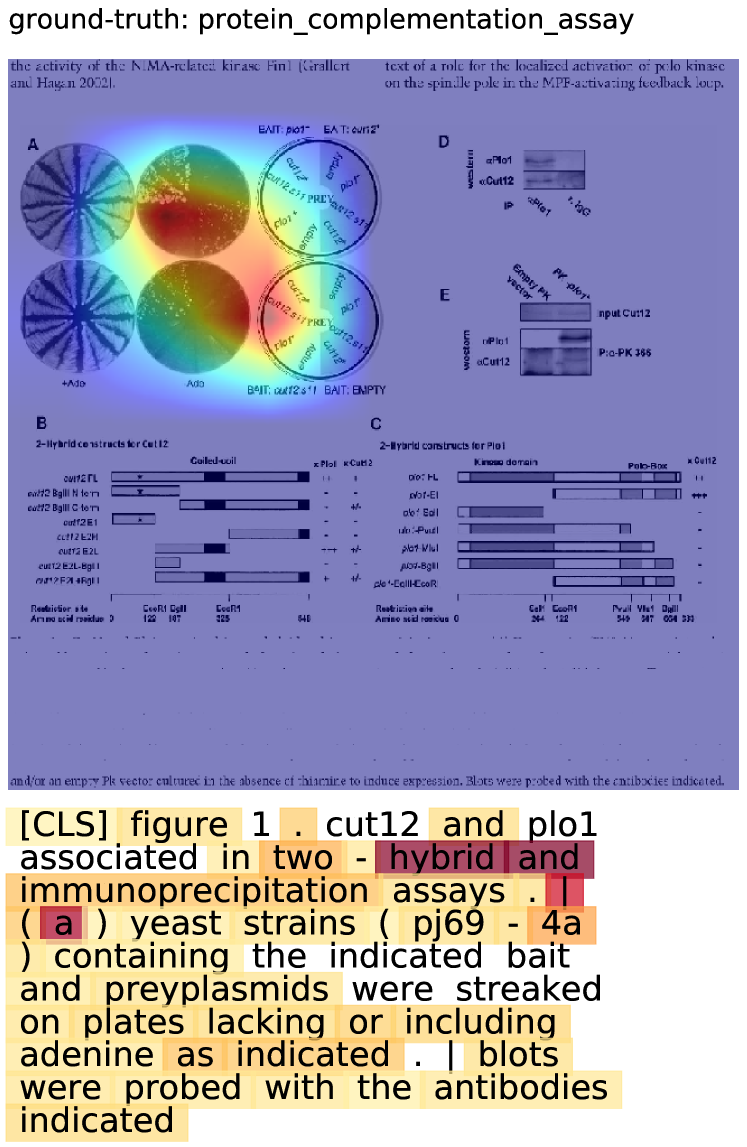
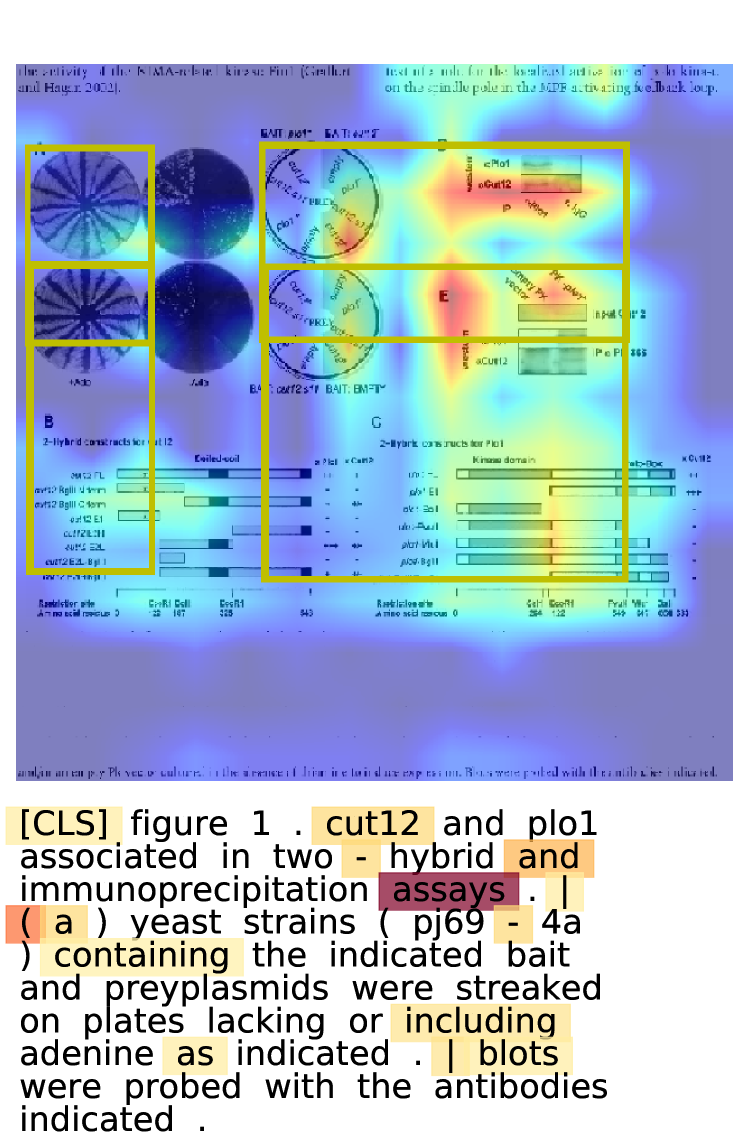
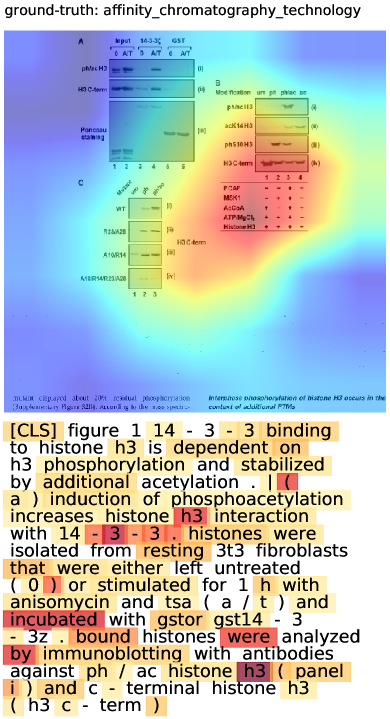
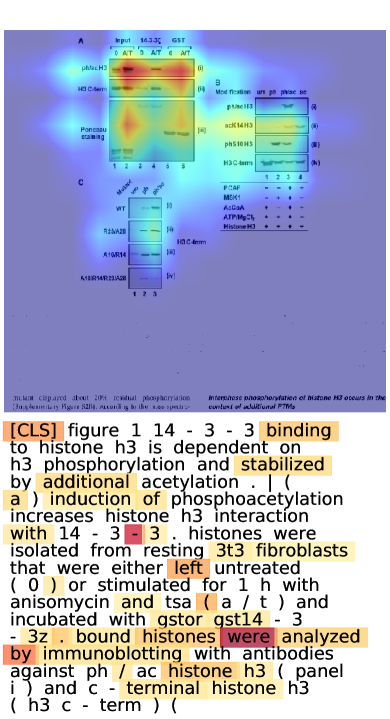
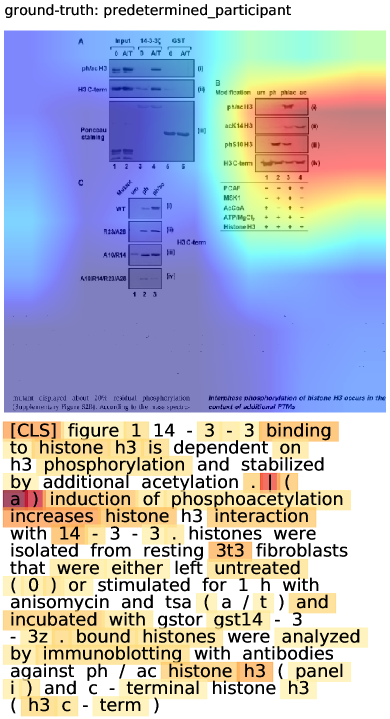
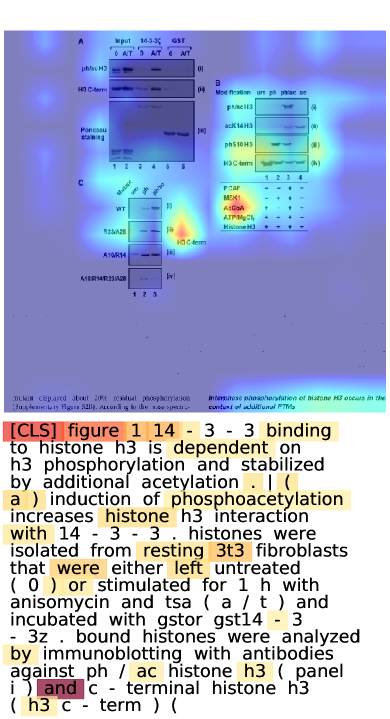
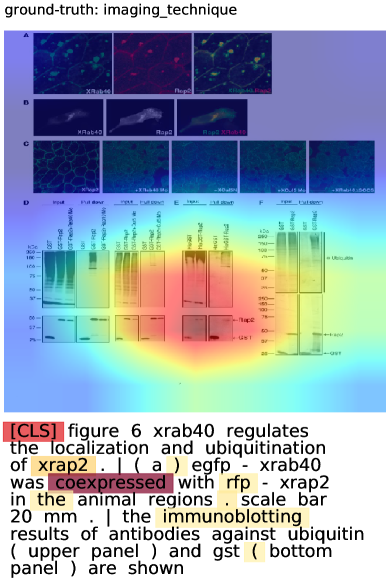
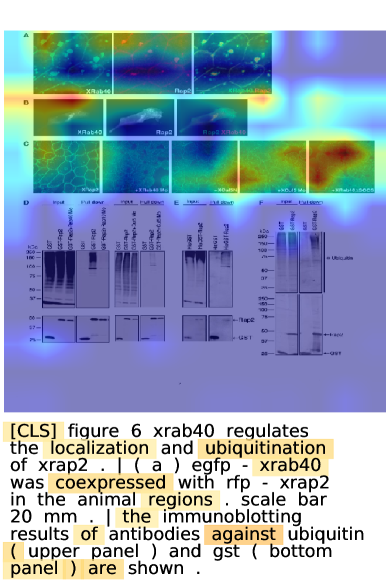
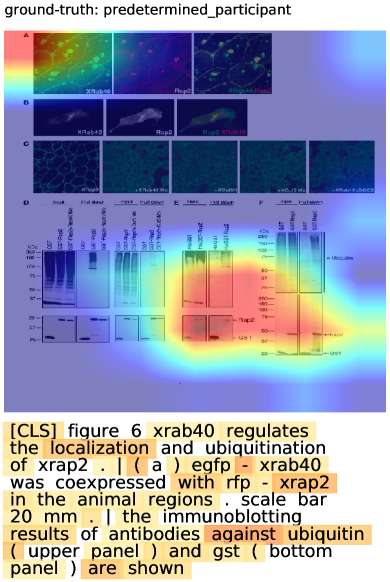
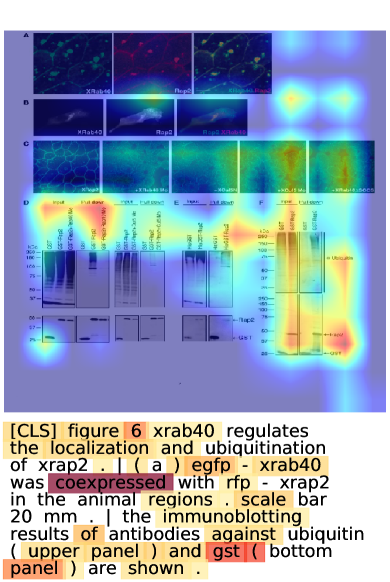
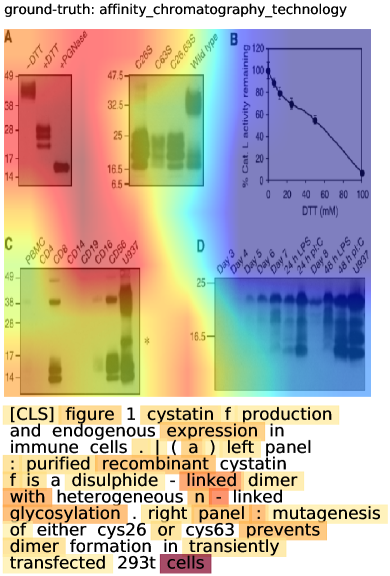
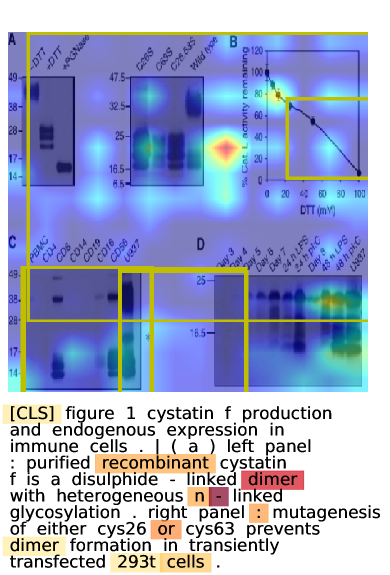
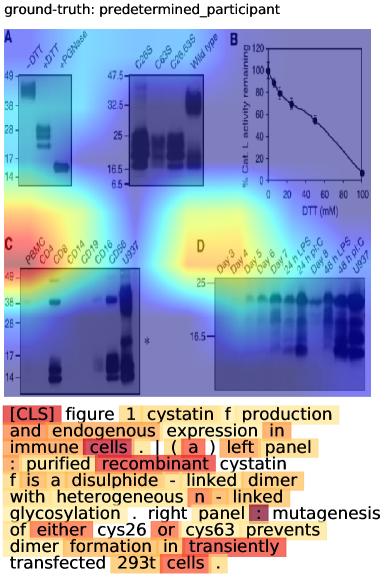
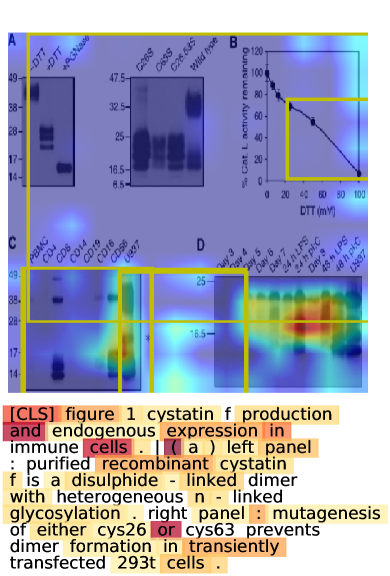
Visualizing What Models Learn. We utilize Grad-CAM (Selvaraju et al. 2017) for visualizing the model salience on the images and SmoothGrad (Smilkov et al. 2017) on the captions. Figure 7 shows a sampled side-by-side comparisons between unimodal models (left) and multimodal models (right) of label type Int. It can be seen that the salience on the images clearly transition from being more dispersed to more detailed and finer-grained from unimodal to multimodal models. Likewise, multimodal models attend less on the common words such as from, and, of, and weight more on domain specific words. The image-only models, without the disambiguation from the captions, tend to focus more on spurious patterns as hinted in the first and second row. While the multimodal models exhibit diverged attentions in the images, it captures the keyword fluorescence that the unimodal language model fails to grasp. The third row of Figure 7 shows a failure case of multimodal models, where both unimodal models focused closer to the ideal regions in their inputs (note the sub-figure identifier ”(a)” in the caption), and hence make the correct predictions. We hypothesize that multimodal models may capture wrong information due to relatively stronger influences by the ROIs proposed by the inherited object detection module (refer to the overlaid yellow-colored ROIs).
5 Related Works
Multimodal Datasets. There are numerous datasets for multimodal machine learning in existence, including visual storytelling (Huang et al. 2016), visual-linguistics reasoning (Johnson et al. 2017; Hasan et al. 2019; Wang et al. 2019; Liu et al. 2020), and multimodal question answering (QA) (Antol et al. 2015; Tapaswi et al. 2016; Kembhavi et al. 2016, 2017; Lei et al. 2018; Yagcioglu et al. 2018; Das et al. 2018; Zellers et al. 2019). As these works focus on more general domains, our work offers a dataset in the hope of motivating research in domains that often require expertise for labelling, such as biomedical.
Experiment Method Classification. The closest prior work (Burns, Li, and Peng 2019) has used the figure captions from OA-PMC set to perform similar experiment method classification task. In our Melinda dataset, we put forth to extract the visual information in conjunctions with the caption texts, and collect a larger-scale dataset.
Automating Biocuration & Biomedical Tasks. Integrating computational approaches into the workflow of biocuration can be seen in many applications such as constructing genomics knowledge base (Baumgartner Jr et al. 2007), biomedical document classification (Cohen 2006; Shatkay, Chen, and Blostein 2006; Jiang et al. 2017; Simon et al. 2019), biomedical text mining (Dowell et al. 2009), and human-in-the-loop curation (Lee et al. 2018). Some prior works also adopt multimodal machine learning for general biomedical information extractions (Schlegl et al. 2015; Eickhoff et al. 2017; Zhang et al. 2017), as well as textual extraction (Burns, Dasigi, and Hovy 2017), medical image captioning (Shin et al. 2016), and automated diagnosis from medical images (Jing, Xie, and Xing 2018; Wang et al. 2018; Liu et al. 2019a).
Our work aims to further facilitate research in automating biocuration by providing a sizeable multimodal dataset, along with the data collection tool. We benchmark various unimodal and multimodal models with analysis on their strengths that suggest potential improvements.
6 Conclusions and Future Work
In this work, we introduce a new multimodal dataset, Melinda, for biomedical experiment method classification. Our dataset comprises extracted image-caption pairs with the associated experiment method labels. As our data is collected in a fully automated distant supervision manner, the dataset is easily expandable.
We benchmark the proposed dataset against various baseline models, including state-of-the-art vision models, language models, and multimodal (visual-linguistics) models. The results show that despite multimodal models generally demonstrate superior performances, there are still huge rooms for improvements in the current visual-linguistics grounding paradigms, especially for domain specific data. Hence, we hope this work could motivate the future advancements in multimodal models, primarily on: (1) low resource domains and better transfer learning. (2) a less-supervised multimodal grounding method with less reliance on robust pretrained object detectors.
7 Acknowledgements
We thank the anonymous reviewers for their feedback, Yu Hou and Nuan Wen for their quality assessment annotations. This work is supported by a National Institutes of Health (NIH) R01 grant (LM012592). The views and conclusions of this paper are those of the authors and do not reflect the official policy or position of NIH.
References
- Antol et al. (2015) Antol, S.; Agrawal, A.; Lu, J.; Mitchell, M.; Batra, D.; Lawrence Zitnick, C.; and Parikh, D. 2015. Vqa: Visual question answering. In Proceedings of the IEEE Conference on Computer Vision and Pattern Recognition (CVPR), 2425–2433.
- Baumgartner Jr et al. (2007) Baumgartner Jr, W. A.; Cohen, K. B.; Fox, L. M.; Acquaah-Mensah, G.; and Hunter, L. 2007. Manual curation is not sufficient for annotation of genomic databases. In Bioinformatics, volume 23, i41–i48. Oxford University Press.
- Beltagy, Lo, and Cohan (2019) Beltagy, I.; Lo, K.; and Cohan, A. 2019. SciBERT: Pretrained Language Model for Scientific Text. In Empirical Methods in Natural Language Processing (EMNLP).
- Ben Abacha et al. (2019) Ben Abacha, A.; Hasan, S. A.; Datla, V. V.; Liu, J.; Demner-Fushman, D.; and Müller, H. 2019. VQA-Med: Overview of the Medical Visual Question Answering Task at ImageCLEF 2019. In CLEF2019 Working Notes, CEUR Workshop Proceedings. Lugano, Switzerland: CEUR-WS.org http://ceur-ws.org.
- Burns et al. (2018) Burns, G.; Shi, X.; Wu, Y.; Cao, H.; and Natarajan, P. 2018. Towards Evidence Extraction: Analysis of Scientific Figures from Studies of Molecular Interactions. In ISWC (Best Workshop Papers), 95–102.
- Burns, Dasigi, and Hovy (2017) Burns, G. A.; Dasigi, P.; and Hovy, E. H. 2017. Extracting evidence fragments for distant supervision of molecular interactions. In BioRxiv, 192856. Cold Spring Harbor Laboratory.
- Burns, Li, and Peng (2019) Burns, G. A.; Li, X.; and Peng, N. 2019. Building deep learning models for evidence classification from the open access biomedical literature. In Database, volume 2019. Narnia.
- Chen et al. (2020) Chen, Y.-C.; Li, L.; Yu, L.; Kholy, A. E.; Ahmed, F.; Gan, Z.; Cheng, Y.; and Liu, J. 2020. Uniter: Learning universal image-text representations. In European Conference on Computer Vision (ECCV).
- Cohen (2006) Cohen, A. M. 2006. An effective general purpose approach for automated biomedical document classification. In AMIA annual symposium proceedings, volume 2006, 161. American Medical Informatics Association.
- Craven, Kumlien et al. (1999) Craven, M.; Kumlien, J.; et al. 1999. Constructing biological knowledge bases by extracting information from text sources. In ISMB, volume 1999, 77–86.
- Das et al. (2018) Das, A.; Datta, S.; Gkioxari, G.; Lee, S.; Parikh, D.; and Batra, D. 2018. Embodied question answering. In Proceedings of the IEEE Conference on Computer Vision and Pattern Recognition (CVPR), 2054–2063.
- Demner-Fushman et al. (2012) Demner-Fushman, D.; Antani, S.; Simpson, M.; and Thoma, G. R. 2012. Design and development of a multimodal biomedical information retrieval system. In Journal of Computing Science and Engineering, volume 6, 168–177. Korean Institute of Information Scientists and Engineers.
- Deng et al. (2009) Deng, J.; Dong, W.; Socher, R.; Li, L.-J.; Li, K.; and Fei-Fei, L. 2009. Imagenet: A large-scale hierarchical image database. In Proceedings of the IEEE Conference on Computer Vision and Pattern Recognition (CVPR), 248–255.
- Devlin et al. (2019) Devlin, J.; Chang, M.-W.; Lee, K.; and Toutanova, K. 2019. BERT: Pre-training of Deep Bidirectional Transformers for Language Understanding. In North American Chapter of the Association for Computational Linguistics (NAACL-HLT), 4171–4186.
- Dowell et al. (2009) Dowell, K. G.; McAndrews-Hill, M. S.; Hill, D. P.; Drabkin, H. J.; and Blake, J. A. 2009. Integrating text mining into the MGI biocuration workflow. In Database, volume 2009. Narnia.
- Eickhoff et al. (2017) Eickhoff, C.; Schwall, I.; García Seco de Herrera, A.; and Müller, H. 2017. Overview of ImageCLEFcaption 2017 - the Image Caption Prediction and Concept Extraction Tasks to Understand Biomedical Images. In CLEF (Working Notes), CEUR Workshop Proceedings. Dublin, Ireland: CEUR-WS.org http://ceur-ws.org.
- Gururangan et al. (2020) Gururangan, S.; Marasović, A.; Swayamdipta, S.; Lo, K.; Beltagy, I.; Downey, D.; and Smith, N. A. 2020. Don’t Stop Pretraining: Adapt Language Models to Domains and Tasks. arXiv preprint arXiv:2004.10964 .
- Hasan et al. (2019) Hasan, M. K.; Rahman, W.; Zadeh, A.; Zhong, J.; Tanveer, M. I.; Morency, L.-P.; et al. 2019. UR-FUNNY: A multimodal language dataset for understanding humor. In Empirical Methods in Natural Language Processing (EMNLP).
- He et al. (2017) He, K.; Gkioxari, G.; Dollár, P.; and Girshick, R. 2017. Mask r-cnn. In International Conference on Computer Vision (ICCV), 2961–2969.
- He et al. (2016) He, K.; Zhang, X.; Ren, S.; and Sun, J. 2016. Deep residual learning for image recognition. In Proceedings of the IEEE Conference on Computer Vision and Pattern Recognition (CVPR), 770–778.
- He et al. (2020) He, X.; Zhang, Y.; Mou, L.; Xing, E.; and Xie, P. 2020. PathVQA: 30000+ Questions for Medical Visual Question Answering. arXiv preprint arXiv:2003.10286 .
- Hochreiter and Schmidhuber (1997) Hochreiter, S.; and Schmidhuber, J. 1997. Long short-term memory. In Neural computation, volume 9, 1735–1780. MIT Press.
- Huang et al. (2016) Huang, T.-H.; Ferraro, F.; Mostafazadeh, N.; Misra, I.; Agrawal, A.; Devlin, J.; Girshick, R.; He, X.; Kohli, P.; Batra, D.; et al. 2016. Visual storytelling. In North American Chapter of the Association for Computational Linguistics (NAACL-HLT), 1233–1239.
- ISB (2018) ISB. 2018. Biocuration: Distilling data into knowledge. In PLOS Biology, volume 16, 1–8. Public Library of Science. doi:10.1371/journal.pbio.2002846. URL https://doi.org/10.1371/journal.pbio.2002846.
- Jiang et al. (2017) Jiang, X.; Ringwald, M.; Blake, J.; and Shatkay, H. 2017. Effective biomedical document classification for identifying publications relevant to the mouse Gene Expression Database (GXD). In Database, volume 2017. Narnia.
- Jing, Xie, and Xing (2018) Jing, B.; Xie, P.; and Xing, E. 2018. On the Automatic Generation of Medical Imaging Reports. In Association for Computational Linguistics (ACL), 2577–2586. Melbourne, Australia: Association for Computational Linguistics. doi:10.18653/v1/P18-1240.
- Johnson et al. (2017) Johnson, J.; Hariharan, B.; van der Maaten, L.; Fei-Fei, L.; Lawrence Zitnick, C.; and Girshick, R. 2017. Clevr: A diagnostic dataset for compositional language and elementary visual reasoning. In Proceedings of the IEEE Conference on Computer Vision and Pattern Recognition (CVPR), 2901–2910.
- Kembhavi et al. (2016) Kembhavi, A.; Salvato, M.; Kolve, E.; Seo, M.; Hajishirzi, H.; and Farhadi, A. 2016. A diagram is worth a dozen images. In European Conference on Computer Vision (ECCV), 235–251. Springer.
- Kembhavi et al. (2017) Kembhavi, A.; Seo, M.; Schwenk, D.; Choi, J.; Farhadi, A.; and Hajishirzi, H. 2017. Are you smarter than a sixth grader? textbook question answering for multimodal machine comprehension. In Proceedings of the IEEE Conference on Computer Vision and Pattern Recognition (CVPR), 4999–5007.
- Krishna et al. (2017) Krishna, R.; Zhu, Y.; Groth, O.; Johnson, J.; Hata, K.; Kravitz, J.; Chen, S.; Kalantidis, Y.; Li, L.-J.; Shamma, D. A.; et al. 2017. Visual genome: Connecting language and vision using crowdsourced dense image annotations. International Journal of Computer Vision (IJCV) 123(1): 32–73.
- Lee et al. (2018) Lee, K.; Famiglietti, M. L.; McMahon, A.; Wei, C.-H.; MacArthur, J. A. L.; Poux, S.; Breuza, L.; Bridge, A.; Cunningham, F.; Xenarios, I.; et al. 2018. Scaling up data curation using deep learning: An application to literature triage in genomic variation resources. In PLoS computational biology, volume 14, e1006390. Public Library of Science.
- Lei et al. (2018) Lei, J.; Yu, L.; Bansal, M.; and Berg, T. L. 2018. Tvqa: Localized, compositional video question answering. In Empirical Methods in Natural Language Processing (EMNLP).
- Li et al. (2019) Li, L. H.; Yatskar, M.; Yin, D.; Hsieh, C.-J.; and Chang, K.-W. 2019. Visualbert: A simple and performant baseline for vision and language. arXiv preprint arXiv:1908.03557 .
- Liu et al. (2020) Liu, J.; Chen, W.; Cheng, Y.; Gan, Z.; Yu, L.; Yang, Y.; and Liu, J. 2020. VIOLIN: A Large-Scale Dataset for Video-and-Language Inference. In Proceedings of the IEEE Conference on Computer Vision and Pattern Recognition (CVPR).
- Liu et al. (2019a) Liu, S.; Ou, X.; Che, J.; Zhou, X.; and Ding, H. 2019a. An Xception-GRU Model for Visual Question Answering in the Medical Domain. CLEF (Working Notes) .
- Liu et al. (2019b) Liu, Y.; Ott, M.; Goyal, N.; Du, J.; Joshi, M.; Chen, D.; Levy, O.; Lewis, M.; Zettlemoyer, L.; and Stoyanov, V. 2019b. Roberta: A robustly optimized bert pretraining approach. arXiv preprint arXiv:1907.11692 .
- Lu et al. (2019) Lu, J.; Batra, D.; Parikh, D.; and Lee, S. 2019. Vilbert: Pretraining task-agnostic visiolinguistic representations for vision-and-language tasks. In Advances in Neural Information Processing Systems (NeurIPS), 13–23.
- Mintz et al. (2009) Mintz, M.; Bills, S.; Snow, R.; and Jurafsky, D. 2009. Distant supervision for relation extraction without labeled data. In Proceedings of the Joint Conference of the 47th Annual Meeting of the ACL and the 4th International Joint Conference on Natural Language Processing of the AFNLP, 1003–1011.
- Mohan et al. (2018) Mohan, S.; Fiorini, N.; Kim, S.; and Lu, Z. 2018. A fast deep learning model for textual relevance in biomedical information retrieval. In Proceedings of the 2018 World Wide Web Conference, 77–86.
- Nguyen et al. (2019) Nguyen, B. D.; Do, T.-T.; Nguyen, B. X.; Do, T.; Tjiputra, E.; and Tran, Q. D. 2019. Overcoming Data Limitation in Medical Visual Question Answering. In International Conference on Medical Image Computing and Computer-Assisted Intervention (MICCAI). Springer.
- Orchard et al. (2013) Orchard, S.; Ammari, M.; Aranda, B.; Breuza, L.; Briganti, L.; Broackes-Carter, F.; Campbell, N. H.; Chavali, G.; Chen, C.; Del-Toro, N.; et al. 2013. The MIntAct project—IntAct as a common curation platform for 11 molecular interaction databases. Nucleic Acids Research (NAR) 42(D1): D358–D363.
- Schlegl et al. (2015) Schlegl, T.; Waldstein, S. M.; Vogl, W.-D.; Schmidt-Erfurth, U.; and Langs, G. 2015. Predicting semantic descriptions from medical images with convolutional neural networks. In International Conference on Information Processing in Medical Imaging (IPMI), 437–448. Springer.
- Selvaraju et al. (2017) Selvaraju, R. R.; Cogswell, M.; Das, A.; Vedantam, R.; Parikh, D.; and Batra, D. 2017. Grad-cam: Visual explanations from deep networks via gradient-based localization. In International Conference on Computer Vision (ICCV), 618–626.
- Shatkay, Chen, and Blostein (2006) Shatkay, H.; Chen, N.; and Blostein, D. 2006. Integrating image data into biomedical text categorization. In Bioinformatics, volume 22, e446–e453. Oxford University Press.
- Shin et al. (2016) Shin, H.-C.; Roberts, K.; Lu, L.; Demner-Fushman, D.; Yao, J.; and Summers, R. M. 2016. Learning to read chest x-rays: Recurrent neural cascade model for automated image annotation. In Proceedings of the IEEE Conference on Computer Vision and Pattern Recognition (CVPR), 2497–2506.
- Simon et al. (2019) Simon, C.; Davidsen, K.; Hansen, C.; Seymour, E.; Barnkob, M. B.; and Olsen, L. R. 2019. BioReader: a text mining tool for performing classification of biomedical literature. In BMC bioinformatics, volume 19, 57. Springer.
- Smilkov et al. (2017) Smilkov, D.; Thorat, N.; Kim, B.; Viégas, F.; and Wattenberg, M. 2017. Smoothgrad: removing noise by adding noise. In International Conference on Machine Learning (ICML). Workshop on Visualization for Deep Learning.
- Su et al. (2020) Su, W.; Zhu, X.; Cao, Y.; Li, B.; Lu, L.; Wei, F.; and Dai, J. 2020. Vl-bert: Pre-training of generic visual-linguistic representations. In International Conference on Learning Representations (ICLR).
- Tapaswi et al. (2016) Tapaswi, M.; Zhu, Y.; Stiefelhagen, R.; Torralba, A.; Urtasun, R.; and Fidler, S. 2016. Movieqa: Understanding stories in movies through question-answering. In Proceedings of the IEEE Conference on Computer Vision and Pattern Recognition (CVPR), 4631–4640.
- Vaswani et al. (2017) Vaswani, A.; Shazeer, N.; Parmar, N.; Uszkoreit, J.; Jones, L.; Gomez, A. N.; Kaiser, Ł.; and Polosukhin, I. 2017. Attention is all you need. In Advances in Neural Information Processing Systems (NeurIPS), 5998–6008.
- Wang et al. (2019) Wang, W.; Wang, Y.; Chen, S.; and Jin, Q. 2019. YouMakeup: A Large-Scale Domain-Specific Multimodal Dataset for Fine-Grained Semantic Comprehension. In Proceedings of the 2019 Conference on Empirical Methods in Natural Language Processing and the 9th International Joint Conference on Natural Language Processing (EMNLP-IJCNLP), 5136–5146.
- Wang et al. (2018) Wang, X.; Peng, Y.; Lu, L.; Lu, Z.; and Summers, R. M. 2018. Tienet: Text-image embedding network for common thorax disease classification and reporting in chest x-rays. In Proceedings of the IEEE Conference on Computer Vision and Pattern Recognition (CVPR), 9049–9058.
- Yagcioglu et al. (2018) Yagcioglu, S.; Erdem, A.; Erdem, E.; and Ikizler-Cinbis, N. 2018. Recipeqa: A challenge dataset for multimodal comprehension of cooking recipes. In Empirical Methods in Natural Language Processing (EMNLP).
- Yang et al. (2016) Yang, Z.; He, X.; Gao, J.; Deng, L.; and Smola, A. 2016. Stacked attention networks for image question answering. In Proceedings of the IEEE Conference on Computer Vision and Pattern Recognition (CVPR), 21–29.
- Yosinski et al. (2014) Yosinski, J.; Clune, J.; Bengio, Y.; and Lipson, H. 2014. How transferable are features in deep neural networks? In Advances in Neural Information Processing Systems (NeurIPS), 3320–3328.
- Zellers et al. (2019) Zellers, R.; Bisk, Y.; Farhadi, A.; and Choi, Y. 2019. From recognition to cognition: Visual commonsense reasoning. In Proceedings of the IEEE Conference on Computer Vision and Pattern Recognition (CVPR), 6720–6731.
- Zhang et al. (2017) Zhang, Z.; Chen, P.; Sapkota, M.; and Yang, L. 2017. Tandemnet: Distilling knowledge from medical images using diagnostic reports as optional semantic references. In International Conference on Medical Image Computing and Computer-Assisted Intervention (MICCAI), 320–328. Springer.
Appendix A More on The Melinda Dataset
A.1 All Label Types
The descriptions of the experiment method labels featured in our Melinda dataset, across all levels of the two categories, can be referred to from the original IntAct database888https://www.ebi.ac.uk/ols/ontologies/mi, specifically for participant identification999https://www.ebi.ac.uk/ols/ontologies/mi/terms?iri=http“%3A“%2F“%2Fpurl.obolibrary.org“%2Fobo“%2FMI˙0002“&viewMode=All&siblings=false method types, and interaction detection101010https://www.ebi.ac.uk/ols/ontologies/mi/terms?iri=http“%3A“%2F“%2Fpurl.obolibrary.org“%2Fobo“%2FMI˙0001“&viewMode=All“&siblings=false method types. In our full release of the Melinda dataset, we also include a .tsv file for the hierarchical mappings among the coarse and fine label types.
A.2 Details of Sub-Caption Segmentation
Segmentation
In general, we try to segment the sub-captions as systematically as possible. There are compound sub-figure identifiers that can refer to multiple sub-figures at once, e.g. ”(A,C)” or e.g. ”(A-D)” will represent sub-figure ”A” and ”C”, and sub-figures ”A” to ”D”, respectively. In these cases, we will assign the sentences to each of these detected (or inferred, in the ”(A-D)” case) sub-figure identifiers. The opening common is usually well-preserved, while the closing common may inevitably contain some information dedicated to the last mentioned identifier. In order to eliminate the risk of potential information loss caused by excluding the closing common texts, we compromise to this heuristic to include the last few sentences.
Preprocessing
We also conduct preprocessing and text cleansing during the sub-caption segmentation. The extracted word blocks sometimes contain dashed words where the dash is inserted among a single word due to the line change in PDF articles. We replace these dashes by checking if the word with the dash removed exists in a common English dictionary. For those words that do not exist, we simply preserve the dash within the words. We also run spell checkers to ensure spellings for common English words are correct as much as possible.
A.3 More Exemplar Data Points
Experiment Method Labels
Par(coarse) : unassigned
Par(fine) : experimental
participant
Int(coarse) : biophysical
Int(fine) : molecular
sieving
Experiment Method Labels
Par(coarse) : identification
by antibody
Par(fine) : anti-tag
western
Int(coarse) : affinity
chromatography
Int(fine) : anti-tag
coip

Experiment Method Labels
Par(coarse) : nucleotide
sequence
Par(fine) : southern
blot
Int(coarse) : cross-linking
study
Int(fine) : cross-link
Experiment Method Labels
Par(coarse) : identification
by antibody
Par(fine) : anti-tag
western
Int(coarse) : affinity
chromatography
Int(fine) : anti-tag
coip
We provide more random sampled exemplar data for a more diverse visual preview of our dataset in Figure 8.
Expert Justifications of Requirements of Multimodality: As discussed in the third paragraph of the introduction in Section 1, different experiment methods can generate visually similar figures, while captions can disambiguate them. Oppositely, captions alone do not necessarily determine the visual presentation to be of specific types. Specifically, for the IntAct database used as distant supervision to construct our dataset, in the IntAct curation annotation manual111111https://www.ebi.ac.uk/~intact/site/doc/IntActCurationManual2016.pdf?conversationContext=1 page 5, the storage schema implies at the experiment level curators are required to look at the paper figures. And in page 9, the example term ”From Fig 7…” indicates that curators are expected to interpret both the figures and captions for labelling. There are similar examples throughout the manual, which are verified by an expert in the biomedical field.
Sample Human Estimations: There are various cues that a human expert would likely to focus on when determining the experiment method labels. For example, for the label identification-by-antibody, the presence of specific bands in a blot diagram corresponding to the precise molecular weight of the named antibody in the captions, would be the key features to look for, as hinted in Figure 8 right sides. We also hereby provide an expert point of view of how to infer the experiment method labels from the given multimodal inputs. In Figure 8 bottom right, the caption says ”(C) Colocalization of HDAC1-EGFP…” and the figure clearly shows fluorescent images. The statement colocalization should, but does not necessarily determine that figures will be of specific types. The presentation of cell-level colabeling images provides enormously more context than that found in the caption. Thus the visual appearance of figures is an important signal for scientists, and the captions usually provide abbreviated crucial descriptions of the methods used.
A.4 Label Distributions
As hinted by Figure 6, the label distribution in the original IntAct records is imbalanced, which very likely resemble the real world distribution of the experimental protocols being conducted. This could pose challenges and inspire interesting future directions in machine learning models on tackling these domain specific areas. Our non-processed raw data has the label distribution on the Par(Coarse) label type shown in Table 7 (The shown numbers are of label-count percentages). We would also like to point out that the finer-grained classes, such as Int(Fine) have more even distribution. Since there are in total 85 classes for Int(Fine), we hereby show the mean and the standard deviations of the label-count percentages, which are: mean/std = 1.18/3.50 as compared to 14.29/21.18 of 7 classes in Par(Coarse). On the other hand, we also show in Table 6 the performances of the majority baselines (always predicting the majority class) are significantly worse than the best performing models, which implies proper training could potentially still yield good performances on the current data distributions. We do hope to expand our dataset to an even larger-scaled and possibly more balanced one when more publicly available articles are added to the OA-PMC set, particularly for the labels that are on the lower amount spectrum.
| Label | Count (%) |
|---|---|
| predetermined-participant | 58.96 |
| identification-by-antibody | 33.63 |
| nucleotide-sequence-identification | 4.56 |
| Identification-by-mass-spectrometry | 1.02 |
| unassigned | 0.61 |
| tag-visualisation | 0.94 |
| protein-sequence-identification | 0.28 |
Appendix B More Details on Experiments
B.1 Model & Training Details
All the benchmarked models are trained on a single Nvidia GeForce 2080Ti GPU121212https://www.nvidia.com/en-us/geforce/graphics-cards/rtx-2080-ti/ on a CentOS 7 operating system. The hyper-parameters for each model are manually tuned against our dataset, and the trained model checkpoints used to evaluate are selected by the best performing ones on the validation set. All the models are individually trained for each type of the labels.
The implementations of the transformer-based caption-only models are extended from the huggingface131313https://github.com/huggingface/transformers code base, which are implemented in PyTorch141414https://pytorch.org/. The image-only models and their pretrained weights are borrowed from torchvision151515https://github.com/pytorch/vision and the official Mask-RCNN implementations from Facebook AI Research161616https://github.com/facebookresearch/detectron2. Note that we are just using the pretrained weights to initialize only the CNN part, i.e. we are not using the ROI pooled features, so in our image-only models, no region proposal network (RPN) is used. Implementations for both VL-BERT and ViL-BERT are adapted from the original author-released code repositories, which can be found in their papers.
Visual-MLM
For the masked image ROI region classification or masked visual token modeling in VL-BERT and ViL-BERT, dubbed as visual-MLM in this paper, we use the authors’ original public repositories for obtaining the region labels in the proposed ROIs in the images. Since the two repositories both generally adopt detectron2 module from Facebook AI Research, the label space comes from the Visual Genome (Krishna et al. 2017) object categories, which has 1,600 total number of class labels, plus one indicating the background class.
Hyper-parameters
| Modalities | Models | Batch Size | Initial LR | # Training Epochs | Gradient Accu- | # Params |
| mulation Steps | ||||||
| Image-Only | ResNet101 init. from ImageNet | 16 | 20 | - | 44.5M | |
| ResNet101 init. from MSCoCo | 16 | 20 | - | 44.5M | ||
| Caption-Only | LSTM w. BioGlove | 4 | 4 | 1 | 5.4M | |
| RoBERTa-Large | 4 | 4 | 2 | 355.4M | ||
| SciBERT-Base-Uncased | 4 | 4 | 2 | 109.9M | ||
| Multi-Modal | Naive Late Fusion (NLF) | 4 | 4 | 2 | 126.5M | |
| Stacked Attention Network (SAN) | 4 | 4 | 2 | 130.8M | ||
| ViL-BERT (w. MLM) | 8 | 20 | 1 | 171.2M | ||
| ViL-BERT (w. MLM & NSP) | 8 | 20 | 1 | 171.2M | ||
| ViL-BERT ((w. MLM & NSP & visual-MLM) | 8 | 20 | 1 | 171.2M | ||
| VL-BERT (w. MLM) | 4 | 20 | 4 | 155.6M | ||
| VL-BERT (w. MLM & visual-MLM) | 2 | 20 | 4 | 155.6M |
| Modalities | Models | Batch Size | Initial LR | # Training Epochs | Gradient Accu- |
|---|---|---|---|---|---|
| mulation Steps | |||||
| Caption-Only | RoBERTa-Large | 4 | 50 | 1 | |
| SciBERT-Base-Uncased | 4 | 50 | 1 | ||
| Multi-Modal | ViL-BERT (w. MLM) | 8 | 20 | 1 | |
| ViL-BERT (w. MLM & NSP) | 8 | 20 | 1 | ||
| ViL-BERT (w. MLM & NSP & visual-MLM) | 8 | 20 | 1 | ||
| VL-BERT (w. MLM) | 4 | 20 | 4 | ||
| VL-BERT (w. MLM & visual-MLM) | 2 | 20 | 4 |
| Type | Batch Size | Initial LR | # Training Epochs | Gradient Accumulation Steps |
|---|---|---|---|---|
| Bound (lower–upper) | 2–16 | – | 3–50 | 1–4 |
| Number of Trials | 2–4 | 2–3 | 2–4 | 1–2 |
For image-only models and caption-only models, it takes roughly 2-4 hours to train for the number of epochs specified in Table 8. For NLF and SAN models, it takes approximately 4 hours to train. For the two visual-linguistics models, it takes roughly 6-8 hours to train including the finetuning on experiment classification phases. Since some of the baseline models incorporate finetuning on our Melinda corpus, we also list the hyperparameters such phase of training uses in Table 9. We also include the search bounds and number of trials in Table 10, all of our models adopt the same search bounds and the same ranges of trials.
For long captions in the dataset, we generally truncate it with maximum number of tokens (BPE or wordpiece tokens) .
Vision Models
As mentioned in Section 3, the benchmark models section, we only finetune the later layers in ResNet-101, due to the observations that the features in early CNN layers are generally shared across different visual domains (Yosinski et al. 2014). We also empirically verify that finetuning all the layers does not yield significant improvements.
Validation Results
We also include the model performances on the validation set, where we select each of the best performing models to evaluate on the unseen test set. The comprehensive results can be found in Table 11.
| Modalities | Models | Variants | Par | Int | Par | Int |
|---|---|---|---|---|---|---|
| — | Majority Baseline | — | 62.36 | 63.02 | 57.68 | 22.04 |
| Image-Only | ResNet-101 | init. from ImageNet | 68.52 | 70.98 | 58.56 | 24.07 |
| init. from MSCoCo | 64.73 | 69.42 | 56.02 | 26.15 | ||
| Caption-Only | LSTM w. BioGloVe | — | 64.37 | 66.82 | 58.35 | 33.41 |
| RoBERTa | w/o MLM finetuning | 78.20 | 81.50 | 65.70 | 60.36 | |
| w. MLM finetuning | 77.73 | 83.74 | 67.04 | 61.47 | ||
| SciBERT | w/o MLM finetuning | 77.30 | 86.40 | 62.10 | 65.70 | |
| w. MLM finetuning | 74.17 | 86.19 | 65.70 | 58.13 | ||
| Multi-Modal | NLF | w/o language part MLM finetuning | 75.95 | 86.90 | 67.04 | 58.80 |
| w. language part MLM finetuning | 75.49 | 87.08 | 65.92 | 61.02 | ||
| SAN | w/o language part MLM finetuning | 77.70 | 86.90 | 67.48 | 59.69 | |
| w. language part MLM finetuning | 74.60 | 87.50 | 65.92 | 59.47 | ||
| ViL-BERT | w. MLM | 72.83 | 85.97 | 65.92 | 63.25 | |
| w. MLM & NSP | 75.28 | 86.86 | 62.36 | 63.03 | ||
| w. MLM & NSP & visual-MLM | 73.05 | 87.31 | 61.69 | 63.03 | ||
| VL-BERT | w. MLM | 76.05 | 87.52 | 66.91 | 67.48 | |
| w. MLM & visual-MLM | 75.49 | 87.19 | 65.52 | 66.86 |
B.2 More Attention Visualizations
 |
 |
 |
 |
 |
 |
 |
 |
 |
 |
 |
 |
| Image-only & Text-only | Multimodal | Image-only & Text-only | Multimodal |
| (a) Interaction (Coarse) | (b) Participant (Coarse) | ||
As an extension to Figure 7 in the main paper, we provide additional visualization examples for a more in-depth look into what models have learned in Figure 9. Similar trends are observed in both Figure 9 and Figure 7, and we also provide the proposed ROIs from the object detection module in the third row where the multimodal model fails in the coarse interaction label type.
Additionally, in order to further quantify how models attend differently with different modalities of inputs, we examine 20 randomly sampled data instances from the test set. We find that among which there were 13 times (65%) that the multimodal models attended on the correct sub-figures, while image-only models only had 9 times (45%). The difference between them is roughly the same as those results shown in Table 6 for the coarse-grained label types.
B.3 Top-30 attended tokens
For a more in-depth understanding of what models learn from different modalities, we are interested in an overview of distributional shifts of attended words across unimodal language models and the language streams in the multimodal models. For each caption in the test set, we obtain the top-20 attended tokens by applying SmoothGrad (Smilkov et al. 2017), and then aggregate the results of every captions in the test set as an overall top-attended-token-count histogram. The results for the two types of coarse-grained labels are visualized in Figure 10. One can see that multimodal models (blue regions) tend to focus on more label-type-specific words, such as interaction in Figure 10(b).
Denote the frequency of a token in a dataset as , the average relative changes of the top- attended tokens transitioning from participant to interaction label types is computed by: . Following this computation, the general trend of unimodal (language) models do not change much (the two red regions) by a 21.8 of relative changes, while it is shown that multimodal models are more susceptible to the salient decisive tokens that they exhibit relative changes by a larger margin of 33.4.
Similarly, we also visualize the top-30 attended tokens for the two finer grained labels, as shown in Figure 11. We find that, similar to the coarse labels, unimodal language models share similar distributional trends across the participant and interaction types, while multimodal models are more susceptible to label types. The computed quantitative relative changes between the two finer-grained sets, are 30.2 and 28.1 for the multimodal models and unimodal models respectively. For the fine-grained sets, the two relative changes are not differ by a large margin, which we hypothesize that the fine-grained sets are substantially harder for both multimodal and unimodal models to perform well.
Appendix C Releases
The full dataset along with its documentation will be released in a timely manner. We will release the cleaned code repository which encompasses the majority of the codes used to generate the experimental results in this paper. The repository will also include codes for the VL-BERT model, adapted from the original publicly available repository, for exemplifying how we adapt the existing models to our dataset and setups. We will also release our distantly supervised data collection tool (all components of the three main steps in our data collection pipeline), with well documented guidelines of usages. We hope by sharing these tools, more interest could be gained into developing better multimodal models especially for traditionally low resource areas such as biomedical domains.