Automated Scoring of Nuclear Pleomorphism Spectrum with Pathologist-level Performance in Breast Cancer
Abstract
Nuclear pleomorphism, defined herein as the extent of abnormalities in the overall appearance of tumor nuclei, is one of the components of the three-tiered breast cancer grading, along with degree of gland formation and mitotic count. The degree of nuclear pleomorphism is subjectively classified from 1-3, where a score of 1 most closely resembles epithelial cells of normal breast epithelium and 3 shows the greatest abnormalities. In contrast to gland formation and mitotic count, which are evaluated according to quantitative criteria, establishing numerical criteria for grading nuclear pleomorphism is challenging, and inter-observer agreement is poor. Given that nuclear pleomorphism reflects a continuous spectrum of variation, we trained a deep neural network on a large variety of tumor regions from the collective knowledge of several pathologists, without constraining the network to the traditional three-category classification. We also motivate an additional approach in which we discuss the additional benefit of normal epithelium as baseline, following the routine clinical practice where pathologists are trained to score nuclear pleomorphism in tumor, having the normal breast epithelium for comparison. In multiple experiments, our fully-automated approach could achieve top pathologist-level performance in select regions of interest as well as at whole slide images, compared to ten and four pathologists, respectively.
1 Introduction
A projected 276,480 women will be diagnosed with breast cancer in the U.S. in 2020, and 42,170 women will die of the disease [34]. To guide management, most pathologists grade breast cancers according to a standardized grading system [7, 12], comprised of three features: 1) nuclear pleomorphism (or “atypia”), 2) extent of gland formation and 3) mitotic count. The scoring criteria for mitotic count and gland formation are defined by quantitative measures, whereas nuclear pleomorphism scoring is based on qualitative analysis of the nuclear morphology of tumor as assessed microscopically on a scale of 1 to 3, reflecting increasing differences in appearance compared with normal epithelium. The final tumor grade is derived from these three scores. With the increased utilization of digital pathology, grading can now be carried out on digitized histopathological images, which yields similar agreement as compared to assessment via light microscopy [15]. Increasingly, the pathologists can also be assisted by Artificial Intelligence (AI) based systems in routine practice [6, 30, 8, 2].
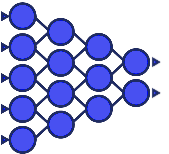
The most commonly applied AI technology for analysis of medical images are so-called deep neural networks (deep learning; DL). Deep learning architectures are composed of connected neurons that receive an input image and perform a series of operations on the learnable network weights to accomplish a learning task, such as classification, regression and segmentation. They have led to unprecedented success in several areas of computer vision [18, 19, 35, 11] to more recent advancements in digital pathology [1, 5, 39, 28, 9]. More specific for breast cancer grading, automated mitosis detection was one of the first applications of DL [10, 38], demonstrating its clinical and prognostic value [37, 3, 4]. Gland segmentation was formulated as a series of nuclei and gland detection, as well as a segmentation task [29, 20], with extensions to clinical risk categories [32] through the use of deep learning. Unlike gland formation and mitotic count, nuclear pleomorphism does not have the same quantitative nature in its definition. As a result, nuclear pleomorphism scoring is the least reproducible of the three grading components, which limits its utility [13, 27, 22]. The works addressing automated nuclear pleomorphism scoring have been limited, consisting of techniques involving manually crafted nuclear features [23, 14] combined with the use of deep belief networks [24], descriptor-based pixel-level image features [17] or binary classification of high pleomorphism (score 3) using a simple convolutional neural network on small image patches [31].
Supervised DL requires ground-truth labels associated with the images for neural network training. Acquiring such labels is a non-trivial task for applications such as pleomorphism scoring, with discrete classes and observer variability. Translating the scores of multiple observers into a ground-truth label (e.g. based on majority, or consensus) disregards valuable information which is present in the spread of the scores of individual experts. In this work, we therefore formulate a novel DL approach to nuclear pleomorphism scoring by considering it as a continuous score, rather than classifying it into three discrete categories. We re-formulate the original three-category classification into a full spectrum of continuous values from the lowest pleomorphism score to the most severe. Our approach mainly consists of two parts. The first part is an epithelial cell detection network developed previously [26]. This step is intended to limit the analysis to the diagnostically relevant regions (i.e. invasive tumor) within a whole slide image. In the second step, a deep regression network predicts the continuous nuclear pleomorphism score on the tumor regions. Training this network does not require detailed manual annotations by pathologists which is one of the key limiting factors within computational pathology. This work marks the first end-to-end fully automated nuclear pleomorphism scoring in breast cancer using DL. Moreover, we are translating a discrete classification into a continuous regression problem to preserve valuable observer input which is not applied previously.
The overview of our approach, AI algorithm, outlining this two-stage process of nuclear pleomorphism scoring is presented in Figure 1.

In order to develop and validate our approach, we carried out two separate studies, resulting in two separate data sets. The first study, referred to as ROI-study, consisted of tumor regions of interest (tumor ROIs) and an additional "normal appearing" epithelial regions of interest (normal ROIs) from whole slide images, carefully selected to include a wide variety of tumor morphology in breast cancer histopathology. We invited pathologists from countries to score nuclear pleomorphism on the tumor ROIs, each visually paired with a normal ROI from the same patient for the pathologists to use as reference for scoring the degree of pleomorphism. We used the results of the ROI-study to train our AI algorithm as well as to evaluate its performance compared to the panel of pathologists. In our automated approach, we used the averaged nuclear pleomorphism scores over the 10 pathologists as reference scores, representing their collective knowledge rather than forcing a discrete majority score. The AI algorithm was trained on a wide range of tumor morphology, leveraging the reference scores to establish the concept of nuclear pleomorphism as a full spectrum of tumor morphology change. In the second study, referred to as the slide-study, whole slide images of breast cancer resection tissue sections were used for the evaluation of the trained AI algorithm. The distribution of the slides resembled the distribution of the cases in routine clinical practice. For the slide-study, we invited pathologists to score nuclear pleomorphism of the slides which were compared to our AI algorithm for whole slide-level evaluation. More details on the ROI-study and slide-study are provided in Section 4.
2 Results
Is tumor morphology enough for automated nuclear pleomorphism scoring?
In routine clinical practice, pathologists typically score nuclear pleomorphism of tumor via a visual comparison to a region with normal cells as a reference. In this section, we investigate whether the tumor morphology by itself is sufficient for the AI algorithm to learn the full pleomorphism spectrum without having seen examples from healthy epithelium. We compared two approaches: 1) learning only from tumor morphology (a AI algorithm trained and validated only on tumor patches from the training and validation sets in the ROI-study), and 2) incorporating ROIs containing normal epithelium on top of the first approach (see Section 4 for details). We compared the best models from both approaches on four independent sets of patches randomly sampled from the validation set. For each input patch, the predictions from both models were nuclear pleomorphism scores of continuous values between , with denoting small prediction deviations outside of the score spectrum. We evaluated both models on several regression metrics (mean absolute error (), mean squared error () and explained variance score ()) in comparison to the reference scores, as presented in Table 1. The results highlighted that the AI algorithm did not benefit from being exposed to normal epithelium, and clearly learned the nuclear pleomorphism score from the tumor morphology alone (see Figure 8). In the rest of the paper, we report the results from the AI algorithm that was trained only on tumor morphology.
| AI algorithm | |||
|---|---|---|---|
| AI algorithm with baseline |
Prediction performance of the AI algorithm on patches.
In this section, we analyzed the predictions of the AI algorithm on fixed-sized patches of pixels randomly cropped at magnification from ROIs out of the evaluation slides in our ROI data set. The output of our AI algorithm is a continuous numerical value ranging between to , corresponding to the increasing severity of the nuclear pleomorphism. In order to demonstrate the granularity of our automated approach, we quantized the predictions of the AI algorithm into the three categories as per the guidelines, as well as five and nine additional categories. In Figure 2, we present example patches from the test set for each category, sorted by the quantized predictions of the AI algorithm, with each patch having a higher categorical predicted score than the one preceding it. While the nuclei in the leftmost patches were closest in appearance to healthy epithelium, the nuclear pleomorphism became gradually more severe with each patch to the right.
Making correct predictions is important, but what is more important is making correct predictions with correct reasoning. To investigate this, we applied Gradient-weighted Class Activation Mapping (Grad-CAM) [33], which highlights the areas in an input image patch that contributed most to the prediction output of that patch. We employed this idea on our deep regression network to see whether the predictions were made by taking the nuclear morphology into account. In Figure 3, we present several example patches from the test set in our ROI data set, visualizing the salient areas determined by the deep regression network. The patches with predictions close to the reference scores showed strong activation around nuclei. Similarly, when we inspected the patches where the AI algorithm failed, we observed that it overlooked the nuclear structures and incorporated data from other areas of the tissues. Our experiments in this section indicate that the AI algorithm predicted similar scores with the pathologists when it focused on the nuclei, failing when focusing on other areas, such as stroma. We overcame this problem by processing multiple overlapping patches from the same area with small displacements. This ensured that the AI algorithm saw a slightly displaced patch and it mostly focused on the same nuclear areas. As a result, the predictions were, on average, based on the nuclear architectures, as the problem occurred few and far between.

Quantitative evaluation of the AI algorithm vs. pathologists.
The first quantitative comparison between the AI algorithm and the pathologists used the evaluation set of the ROI-study, consisting of ROIs from slides. ROIs were manually selected to contain as much as possible a uniform degree of pleomorphism. Each pathologist scored nuclear pleomorphism on these tumor ROIs into one of the three categories, . We quantized the predicted pleomorphism scores of the AI algorithm for each ROI into the traditional three categories to compare to the scores of the individual pathologists, as well as to the majority vote of their scores (using the provided confidence scores in the case of ties). We present the kappa scores detailing the agreement comparisons of the pathologists and the AI algorithm in Figure 4. In this comparison, the scores of a pathologist were not included in the majority voting when that pathologist was compared to the majority scores. The AI algorithm had a kappa score of with the majority scores (indicated by Maj in the figure), trailing behind only two pathologists, and with kappa scores and with the majority scores, respectively. The AI algorithm had the highest average kappa score of , followed by the kappa score of by . The AI algorithm on average, showed the highest agreement, and it ranked third behind the two best performing pathologists when compared to the majority scores on the evaluation set in the ROI-study.

(a)

(b)
Real case application by scoring nuclear pleomorphism on whole slide images.
This slide-level experimental setup was in line with the real-world clinical setting, where an entire slide is assigned a single nuclear pleomorphism score by a pathologist. The whole slide images were used for the slide-level evaluation of the AI algorithm compared to the four participating pathologists, denoted by , who scored nuclear pleomorphism on the slides into one of the three categories. In contrast to the ROI-level study in which ROIs were selected to have homogeneous pleomorphism, tumor in whole slide images generally contained larger heterogeneity with more diverse nuclei morphology. We present the visual pleomorphism spectrum of the (non-quantized) predictions of the AI algorithm on four example slides from the slide-study in Figure 5.


For the quantitative analysis of the AI algorithm compared to the pathologists, we quantized the pleomorphism predictions of the slides into one of the three categories. Figures 6 - 6 present the score difference of the AI algorithm compared to the pathologists. The AI algorithm achieved a nuclear pleomorphism score equal to pathologists in and slides, respectively. The AI algorithm had a score difference of on the rest of the slides, except for the two slides in comparison to and one slide to where the pathologists scored for the slides whereas the AI algorithm scored . For these slides, the scores of the other pathologists were (), () and (). Additionally, compared to the score differences of the pathologists, as seen in Figure 10, the AI algorithm had the most matching scores in slides with as well as the highest matching scores, on average. Looking at the score distribution of the AI algorithm, we observe that the AI algorithm predicted the score in slides, score in slides and score in slides, as shown in Figure 6. Finally, we present the kappa scores of the AI algorithm as well as the individual pathologists in Figure 6. The highest kappa score of was achieved between the AI algorithm and . The AI algorithm had kappa scores of and with the rest of the pathologists, , respectively. Overall, the average kappa score for the AI algorithm was and it was only second to with . was also the participant with the overall highest average agreement. The results indicate that agreed the most with the AI algorithm, more so than any other pathologists. Our findings in this slide-level study were consistent with our results in the previous experiments with the AI algorithm consistently ranking high in agreement with the best performing pathologists. Additionally, qualitative analysis of the predictions on whole slide images demonstrated that the AI algorithm learned to score the full spectrum of nuclear pleomorphism based on morphological changes in tumor cells.


3 Discussion
In this paper, we proposed a novel method for automated scoring of nuclear pleomorphism in breast cancer as a continuous feature rather than a discrete classification. Our AI algorithm was composed of two stages. In the first stage, an epithelial cell detection network was used to locate tumor cells in whole slide images. In the second stage, a deep regression network scored nuclear pleomorphism on the tumor, considering the tumor pleomorphism as a spectrum. Our results showed that the AI algorithm consistently achieved top-level performance similar to the best performing pathologists throughout our experiments in ROI and slide-level studies.
In our experiments, we quantized the patch-level predictions of the AI algorithm into arbitrary number of categories to showcase its flexibility of demonstrating the continuity of the pleomorphism in tumor in greater granularity than the traditional three-category classification. In the few cases, the predictions failed to capture the pleomorphism in tumor when the AI algorithm did not focus on areas with tumor cells. We discovered that this shortcoming could easily be bypassed by processing multiple overlapping patches from the same area and average pooling the predictions, as the occurrence of the problem was few and far between. We also investigated the added value of normal epithelium as reference, following the workflow of the pathologists in routine practice. The normal ROIs were less diverse compared to tumor ROIs, due to the slides containing only a very small number of fairly small areas with normal cells, and the inherent modest variation in normal structures. In addition, due to the nature of normal epithelium, normal ROIs contained, on average, a larger ratio of stroma and ductal structures to cells. Therefore, we do not rule out the possibility that the AI algorithm might have focused on such structures more and failed to capture the nuclear morphology of normal cells. We leave the further investigation of this learning setup for future work. However, we proved that our automated approach could already learn the entire spectrum of tumor pleomorphism without additional knowledge of the normal cell morphology through multiple experiments.
In the ROI-study, the AI algorithm achieved a higher agreement with the consensus of pathologists and highest pairwise kappa scores versus any individual pathologist. This is an important outcome as it suggests that our approach is the best out of the participating pathologists at scoring pleomorphism on homogeneous tumor regions. The results of our experiments in the slide-study suggested a similar outcome with the AI algorithm achieving the second best average kappa score among four pathologists. In addition, the best performing pathologist with the highest average kappa score agreed the most with the AI algorithm by a large margin. In very few cases, where the epithelial cell detection network captured the tumor in regions with Ductal Carcinoma in Situ (DCIS), the deep regression network scored pleomorphism on those regions, too. We argue that the performance of the AI algorithm was slightly hampered by such false predictions causing the overall score of the slides to be quantized one score off from the predictions of the deep regression network for the tumor actually suggested. This is also visible in the Figure 6, as the predictions of the AI algorithm, on average, were slightly lower than that of the pathologists, as presented in Figure 8. This subsidiary issue could be mitigated by enriching the training set of the epithelial cell detection network with more examples from DCIS cases.
In this work, we proposed a fully automated deep learning methodology for the generalized version of the traditional three-category classification of nuclear pleomorphism in breast cancer, formulated as a continuous spectrum of the entire tumor morphology. We validated the performance of the AI algorithm through multiple qualitative and quantitative experiments, and showed that our approach could reach agreement with a reference standard similar to that of the best performing pathologists. The output of our approach is the full spectrum of tumor pleomorphism, which is easy to analyse, interpret and reproduce. The full pleomorphism spectrum is highlighted for the pathologists to analyse the tumor morphology without having to zoom-in to investigate individual cells in multiple tumor regions. Similarly, overall score of a slide could easily be interpreted by the pathologists from the distribution of the pleomorphism spectrum visualized on the slide. Therefore, our work could be a very efficient tool for pathologists in their daily workflow for nuclear pleomorphism scoring, also leveraging the problem of subjective interpretation due to the deterministic nature of the automated predictions, and therefore improving concordance among pathologists. Our future work will include such a study in which we will investigate whether the addition of the AI algorithm as a support system could improve the agreement between pathologists. Another future work will include the investigation of the prognostic value of the automated scoring of nuclear pleomorphism spectrum in breast histopathology.
4 Methods
ROI-study for the training and validation of the AI algorithm.
We collected H&E stained whole slide images of breast cancer resections, denoted as , with a total number of slides from two cohorts, which we refer to as cohort A and cohort B. The slides in cohort A were scanned on a 3DHistech P1000 scanner at /pixel, and the slides in cohort B were scanned on a 3DHistech Pannoramic 250 Flash II scanner at the same spatial resolution of /pixel. From the cohort A; we made a balanced selection of cases with respect to the nuclear pleomorphism scores. Invasive Ductal Carcinoma (IDC) was the most prevalent tumor type, seen in 24 out of the 31 slides, resembling the distribution of breast cancer patients in clinical practice. From the cohort B; we included 8 additional cases that covered different histological subtypes with severely aberrant morphology from a triple negative breast cancer cohort. As a result, pleomorphism of the tumor with score 3 in cohort A was, on average, less severe than the tumor with score 3 in cohort B. Overall, the slides were selected to cover the entire range of nuclear pleomorphism from a large spectrum of tumor morphology in breast cancer pathology, as presented in Table 2.
In routine clinical practice, normal epithelium in a whole slide image, when present, is a useful reference point for pathologists to determine the degree of pleomorphism of the tumor. In the ROI-study, we present pairs of ROIs from tumor and normal epithelium to the pathologists to perform nuclear pleomorphism scoring similar to the routine practice. We manually selected one or more tumor ROIs from each slide, , ensuring score homogeneity of tumor cells within each ROI where denotes the number of selected tumor regions from slide . Overall, we selected such regions from slides, . Additionally, we manually selected at least one ROI, from normal epithelium (normal ROI), where denotes the number of such regions selected from the slide . As few slides contained little to no large enough areas with normal epithelium, it was not possible to select at least one normal ROI from every slide. In total, there were normal ROIs that we could select from the set of slides, . Ten out of the slides did not have large enough region with normal cells. Therefore, for the whole slide images without normal epithelium, we retrieved additional slides from the same patient to acquire at least one normal ROI. As a result, the total number of selected normal ROIs increased to with the selection of additional normal ROIs from the extra set of slides. Following this selection procedure, each ROI was cropped around their center point to a standard square area of around at magnification. Subsequently, a tumor ROI was paired with a normal ROI from the same patient to form a query pair, , , . This process is repeated for all tumor ROIs in this data set. It has to be noted that each query had a unique tumor ROI, but a normal ROI could be paired with more than one tumor ROI due to the smaller number of normal ROIs vs tumor ROIs, vs .
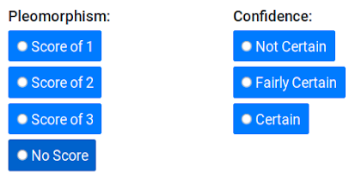
We built a web-based nuclear pleomorphism platform consisting of the queries to display the ROIs, allowing the pathologists to score them through a user interface. Each query was followed by the questions; nuclear pleomorphism score of the tumor into one of the three categories; 1,2 or 3, and an optional field for confidence with the scoring; not certain, fairly certain, certain, as well as an additional text field for comments about the queried tumor and normal ROIs. An example is provided in Figure 7. In the figure, the ROIs were displayed on a smaller resolution. When an ROI is selected, the full resolution of the ROI was displayed with a total size of pixels. We invited pathologists from several countries with varying levels of expertise in breast pathology to participate in this study. As a result, each tumor ROI, , was scored for nuclear pleomorphism times, denoted by the set of scores . For a tumor ROI, , in the query , we aggregated the pleomorphism scores of the pathologists by average pooling, referred to as the reference score of and is denoted by . We present the reference scores as well as the pleomorphism scores of the individual pathologists for the queries in Figure 8. Additionally, we provide the distribution of the scores of the pathologists with respect to the reference scores, categorized by their confidence scores in Figure 9. Throughout our experiments, we train and validate the AI algorithm on a large subset of this data set, using the reference scores as reference standard. The rest of this data set was used to evaluate the ROI-level performance of the AI algorithm compared to the pathologists. A more detailed breakdown of the training, validation and evaluation subsets is provided in the experimental settings section.
| ROI-study | Slide-study | ||
| Invasive carcinoma type | Slides | ROIs | Slides |
| No special type (Ductal) | 26 | 83 | 91 |
| Lobular | 6 | 21 | 22 |
| Metaplastic carcinoma | 3 | 8 | - |
| Invasive micropapillary | 1 | 4 | 2 |
| Mucinous | 1 | 3 | - |
| Tubular | 1 | 3 | 2 |
| Malignant adenomyoepithelioma | 1 | 3 | - |
| Cribriform | - | - | 1 |
| Total | 39 | 125 | 118 |

Slide-study for the evaluation of the AI algorithm.
We collected an additional set of H&E stained whole slide images from the cohort B, , with a total number of slides. The slides selected for this study did not share any overlap with the ROI-study, as the patients in each study were unique. The selection criteria for the slides followed a similar approach to ROI-study, where we collected a large variety of slides with diverse tumor cell morphology. We used the available clinical data of the patients to approximate the distribution in the clinical practice. IDC was the most prevalent type of cancer with slides, whereas the second most was Invasive Lobular Carcinoma (ILC) with slides. The full distribution of the tumor types in the slide-study is presented in Table 2.
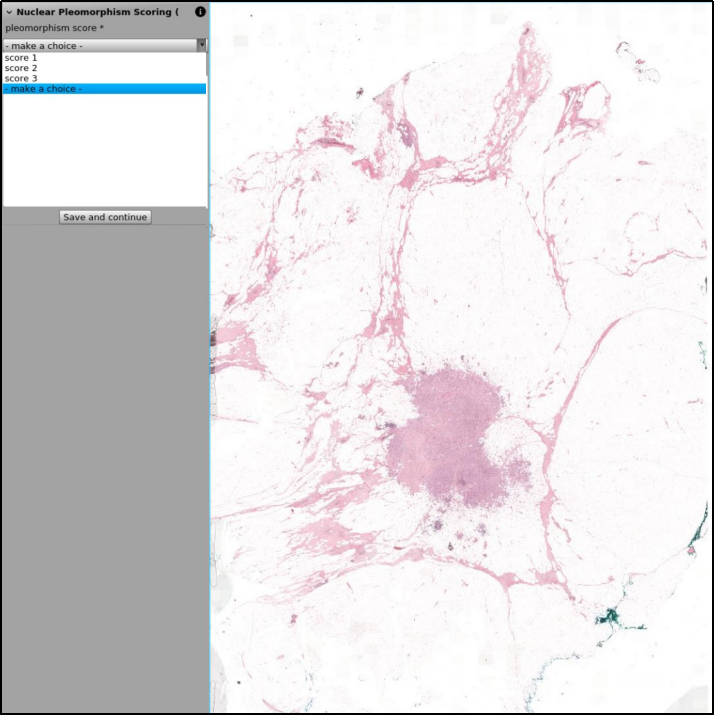
A web platform 111www.grand-challenge.org was built for scoring nuclear pleomorphism on the slides. The application could display multi-resolution whole-slide images to enable the pathologists to freely navigate the slide with zoom-in and zoom-out capabilities. In this slide-level study, we requested from pathologists to score nuclear pleomorphism scores of whole slide images as 1,2 or 3 and provided them an optional comment field for each queried slide, as presented in Figure 7. We invited three of the 10 pathologists who participated in the ROI-study, to also score nuclear pleomorphism in the slide-study. Moreover, we invited an extra pathologist who did not participate in the ROI-study, bringing the total number of pathologists in this study to four. Detailed breakdown of the score distributions of the pathologists, individually, and compared to each other is displayed in Figure 10. In our experiments, we used the whole slide images and the pleomorphism scores of the pathologists only to evaluate the performance of the AI algorithm, as opposed to the ROI-study where training and validation of the AI algorithm were also carried out.


A two-stage approach for nuclear pleomorphism scoring.
We propose a two-stage methodology to score nuclear pleomorphism on whole slide images in breast cancer, following the routine practice in which pathologists analyse the tumor in several cancer zones and compare the morphology of the tumor to the morphology of the cells in normal epithelium. Therefore, the first stage consists of the detection of tumor and normal cells using our epithelial cell detection network. For the second stage, we propose to train a deep regression network to learn nuclear pleomorphism scoring as a spectrum, considering it as a continuum instead of the traditional three-category classification. Additionally, we propose an extension to the deep regression network to discuss the additional benefit of incorporating knowledge from normal epithelium. An illustration of the proposed two-stage methodology as well as the extension to the deep regression network is presented in Figure 11.

Tumor detection and patch sampling by tumor density.
In the first stage of our methodology, we use the epithelial cell detection network to find the tumor and normal cells in the ROIs from the whole slide images in the ROI-study. This network is based on one of the state-of-the-art single-shot object detection networks, RetinaNet [21], which we had trained on annotated nuclei for the detection of tumor and normal cells in our previous work. In this work, we use this network to ensure that the patches sampled from the ROIs during the training of the pleomorphism scoring network contains high cellular activity. It is particularly important to ensure tumor density in the sampled patches for the deep regression network to learn to make its predictions based on tumor cells, and not on other factors in the tissue. For inference, the epithelial cell detection network is used to process whole slide images to detect and segment the tumor regions for the deep regression network to score nuclear pleomorphism only in diagnostically relevant regions. Throughout the learning procedure, epithelial cell detection network was only used for inference purposes keeping the network weights frozen.
Nuclear pleomorphism as a continuum.
Nuclear pleomorphism is traditionally scored into one of the three categories, 1,2 or 3, according to the grading criteria. Even though the clinical practice mostly follows this scoring criterion, pathologists can introduce more sensitivity by adding or subtracting half a score when the pleomorphism of the tumor is difficult to categorize. Motivated by this practice in clinic and our observation from the ROI-study (Figure 8), we propose a more generalized version of the categorical classification by considering the nuclear pleomorphism as a continuous spectrum of the change in tumor morphology. This realization transforms the three-category classification problem into a regression task on the full nuclear pleomorphism spectrum. The granularity in the pleomorphism spectrum was made possible by the averaged collective knowledge of the pathologists. Therefore, the second stage in our methodology is comprised of a deep regression network based on Densenet [16], which is trained on patches sampled by tumor density from the ROIs using the average (reference) scores of the pathologists as reference standard. A Densenet architecture consists of the so-called ’dense blocks’ in which the input of a layer is the concatenation of the output of the previous block and the inputs of the layers preceding it, . Another distinguishing feature of Densenet was the addition of the so-called ’transition layers’, which help to regulate the number of channels in the network. In comparison, a traditional CNN is only composed of consecutive layers, in which an input of a layer is the output of the previous layer, . A training iteration of our Densenet based deep regression network is as follows. A training patch , sampled from the tumor ROI, , is fed through the deep regression network to regress its pleomorphism score . The smoothL1 loss function is computed from the predicted value with respect to the reference score as
where is the hyperparameter of the loss function, corresponding to the degree of the contribution of and losses, which we set to the default value of in our experiments. Finally, the gradient of the loss function is backpropagated through the network to improve the prediction performance in the next iteration by updating the network weights. This training iteration is done on a batch of multiple such patches from various tumor ROIs in the training set, , with denoting the batch size. This process of one iteration in training is visualized in Figure 11 through (a) to (c). Tens of thousands of patches sampled from the tumor ROIs in the training set as well as the granularity of the reference nuclear pleomorphism scores make it possible for the network to analyse a diverse tumor morphology as a spectrum.
Added value of normal epithelium as baseline.
Following the routine clinical workflow in which normal epithelium is used as baseline for the nuclear pleomorphism scoring of tumor, we propose an extension to our deep regression network in order to investigate the additional value that can be leveraged from the morphology of normal cells. In this extended deep regression network, the tumor patches, , are used as input to the Densenet architecture, as before. The normal patches, , are fed through a simpler feature embedding network, denoted by , as normal cells have little to no variability in morphology compared to the large plethora of the tumor morphology. The architectural details of the feature embedding network are outlined in Table 3. In this extension, the feature representation from a tumor patch is compared to the feature embedding from a normal patch through a cosine similarity loss function
where is the reference score of the tumor patch , denotes the penultimate layer of the deep regression network from which the feature representation of the tumor patch is obtained. This loss function ensures that the feature representations of the tumor patches with reference scores around will resemble the most to the normal patches, and the patches with reference scores closer to will resemble the least. More specifically, the feature representation of a tumor patch with size from the penultimate layer of the deep regression network is compared to the output of a normal patch with the same size from the feature embedding network. The cosine similarity function is parameterized by a function of the reference score of the tumor patch to control the penalization with respect to the similarity versus the normal patch. During learning, both the deep regression network and the feature embedding network are trained jointly, utilizing both loss functions and . During inference, only the deep regression network is used to predict a pleomorphism score for an input image patch. Similar to the first approach, the epithelial cell detection network is employed to ensure high cellular density in sampled tumor and normal patches. The rest of the training procedure such as the selection of hyperparameters were kept the same as before. This extended deep regression network is visualized in Figure 11 through (a) to (e).
| Layer | Feature embedding network |
|---|---|
| 1 | conv(7,3,0)-32 + maxpool(2,2) + ReLU + BN |
| 2 | conv(5,2,0)-64 + maxpool(2,2) + ReLU + BN |
| 3 | conv(3,3,0)-64 + maxpool(2,2) + ReLU + BN |
| 4 | conv(3,3,0)-128 + maxpool(2,2) + ReLU + BN |
| 5 | fc(512,256) + ReLU |
| 6 | fc(256,1024) + ReLU |
Scoring nuclear pleomorphism on ROIs and whole slide images.
As the input to the AI algorithm was of size pixels, the ROIs were too large to be processed directly. Therefore, a single pleomorphism score for an ROI was obtained by the procedure below. The ROI was processed into fixed-size overlapping tiles. In our experiments, we utilized an overlap value of pixels, horizontally and vertically, for the tile size of pixels. The AI algorithm predicted a continuous pleomorphism score for each tile. As a result of the overlapping tiles, multiple predictions were made in small blocks of size and for each block in the ROI, predictions were aggregated by average pooling to assign its pleomorphism score. Subsequently, we fine-tuned the predictions by only assigning them to the tumor cells using the epithelial cell detection network. Finally, the pleomorphism score of the ROI was determined by the average pleomorphism score in the tumor. Whole slide-level inference followed a similar procedure in which the pleomorphism score of a slide was determined by averaging the pleomorphism scores over its tumor regions. Additionally, a preprocessing step was applied to locate and process only the tumor regions in the slide, using the output of the epithelial cell detection network to avoid fatty tissue, stroma, normal epithelium and several other structures that are not taken into account in breast cancer grading. Therewith, we ensured that the deep regression network scored pleomorphism only on tumor regions.
Experimental Setting.
The majority of the data set collected in the ROI-study was mainly used for the training and the validation of the AI algorithm, and only a small subset was used for evaluation. On the other hand, the entire set of the whole slide images in the slide-study were only used for evaluation. The selection of the slides for the training and the validation of the AI algorithm was carried out with the goal of exposing it to as much variety of tumor morphology as possible. As a result, we selected the 52 ROIs from 16 slides and the 28 ROIs from 10 slides in the ROI-study. The remaining 45 ROIs from the 13 slides were used to evaluate the performance of the AI algorithm. The performance evaluation in the ROI-study could be regarded as the result of a controlled experiment in which each test ROI was homogeneous in nuclear pleomorphism severity. The 118 slides from the slide-study were only used for slide-level performance evaluation of the AI algorithm compared to the pathologists. This setting represented the real-world clinical practice where the AI algorithm scored nuclear pleomorphism on whole slide images.
We trained the Densenet based deep regression network from scratch using the Adam optimizer with a learning rate of . Each training patch was pixels, extracted from the tumor ROIs in the training set of the ROI-study slides at spacing. The batch size used during an iteration of the training was . Each epoch contained 200 training and 500 validation iterations. Training of the deep regression network continued until the loss value in the validation set no longer improved. The training and validation patches were augmented with spatial operations such as horizontal and vertical flips and rotations. In order to make the AI algorithm color and stain invariant, we applied heavy color and stain augmentations on the training patches [36]. The training patches were also augmented with blurring techniques to make the network more robust against out-of-focus artifacts, commonly seen in whole slide images. A Gaussian map was applied on the output of the epithelial cell detection network to create a density map of the tumor cells which was used to sample patches from areas with high cellular density during training. A batch had a balanced pleomorphism distribution among its patches, which was made possible by an equal distribution of quantized reference scores.
The performance of the deep regression network was compared to the performance of the extended deep regression network to investigate the added value of normal epithelium as a baseline, using several regression metrics, such as mean absolute error (), mean squared error () and median absolute error (), explained variance score () and score. Throughout the other quantitative evaluations, the predictions of the AI algorithm were quantized into several categories, most notably into the traditional three-category setting to compare the performance against the pathologists. To illustrate, quantization of the range into three categories was to partition the score spectrum into three equal sized categories; a prediction within the range of corresponded to score 1, corresponded to score 2, and corresponded to score 3. We evaluated the performance of the AI algorithm versus the pathologists as well as the performance of each pathologist versus one another, by Cohen’s quadratic kappa measure [25]
where denotes the relative observed agreement between two participants and corresponds to the probability of chance agreement.
References
- [1] Janowczyk A and Madabhushi A “Deep Learning for Digital Pathology Image Analysis: A Comprehensive Tutorial with Selected Use Cases” In Journal of Pathology Informatics 7.29, 2016
- [2] Balázs Ács, Mattias Rantalainen and Johan Hartman “Artificial Intelligence as the Next Step Towards Precision Pathology” In Journal of Internal Medicine 288.1, 2020, pp. 62–81
- [3] Maschenka C.. Balkenhol et al. “Deep Learning and Manual Assessment Show That the Absolute Mitotic Count Does Not Contain Prognostic Information in Triple Negative Breast Cancer” In Cellular Oncology 42.4, 2019, pp. 555–569
- [4] Maschenka C.. Balkenhol et al. “Deep Learning Assisted Mitotic Counting for Breast Cancer” In Laboratory Investigation 99.11, 2019, pp. 1596–1606
- [5] Babak Ehteshami Bejnordi et al. “Diagnostic Assessment of Deep Learning Algorithms for Detection of Lymph Node Metastases in Women with Breast Cancer” In JAMA 318.22, 2017, pp. 2199–2210
- [6] Kaustav Bera et al. “Artificial Intelligence in Digital Pathology—new Tools for Diagnosis and Precision Oncology” In Nature Reviews Clinical Oncology 16.11, 2019, pp. 703–715
- [7] H. Bloom and W. Richardson “Histological Grading and Prognosis in Breast Cancer” In British Journal of Cancer 11.3, 1957, pp. 359–377
- [8] Wouter Bulten et al. “Artificial Intelligence Assistance Significantly Improves Gleason Grading of Prostate Biopsies by Pathologists” In Modern Pathology, 2020
- [9] Wouter Bulten et al. “Automated Deep-learning System for Gleason Grading of Prostate Cancer using Biopsies: A Diagnostic Study” In Lancet Oncology 21, 2020, pp. 233–241
- [10] Dan C. Cireşan, Alessandro Giusti, Luca M. Gambardella and Jürgen Schmidhuber “Mitosis detection in breast cancer histology images with deep neural networks” In Medical Image Computing and Computer-Assisted Intervention, 2013
- [11] Jacob Devlin, Ming-Wei Chang, Kenton Lee and Kristina Toutanova “Bert: Pre-training of Deep Bidirectional Transformers for Language Understanding” In North American Chapter of the Association for Computational Linguistics, 2018
- [12] C. Elston and Ian Ellis “Pathological Prognostic Factors in Breast Cancer. I. The Value of Histological Grade in Breast Cancer: Experience from a Large Study with Long-term Follow-up” In Histopathology 19.5, 1991, pp. 403–410
- [13] Henry F. Frierson Jr. et al. “Interobserver Reproducibility of the Nottingham Modification of the Bloom and Richardson Histologic Grading Scheme for Infiltrating Ductal Carcinoma” In American Journal of Clinical Pathology 103.2, 1995, pp. 195–198
- [14] Ziba Gandomkar, Patrick C. Brennan and Claudia Mello-Thoms “Computer-Assisted Nuclear Atypia Scoring of Breast Cancer: a Preliminary Study” In Journal of digital imaging 32.5, 2019, pp. 702–712
- [15] Paula S. Ginter et al. “Histologic Grading of Breast Carcinoma: A Multi-institution Study of Interobserver Variation using Virtual Microscopy” In Modern Pathology, 2020, pp. 1–9
- [16] Gao Huang, Zhuang Liu, Laurens Van Der Maaten and Kilian Q. Weinberger “Densely Connected Convolutional Networks” In Computer Vision and Pattern Recognition, 2017
- [17] Adnan Mujahid Khan, Korsuk Sirinukunwattana and Nasir Rajpoot “A Global Covariance Descriptor for Nuclear Atypia Scoring in Breast Histopathology Images” In IEEE journal of biomedical and health informatics 19.5, 2015, pp. 1637–1647
- [18] A. Krizhevsky, I. Sutskever and G. Hinton “Imagenet Classification with Deep Convolutional Neural Networks” In Advances in Neural Information Processing Systems, 2012
- [19] Quoc Le et al. “Building High-level Features using Large Scale Unsupervised Learning” In International Conference in Machine Learning, 2013
- [20] Soonam Lee et al. “Automatic Glandular and Tubule Region Segmentation in Histological Grading Of Breast Cancer” In Electronic Imaging 2018.15, 2018, pp. 199–1
- [21] Tsung-Yi Lin et al. “Focal Loss for Dense Object Detection” In International Conference on Computer Vision, 2017
- [22] Teri A. Longacre et al. “Interobserver Agreement and Reproducibility in Classification of Invasive Breast Carcinoma: An Nci Breast Cancer Family Registry Study” In Modern Pathology 19.2, 2006, pp. 195–207
- [23] Cheng Lu, Mengyao Ji, Zhen Ma and Mrinal Mandal “Automated Image Analysis of Nuclear Atypia in High-power Field Histopathological Image” In Journal of Microscopy 258.3, 2015, pp. 233–240
- [24] P. Maqlin, Robinson Thamburaj, Joy John Mammen and Marie Theresa Manipadam “Automated Nuclear Pleomorphism Scoring in Breast Cancer Histopathology Images Using Deep Neural Networks” In International Conference on Mining Intelligence and Knowledge Exploration, 2015
- [25] Mary L. McHugh “Interrater Reliability: The Kappa Statistic” In Biochemia medica 22.3, 2012, pp. 276–282
- [26] Caner Mercan, Maschenka Balkenhol, Jeroen Laak and Francesco Ciompi “From Point Annotations to Epithelial Cell Detection in Breast Cancer Histopathology using RetinaNet” In Medical Imaging with Deep Learning, 2019
- [27] John S. Meyer et al. “Breast Carcinoma Malignancy Grading by Bloom–richardson System vs. Proliferation Index: Reproducibility of Grade and Advantages of Proliferation Index” In Modern Pathology 18.8, 2005, pp. 1067–1078
- [28] Kunal Nagpal et al. “Development and Validation of a Deep Learning Algorithm for Improving Gleason Scoring of Prostate Cancer” In NPJ digital medicine 2.1, 2019, pp. 1–10
- [29] Kien Nguyen, Michael Barnes, Chukka Srinivas and Christophe Chefd’Hotel “Tubule Segmentation of Fluorescence Microscopy Images Based on Convolutional Neural Networks with Inhomogeneity Correction” In Proceedings of the SPIE, 2015
- [30] Muhammad K.. Niazi, Anil V. Parwani and Metin N. Gurcan “Digital Pathology and Artificial Intelligence” In Lancet Oncology 20.5, 2019, pp. e253–e261
- [31] Henri Noël, Ludovic Roux, Shijian Lu and Thomas Boudier “Detection of High-grade Atypia Nuclei in Breast Cancer Imaging” In Proceedings of the SPIE, 2015
- [32] David Romo-Bucheli et al. “Automated Tubule Nuclei Quantification and Correlation with Oncotype Dx Risk Categories in Er+ Breast Cancer Whole Slide Images” In Nature Scientific Reports 6, 2016, pp. 32706
- [33] Ramprasaath R. Selvaraju et al. “Grad-cam: Visual Explanations from Deep Networks via Gradient-based Localization” In International Conference on Computer Vision, 2017
- [34] Rebecca L. Siegel, Kimberly D. Miller and Ahmedin Jemal “Cancer Statistics, 2020” In CA: A Cancer Journal for Clinicians 70.1, 2020, pp. 7–30
- [35] David Silver et al. “Mastering the Game of Go with Deep Neural Networks and Tree Search” In Nature 529.7587, 2016, pp. 484–489
- [36] David Tellez et al. “Quantifying the Effects of Data Augmentation and Stain Color Normalization in Convolutional Neural Networks for Computational Pathology” In Medical image analysis 58, 2019, pp. 101544
- [37] David Tellez et al. “Whole-Slide Mitosis Detection in H&E Breast Histology Using PHH3 as a Reference to Train Distilled Stain-Invariant Convolutional Networks” In IEEE Transactions on Medical Imaging 37.9, 2018, pp. 2126–2136
- [38] Mitko Veta et al. “Assessment of Algorithms for Mitosis Detection in Breast Cancer Histopathology Images” In Medical Image Analysis 20.1, 2015, pp. 237–248
- [39] Mitko Veta et al. “Predicting Breast Tumor Proliferation from Whole-slide Images: the TUPAC16 Challenge” In Medical Image Analysis 54.5, 2019, pp. 111–121
Disclosures
Caner Mercan is supported by the NWO-Perspectief program EDL (Efficient Deep Learning), co-financed by the Dutch Organisation for Scientific Research and 35 Dutch companies.
Jeroen van der Laak is a member of the advisory boards of Philips, The Netherlands and ContextVision, Sweden, and received research funding from Philips, The Netherlands, ContextVision, Sweden, and Sectra, Sweden in the last five years.
Roberto Salgado reports non-financial support from Merck and Bristol Myers Squibb; research support from Merck, Puma Biotechnology, and Roche; and advisory board fees for Bristol Myers Squibb; and personal fees from Roche for an advisory board related to a trial-research project.