IHashNet: Iris Hashing Network based on efficient multi-index hashing
Abstract
Massive biometric deployments are pervasive in today’s world. But despite the high accuracy of biometric systems, their computational efficiency degrades drastically with an increase in the database size. Thus, it is essential to index them. An ideal indexing scheme needs to generate codes that preserve the intra-subject similarity as well as inter-subject dissimilarity. Here, in this paper, we propose an iris indexing scheme using real-valued deep iris features binarized to iris bar codes (IBC) compatible with the indexing structure. Firstly, for extracting robust iris features, we have designed a network utilizing the domain knowledge of ordinal filtering and learning their nonlinear combinations. Later these real-valued features are binarized. Finally, for indexing the iris dataset, we have proposed loss that can transform the binary feature into an improved feature compatible with Multi-Index Hashing scheme. This loss function ensures the hamming distance equally distributed among all the contiguous disjoint sub-strings. To the best of our knowledge, this is the first work in the iris indexing domain that presents an end-to-end iris indexing structure. Experimental results on four datasets are presented to depict the efficacy of the proposed approach.
![[Uncaptioned image]](/html/2012.03881/assets/x1.png)
1 Introduction
Due to the digitization and expeditious deployment of biometric systems like Aadhar(India) [4] and MyKad(Malaysia) [3], it is very crucial to facilitate rapid search. Currently around billion people in India are enrolled under the Aadhar scheme. Mumbai is the most populous city in India with inhabitants around million, out of which around million population is males and around million population is females 111https://www.census2011.co.in/census/city/365-mumbai.html. One can observe that even after the entire country’s population got divided on the basis of their location and gender, the resulting population will be very large (may be of the order of millions). Also, although Aadhar system is handling tens of millions of authentications on daily basis, utilizing huge amount of computing resources and data level parallelism. It has been reported that Aadhar does 1:1 matching (i.e. verification) and never performs 1:N matching (i.e. recognition)222https://uidai.gov.in/aadhaar-eco-system/authentication-ecosystem.html. It restricts recognition (1:N), except while checking duplicates while issuing new Aadhar card which take huge amount of time (may be in days). While the proposed indexing system can facilitate recognition (1:N), and ensures fast and accurate retrieval. In general Aadhar operations are concealed from general public. The proposed indexing strategy could be used as a sub categorical parameter for improving the indexing under the main categorical distinguishing parameters like gender and location. This system can facilitate recognition (1:N) and ensures fast and accurate retrieval. Out of several biometric traits, the iris is regarded as one of the best biometric modality owing to its high discriminative power due to highly textural patterns [9] and less susceptibility to various spoofing attacks.
Problem Statement: The goal of any indexing technique is perform authentication with minimum comparisons. It can be achieved by only considering the semantically neighboring query indices instead of the entire database. Figure.1 presents a general overview of iris identification under two different scenarios.
Challenges: The fuzziness of the iris dataset, which means the gallery and the probe iris image belonging to the same subject, appears similar but never identical, makes the indexing technique even more challenging. Another critical issue is the trade-off between accuracy and efficiency, which leads to performance deterioration when fast searching is performed.
Related work: Several works have been done in the literature for iris recognition [28, 21] but the work done in the field of iris indexing is limited. Daugman [13] does one of the initial work in this field proposing a search algorithm on iris codes based on a beacon guided search using multiple colliding segment principle but requires complex memory management. In another notable work, Jayaraman et al. [14] developed a method for indexing large scale iris database based on iris color. However, the proposed technique [14] is not suitable owing to its high dimensionality. In one of the work, Mukherjee and Ross [20] proposed an indexing strategy based on SPLDH (signed pixel-level difference histogram). However, the major challenge in this method [20] is to determine the histogram dimensionality. Recently, Rathgeb et al. [10] study the concept of a bloom filter for indexing iris dataset giving promising results. To the best of our knowledge, the work done by Ahmed et al. [5] is the current state-of-the-art in iris indexing. In their work, they have proposed an indexing strategy based on hyper-planes.
Contribution:
The key contributions are as follows:
1) Image to Real value feature extraction: A novel deep neural architecture (POFNet) based on ordinal measures for extracting patch level discriminative iris information is proposed as discussed in more detail under heading patch-level ordinal features (POFNet) in section 2.
2) Optimized MIH : An optimized version of the Multi index hashing (MIH) scheme is proposed as defined in Algorithm 1. Table 5 further indicates the superiority of optimized MIH in terms of penetration rate and retrieval time in comparison to naive MIH implementation.
3) loss:
A novel loss has been proposed that transformed binary iris features into an improved feature compatible with Multi-Index Hashing scheme. This loss function ensures the hamming distance equally distributed among all the contiguous disjoint sub-strings.
2 Proposed methodology
Highly distributed iris structures make it one of the best biometric modality. However, detecting these microtextural iris patterns is a challenging issue, especially due to the presence of obstructions like eyelids, eyelashes, and all. Traditionally several feature descriptors like LBP (Local Binary Pattern), LoG (Laplacian of gaussian), DWT (Discrete Wavelet Transform), Gabor filter bank, and relational measures were used for extracting robust iris features. Recently, it has been proved that CNN’s(Convolutional neural networks) are a good choice for learning robust feature descriptors. CNN’s are used in iris domain in a variety of tasks like iris recognition, iris segmentation, iris spoof detection. This inspired us to extract robust iris features using CNN’s.
2.1 Iris deep feature extraction network
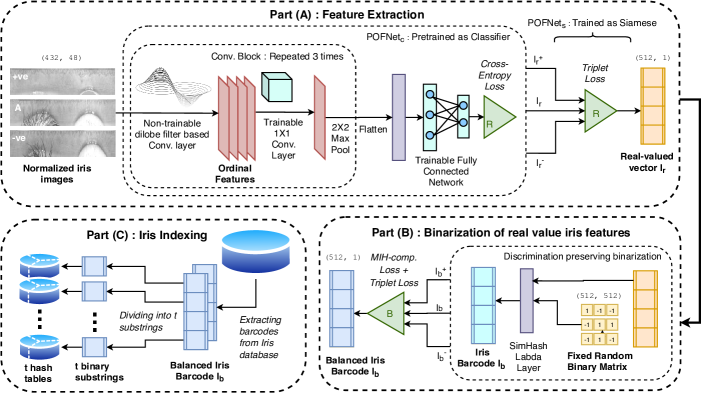
Due to the involvement of a large number of training parameters, often training a deep network is a cumbersome job. Very recently, LBP [15] based CNN network is proposed for face recognition in which most of the filters are fixed to reduce the computational complexity of the deep network. This inspired us to use an amalgam of traditional iris domain knowledge along with deep learning. Thus, for learning robust iris features, we have constructed a deep network based on patch level ordinal features (POFNet). It is well established in literature [26] that ordinal measures among neighboring image pixels exhibit some sort of stability under varying illumination conditions. Ordinal measures encode qualitative information rather than its quantitative values. Thus, in the designing of POFNet, most of the filters are made non-trainable (fixed) which are based on patch level ordinal filters, and to learn the best possible combination of these non-trainable filter outputs, 1*1 trainable conv is used. Once the robust real-valued iris features are obtained, the next step is to binarized them for effective hashing. For binarization, we have proposed a discrimination preserving binarization (DPB) layer. Figure.2 provides a general overview of the proposed methodology, while the below subsections explain it in more detail.
(A) Patch-level ordinal features(POFNet): Due to the various challenging issues suffered by the iris recognition system, matching is mostly performed on the normalized iris-image rather than on original iris-image. Thus, in our work, we have used normalized iris images, which are segmented first by using the algorithm proposed by [25] and later normalized by using an algorithm proposed by [9]. For learning robust iris features, we have constructed a deep network based on patch level ordinal features (POFNet). The advantage of dilobe ordinal filters (DOF) in iris recognition has been well established by [26]. DOF has a positive and negative Gaussian lobe. It is specifically designed in terms of orientation, scale, location, and distance to measure the ordinal relationship between iris images. It works in a patch-wise manner, comparing one patch with other and thus extracting domain specific highly textural iris features. Mathematically, a dilobe filter can be represented as:
| (1) |
where and , used to make zero-sum of the dilobe filter. The 2-D vector represents the spatial location with and denote the mean and scale of positive and negative 2D-Gaussian filter. For more details kindly refer [26].
Network specifications:
| Layer Name | Output Shape |
|---|---|
| Input Layer | (48, 432, 1) |
| X Dilobe Conv. — ReLU Activation | (48, 432, 8) |
| X Conv. Layer — ReLU Activation | (48, 432, 1) |
| Batch Normalization | (48, 432, 1) |
| X Dilobe Conv. — ReLU Activation | (48, 432, 16) |
| X Conv. — ReLU Activation | (48, 432, 1) |
| X Max-pooling (stride=2) | (24, 216, 1) |
| Batch Normalization | (24, 216, 1) |
| X Dilobe Conv. — ReLU Activation | (24, 216, 32) |
| X Conv. — ReLU Activation | (24, 216, 1) |
| X Max-pooling (stride=2) | (12, 108, 1) |
| Batch Normalization | (12, 108, 1) |
| Dense — ReLU Activation | (256) |
| Dense — ReLU Activation | (512) |
The proposed POFNet consists of three non-trainable dilobe convolution layers(DCL), each composed of fixed () filters of varying number, orientation and scale. Max pooling is mainly done to help circumvent over-fitting by providing an abstracted form of the representation. In the first DCL we have not used max pooling because initially we want to retain all the values of the feature map so that subsequent layers can get maximum information and can extract highly discriminative iris features. Afterwards, we have used max-pooling to provide basic translational invariance and reduce the dimensions of the features.
Network justifications: We have extracted patch-level ordinal features which are more focused on local areas and thus can better represent the local structure of iris. Furthermore, they help in extracting robust iris features [26]. Moreover, the usage of Conv helps in learning the best non-linear combination of patch-level ordinal features. For deciding the network parameters, we have used the domain knowledge [26] and verified it experimentally.
(B) Network training strategy: We have trained our network end-to-end modularly. We have used Python augmentor library [6] for data augmentation and used operations like random rotation, zooming, and random distortion. As shown in Part(A) Figure.2, we have first pre-trained our network as a classifier using cross-entropy loss and then applied triplet loss as defined in [24] using a Siamese architecture.
Triplet based training(TT): Let the network embeds an iris image as . In triplet loss the goal is to ensure that the iris image (anchor) of a particular person is close to all iris images (positive) extracted from the same person but captured at different times and at the same time far apart from iris image (negative) extracted from all the other persons. Thus, the objective is:
| (2) |
here is margin. Let is the total number of possible triplets in the training set then the overall loss function is defined as:
| (3) |
For effective network training we have used dynamic adaptive margin with hard negative mining as defined in [27].
Hard negative mining: random selection of triplets can easily ignore challenging one and thus can degrade the network performance. A triplet is said to be hard when the distance (between negative, anchor embedding) and (between positive, anchor embedding) is less than the margin (). To compute such embeddings is difficult. Thus, while making a batch, we randomly choose triplets, and only those triplets are chosen, which satisfies the following condition:
| (4) |
Dynamic adaptive margin: as the training progress, the number of suitable triplets decreases due to a decrease in and an increase in . To circumvent this situation, we increase the margin() by 0.05 after the number of hard triplets become less than 10% of the total mined triplets.
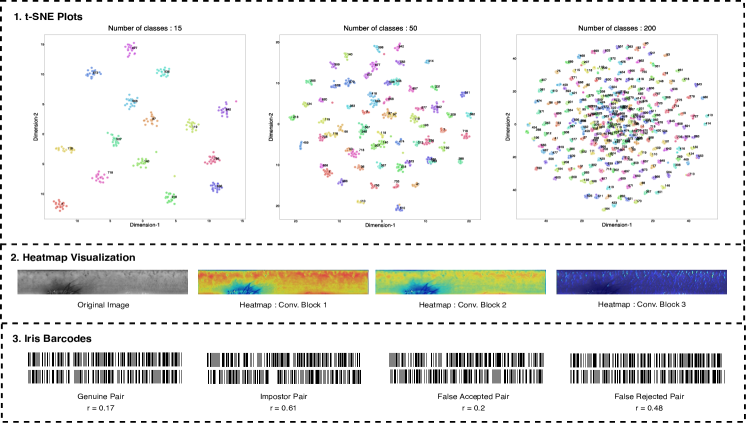
Feature visualization: t-SNE plots and heat-maps are used for visualizing the network. It is clearly evident from Row1 Figure.3 that triplet loss with adaptive margin is helping in clustering similar class samples together. Further, with the increase in the number of classes, the distance between the distinct classes decreases as expected, and most of them fall in the center depicting a shape of a 2-D Gaussian. We have also analyzed the heat-maps generated through our network, as shown in Row2 Figure.3. It is evident from Figure.3 that our network is paying attention to the highly textural iris micro-structures which are highly encoded and are less interpretable.
2.2 Discrimination preserving binarization
Voluminous datasets quickly strain memory and make disk access slow. Thus, it is highly desirable to develop search methods whose time and space complexity do not blow up with the input dimension and simultaneously designing a mapping strategy that maps high dimensional feature descriptors to a compact but discriminative representation. One possible solution is to use binary feature descriptors that not only fits quite well with the existing hamming ball based hashing strategies but also maximizes the information content of each bit. This inspired us to use binarized iris features for hashing purposes instead of using real-valued iris features extracted from our network. For that, we have designed a lambda layer named as discrimination preserving binarization layer (DPB Layer) performing signed random projection (SimHash [7]), as shown in Part(B) of Figure.2. Using SimHash [7] we convert real valued iris features say into iris bar codes (binary feature) say as follows:-
We generates a random vector , where each component is generated from with equal probability (i.e ), and stores only the sign of the projected data. That is,
| (5) |
For a pair of vectors , due to [12] we have the following guarantee
where . We repeat the above hashing experiments times and obtain their signature binary vectors . The angular similarity between two real valued Iris features can be computed using the hamming distance between their respective Iris bar codes using the following equation (due to [7]).
| (6) |
SimHash [7] preserves the angular distances between real-valued iris feature, which can be estimated from their respective iris bar codes due to Equation 6. Discriminative preserving property is also depicted by iris barcodes of genuine pairs and imposter pairs shown in Row3 Figure.3. This is the reason for using it to convert real-valued feature vectors into binary forms instead of directly learning binary descriptors from the deep network.
2.3 Indexing structure for binarized iris features
Naive approach for claiming the identity of the query subject is to search the entire database. However, when the database is voluminous, the processing time grows linearly with its size. Thus, it is important to search for strategies that grow sublinear instead of linear in terms of time with database size. Here, for indexing iris bar codes we have used four strategies: (1) Ball-tree [23] (2) Multi-Index Hashing(MIH) [22] (3) MIH optimized(4) MIH.
(A) Multi-Index hashing: Most of the existing deep learning-based methods for hashing aims at improving the performance in terms of hit rate and penetration rate but gives less emphasis on the computational complexity which is essential for real-time retrieval. Multi index hashing (MIH) aims at improving the time complexity while maintaining the performance.
General: It works as follows in our case:
[1] During enrollment for creating a database, multiple hash tables are built. Each hash table corresponds to the disjoint subset of iris barcode i.e. . Here the barcodes are indexed times into different hash tables as shown in Part(C) Figure.2.
[2] During authentication given a query iris image say , first step is to obtain iris bar code corresponding to it, and further, it is divided into disjoint substring. In our experimentation, for bit iris bar code we have divided it into disjoint substrings. This setting is empirically set and experimentally verified. Then MIH searches each substring hash table that is within a hamming distance of to find neighbors of say .
[3] Since the MIH considers only the substring not the complete barcode, all the elements in are not true neighbors of . The last step is to check for true neighbors by checking the complete binary string.
Optimized variant of Multi-Index hashing:
To further improve the performance of MIH, we have proposed a variant of MIH, as described in Algorithm 1.
(B) Indexing reconcilable iris bar code generation: It has been proved that the MIH time complexity is sub-linear [22] when the binary codes are distributed uniformly. In the case of MIH r-neighbor candidates are detected first and then in the next step detected r-neighbor candidates are pruned to find the true r-neighbor candidates. In this scenario, the number of r-neighbor candidates is always greater than the true r neighbors candidates. Thus, the computational time complexity can be reduced if the number of r-neighbors is actually equivalent to true r-neighbors. It has been proven [22] that this can be done when the hamming distance of each corresponding sub-string pair is equal for any two binary strings, and is equal to . Where is the full hamming distance between the two vectors, and is the number of sub-strings. [18]. We introduce a new loss function :-
| (7) |
where r´= , and represent the th substrings of hash vectors and and represents the cosine distance between any two vectors and . For ease of optimization, we replace integer constraints in DPB layer with range constraints using tanh, which makes hash vectors real-valued, as suggested in [19]. For the purpose of training, we have used loss in addition with Triplet loss with loss having of the total weightage whereas, for indexing, we have used our optimized MIH approach to fetch candidates after the network is trained and named it as MIH. As depicted in point 3 of Figure.3) iris barcodes are generated by replicating 1D-iris binary code bits into the columns.
2.4 Iris barcode-based retrieval
During the identification when an image is queried to the database, all the images that have close proximity (in terms of hamming distance in barcode space) with the queried image is retrieved from the database as follows:
[1] Given a query iris image
firstly extract its binarized features through our end to end network comprising of POFNet and discrimination preserving binarization (DBP) layer, which is trained using triplet loss and loss.
[2] Once binarized features are obtained, traverse the hash table built by using any indexing strategies such as Ball-tree, MIH, optimized MIH, or MIH to retrieve r-neighbors of the given query image.
[3] Compare the query image with retrieved r-neighbors.
[4] Return the probable matches.
3 Experimental analysis
This section is focused on demonstrating the performance of the proposed methodology on different data sets considered. The detailed explanation about the database specifications, experimental setup, along with result analysis, is presented in the following subsections.
3.1 Database specification
We have tested our proposed methodology on four datasets (1) CASIA Lamp [2] (2) CASIA-V3 Interval [1] (3) IITD-V1 Iris dataset [17] (4) IITK Iris dataset. Out of all these four datasets, all datasets are publicly available except the IITK dataset. The specification of the Table 2 shows the detail description of the various dataset used in our experimentation work along with the number of queries and stored images corresponding to each dataset. It should be noted that stored images act as training images while training the deep architecture (POFNet).
| IITK | Interval | IITD | Lamp | |
| Total images | ||||
| No. of classes | ||||
| Images per class | to | |||
| Stored images | ||||
| Query images | ||||
| Strip size | ||||
| Genuine matching | ||||
| Imposter matching |
3.2 Experimental setup
POFNet feature extraction network is implemented in Python using Keras [8] library. For evaluating the proposed indexing mechanism and for training the network, a PC having Xenon (R) processor with GB RAM and GB on card RAM on NVIDIA Tesla K40C GPU has been used.
Experimental protocol: Since there is no standard training and testing protocol associated with the datasets considered. We have used the experimentation protocol as defined in the current state-of-the-art [5], in which of the dataset is used for training the network and rest for testing. (It should be noted that this dataset partitioning is not subject independent). For analyzing the indexing performance, we have used three different bit vector sizes i.e., , , and , respectively, but while reporting the performance, we have used only bit vectors (as it is performing best). For analyzing the performance of real-valued features extracted by the POFNet, performance comparison is done in terms of EER (Equal Error Rate), FAR (False Acceptance Rate), FRR (False Rejection Rate), DI (Decidability Index), Recall and Precision. For analyzing the performance of iris barcodes, we have used EER, FAR, FRR and DI. Further, for analyzing the performance of iris indexing, hit-rate and penetration rate have been used. For details on performance parameters refer [5].
| Lamp | Interval | IITD | IITK | |||||
| R | B | R | B | R | B | R | B | |
| FAR% | 1.50 | 1.49 | 2.54 | 2.76 | 1.11 | 1.33 | 1.83 | 1.93 |
| FRR% | 1.45 | 1.56 | 2.53 | 2.77 | 1.12 | 1.34 | 1.83 | 1.93 |
| EER% | 1.48 | 1.54 | 2.53 | 2.76 | 1.11 | 1.33 | 1.83 | 1.93 |
| DI | 1.40 | 1.34 | 2.26 | 1.85 | 3.64 | 2.87 | 2.30 | 2.01 |
3.3 Experimental results
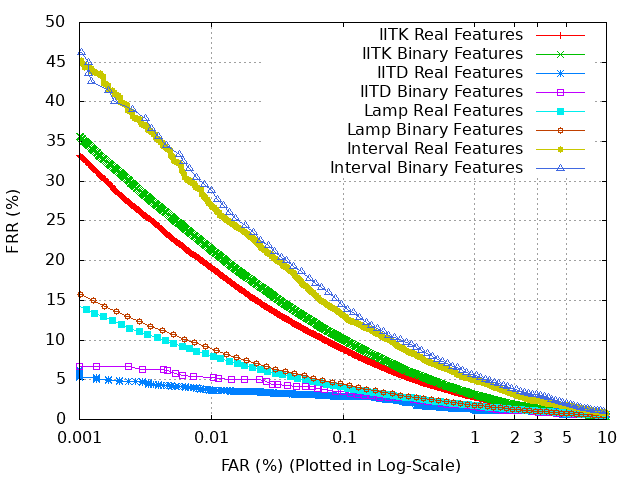
For experimentally validating the performance of our proposed approach, we have evaluated recognition as well as indexing performance of the proposed technique over four public datasets. Table 3 shows the recognition performance of real-valued feature vectors extracted from POFNet and recognition performance of iris barcodes obtained after binarizing real-valued feature vectors . It is indicated by Table 3 that once the real value feature vectors are binarized to form iris barcodes, the recognition performance does not degrade conspicuously (justified discrimination preserving assurance). Figure.4 shows the ROC curve on various datasets depicting the trade-off between real-valued iris features and binarized features. It is evident that iris barcodes are close to real value feature vectors (in terms of discrimination) for every dataset.
Recognition performance comparative analysis: To the best of our knowledge [5] is the current state-of-the-art iris indexing paper. Here, in this state-of-art [5] paper recognition performance is evaluated with the same training and testing protocol as ours, but for five different types of feature descriptors and EER is evaluated for different types of segmentation errors separately. Thus, for comparative analysis, we have taken their average. Table 4 shows the comparative analysis; it is clearly evident that our method outperforms the current-state-of-art [5] in terms of EER for both the datasets and comparable results for other performance parameters. Although for Interval dataset [5] yields better recall and precision than ours but it should be noted that recall and precision as individuals are not a good measure for deciding the accuracy of a biometric system. In biometrics, we have number of imposter attempts several times greater than number of genuine attempts, but the precision term actually measures the probability of correct detection of genuine samples, it is more focused towards genuine class and thus, not affected by presence of large number of imposter matching. Hence, EER should be looked upon which depends on both FAR as well as on FRR.
| Method | Dataset | Parameter | ||
|---|---|---|---|---|
| EER% | Recall | Precision | ||
| Ours | Interval | 2.53 | 0.9381 | 0.9512 |
| IITD | 1.11 | 0.9777 | 0.9787 | |
| [5] | Interval | 2.91 | 0.973006 | 0.979804 |
| IITD | 2.81 | 0.971842 | 0.971878 | |
| Lamp | Interval | IITD | IITK | |||||||||
| HR | PR | Time(s) | HR | PR | Time(s) | HR | PR | Time(s) | HR | PR | Time(s) | |
| Ball-tree | 99.82 | 0.87 | 600.5 | 98.72 | 3.06 | 1.04 | 98.66 | 1.21 | 1.05 | 99.56 | 1.01 | 1039.6 |
| MIH | 99.82 | 0.83 | 1594.2 | 99.00 | 3.06 | 27.75 | 98.66 | 1.21 | 7.80 | 99.56 | 0.87 | 3048.5 |
| Opt. MIH | 99.82 | 0.63 | 186.7 | 98.73 | 2.40 | 5.12 | 98.66 | 1.11 | 1.53 | 99.56 | 0.69 | 342.56 |
| MIH | 99.82 | 0.62 | 171.7 | 98.73 | 2.11 | 5.00 | 99.11 | 1.18 | 1.36 | 99.56 | 0.64 | 296.61 |
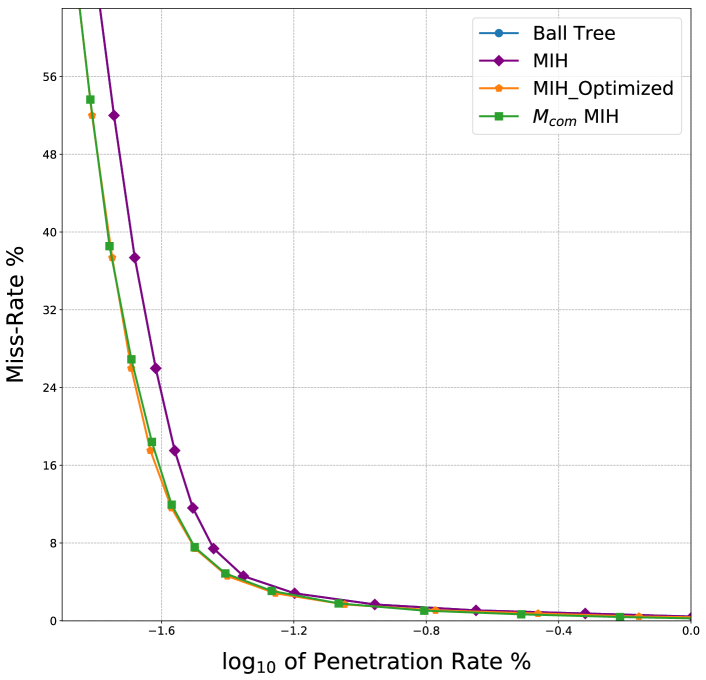
Indexing performance analysis: It is evaluated in terms of hit rate and penetration rate. Table 5 indicates hit rate(HR), penetration rate(PR) and query time taken in seconds for various datasets. It should be noted that for all the datasets, HR is above while PR is below . Moreover, while all the indexing techniques give almost similar HR, the PR is quite different. Furthermore, PR is quite high in the case of Ball-tree and naive MIH for all the datasets but almost similar for optimized MIH and MIH as depicted in Figure.5. The real power of indexing can be evaluated on large datasets only. In our case, IITK is the largest dataset, and by considering MIH indexing strategy PR is almost less than the naive MIH and less than the Ball-tree method as shown in Table 5.
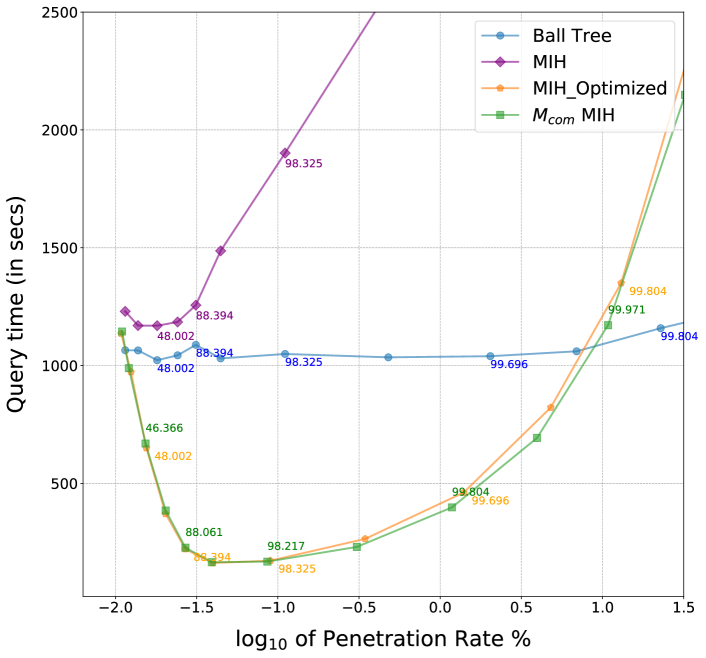
Indexing performance time analysis: Figure.6 depicts the relation between query time and penetration rate. The supremacy of is evident as it outperforms all the other approaches both in terms of query time and hit rate. It can be observed for a specific range of penetration (from to ), Optimized MIH, and MIH takes significantly less time than Ball Tree and naive MIH with excellent accuracy. All MIH approaches have additional computational costs and work best with large data. The additional computational costs can be used to justify the initial decrease in query time for Optimized MIH and MIH approaches with an increase in penetration rate.
Indexing performance comparative analysis: Table 6 compares our results with some state-of-the-art methods. It should be noted that in all the cases, different datasets along with different training and testing strategy is used. Although current state-of-the-art paper [5] uses the same training and testing strategy, but unlike our approach they have not used the entire testing dataset as query set.
4 Conclusion
In this paper, we have proposed a deep network based on domain knowledge using dilobe ordinal filtering (POFNet) to extract patch level iris features. To binarize iris features, we have introduced a lambda layer based on SimHash such that discrimination between generated binary bits is preserved. Further, we have introduced a new loss function to balance binary bits that make it compatible with the Multi-Index-Hashing technique. To the best of our knowledge, this is the first attempt in designing an end-to-end network for iris indexing. Further, the experimental results depict the efficacy of our proposed approach.
References
- [1] Casia iris image database version 3.0. ”http://biometrics.idealtest.org/dbDetailForUser.do?id=3”.
- [2] Casia iris lamp database. ”http://biometrics.idealtest.org”.
- [3] Malaysia identity card. ”https://www.jpn.gov.my/en/informasimykad/introduction-to-mykad/”.
- [4] Unique identification authority of india. ”https://uidai.gov.in/”.
- [5] T. Ahmed and M. Sarma. Hash-based space partitioning approach to iris biometric data indexing. Expert Syst. Appl., 134:1–13, 2019.
- [6] M. D. Bloice, C. Stocker, and A. Holzinger. Augmentor: An image augmentation library for machine learning. CoRR, abs/1708.04680, 2017.
- [7] M. Charikar. Similarity estimation techniques from rounding algorithms. In Proceedings on 34th Annual ACM Symposium on Theory of Computing, Montréal, Québec, Canada, pages 380–388, 2002.
- [8] F. Chollet et al. Keras. https://github.com/fchollet/keras, 2015.
- [9] J. Daugman. How iris recognition works. In Proceedings of the International Conference on Image Processing, ICIP, pages 33–36, 2002.
- [10] P. Drozdowski, C. Rathgeb, and C. Busch. Bloom filter-based search structures for indexing and retrieving iris-codes. IET Biometrics, 7(3):260–268, 2018.
- [11] K. M. Emad Taha Khalaf, Muamer N Mohammad. Robust partitioning and indexing for iris biometric database based on local features. IET Biometrics, 7(6):589–597, 2018.
- [12] M. X. Goemans and D. P. Williamson. Improved approximation algorithms for maximum cut and satisfiability problems using semidefinite programming. J. ACM, 42(6):1115–1145, 1995.
- [13] F. Hao, J. Daugman, and P. Zielinski. A fast search algorithm for a large fuzzy database. IEEE Trans. Information Forensics and Security, 3(2):203–212, 2008.
- [14] U. Jayaraman, A. K. Gupta, and P. Gupta. An efficient minutiae based geometric hashing for fingerprint database. Neurocomputing, 137:115–126, 2014.
- [15] F. Juefei-Xu, V. N. Boddeti, and M. Savvides. Local binary convolutional neural networks. In IEEE Conference on Computer Vision and Pattern Recognition, CVPR , Honolulu, HI, USA, pages 4284–4293, 2017.
- [16] A. Kuehlkamp and K. W. Bowyer. Found a good match: Should I keep searching? - accuracy and performance in iris matching using 1-to-first search. Image Vision Computing, 73:17–27, 2018.
- [17] A. Kumar and A. Passi. Comparison and combination of iris matchers for reliable personal authentication. Pattern Recognition, 43(3):1016–1026, 2010.
- [18] H. Lai, Y. Pan, S. Liu, Z. Weng, and J. Yin. Improved search in hamming space using deep multi-index hashing. IEEE Trans. Circuits Syst. Video Techn., 29(9):2844–2855, 2019.
- [19] H. Lai, Y. Pan, Y. Liu, and S. Yan. Simultaneous feature learning and hash coding with deep neural networks. In IEEE Conference on Computer Vision and Pattern Recognition, CVPR 2015, Boston, MA, USA, June 7-12, 2015, pages 3270–3278, 2015.
- [20] R. Mukherjee and A. Ross. Indexing iris images. In 19th International Conference on Pattern Recognition (ICPR), Tampa, Florida, USA, pages 1–4, 2008.
- [21] P. R. Nalla and A. Kumar. Toward more accurate iris recognition using cross-spectral matching. IEEE Transactions on Image Processing, 26:208–220, 2017.
- [22] M. Norouzi, A. Punjani, and D. J. Fleet. Fast exact search in hamming space with multi-index hashing. IEEE Trans. Pattern Anal. Mach. Intell., 36(6):1107–1119, 2014.
- [23] S. Omohundro. Five balltree construction algorithm, 1989. Tech. rep., ICSI Berkeley.
- [24] F. Schroff, D. Kalenichenko, and J. Philbin. Facenet: A unified embedding for face recognition and clustering. In IEEE Conference on Computer Vision and Pattern Recognition, CVPR, pages 815–823, 2015.
- [25] S. Shah and A. Ross. Iris segmentation using geodesic active contours. IEEE Trans. Information Forensics and Security, 4(4):824–836, 2009.
- [26] Z. Sun and T. Tan. Ordinal measures for iris recognition. IEEE Trans. Pattern Anal. Mach. Intell., 31(12):2211–2226, 2009.
- [27] D. Thapar, G. Jaswal, A. Nigam, and V. Kanhangad. Pvsnet: Palm vein authentication siamese network trained using triplet loss and adaptive hard mining by learning enforced domain specific features. In 5th IEEE International Conference on Identity, Security, and Behavior Analysis, ISBA, Hyderabad, India, pages 1–8, 2019.
- [28] Z. Zhao and A. Kumar. Towards more accurate iris recognition using deeply learned spatially corresponding features. In ICCV, pages 1–10, 2017.