2.5cm2.5cm1.5cm1.5cm
Fast simulation of a forward detector at 50 and 100 TeV proton-proton colliders
Veronika Chobanova, Diego Martínez Santos, Claire Prouve, Marcos Romero Lamas
Instituto Galego de Física de Altas Enerxías (IGFAE), Universidade de Santiago de Compostela, Santiago, Spain
We evaluate the performance of an LHCb-like detector using a fast simulation of proton-proton collisions at center-of-mass energies of 50 and 100 TeV. The study shows that detector acceptances and resolutions could be similar to those at the LHC. Together with the increase of production cross-sections of light particles with higher energy, such a hypothetical experiment could reach unprecedented sensitivities in flavor observables.
1 Introduction
Hadron colliders with energies well above the LHC have been proposed. Notable examples are SppC [1] and FCC-hh [2]. In this paper, we evaluate the acceptances and resolutions that a forward detector similar to the LHCb Upgrade would have in those conditions. In Section 2 we discuss the proton-proton collision simulation. In Section 3 we discuss the detector simulation. In Sections 4 and 5 we discuss the efficiencies and resolutions obtained in our simulation for the different center-of-mass energies of the proton-proton collisions. Conclusions are drawn in Section 6.
2 Sample generation
Proton-proton collisions are simulated with Pythia 8.1 [3] at center-of-mass energies of 13, 50, and 100 TeV where, as expected, the higher the energy, the larger the production cross-sections. This increase, as obtained with Pythia, is shown in Table 1. The table also shows the anti-particle to particle production ratio. The four-momenta of the particles of interest that have been produced by Pythia are stored in a file for further processing.
| Particle | |||||
|---|---|---|---|---|---|
| 2.5 | 3.8 | 1.0 | 1.0 | 0.99 | |
| 7.2 | 14 | 1.6 | 0.97 | 0.98 | |
| 3.1 | 5.1 | 0.99 | 0.99 | 0.99 | |
| 3.1 | 5.1 | 0.99 | 1.0 | 1.0 | |
| 3.2 | 5.4 | 1.0 | 1.0 | 0.99 | |
| 3.0 | 4.1 | 0.89 | 0.89 | 0.90 | |
| 1.6 | 2.0 | 0.98 | 0.99 | 0.99 | |
| 1.6 | 2.0 | 0.97 | 0.98 | 0.99 | |
| 1.5 | 1.9 | 0.86 | 0.90 | 0.92 | |
| 1.5 | 1.9 | 0.89 | 0.93 | 0.94 | |
| 1.6 | 2.1 | 0.98 | 0.95 | 0.96 | |
| 1.6 | 2.0 | 0.96 | 0.97 | 0.97 | |
| 1.6 | 2.0 | 0.95 | 0.96 | 0.97 | |
| 2.2 | 3.1 | 1.0 | 1.0 | 1.0 | |
| 2.1 | 2.9 | 0.90 | 0.93 | 0.94 |
Subsequently, parent particles are decayed following either phase space or custom EvtGen [4] implementations for more detailed decay models (such as ). No bremsstrahlung is included in the generation of the decays. The procedure is performed for center-of-mass energies of 13, 50 and 100 TeV. The generated samples are listed in Table 2111We use DS, for Dark Sector subscript to avoid confusion between the Dark Sector particle and the charmonia states.
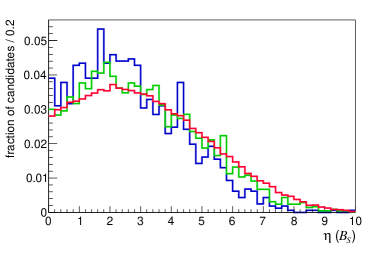
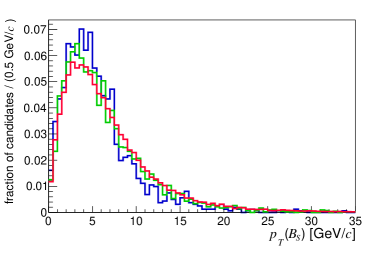
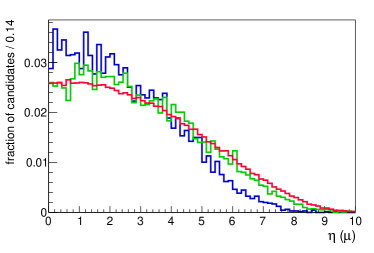
Figure 1 shows the transverse momentum distributions and the pseudorapidty distributions of , and mesons directly produced in our simulated collisions. Figure 2 shows the pseudorapity of daughter particles from our simulated and decays. The LHCb acceptance is highest at a pseudorapidity between 3 and 5.


| Decay | 13 TeV | 50 TeV | 100 TeV |
|---|---|---|---|
| 41 k | 135 k | 228 k | |
| 17 k | 30 k | 30 k | |
| 4k | 12k | 20k | |
| 4k | 12k | 20k | |
| 138 k | 247 k | 3.5 M | |
| 138 k | 247 k | 3.5 M | |
| 138 k | 247 k | 3.5 M | |
| 74 M | 100 M | 100 M | |
| 2 k | 4 k | 67 k |
3 Detector simulation
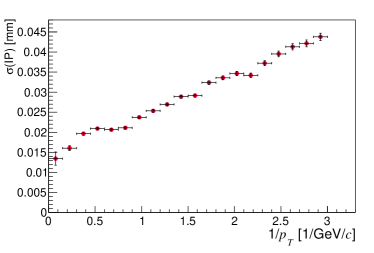
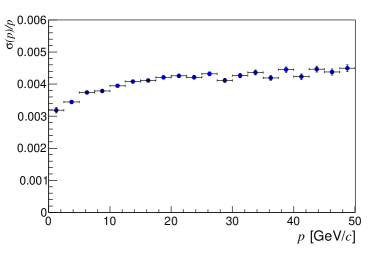
The detector simulation is an improved description of the fast simulation used in Ref. [6], adding multiple scattering and a more accurate description of the downstream tracking system. The simulated detector elements are the RF foil, the VeloPix (VP) stations, the Upstream Tracker, the Magnet, and the SciFi [7, 8], and are implemented in python2. No calorimetry or particle identification is simulated in our study. The particles generated by the procedure described in Section 2 are passed through detector elements and yield hits where appropriate. The set of hits is then passed to a track fit algorithm which calculates the track slopes at origin, the momentum, and a point in the early stage of the particle trajectory. The simulation also neglects occupancy effects and hit inefficiency. Benchmark figures of detector performance are shown in Figure 3. The figures can be compared to the equivalent in the current full detector simulation (see Figures 30-33 in Ref. [7] and Figure 4.10 in Ref. [8]). It can be seen that the impact parameter resolution and momentum resolution are well reproduced at leading order, both in terms of detector resolution and in terms of multiple scattering.
4 Evolution of detector efficiency with energy
The accelerator energy changes the angular distribution of the produced particles and hence the probability for them to fall within the detector angular acceptance. In addition, for those particles with relatively long lifetimes, the different boost can slightly modify the fraction of those that decay within the acceptance of the vertex detector. To quantify the effect, in Table 3 we show the efficiency as a function of accelerator energy (relative to 13 TeV) for several benchmark decays from -, - and -hadrons as well as for . It can be seen that there is a small gain of approximately in the acceptance for -hadron decays when going to a high energy, while there is a small drop for -hadron decays due to a higher fraction of them decaying outside of the acceptance of the vertex detector.
| Decay | ||||
|---|---|---|---|---|
| 1.1 | 1.1 | 3.4 | 5.6 | |
| 1.2 | 1.3 | 3.9 | 6.8 | |
| 1.0 | 1.0 | 3.0 | 4.8 | |
| 1.1 | 1.1 | 3.3 | 5.1 | |
| 1.00 | 0.99 | 2.2 | 3.07 | |
| 0.97 | 0.94 | 2.13 | 2.91 | |
| 1.08 | 1.07 | 2.38 | 3.32 | |
| 1.08 | 1.10 | 2.38 | 3.41 | |
| (LL) | 0.89 | 0.84 | 1.4 | 1.7 |
| (DD) | 1.0 | 1.0 | 1.6 | 2.0 |
| 1.03 | 1.07 | 2.58 | 4.07 |
5 Evolution of detector resolutions with energy
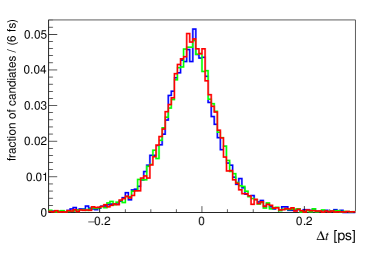
The detector resolution also depends on the momentum of the particles and hence has in average some dependency on the collision energy. In particular, the momentum resolution worsens with energy, while on the other hand the impact parameter resolution improves with it. The invariant mass resolution is a function of both of them, and hence it may improve or worsen depending on the decay under study. In Table 4 we show the mass resolution as a function of accelerator energy (relative to 13 TeV) for several benchmark decays from -, - and -hadrons as well as for . In addition to the mass resolution, the propertime resolution is also important as it helps separating signal from background originating from the proton-proton collision, but, more importantly, it dilutes the amplitude of the measured oscillation by the amount
| (1) |
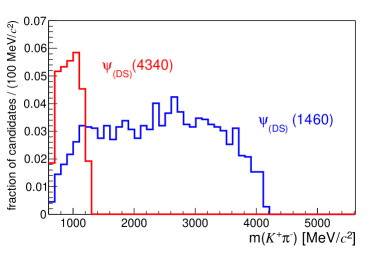
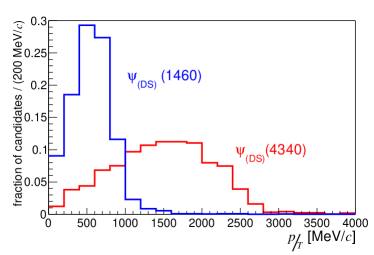
which is equivalent to a signal efficiency multiplicative factor of for measurements like in . However, as seen in Table 4, the changes in the propertime resolution are at the percent level and actually correspond to improved resolution. This is because the vertex resolution improves as momentum increases. Some distributions of mass and propertime resolution can be seen in Figure 4. In addition, flavor experiments also look for missing transverse energy signatures, to study decays with neutrinos, neutral pions, or search for dark sector particles. In Figure 5 we show some distinctive signatures for searches of dark sector particles. Larger boost and better decay vertex resolution lead to a better reconstruction of the missing transverse momentum. However, our studies showed no significant change in the distributions, due to the resolution being much smaller than the spread of the distribution.
| Decay | ||||
|---|---|---|---|---|
| 1.1 | 1.1 | 1.0 | 1.0 | |
| 1.1 | 1.1 | 0.97 | 0.94 | |
| 1.0 | 1.1 | 0.95 | 0.91 | |
| 1.0 | 1.1 | 0.91 | 0.85 | |
| 1.07 | 1.10 | 0.94 | 0.93 | |
| 1.02 | 1.03 | 0.98 | 0.96 | |
| 1.02 | 1.03 | 0.97 | 0.96 | |
| 1.04 | 1.06 | 0.95 | 0.95 | |
| (LL) | 1.0 | 1.0 | 0.94 | 0.91 |
| (DD) | 1.0 | 1.1 | 0.96 | 0.94 |
| 0.94 | 1.00 | 0.93 | 0.95 |

6 Conclusions
We presented the results of a simulation of proton-proton collisions at 13, 50 and 100 TeV recorded by a simplified implementation of an LHCb-like detector. We obtain a significant increase of the expected yield per with the center-of-mass-energy for several interesting flavor decays, at least ignoring occupancy effects. The detector resolutions are not significantly affected by the different boosts obtained in each center-of-mass energy.
7 Acknowledgements
This work has received financial support from Xunta de Galicia (Centro singular de investigación de Galicia accreditation 2019-2022), by European Union ERDF, and by the “María de Maeztu” Units of Excellence program MDM-2016-0692 and the Spanish Research State Agency. Veronika Chobanova is supported by MCINN (Spain) through the Juan de la Cierva-incorporación program with grant IJCI-2017-32371. We would like to thank M. Escudero and G. Alonso-Álvarez for discussions on dark sector signatures.
References
- [1] J. Tang et al. Concept for a Future Super Proton-Proton Collider. arXiv:1507.03224.
- [2] A. et al. Abada. FCC-hh: The Hadron Collider. Eur. Phys. J. Spec. Top., 228:755–1107, 2019.
- [3] Torbjorn Sjostrand, Stephen Mrenna, and Peter Z. Skands. A Brief Introduction to PYTHIA 8.1. Comput. Phys. Commun., 178:852–867, 2008.
- [4] D. J. Lange. The EvtGen particle decay simulation package. Nucl. Instrum. Meth., A462:152–155, 2001.
- [5] Gilly Elor, Miguel Escudero, and Ann Nelson. Baryogenesis and Dark Matter from Mesons. Phys. Rev. D, 99(3):035031, 2019.
- [6] A.A. Alves Junior et al. Prospects for Measurements with Strange Hadrons at LHCb. JHEP, 05:048, 2019.
- [7] LHCb VELO Upgrade Technical Design Report. 11 2013.
- [8] LHCb Tracker Upgrade Technical Design Report. 2 2014.