[1]
\WithSuffix[1]#1.
Sigma Worksheet: Interactive Construction of OLAP Queries
Abstract.
The new generation of cloud data warehouses (CDWs) brings large amounts of data and compute power closer to users in enterprises. The ability to directly access the warehouse data, interactively analyze and explore it at scale can empower users to improve their decision making cycles. However, existing tools for analyzing data in CDWs are either limited in ad-hoc transformations or difficult to use for business users, the largest user segment in enterprises.
Here we introduce Sigma Worksheet, a new interactive system that enables users to easily perform ad-hoc visual analysis of data in CDWs at scale. For this, Sigma Worksheet provides an accessible spreadsheet-like interface for data analysis through direct manipulation. Sigma Worksheet dynamically constructs matching SQL queries from user interactions on this familiar interface, building on the versatility and expressivity of SQL. Sigma Worksheet executes constructed queries directly on CDWs, leveraging the superior characteristics of the new generation CDWs, including scalability.
To evaluate Sigma Worksheet, we first demonstrate its expressivity through two real life use cases, cohort analysis and sessionization. We then measure the performance of the Worksheet generated queries with a set of experiments using the TPC-H benchmark. Results show the performance of our compiled SQL queries is comparable to that of the reference queries of the benchmark. Finally, to assess the usefulness of Sigma Worksheet in deployment, we elicit feedback through a 100-person survey followed by a semi-structured interview study with 70 participants. We find that Sigma Worksheet is easier to use and learn, improving the productivity of users. Our findings also suggest Sigma Worksheet can further improve user experience by providing guidance to users at various steps of data analysis.
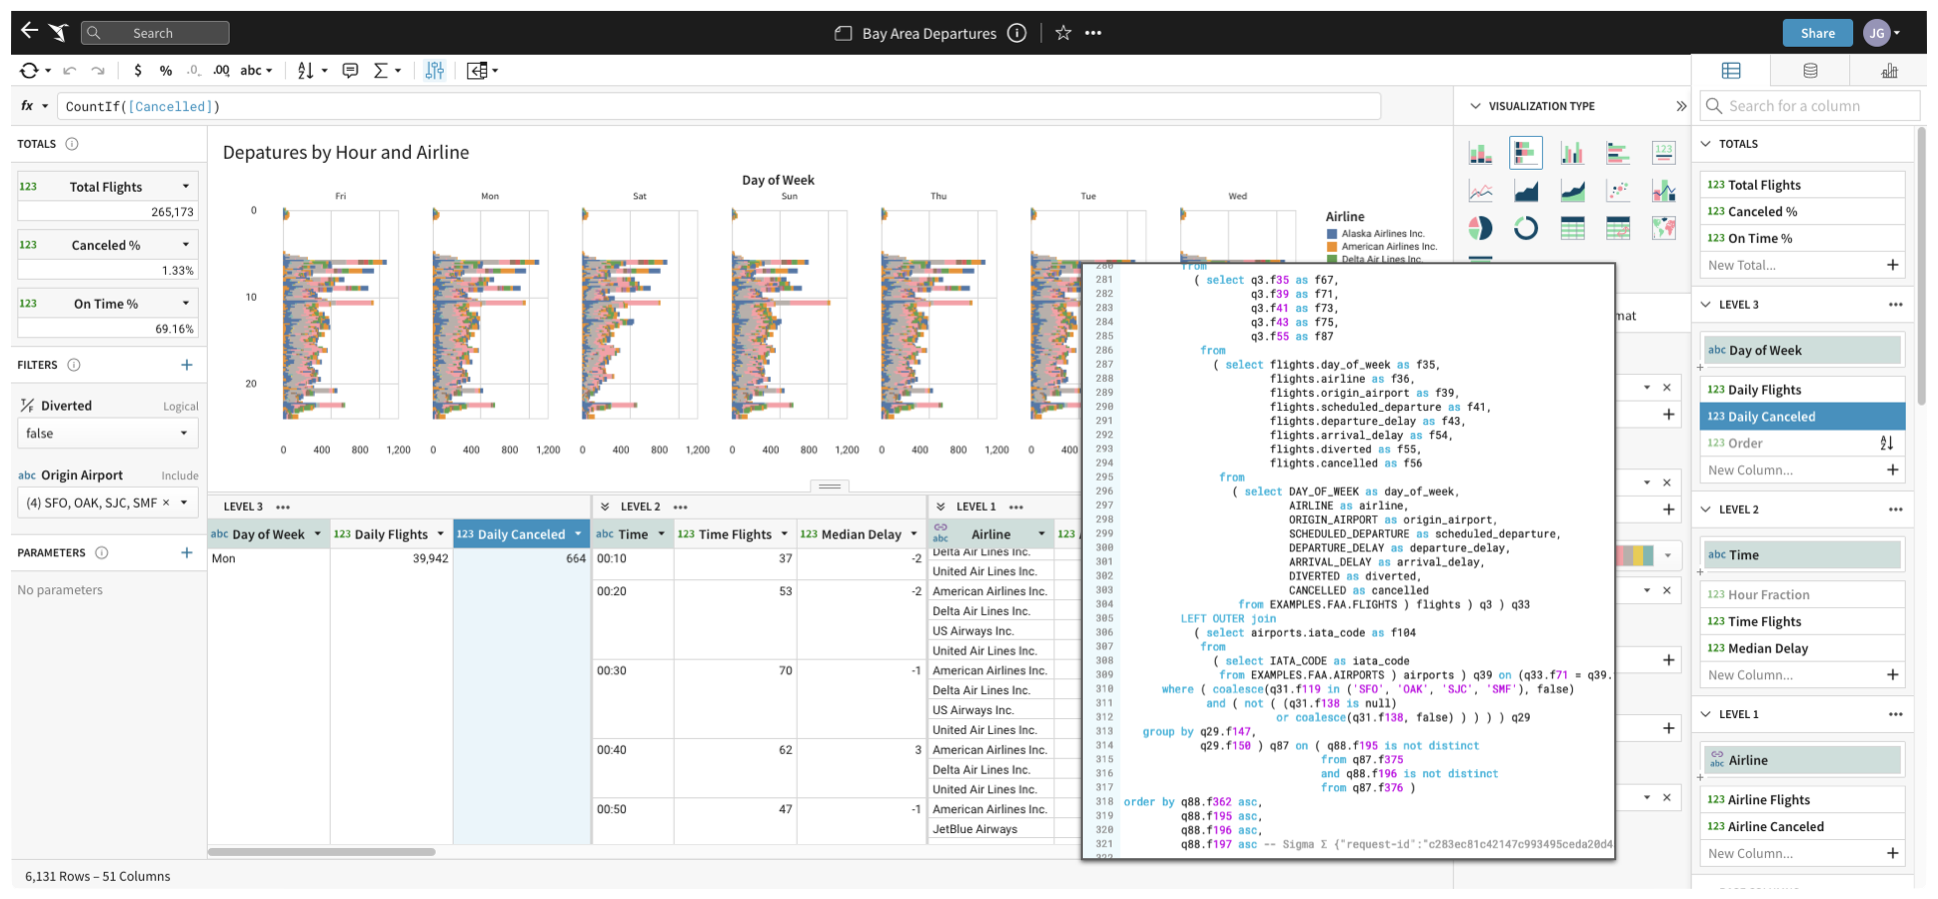 \DescriptionA screenshot of the Sigma Worksheet interface with an overlay of generated SQL code.
1. Introduction
More than twenty years have passed since the introduction of data warehousing (Devlin and Murphy, 1988; Inmon, 1992; Chaudhuri and Dayal, 1997), multidimensional data cubes (Harinarayan et al., 1996; Gray et al., 1997), and business intelligence (BI) tools optimized for these systems (e.g., (Aiken et al., 1996; Stolte and Hanrahan, 2000; Stolte et al., 2003)). In that time, a significant research and development effort has gone into improving the online analytical processing (OLAP) ecosystem. Traditional data warehouses were deployed in data centers on dedicated, optimized hardware (Inmon, 2005); modern data warehouses are Software-as-a-Service (SaaS) cloud systems (Dageville et al., 2016) that require users to do little more than load data, issue queries, and dial in the balance of speed-vs-cost. Similarly, traditional BI systems (Chaudhuri et al., 2011) for data exploration and visualization required up-front modeling in the data warehouse or specialized “analytics servers,” in order to interface with tools optimized for querying multidimensional data cubes. Many traditional BI systems such as Power BI (Microsoft, 2021), Tableau (Tableau, 2021), and QlikView (Qlik, 2021) have evolved to have significant improvements in user experience, interactivity, visualization, and dashboarding. While originally designed for on-premise use as dedicated applications, nowadays these systems invariably have cloud offerings, reflecting the trend towards enterprise cloud computing.
Cloud computing has dramatically increased the scale of information within enterprises of every size by reducing the cost of storage while increasing the elasticity. Analysts in these organizations find, however, themselves overwhelmed as they manage an ever growing set of data sources (Fivetran, 2020). A much larger population of business users (e.g., product managers, operations directors, customer success managers, marketing campaign managers, account managers, etc.), who have limited time or proficiency for writing queries, also wish to make use of this data without going through analysts. Although many of these users are comfortable doing analysis using spreadsheets, enterprise data often resides in a data warehouse, as it is often the only practical solution for companies to store billions of records from their numerous data sources with reliability and compliance guarantees. While many BI systems are well suited to these data sources, spreadsheets are not, suffering from limited scalability and expressivity (Bendre et al., 2015, 2018; Rahman et al., 2020). This requires spreadsheet users to invest in new skills to use, which can be difficult and time consuming to learn and productively use, or rely on BI analysts.
In this paper, we introduce Sigma Worksheet (Worksheet for short), an interactive SaaS system (Figure fig:teaser) that provides a scalable and expressive yet easy to use means to enable interactive, collaborative visual analysis on datasets that reside in cloud data warehouses (CDWs). The premise underlying the design of Sigma Worksheet is that supporting the data cube operations such as slicing, dicing, pivoting, roll-up, and aggregation through an intuitive spreadsheet-like direct manipulation interface would address the needs of both analysts and business users (Jagadish et al., 2007).
Sigma Worksheet is designed as a cloud application and optimized for analyzing data in CDWs It aims to effectively combine accessibility (ease of use and learning), expressivity, and scalability in order to support iterative visual data exploration of cloud scale data through ad-hoc transformations. To enhance accessibility, Worksheet integrates an easy-to-use, intuitive interface with affordances that have made spreadsheet applications successful (Nardi and Miller, 1990), including a simple expression language embedded in a table of values, easy references, easy refactoring and isolation of errors. Worksheet dynamically compiles data operations interactively specified through this interface into SQL queries, building on the versatility and expressivity of SQL. This doesn’t just enable expressivity on par with SQL but also amplifies users’ ability to generate complex queries that can be otherwise daunting to manually specify. Sigma Worksheet executes compiled queries on a CDW, directly leveraging the desirable properties of CDWs such as scalability, security (e.g., compliance with regulations such as HIPPA and GDPR), elasticity and reliability (Gupta et al., 2015; Dageville et al., 2016). This direct, interactive interface to the CDW differentiates Worksheet from the architecture of current BI systems. These can produce beautiful visuals but then be limited when users want to get to the “row level” data behind their dashboards or understand what their data means. Unlike spreadsheet applications, Sigma Worksheet enables users to explore billions of records or terabytes of data. In this sense, Sigma Worksheet is an accumulation of the decades-long ideas proposing to combine the accessibility of spreadsheet-like direct manipulation with the characteristics of database systems that enterprises rely on (Raman et al., 1999; Witkowski et al., 2003, 2005; Tyszkiewicz, 2010; Bakke et al., 2011; Bendre et al., 2015).
In summary, we contribute Sigma Worksheet (Figure 1), a new direct manipulation interface enabling visual interactive OLAP query construction111A demo video of Sigma Worksheet is available at: https://tinyurl.com/y2fssw5a.. We describe the design and implementation of Sigma Worksheet enabling an effective integration of accessibility, expressivity, and scalability. We also contribute a discussion on the evolution of our ideas and prototypes that led to the design of Sigma Worksheet, sharing our experiences and the lessons learned in the process. We demonstrate the expressivity of Worksheet through two use cases, cohort analysis and sessionization, on a dataset with about 200M records and we evaluate the performance of Worksheet generated SQL on the TPC-H benchmark. Lastly we evaluate Sigma Worksheet through a survey with 100 participants and a semi-structured interview study with 70 participants. We find that Sigma Worksheet improves the efficiency and effectiveness of their analysis and decision making cycles, irrespective of their previous exposure to SQL or databases. Our findings also suggest that users can benefit from machine guidance, particularly during onboarding, informing future iterations of Sigma Worksheet.
2. Iterations and Lessons Learned
Sigma Computing is a startup founded with a goal to make data within organizations more usable to its members. In exploring solutions to this problem, we built and studied many prototypes which led us to the current Sigma Worksheet. Below we discuss our earlier efforts along with lessons learned in two categories.
Automated Insights Initially we built several prototype analytic systems whose functionality might be summarized as “automatic query generation.” These required a semantic model of the data and so we experimented with different automatic and manual systems for constructing that model. For data ingestion we built integrations with several SaaS platforms.
As a test case we used sales and operational data from a large technology company and tried to automatically generate the reports that they were producing manually. We evaluated these results in interviews with the individuals who produced the original reports.
From this work we learned that (1) automatically producing valuable analyses for our customers was going to require a heavy investment in up-front modeling, which would make sales difficult and expensive; (2) building a high-quality integration for every data source a customer cared about was daunting for a small company; (3) capturing any company specific knowledge with automated methods proved difficult (e.g., negative sales amounts seemed interesting insight to convey since they were outliers, but they actually just represented equipment returns); and (4) our systems put the business user, along with their knowledge, on the sidelines. If our users saw something that looked wrong there wasn’t a practical way for them to correct or revise it, especially if they couldn’t understand how values shown to them were being derived.
Visually Programming Data Reflecting on these prototypes, we began exploring how to capture and automate the knowledge of business users. We observed that many contemporary analytics systems such as Tableau provided an interactive visual interface, but still required some coding proficiency to be useful in practice. It was our belief that a sharp drop-off from the visual interface to the programming layer hampers the productivity of end users. Every time the code needs a change, the business user becomes blocked on someone else who can update the code. In the worst case they might have to make do without that change, leading to incomplete analyses. Interviews with existing users of these systems confirmed this belief. As such, we asked ourselves: if we could tightly integrate code with a visual interface, could we enable business users to become programmers?
Motivated by this question, we implemented a series of prototype systems that presented data and code together, enabling users to manipulate both using an interactive visual interface. Our interfaces were “live” in the sense that they automatically refreshed values in response to changes, inspired by Bret Victor’s Learnable Programming(Victor, 2012) and electronic spreadsheets. We also drew ideas from data wrangling systems, including Wrangler (Kandel et al., 2011) and OpenRefine (OpenRefine, 2021), and end user code synthesis approaches such as Excel’s Flash Fill (Gulwani, 2011).
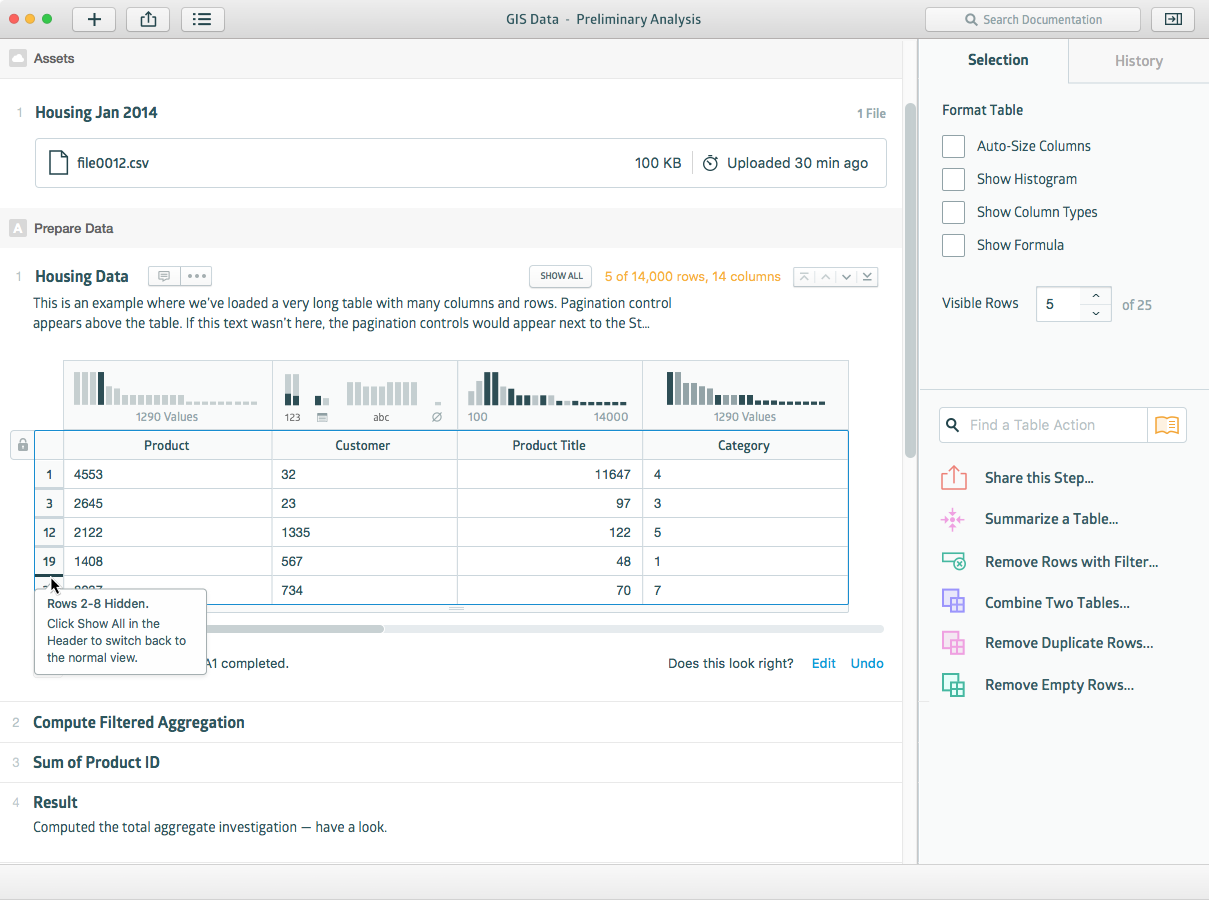
We experimented with several interface forms: a spreadsheet-like canvas, interactive histories of transformations against data, and notebook-like documents (Figure 2), similar to Jupyter (Pérez and Granger, 2007; Jupyter, 2021). We also experimented with two novel functional programming languages: first a simple record-based language, and later an array-based language. Both were influenced by Excel formulas and Microsoft’s M language. We investigated the usability of this platform with our own use-cases and with feedback from analysts and business users in our target markets.
From the development of this second category of prototypes, we learned (1) matching a live execution environment with an unconstrained programming language was difficult, as a small change in the code could lead to an arbitrarily large change in the data (and in turn the user’s view); (2) complex operations like join and grouping were difficult to integrate into a guided user interface, alongside arbitrary code; (3) potential customers were reluctant to entrust direct access to and storage of business data to a cloud-based organization with no reputation.
3. Design Considerations
After our iterations and experimentation summarized above, we set out to build Worksheet, our interactive query builder that would underpin Sigma. We were seeking a middle ground between the two types of systems we had previously explored, a highly-automated system with very limited interaction and a visual programming system. We identified five criteria to guide the design and development of Worksheet. These criteria are informed by what we learned from our earlier iterations discussed above, existing research and tools for data analysis (e.g. (Kandel et al., 2011; Victor, 2012) and in particular (Bakke and Karger, 2016)), and our experience in developing data systems over the years:
-
C1
Build on the data warehouse that customers already have. Avoid a lengthy ingest phase, endless 3rd-party integrations and data controller responsibility.
-
C2
Enable data experts and business users to collaborate in a shared language. The interface we offer for business users must bring the full power of the underlying database.
-
C3
Allow business users to share and automate their knowledge. The system must support composition and parameterization in a way that is understandable to all of our users.
-
C4
The query model must be a good match to a live visual interface. The user’s view must not change in unexpected ways when they are making edits and complex changes must be guided by purpose built interfaces.
-
C5
The query builder must be understandable and usable by any user who can use spreadsheet systems.
We now discuss the design and implementation of Worksheet. In our discussion, we refer back to the criteria introduced here as needed to indicate specific design and implementation choices that they motivated.
worksheet2
4. System Overview
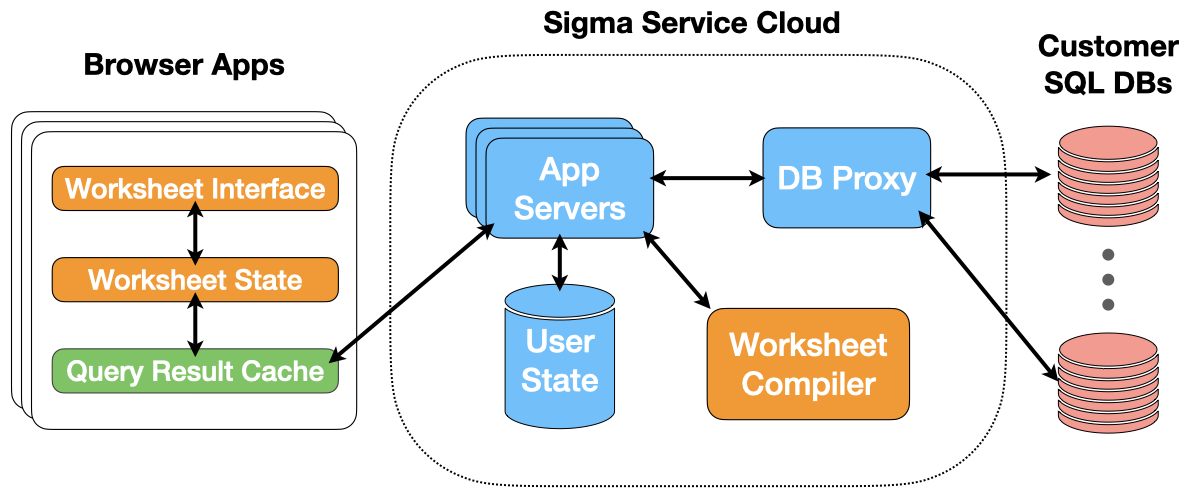
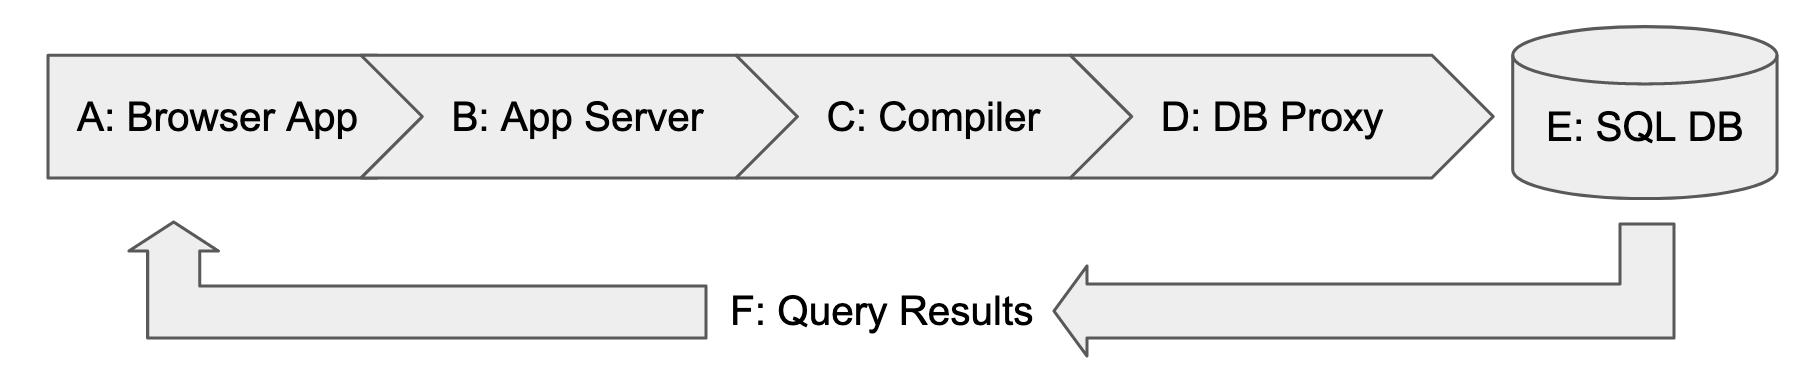
Worksheet is a component in Sigma, a multi-tenant Software-as-a-Service application (Figure 3). The primary elements of the implementation of Worksheet are an interface embedded in the Sigma browser application (Section 5) and a compiler service (Section 6) which together support the interactive construction of SQL queries and visualizations through a direct manipulation, spreadsheet-like interface. The other architecture elements depicted assist by connecting the Worksheet elements to each other and with the user’s data warehouse in the pipeline shown.
Warehouse Integration Sigma customers configure the service with access to an RDBMS which they control. No pre-processing or ingestion is required before users can begin OLAP through Sigma. Sigma supports multiple warehouse configurations per customer, but as queries are pushed down to the database, Worksheet is only allowed to reference data in one warehouse instance at a time.
The elastic and scalable nature of cloud-based data warehouses (CDWs) enables them to support diverse, interactive OLAP workloads from large numbers of users. Sigma benefits from these desirable characteristics by pushing computation to CDWs. It currently supports BigQuery (Google, 2021; Melnik et al., 2010), PostgreSQL (PostgreSQL, 2021), Redshift (Amazon, 2021) and Snowflake (Snowflake, 2021; Dageville et al., 2016). This interfacing with customer CDWs meets our warehouse criterion (C1).
Query Processing Access to the customer’s data warehouse by the Sigma web application is always mediated by the Sigma service. Interactive data operations expressed by a user are issued to the Sigma service as a JSON-encoding of the Worksheet specification (Section 6) by HTTP request. The Sigma service performs authentication, access control checks, query input resolution and materialized view substitution. The validated, fully resolved query is sent to the compiler, which generates a corresponding SQL query.
The SQL query is placed into a workload management queue and subsequently executed in the customer’s database. The results are then fetched from the database and forwarded directly back to the web application as-is. Query results with customer data are never stored in the Sigma service cloud.
Query Result Cache The browser application is structured in three tiers: (1) interface presentation; (2) application state; and (3) a query result cache. As changes in the application state necessitate new query results that don’t exist in the cache tier, the App will dispatch a request to the Sigma service. Query result sets from the database are returned to the application which updates the cache. The Query Result Cache matching disregards certain immaterial differences, such as column name or order, to increase its effectiveness. By maintaining cache state separate from the application state, multiple outstanding query requests can be made without conflict.
WYSIWYG The design of Sigma and the Worksheet is influenced by “what you see is what you get” systems, which enable users to directly manipulate a view of the final product, rather than repeatedly modify and recompile code. When Sigma users are making a complex edit (for instance, joining) that affects the resulting data in their view, they are provided with appropriate “previews” of the change, to orient them. When users commit a change the Sigma App refreshes their view to match the specification—issuing database queries as needed. As such the Worksheet UI never blocks user interactions while waiting for queries to run. Instead, if an action would invalidate an in-flight query, the system issues the new query and signals to the database that it should cancel the prior one.
Interactivity Optimizations The Sigma system has numerous optimizations to reduce the interaction latency in Worksheet: (1) Sigma caches the database catalog, including table schemas and constraints; (2) Sigma prioritizes interactive queries over offline processing in its workload management queuing. The number of simultaneous non-interactive queries is limited such that they cannot overwhelm the warehouse’s capacity to accept interactive requests; (3) Sigma provides a form of caching so that the results of recent queries can be re-requested from the customer database; (4) the web application maintains a local cache of recent query results which allows it to avoid re-issuing queries. (5) edit manipulations are non-blocking and unneeded queries are cancelled, as described above in WYSIWYG; (6) persisted Worksheet specifications may be configured by the user to be materialized as a table in their CDW on a time-based schedule. Other Worksheet specifications which reference them will transparently use the table instead of recalculating the result set.
Building on the Worksheet Worksheet specifications are named, persisted, and reference-able within the Sigma service, similar to SQL views. Sigma supports collaboration between users through sharing of these persisted queries both for consumption and as inputs to other Worksheet specifications, meeting our criterion for composition and reuse (C3).
Sigma implements a permission system that controls which tables and documents a user may access. Worksheets can be shared in a “viewer” mode with users who do not have access to the underlying data sources to authorize them to work with a subset of that data exposed by the Worksheet.
Result sets from queries constructed using Sigma Worksheet enable numerous Sigma features, including: (1) complex visualizations and pivot tables; (2) interactive dashboards; (3) scheduled and conditional notifications; (4) embedded visualizations; (5) materialized views; and (6) exporting to spreadsheets.
Visualizations Supplying and preparing data for visualization is an important application of Worksheet. All visualizations in Sigma use a Worksheet specification for their input. Visualizations in Sigma are displayed in the browser using Vega (Satyanarayan et al., 2016) and update in response to edits of their input Worksheet. Data for the visualizations are provisioned in the browser app by queries to our app server. The visualization specification is first translated into a Worksheet specification and then compiled (Section 6). This underscores the expressive power of Sigma Worksheet, as the expressivity of our visualization interface is on-par with that of existing commercial visualization products.
Worksheet Sigma Worksheet addresses the challenge of making database querying easier for non-experts while keeping the expressive of power of SQL intact for experts (Jagadish et al., 2007). For this, Worksheet (Figure 4) presents an interface similar to a spreadsheet. Formulas are composed one at a time and can reference any column in a worksheet, regardless of its position in the dimensional hierarchy. Input columns can be referenced from anywhere as well. When a column is renamed, references to it are updated automatically. Columns may be hidden by the user. Hidden columns do not display in the data table but may still be referenced within the worksheet. Hidden columns cannot be referenced from outside of the worksheet.
The dimensional hierarchy of a worksheet can be directly manipulated by the user with a pointing device; dragging keys and aggregates to the desired level or to create new levels. Many elements of the interface carry context menus that automate common manipulations.
When OLAP is the goal, the product of a worksheet is typically a collection of visualizations; however, worksheets can support more than just OLAP. A worksheet is analogous to a SQL View, in that it exposes a relational schema that is dictated by an underlying query. Like SQL, the worksheet always has at least one input: this may be a database table or view, an inline SQL query, or another worksheet. The last case is particularly important, as it shows that worksheets are composable building blocks. This is instrumental in attaining our goals of collaboration, expressivity, and reusability (C2 and C3), since it makes worksheets useful for more than just OLAP: A worksheet may wrangle a JSON document into a table with a well-defined schema; it may construct a cube-like model to improve downstream OLAP usability; it may apply row-level permissions to control which tuples are available to other users.
In the following two sections, we discuss details of the Worksheet user interface and compiler.
levels1
5. Worksheet Interface
The Sigma Worksheet interface is designed with accessibility in mind, incorporating successful features of spreadsheets in order to enable business users as well as analysts to interactively explore and analyze tables in relational databases. Worksheet translates users’ data interactions through direct manipulation into a specification and compiles this specification into SQL (more on this in Section 6). As such, our interface design choices are influenced by spreadsheets and business intelligence products, as these systems are widely adopted and used successfully by users with little or no SQL experience.
The Worksheet specification has three primary components: (1) the grouping levels within the table; (2) the formula definitions for columns in the table; and (3) zero or more filters applied to the table. The specification also describes the input data sources and various data formatting options. These components are sufficient to meet our shared language criterion (C2).
We describe them in detail below.
5.1. Levels
In order to perform aggregation and window calculations, users need a mechanism to specify grouping and sorting in the Worksheet. In SQL one would use the GROUP BY, ORDER BY, and OVER clauses to specify this behavior, whereas in a spreadsheet the formula SUM(A2:A15) is sufficient. In the Worksheet, users define a list of grouping levels (level for short) that visually arrange records in a nested table. A level specifies a set of grouping keys, map of columns, and an ordering annotation—this enables expressions such as CountDistinct or MovingAverage to derive grouping and ordering properties during compilation. Furthermore by coupling the level specification to the visual layout of the table, users can view the inputs and outputs of calculations side-by-side. For example a user can validate that Sum([sales]) 15 by inspecting the input values [sales] in a lower level.
Levels in the Worksheet are organized in a hierarchy, as shown in Figure 5. The Worksheet always has at least two levels. The lowest level is known as the base, and initially contains only columns that reference the input data source. It is also the only level that does not have keys, and therefore is not aggregated. The highest level, known as the totals, has an empty key set and is used to calculate scalar aggregates. There can be zero or more levels between these two—in practice we’ve seen users construct Worksheets with more than 10 levels. The only restriction on these levels is that their keys must reference columns from a lower level.
Levels are similar to a multidimensional ROLLUP. This is because the “true” keys of a given level are a union of its own keys with the keys from all higher levels. For example, if a Worksheet has three levels (excluding the base) with keys the “true” keys for each level are . This “cumulative keyset” property is important for query generation and optimization (Section 6).
The keys of a level are not restricted to expressions that reference the Worksheet’s data source. An expression such as Count([userid]) defined in level 1 could be specified as a key of level 3. These “computed level keys” enable users to visually express complex sub-queries containing aggregates or windows, using spreadsheet-like formulas.
Levels can be “collapsed” by the user to hide their values—along with those of lower levels—when no longer needed. Enabling Worksheet users to view “grouped” and “ungrouped” values side-by-side (Figure 5) facilitates their understanding of the aggregation and supports our interface criterion (C4).
5.2. Columns
A column in Worksheet is defined by an expression, its visibility, and its “resident level.” For example, in Figure 5 the expression Count([County]) is resident in level 2. Column expressions, known as formulas, are written in an expression language familiar to users of spreadsheet and business intelligence tools. Our supported functions fall into one of three categories—single row, aggregate, and window—and have the same behavior as their SQL counterparts. However much like a spreadsheet there are no restrictions on how these functions compose: a (convoluted) expression such as Sum(x + Min(y + Max(MovingAverage(z)))) is allowed by the Worksheet.
The residency property is used to derive the grouping and sorting for aggregate and window functions. It is also used when expressions in one level reference expressions in another level. The most basic example is an aggregation: a column [Sales - Sum] Sum([Sales]) is resident in level 1 and references [Sales] from the base level. Expressions can also reference columns from higher levels. An example of this is a percent of total: a column [% Total] [Sales] / [Sales - Sum] is resident in the base level and references [Sales - Sum] from level 1. An expression is not restricted in how many distinct levels (higher or lower) it references.
Expressions that reference across levels typically require JOINs in our generated SQL—we can use the “cumulative keyset” property to derive these JOINs, as this ensures that we have join keys for each pair of levels. For instance, the percent of total above can join level 1 and the base using level 1’s key. This property also makes functional dependencies obvious to our compiler, as the key for level functionally determines the values of [Sales - Sum]. The flexibilty to write arbitrary formulas with intuitive references is an important contribution to our usability criterion (C5).
Automatic Aggregation It is common for users to place columns without aggregate expressions into levels, which have grouping keys. Most databases will return an error when given a SQL query with the same property. Sigma Worksheet compensates by collecting the expression’s non-null values into a set and applying the following rules: (a) if the set is empty return NULL; (b) if the set contains a single element return it; (c) if the set contains 2 or more elements warn the user that there are multiple values. Rules (a) and (b) ensure that functional dependencies are preserved on a per-record level, when users omit an aggregation, while rule (c) provides users with feedback that they’ve selected the wrong level keys or column expression. In practice these rules are implemented efficiently by comparing the minimum and maximum values of the record group, and does not require materializing the full set.
5.3. Filters
The Worksheet provides specialized filter widgets that apply a predicate to a column’s values to select specific records from the data table. These widgets include: a list of values to include/exclude; a range of values to include; a simple SQL LIKE pattern to match and a “top-n” ranking to apply. For more advanced predicates users can manually craft Boolean expressions. Some of these widgets also provide basic statistics and histograms to assist the user as they configure these widgets. The primary challenge presented by filters is determining how to order the application of predicates relative to the calculation of aggregates and windows. Since the Worksheet does not allow users to specify an explicit order of operations, we must use a behavior that is explainable and predictable to our users. Worksheet we employs a “greedy” approach to filter application: as soon as a filter expression’s dependencies are met the predicate is applied.
5.4. Data Sources
Every Worksheet specification has a primary data source, being either a database table, a SQL query, an uploaded CSV file or another Worksheet. Additional inputs can be included from the same types of sources via joins. Sigma Worksheet can also model fact-dimension relationships between data sources, using a feature called Links. This feature enables users to incorporate related data without specifying joins, and instead rely on the system to generate the appropriate SQL using the premodeled metadata.
A Worksheet specification may be parameterized with named scalar values, which can in turn be referred like other columns in formulas. The default parameter values may be overridden when the Worksheet is referenced. All together these capabilities are motivated by our composition criterion (C3).
6. Compiler
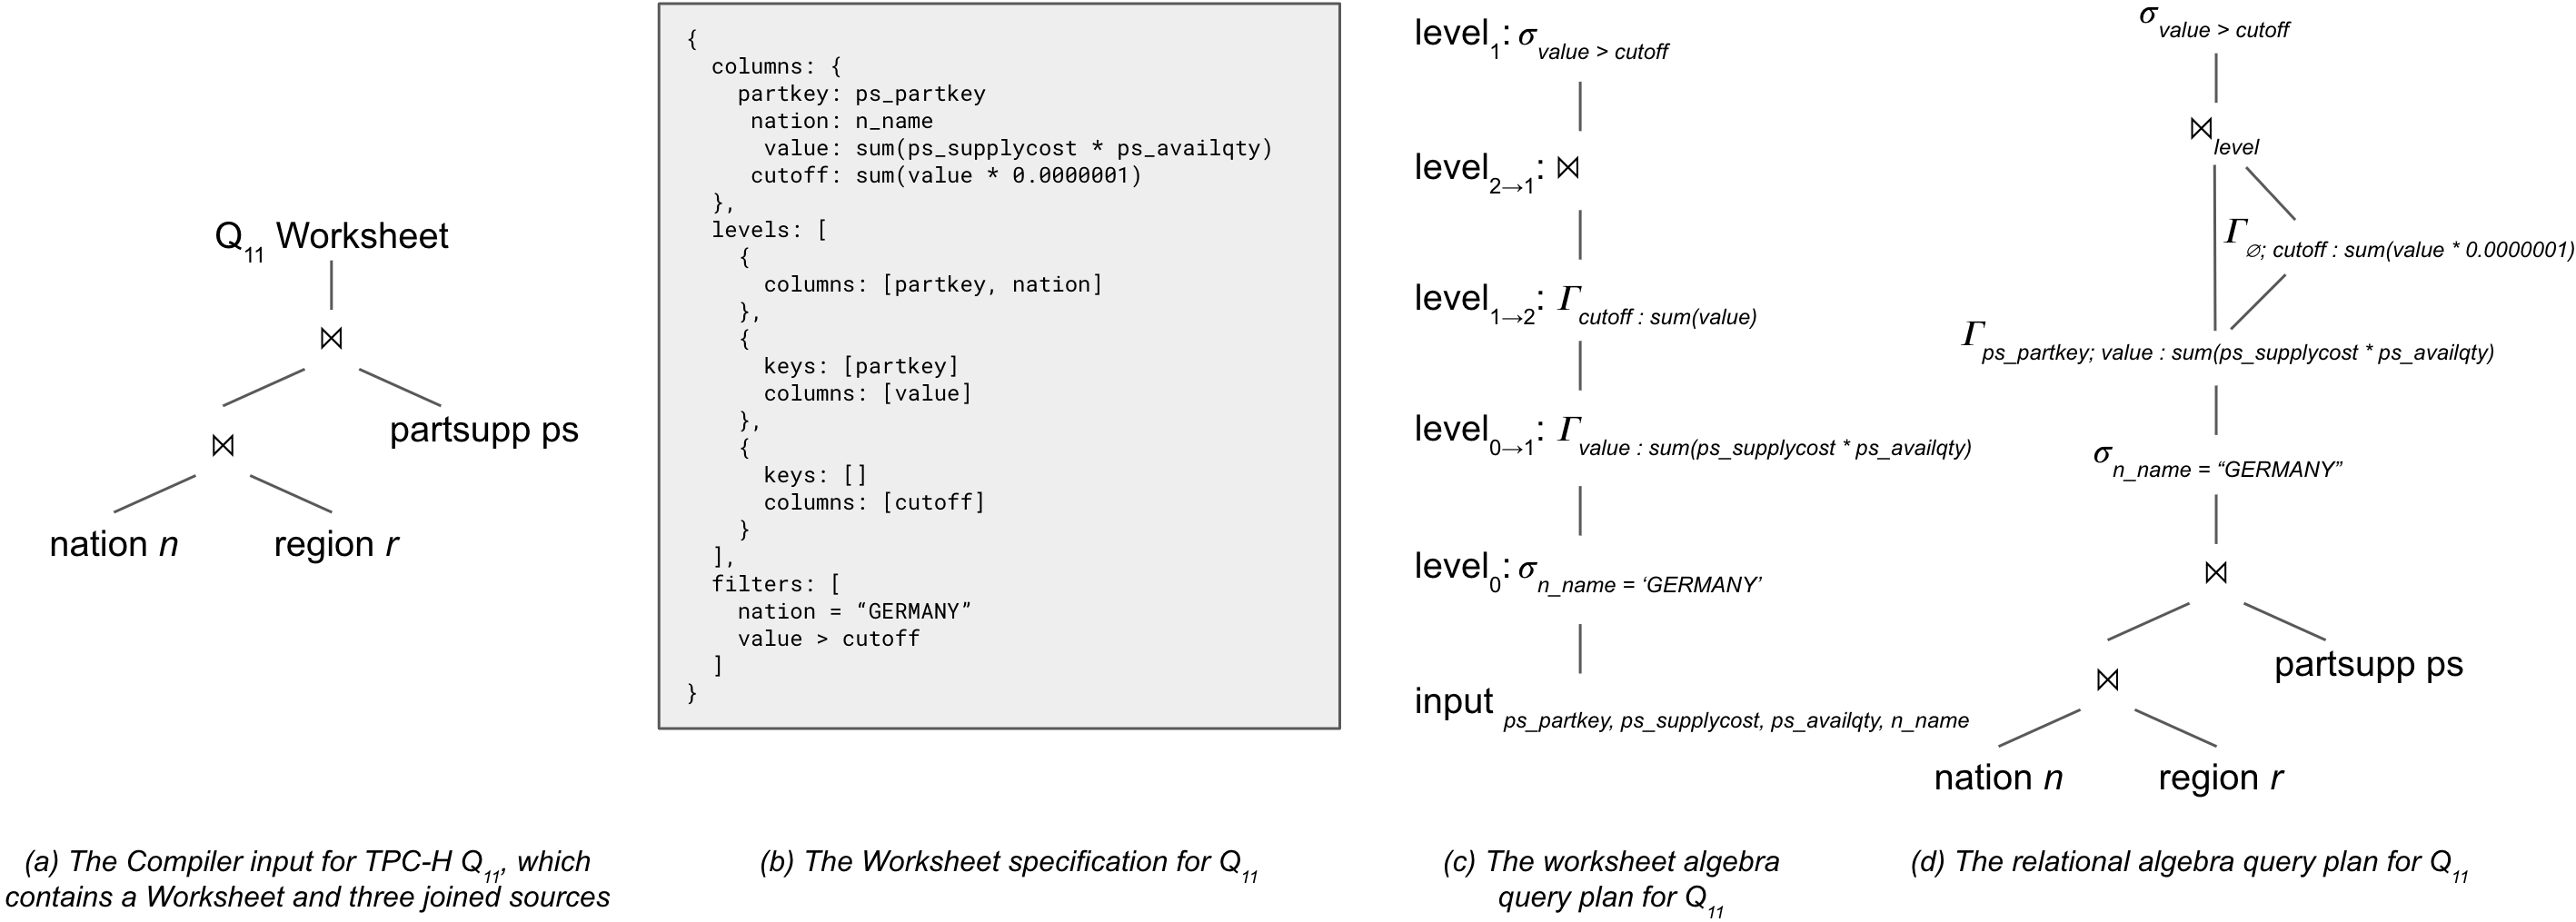
Users of Worksheet rely on Sigma to generate correct, optimized queries in their database’s SQL dialect. At a high level our compiler translates a relational operator tree into SQL, which poses many practical challenges as the databases we support all deviate from and/or extend conventional SQL. The Worksheet specification presents us with further practical challenges, as there are many non-trivial mappings from the levels, columns, and filters to a relational operator tree. This has led us to break compilation up into phases that address specific problems: lowering the Worksheet’s calculation graph into our novel Worksheet Algebra; lowering the Worksheet Algebra plan into standard relational operators; generating readable queries in the target database’s SQL dialect (Figure 6). We also apply rewrites and optimizations in each compilation phase in order to improve the efficiency of the generated queries.
Calculation Graph The levels, columns, and filters of a Worksheet specification form a spreadsheet-like calculation graph. The column expressions form nodes while function arguments form the edges. Additional edges are added between expressions in levels and the levels’ keys. Finally filter predicate expressions are added as special nodes. One of the preconditions for generating a SQL query is calculating an “order of operations” for a given Worksheet specification. This means ordering the nodes of the calculation graph. In order to produce a ordering of the calculation graph, we must detect and handle cycles. To that end, we identify any nodes in a cycle and replace them with a literal value that has a special error data type. This data type behaves much like SQL’s NULL or spreadsheet errors, and floods through calculations—we perform this recurrent node replacement in the calculation graph during typechecking. After detecting and removing cycles we are guaranteed that the Worksheet calculation graph forms a directed acyclic graph (DAG), thus enabling us to compute an ordering of its nodes.
Worksheet Algebra An ordering of nodes is not sufficient, as we ultimately need to produce a relational operator tree. To resolve this, we developed an informal Worksheet Algebra (walg) to act as a bridge between the UI’s specification and a relational operator tree. A walg plan operates on a nested relation, where each level of nesting corresponds to a level in the Worksheet. As such all walg operators are unary and operate on a nested relation—this includes our join operator as we only allow joins between a pair of levels. We describe the operators below.
-
Select(Predicate) A select operator applies a predicate to a nested table. If a predicate rejects all records nested under a group, the group is also rejected. In this way, a select is applied to all levels of the Worksheet, rather than a single level.
-
Project(Leveli, Expressions) A project operator adds new attributes to a specific level in the nested table. Multiple operators are required to add new attributes to multiple levels.
-
Join(SourceLeveli, TargetLevelj, Expressions) A join operator makes attributes in a source level available in another target level, while evaluating expressions. The behavior of the operator depends on whether the source level is nested under the target level, or vice versa. When the source level is nested under the target, expressions with aggregate functions are evaluated; those without apply the automatic aggregation described in 5.2. When the target level is nested under the source, the values from the source level are repeated within each record of the target.
Our ordering algorithm applies a modified topological sort to the calculation graph, and outputs a walg query plan. In addition to calculating a correct ordering of the graph, the algorithm aims to group multiple graph nodes into a single walg operator whenever possible, as an early optimization. For example we might group multiple single-row expressions from the same level into a walg project, or multiple joins between levels into a single operator. We discuss optimization of walg query plans later in this section.
6.1. Relational Algebra
Our compiler is able to lower every walg query plan into a relational operator tree containing standard operators. The lowering algorithm constructs one subquery for each level, and performs left joins between these subqueries for expressions that reference columns from different levels. As such, the algorithm is primarily concerned with translating each walg operator into one or more equivalent relational operators. Consider a worksheet with 5 levels: a walg join between levels 2 and 5 uses level 5’s keys as the relational aggregate’s grouping keys, and level 2’s records as the operator’s input; a walg join between levels 4 and 1 uses leverages the cumulative keyset property generate a relational equijoin using level 4’s keys; a walg select applies a predicate to every level through a combinations of relational selects and semijoins.
6.2. SQL Generation
At first glance, producing a SQL query string from a relational operator tree is largely a mechanical process. The standard relational operators generally correspond to clauses in a standard SELECT block, and complex plans are rendered with inlined subqueries or common table expressions (CTEs).
The primary complexities stem from ensuring that a Worksheet produces the same results on the same data source, regardless of the target database. This leads to many implementation challenges, as every database we support deviates from and/or extends conventional SQL in one way or another. For example, uniformly supporting date/time and timezones across databases has required a surprising amount of engineering effort: some have novel date/time data types; some are missing functions that are native in others.
Production usage has also surfaced surprising issues related to SQL generation. For example, one database we target rejects queries with certain semijoins, requiring us to rewrite semijoins to equivalent operators. Another database can run its own compiler out of memory when query complexity exceeds a certain threshold. Perhaps the most noteworthy of these issues is the handling of common table expressions (CTEs). Initially we used these to reduce duplication in our generated queries, as they provide a mechanism to name and reference shared subqueries. However we soon discovered that some of our targets use CTEs for more than just syntactic sugar. In at least two databases we support, CTEs have a meaningful impact on query optimization. This makes it non-trivial to determine whether or not it is preferable to reference a CTE or inline it as a subquery.
Supported Query Types SQL is an expressive database query language, which can fully express the semantics of our Worksheet. Since our workloads exclusively consist of read-only analyses, we generate SELECT statements that include clauses such as FROM, WHERE, GROUP BY, ORDER BY, LIMIT, OFFSET, OVER, JOIN, WITH, EXISTS, and others. In our evaluation of Worksheet using the TPC-H benchmark (Section 8), we are able to express 20 of 22 queries—Q21 and Q22 are not yet supported as Worksheet cannot directly express arbitrary semi-/anti-joins. This limitation underscores that while the Worksheet can express many useful SQL queries, it cannot express all queries. Removing limitations on supported query types is an area of active exploration in our work.
6.3. Rewrites and Optimizations
Our query compiler performs rewrites and optimizations in all three of its intermediate representations: calculation graph, Worksheet Algebra, and relational query plan. The goal of these rewrites and optimizations is threefold: generating readable SQL to ease user inspection and debugging, minimizing the work a target database’s optimizer needs to do, and compensating for rewrites and optimizations that are not uniformly applied by databases we target. We discuss some of these rewrites below.
Calculation Graph A calculation graph is a convenient representation for performing rewrites such as constant propagation, compile-time evaluation, and dead code elimination (DCE). Of these we find DCE to have the greatest impact, as removing an expression from the calculation graph may result in pruning one or more joins or aggregations from the generated SQL. Some of our rewrites also take hints from user interactions. For example, DCE kicks in as a result of hiding a column or collapsing a level.
Worksheet Algebra The Worksheet Algebra is derived from the relational algebra, thus enabling us to merge, separate, and reorder operators without changing the overall query plan’s semantics. In some cases we are able to combine adjacent join operators that apply on the same pair of source and target levels. This optimization is possible since each level’s keys functionally determine its column’s values. In a simple example, we can rewrite adjacent join operators for MIN(x) and MAX(x) into a single operator that computes both expressions. This can have a large impact on our generated queries, as it reduces the overall number of aggregations and joins in the generated SQL—a good heuristic for comparing the relative cost of two queries. Reordering operators can also increase the likelihood of finding a plan where we can perform these merges.
Another potential optimization in the Worksheet Algebra is something we’ve named “semijoin elision.” Since a select operator applies to all levels, there are sometimes cases where we need to filter tuples in one level based on the set of tuples in another. This typically shows up in our generated SQL as an EXISTS clause. However, in some cases where a join between two levels immediately follows a select operator, we are able to replace the left join with an inner join and skip the semijoin altogether. This is possible when the join’s “source” level is already filtered, and its “target” level would otherwise require a semijoin. Again this optimization reduces the number of expensive operators in the relational query plan.
Relational Operators The optimization of relational operator trees is a well researched topic. One common optimization we do not perform is join reordering. Since our compiler has no visibility into the internals of the databases we target, trying to develop a cost model would be both redundant and ineffective. Instead we focus our query rewriting on removing occasional redundancies due to earlier compilation phases, by dropping noop operators, merging adjacent pairs of project or select operators, or pruning unneeded operator attributes. While these rewrites don’t impact query execution, they reduce noise in the generated SQL.
When a Worksheet Algebra plan is lowered to relational operators, mark the relational left joins to indicate they were generated from walg joins. Although we’ve lost the metadata describing the level keys, knowing that the same key constraints apply enables us to perform rewrites. The first is a final round of join pruning that applies when a query does not use any attributes from the right leg of an annotated left join; this rewrite is currently applied during attribute pruning. The second is a sort-limit pushdown, which enables us to swap an order-by limit with an adjacent annotated left join. The motivating example is a join between the base level and an aggregate level, where the number of records in the base is multiple orders of magnitude greater than the aggregate level. When the ordering exclusively references attributes in the base level, we can apply the limit before the join, thus potentially decreasing the execution cost of the join. Furthermore some target databases are able to select efficient execution plans for ordered limits, which can lead to even greater performance improvements.
7. Examples
We will now demonstrate the capabilities of Sigma Worksheet for common business intelligence analysis with two example scenarios. Both examples utilize the On-Time database of United States domestic airline carrier flights between 1987–2020 (Bureau of Transportation Statistics, 2020). The main FLIGHTS table is around 200M rows. Each row contains information about a scheduled carrier flight, including the date, carrier, aircraft identifier, scheduled times, actual times, and
In these scenarios an aircraft-reliability manager is using Sigma Worksheet to perform analysis. The manager is responsible for making decisions about their carrier’s maintenance policies. They are not familiar with SQL and before Sigma were accustomed to working with analyst-supplied data warehouse extracts in Excel.
When necessary we include Sigma Worksheet formula expressions in these examples. The syntax and semantics are similar to simple SQL expressions. One difference is that column references are quoted in brackets ([]). The Level where a formula is defined is indicated by an abbreviation in the subscript, e.g, L1 for Level 1, B for Base Level, etc.
Cohort Analysis Our manager wants to characterize airplane reliability among planes which entered service at the same time. This type of analysis, known as “cohort analysis,” is a common analysis with longitudinal datasets. Sigma Worksheet is useful for this task, easily creating the analysis in a few simple steps.
In Sigma, database tables and saved Worksheet specifications co-exist in a browseable hierarchy. Sigma also provides a search engine. The manager uses the search interface to quickly find the FLIGHTS table which they were previously aware of. Opening the table in Sigma displays a preview the table’s contents along with a prompt to begin the analysis in Worksheet. Our manager proceeds, performing their analysis in three steps.
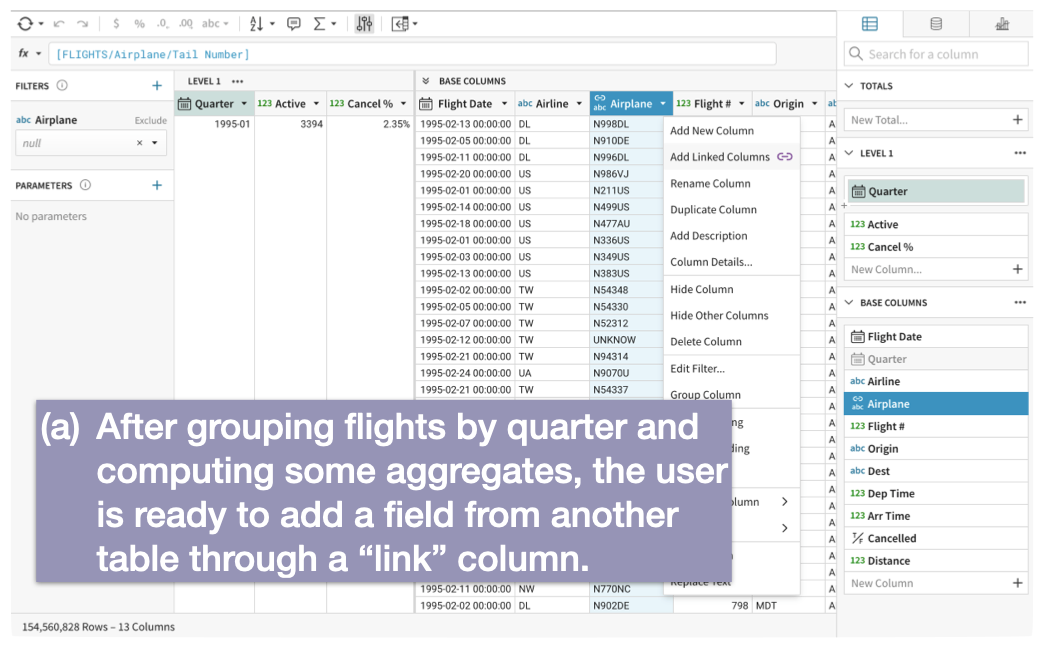
First the manager adds a level grouping flights by quarter year, with the
key shown in Formula 7 and a calculation of active
planes and cancellation percentage, Formulas 7
and 7 respectively.
{IEEEeqnarray}rCl
[Quarter]_L1 & ≔ DateTrunc("quarter",[Flight Date])
[Active]_L1 ≔ CountDistinct([Tail Number])
[Cancel %]_L1 ≔ CountIf([Cancelled])/Count()
The manager wants to group planes by “cohort,” which in this case will be the quarter when the plane first flew a scheduled flight. The first-flight of the plane is not present in the FLIGHTS table but it is accessible through a link (described in Section 5.4) to a saved Worksheet specification, titled “Planes,” where it is present. The Worksheet indicates the presence of this link to the manager through a “link column” called [Plane] which displays the tail number of the plane. The [First Flight] column can be quickly added into the table through a simple drop-down menu (Figure 7a). After adding the column, the manager adds a filter which excludes flights whose plane entered service before December 1999, being too old and not necessary for this analysis.
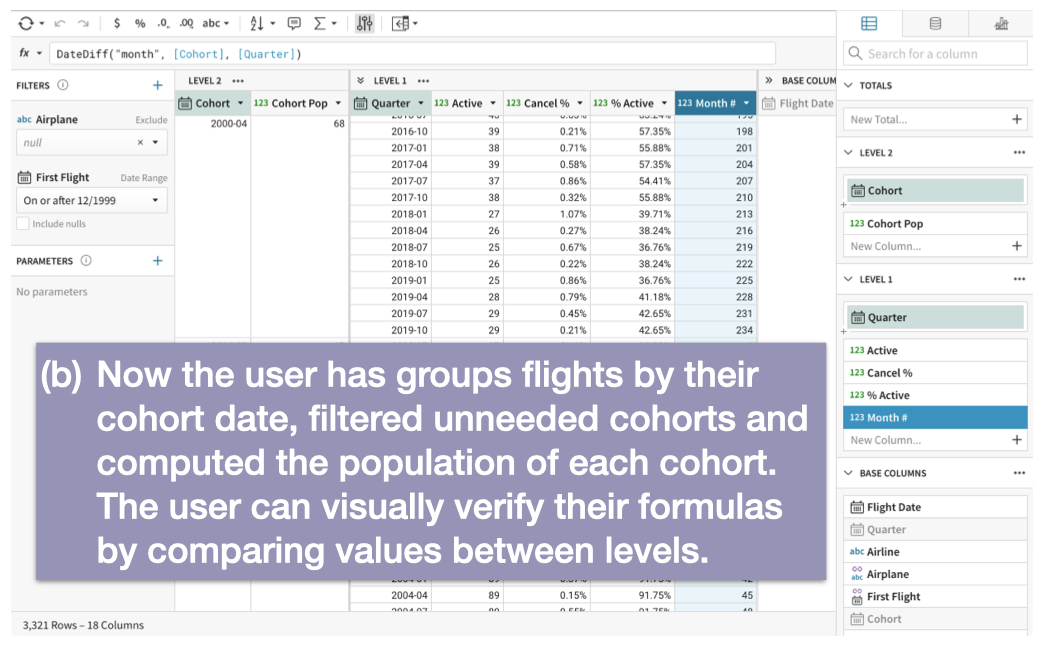
Now the manager adds a second level above the first, grouping
cohorts with the key in Formula 7 and computing
total planes in the cohort,
Formula 7. With that they find the
percentage of active planes from the cohort for each quarter in the
first level, Formula 7, and the months since the
start of the cohort, Formula 7 (Figure 7b).
{IEEEeqnarray}rCl
[Cohort]_L2 & ≔ DateTrunc("quarter",[First Flight])
[Cohort Pop]_L2 ≔ Max([Active])
[% Active]_L1 ≔ [Active]/[Cohort Pop]
[Month #]_L1 ≔ DateDiff("month",[Cohort],[Quarter])\IEEEeqnarraynumspace
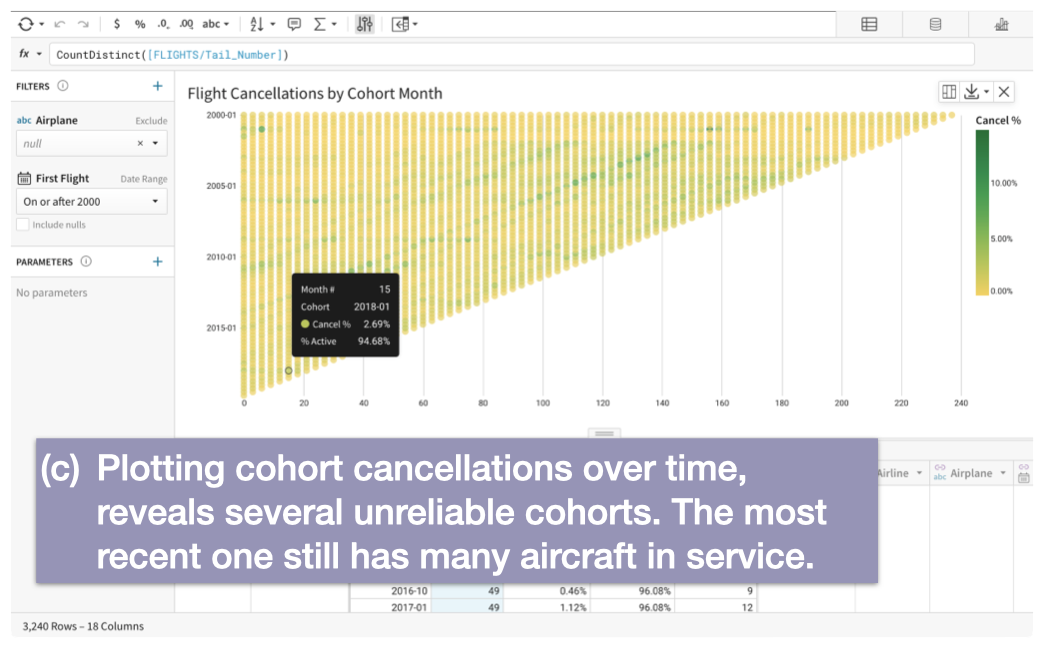
Finally they create a diagonal heatmap visualization (Figure 7c) based on this worksheet data. The visualization uses the Worksheet columns as its input. The x-axis encodes the months since the start of the cohort (Formula 7), the y-axis encodes the starting quarter of the cohort (Formula 7), and the color encodes the percentage of cancellations (Formula 7). The manager observes ongoing, high-cancellation rates for the cohort that began in 1Q 2018, of which a large portion remains in service. This discovery leads the manager to open an inquiry with the aircraft manufacturer.
Our manager was familiar with the “Planes” data from the second step because they had created it themselves previously. It is itself a Worksheet specification built from the FLIGHTS table with an added level keyed by [Tail Number] and a column finding the first flight, [First Flight] Min([Flight Date]). They annotated the FLIGHTS table with the link—in this case just a mapping between the [Tail Number] in both datasets—to facilitate future analysis.
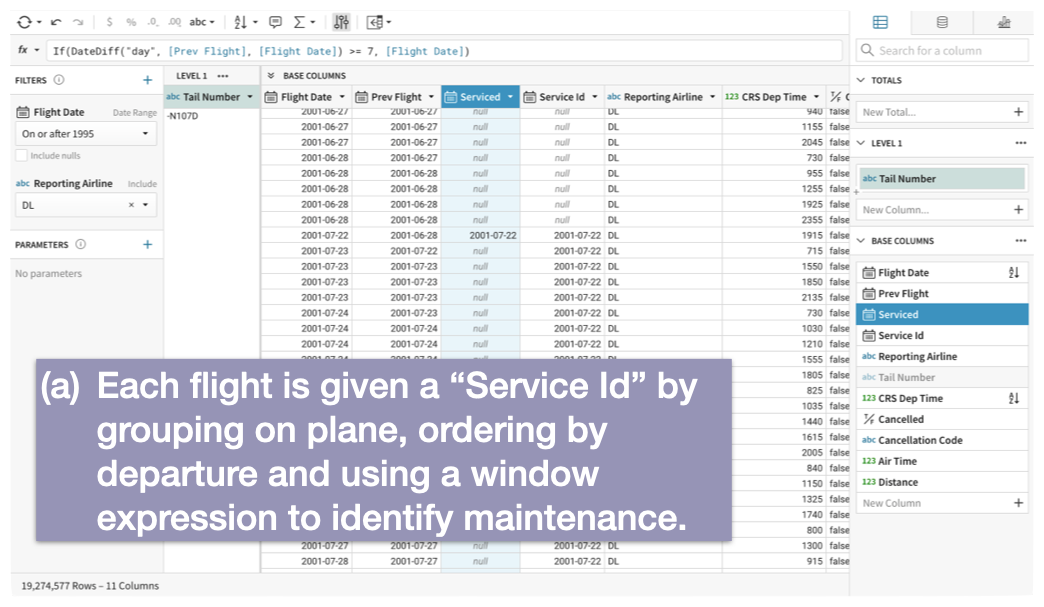
Sessionization In another case our manager needs to investigate the effect of aircraft maintenance checks on aircraft reliability. The On-Time data does not include maintenance information explicitly, but major maintenance checks can be inferred from long intervals between flights. The manager performs an enrichment known as “sessionization” to associate aircraft flights with their proceeding aircraft maintenance checks.
First our manager groups the flights by plane, as in the cohort
analysis. To identify maintenance, they order
the flights of each plane by departure and add two new columns. The
first new column identifies the first flights after a seven day furlough, Formula 7; and the second column tags each
subsequent flight with this date as a session identifier,
Formula 8 (Figure 8a).
{IEEEeqnarray}rCl
[Prev Flight]_B & ≔ Lag([Flight Date])
[Serviced]_B ≔
If(DateDiff("day", [Prev Flight],
[Flight Date]) >= 7, [Flight Date])\IEEEeqnarraynumspace
[Service Id]_B ≔ FillDown([Serviced])
Referencing values across rows was something the manager did easily
in spreadsheets. Learning to do the same in Sigma Worksheet, using window functions like Lag and FillDown,
was less intuitive at first. When the manager is unsure about a function, they
often write the invocation in its own column, as in Formula 8,
which allows them to “debug” when necessary by inspection of the column
values. The behavior of Lag, FillDown and other window functions
is determined by the
grouping of the levels above it as well the ordering of the level. The
manager needed some help to learn the use of these special functions
as they are different from the more explicit spreadsheet equivalents.
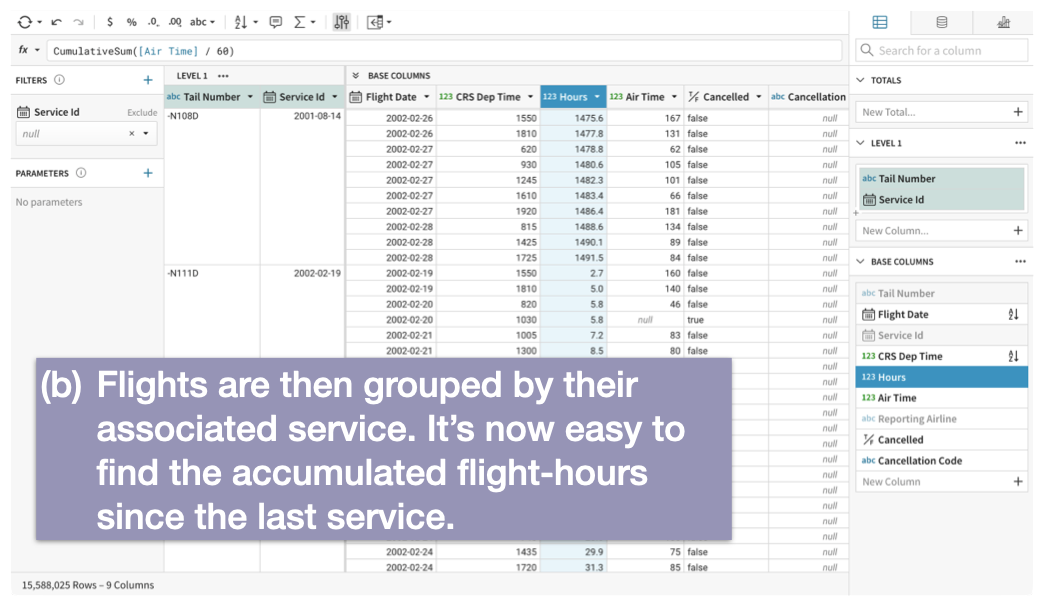
Now for each scheduled flight the manager wishes to compute the accumulated flight hours since the last maintenance check. They need to group flights by [Service Id], but that column is itself dependant on the current grouping through Lag. The solution is build a new Worksheet specification with this current one as the input. Then they are free to re-group columns as desired. The manager does so (Figure 8b) and after creating a new level with two keys, [Tail Number] and [Service Id], the manager again orders the flights by departure and computes the cumulative flight hours since the service, Formula 1.
| (1) |
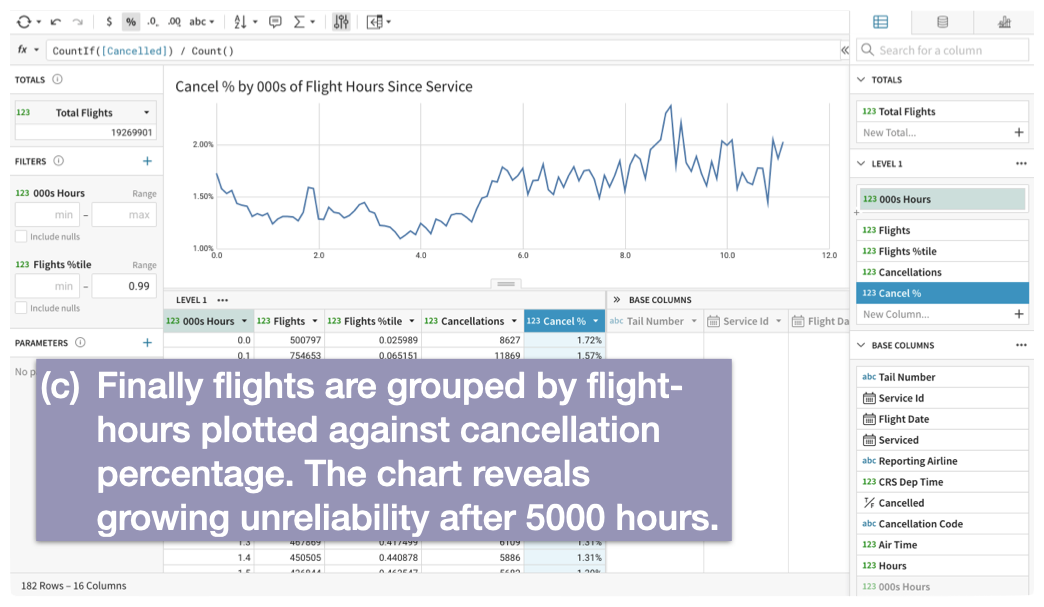
The manager now wishes to group flights in a different way, by their
accumulated flight-hours. As before, they know they can’t change the
grouping of the flights to [Hours] as it depends on the
current level specification. So once again the manger creates a new
worksheet on top of this one, now grouping by a quantization of
[Hours] and computes the cancellation percentage
(Formulas 8 and 8).
{IEEEeqnarray}rCl
[000s Hours]_L1 & ≔ Round([Hours]/1000,1)
[Cancel %]_L1 ≔ CountIf([Cancelled])/Count()
The resulting plot of these columns (Figure 8c) shows the manager a “bathtub curve” where some initial unreliability gives way to an extended period of reliability, followed by growing cancellations after 5,000 hours of flight. Empowered by this information, the manager recommends adjustments to the fleet’s maintenance schedule.
Discussion In our examples the aircraft-reliability manager was working interactively with a large dataset in their data warehouse. There was no necessary preparation that could not be done with the combination of columns, filters and levels offered by Sigma Worksheet. As they interacted with Worksheet, the interface continuously provided feedback with refreshed table and visualization query results. Sigma Worksheet’s simple expression model allowed them to write intuitive formulas (like Formula 7) without being aware of the complexities of the implementation. These examples demonstrate how Sigma Worksheet meets our usability criteria (C5).
The cohort scenario is important enough that investigations have been made to extend relational database support for it (Jiang et al., 2016). Sigma Worksheet has no special optimization for cohort analysis, but it can be expressed simply with a few basic aggregate expressions. This analysis is also possible in Power BI but requires comparatively complex DAX formulas (Zanna, 2019).
In the sessionization example the user employed window functions (Formulas 8, 8 and 1) to calculate values across grouped rows. They used the levels to define the “window” of related rows. In contrast to SQL where this is done with an OVER clause attached to every function, Sigma Worksheet window formulas are simpler, at the cost of being less expressive. For Worksheet users this trade-off is a benefit because the window is always visible to them in the data table and reference-able as they compose or debug their formulas. Because of Sigma Worksheet’s single hierarchy of levels, it is necessary in some cases, as in this example, to compose multiple Worksheets to complete an analysis.
Our examples required a small amount of data enrichment to complete. Sigma Worksheet simplifies this task and makes it accessible to the business user where previously they may have been blocked, waiting for an analyst or data specialist. Results of this analysis are likely to raise new questions which may require more understanding of the data. This makes the self-service design of Sigma Worksheet especially valuable. The Worksheet user is equipped to immediately go deeper.
8. Performance Analysis
To assess the suitability of Worksheet to replace hand-written SQL queries, we conducted a set of experiments using TPC-H-like data and queries. For twenty of the standard TPC-H queries, we constructed a semantically equivalent query specification using Worksheet, against both SF1 (1GB) and SF1000 (1TB) data sets, in one of the implementations supported by Sigma: a Snowflake 2X-Large CDW. We compared the execution runtime of the underlying SQL generated for each Worksheet specification by our compiler to the corresponding reference SQL query (Figure 9) to learn if there is a penalty to constructing queries in Worksheet.
We found that Worksheet SQL is on par with the reference SQL in 18 cases, with the average Worksheet SQL execution in these cases 8.3% slower than its counterpart at SF1000 and 0.4% faster at SF1. Of the remaining queries, two were not expressible in Worksheet and two were performance outliers.
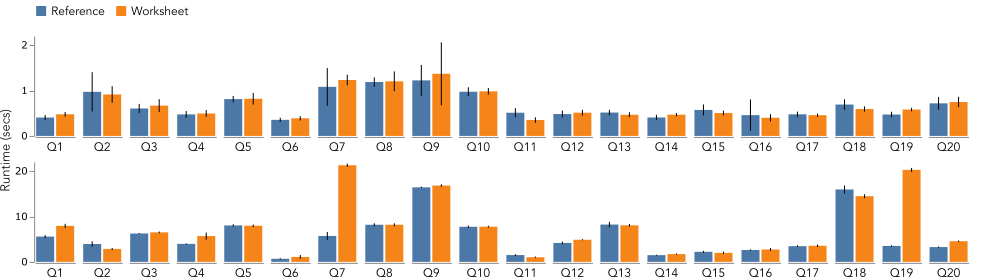
Q7 and Q19, showed poor performance in their Worksheet versions, 270% and 480% slower on average, respectively, than the reference SQL at SF1000. Both cases have the same root cause. Q7 consists of an aggregate over a join between the ORDERS and LINEITEM tables (among others). In the reference case the warehouse query planner was able to partially push-down (Chaudhuri and Shim, 2000) the aggregate and a related filter below this costly join. Worksheet’s SQL did not benefit from this optimization. Not—we believe—for any semantic reason but because two extra layers of subquery wrapping in the generated SQL confused the warehouse query planner. Q19 has a similar aggregate and join, between LINEITEM and PART, that failed to optimize for the same reason. Q21 and Q22 include anti-joins (NOT EXISTS (…)) which are not yet expressible in Worksheet (see Section 6.2 for details).
The architecture of Sigma incurs some overhead, as query requests must first be sent to the Sigma service cloud before being forwarded to the warehouse. To mitigate this Sigma offers its users the choice of service hosted from Amazon Web Services (AWS) or Google Cloud Platform (GCP) to best align with the user’s choice of warehouse implementation. Compilation of the Worksheet specification into SQL has a cost as well. On these TPC-H queries we measured an average of 28ms.
9. User Feedback
Sigma has an active user base formed by mixed communities of analysts and business users. Analysts are generally familiar with SQL while business users are not. Sigma’s user base is relatively small but rapidly growing: over 3,000 monthly active users at the time of writing. We daily handle more than 250K database queries on their behalf. Over 25% of these queries are attributed to ad-hoc analyses performed by more than 75% of our user base.
Since Sigma’s first release, we have been regularly collecting feedback from our users both anecdotally and methodically. Recently we also conducted a survey study with 100 current Sigma Worksheet users. We followed up this survey with a semi-structured interview study with 70 participants from the survey in order to elicit detailed feedback and better contextualize the survey responses. With these two studies, we aimed to find answers for several questions:
-
What high-level goals and expectations do our users have for BI?
-
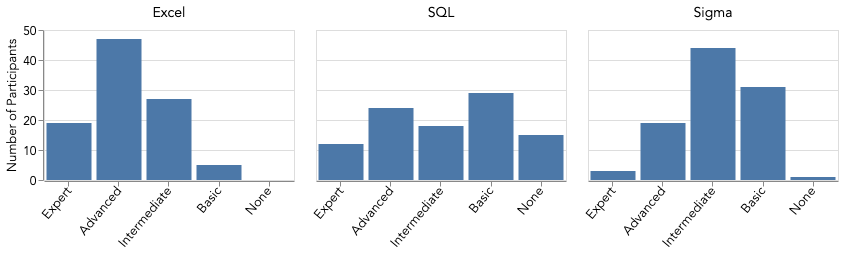
What are their skill levels in Excel, SQL, and Sigma.
-
What BI tasks do they perform regularly?
-
What are the pain points in these tasks?
-
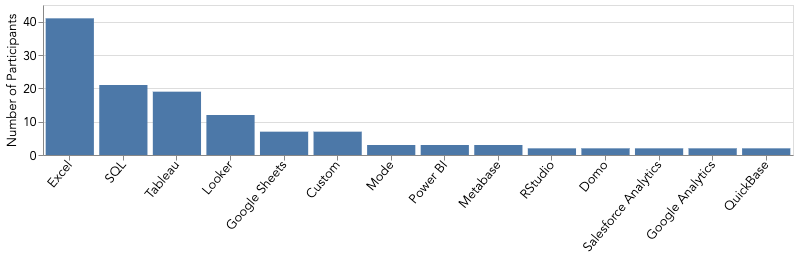
What other BI tools did they use?
-
What was their company’s reasoning in choosing Sigma?
-
How could Sigma better meet their needs?
Participants of our study hailed from 35 companies and had job titles ranging from barista to CEO, with product manager and BI analyst being the most common. They also had varying degrees of expertise with data analysis tools (Figure 10). We summarize our findings below, combining our findings from the survey and the 1-on-1 interviews.
Prior Experience, Analysis Goals, Pain Points About half the participants had some experience with Excel and Google Sheets, one fifth with SQL and Tableau (Figure 11). Custom in-house tools were relatively frequent. There was some correlation with prior SQL experience and comfort with using Sigma. Across the board, participants’ overall analysis goals reduced to understanding, tracking, and reporting how their data related to business performance metrics that they cared about. Example metrics were net sales, new customers, churn rate, retention rate, revenue growth, and return on investment (e.g., of marketing). General analysis patterns included cohort analysis, sessionization, and attribution analysis. Frequently cited pain points with prior BI tools were difficulty of use and collaboration, limited scalability, lacking in ad-hoc transformations, and limited reporting (e.g., visualization) capabilities.
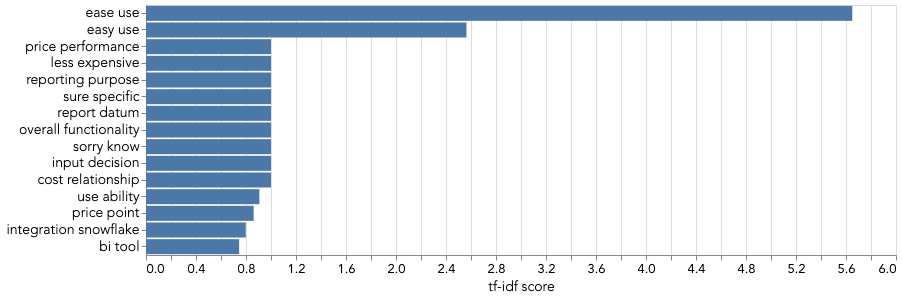
Workflow Experience Participants reported ease of use (Figure 12), which helped increase their productivity, as the most frequent reason for choosing Sigma. They also reported that the live feedback during Worksheet editing was beneficial, helping them to identify problems earlier. Benefits extended beyond business users. Analysts with SQL experience had understanding of the capabilities of databases. Viewing Worksheet as a type of visual query builder immediately gave them ideas of what they might do with it.
Spreadsheet Interface For business users the database is very abstract. They often aren’t clear about what it can do for them. We found users’ first experience with Sigma Worksheet was through a worksheet created and shared by a more experienced user. Initially their usage was learning how to manipulate columns: extending the existing analysis in a private copy. Eventually they began making their own visualizations. Finally they graduated to creating their own worksheets to answer their own questions. These users have reported that the spreadsheet-like interface did make Worksheet more approachable to get started. On the other hand, some users expected Worksheet to have a complete spreadsheet semantics, including an editable data grid, rather than a read-only data table. This motivated our ongoing work to enable live data editing in future versions of Worksheet.
Data Exploration We found that the ability to explore data with flexible transformations was one of the main reasons for adopting Sigma. Once they got familiar with Sigma’s capabilities, business users were able to perform extensive exploratory analysis without relying on BI analysts. To this end, users found the interactive coordination between Sigma Worksheet and the visualization view (i.e., they could have a visualization open and manipulate the data and observe how the visualization was changing) particularly useful.
Scalability Handling bigger datasets was among the most frequently cited strengths of Sigma. Participants had been dissatisfied in this regard with their prior direct manipulation tools, spreadsheet applications and BI systems alike. Nevertheless, some participants asked for reducing the query response times with big datasets even more, particularly for further facilitating interactive exploration at scale.
User Guidance While most users found Worksheet easy to learn and use, those primarily with spreadsheet experience were slowed down during onboarding by the differences between the Worksheet and spreadsheet interfaces. Our levels could be also a source of confusion, as some users expected them to have the behavior of a pivot table. Also, new business users occasionally got stuck when executing formulas, creating levels or performing joins. Although most users were able to push through these holdups and became productive, their comments suggested that the Worksheet user experience could benefit from machine guidance and curation at various stages of analysis, informing our ongoing development of Sigma Worksheet.
10. Discussion
Sigma Worksheet has enabled our business users to successfully use the data warehouse to perform ad-hoc analysis. Giving such power to users has also raised new challenges and opportunities.
Data Discovery Finding the right tables in the database remains a challenge for some users—this is important as Worksheet is only useful once a table is selected. In practice, some companies have multiple databases connected to Sigma, each of which can contain hundreds or thousands of tables. The addition of data discovery functionality, implemented as search and recommendations stands out as a valuable addition to the Sigma product.
Spreadsheet Semantics Our user feedback indicates that some users expect the Sigma Worksheet to behave more like an actual spreadsheet. These users are surprised when they cannot perform common operations like editing and referencing individual cells or adding and removing rows from the data table. There are also subtle differences in our calculation semantics—for example spreadsheets and SQL databases have different behaviors around NULL or empty cells. As such, there are many opportunities to further extend the Worksheet interface in order to meet the expectations of spreadsheet users.
Power of Examples Although Worksheet supports re-use through composition and parameterization, a more primitive mechanism, copying and then editing another user’s Worksheet, has turned out to be an important workflow in Sigma. It has made analysis accessible for users who otherwise wouldn’t know how to get started. Making it easier to create and share analysis examples and snippets for the Sigma Worksheet user community is an important future work.
Expressivity While Sigma Worksheet is able to express a number of complex analytical operations, it can be further extended to support additional operations such as a function that is equivalent to Excel’s VLOOKUP (Microsoft, [n.d.]). Another topic to investigate is enabling aggregate and window calculations that do not rely on the Worksheet’s levels. While removing the need to use an explicit GROUP BY clause is a usability improvement, at times it might lead to analyses with convoluted user interface configurations.
Hybrid Evaluation Sigma Worksheet is capable of expressing complex analysis that would be impractical or impossible to write by hand. This can lead to generated SQL queries that strain the optimization and execution capabilities of databases. While better query generation can reduce of this stress, we cannot directly control how databases perform as data and/or user load increase or available compute resources decrease. Existing products have addressed this by building specialized query processing systems to guarantee interactivity - we believe this approach is still appropriate. Since Sigma Worksheet’s UI is delivered through a web browser, we see opportunities for innovation through in-browser query processing.
11. Related Work
The Worksheet draws from prior work on data cubes, business intelligence (BI) tools, and spreadsheet systems.
Data Cubes The data cube is a relational operator that enables the expression of multiple aggregate calculations in a single query. One of the motivations behind its development was to address the problems caused by applications generating complex and difficult-to-optimize queries (Gray et al., 1997). This resulted in the extension of SQL’s GROUP BY with the ROLLUP, CUBE, and GROUPING SETS operations, simplifying the calculation of subtotals and crosstabs along dimensions of the aggregation. The data cube with its relatively simple semantics has had a large impact on the technologies and products used for analytical query processing. The data cube is now the core data model for many commercial analytics applications, and has practically become synonymous with online analytical processing (OLAP) (Chaudhuri and Dayal, 1997).
While it is more powerful than a SQL GROUP BY, additional subqueries are needed to perform operations such as joins, projections, selections, or window calculations. This is sufficient for many interactive visualization systems, however it is limited in expressing the complex calculation graphs frequently found in spreadsheets. The Worksheet query model builds upon data cubes through its ability to express complex computations within the configuration of a single relational operator. We use the combination of levels, calculations, and filters to construct a spreadsheet-like calculation graph that can express joins, aggregations, projections, selections, and window calculations, all with a fraction of the specification complexity of the corresponding SQL.
Business Intelligence Tools Business intelligence (BI) tools aim to help enterprise users such as managers, salespeople, marketers, and business analysts make sense of data residing in company databases for improved decision making. The design of Sigma Worksheet is greatly influenced by modern BI tools such as Tableau (Tableau, 2021), Power BI (Microsoft, 2021), and Microstrategy (Microstrategy, 2021). These systems are designed to leverage the advantages of the data cube model, enabling users to easily and efficiently perform aggregate calculations by slicing and dicing the dimensions of the cube to calculate and visualize aggregate data.
Existing BI tools can generate queries that contain the cube aggregation, along with basic projection and selection operations. In some advanced cases they can also apply post-aggregate window calculations such as ranking, or perform percent of total calculations using subtotals. However, if the user cannot express their analysis with this fixed order of operations (Tableau, [n.d.]), then they must fallback to handwritten queries, or interactive data preparation in another interface or product (Tableau, 2017; Trifacta, 2021).
In contrast, Worksheet does not have a fixed order of operations. Instead the order of operations is generated dynamically during the compilation and generation of a SQL query. As such, the complexity of a given worksheet scales with the needs of the analyst, rather than forcing a fallback to another mode of query authoring.
Spreadsheet Systems Spreadsheets are one of the most ubiquitous tools used by individuals who need to collect, manipulate, and analyze data. They present users with an addressable data grid and a flexible query model, which make data entry, experimentation, and iteration on small datasets easy. They also effectively complement relational databases, which trade some of the flexibility and ease of use for scalability, performance, and reliability. This begs the popular question (Bakke and Benson, 2011; Bendre et al., 2018; Rahman et al., 2020): how can we get the best of both worlds?
General purpose spreadsheets like Microsoft Excel and Google Sheets have some support for querying external databases, as a means to bridge the gap between the two worlds. Recent tools such as Airtable (Airtable, 2021), Coda (Coda, 2021), and Notion (Notion, 2021) integrate some basic spreadsheet and database functionalities. However, these systems lack the scale, reliability, and expressivity of modern databases. At the time of writing, Excel is limited to roughly 1M rows and 16K columns—by comparison the maximum length for a single string in the Snowflake data warehouse is 16MB.
Unlike most other spreadsheet or spreadsheet-like tools, Worksheet does not persist the content of the data grid. Since we rely on query generation and execution in an external data warehouse, our query model is able to leverage result pagination to visualize the results of queries that produce thousands or millions of records. Furthermore Worksheet presents users with a spreadsheet-like visual interface and straightforward formulas, and relies on our query compiler to use the levels, calculations, and filters to drive the generation of complex, expressive SQL queries.
To the best of our knowledge, the only other system that effectively combines the spreadsheet model with interactive visualization of large databases is Sieuferd (Bakke and Karger, 2016). The Sieuferd system is a standalone tool for direct query construction, with a focus on relational completeness. In contrast, Worksheet is an important component of a larger Software-as-a-Service (SaaS) analytics product, and is focused on the construction of efficient and optimizable OLAP queries.
12. Conclusion
We have described Sigma Worksheet, a new interactive system designed for effective visual analysis of enterprise data stored in cloud data warehouses. Sigma Worksheet enables business users as well as analysts to work with the full scale of their data and perform iterative ad-hoc analysis without needing to write SQL queries. Simultaneously, Sigma Worksheet empowers these users with versatility and expressivity built on SQL and with accessibility enabled by an easy-to-use interface akin to spreadsheet systems. We see numerous opportunities ahead to extend the guided analysis, data transformation, and SQL capabilities of Worksheet. Reconciling these with performance and usability remains a challenge.
13. Acknowledgments
We thank everyone on the engineering and design team at Sigma Computing. Sigma Worksheet is a product of their labor, care, and dedication. We also thank the early users of Sigma for teaching us so much and having patience with our bugs. Special thanks to Zack Norton for producing and narrating our demonstration video.
References
- (1)
- Aiken et al. (1996) Alexander Aiken, Jolly Chen, Michael Stonebraker, and Allison Woodruff. 1996. Tioga-2: A direct manipulation database visualization environment. In ICDE.
- Airtable (2021) Airtable. 2015–2021. Airtable. https://airtable.com/.
- Amazon (2021) Amazon. 2013–2021. Redshift. https://aws.amazon.com/redshift.
- Bakke and Benson (2011) Eirik Bakke and Edward Benson. 2011. The Schema-Independent Database UI A Proposed Holy Grail and Some Suggestions. In CIDR.
- Bakke et al. (2011) Eirik Bakke, David Karger, and Rob Miller. 2011. A spreadsheet-based user interface for managing plural relationships in structured data. In CHI.
- Bakke and Karger (2016) Eirik Bakke and David R. Karger. 2016. Expressive Query Construction Through Direct Manipulation of Nested Relational Results. In SIGMOD.
- Bendre et al. (2015) Mangesh Bendre, Bofan Sun, Ding Zhang, Xinyan Zhou, Kevin ChenChuan Chang, and Aditya Parameswaran. 2015. Dataspread: Unifying databases and spreadsheets. In VLDB.
- Bendre et al. (2018) Mangesh Bendre, Vipul Venkataraman, Xinyan Zhou, Kevin Chang, and Aditya Parameswaran. 2018. Towards a holistic integration of spreadsheets with databases: A scalable storage engine for presentational data management. In ICDE.
- Bureau of Transportation Statistics (2020) Bureau of Transportation Statistics. 1987–2020. Airline On-Time Performance Data. https://www.transtats.bts.gov/Tables.asp?DB_ID=120.
- Chaudhuri and Dayal (1997) Surajit Chaudhuri and Umeshwar Dayal. 1997. An overview of data warehousing and OLAP technology. ACM Sigmod Record (1997).
- Chaudhuri et al. (2011) Surajit Chaudhuri, Umeshwar Dayal, and Vivek Narasayya. 2011. An overview of business intelligence technology. Commun. ACM (2011).
- Chaudhuri and Shim (2000) Surajit Chaudhuri and Kyuseok Shim. 2000. Including Group-By in Query Optimization. (2000).
- Coda (2021) Coda. 2019–2021. Coda. https://coda.io/.
- Dageville et al. (2016) Benoit Dageville, Thierry Cruanes, Marcin Zukowski, Vadim Antonov, Artin Avanes, Jon Bock, Jonathan Claybaugh, Daniel Engovatov, Martin Hentschel, Jiansheng Huang, Allison W. Lee, Ashish Motivala, Abdul Q. Munir, Steven Pelley, Peter Povinec, Greg Rahn, Spyridon Triantafyllis, and Philipp Unterbrunner. 2016. The Snowflake Elastic Data Warehouse. In SIGMOD.
- Devlin and Murphy (1988) Barry A. Devlin and Paul T. Murphy. 1988. An architecture for a business and information system. IBM systems Journal (1988).
- Fivetran (2020) Fivetran. 2020. 2020 Trends in Data Analytics. https://fivetran.com/blog/analyst-survey.
- Google (2021) Google. 2011–2021. BigQuery. https://cloud.google.com/bigquery.
- Gray et al. (1997) Jim Gray, Surajit Chaudhuri, Adam Bosworth, Andrew Layman, Don Reichart, Murali Venkatrao, Frank Pellow, and Hamid Pirahesh. 1997. Data cube: A relational aggregation operator generalizing group-by, cross-tab, and sub-totals. Data mining and knowledge discovery (1997).
- Gulwani (2011) Sumit Gulwani. 2011. Automating String Processing in Spreadsheets Using Input-Output Examples. In Proceedings of the 38th Annual ACM SIGPLAN-SIGACT Symposium on Principles of Programming Languages (Austin, Texas, USA) (POPL ’11). Association for Computing Machinery, New York, NY, USA, 317–330. https://doi.org/10.1145/1926385.1926423
- Gupta et al. (2015) Anurag Gupta, Deepak Agarwal, Derek Tan, Jakub Kulesza, Rahul Pathak, Stefano Stefani, and Vidhya Srinivasan. 2015. Amazon redshift and the case for simpler data warehouses. In SIGMOD.
- Harinarayan et al. (1996) Venky Harinarayan, Anand Rajaraman, and Jeffrey D Ullman. 1996. Implementing data cubes efficiently. In Acm Sigmod Record, Vol. 25. ACM, 205–216.
- Inmon (1992) William H Inmon. 1992. Building the Data Warehouse. John Wiley & Sons, Inc.
- Inmon (2005) William H Inmon. 2005. Building the Data Warehouse (4th ed.). John Wiley & Sons, Inc.
- Jagadish et al. (2007) H. V. Jagadish, Adriane Chapman, Aaron Elkiss, Magesh Jayapandian, Yunyao Li, Arnab Nandi, and Cong Yu. 2007. Making Database Systems Usable. In SIGMOD.
- Jiang et al. (2016) Dawei Jiang, Qingchao Cai, Gang Chen, H. V. Jagadish, Beng Chin Ooi, Kian-Lee Tan, and Anthony K. H. Tung. 2016. Cohort Query Processing. Proc. VLDB Endow. 10, 1 (Sept. 2016), 1–12. https://doi.org/10.14778/3015270.3015271
- Jupyter (2021) Project Jupyter. 2014–2021. Project Jupyter. http://jupyter.org/.
- Kandel et al. (2011) Sean Kandel, Andreas Paepcke, Joseph Hellerstein, and Jeffrey Heer. 2011. Wrangler: Interactive Visual Specification of Data Transformation Scripts. In ACM Human Factors in Computing Systems (CHI). http://vis.stanford.edu/papers/wrangler
- Melnik et al. (2010) Sergey Melnik, Andrey Gubarev, Jing Jing Long, Geoffrey Romer, Shiva Shivakumar, Matt Tolton, and Theo Vassilakis. 2010. Dremel: interactive analysis of web-scale datasets. VLDB (2010).
- Microsoft ([n.d.]) Microsoft. [n.d.]. Microsoft Excel Docs - VLOOKUP. https://support.office.com/en-us/article/vlookup-function-0bbc8083-26fe-4963-8ab8-93a18ad188a1.
- Microsoft (2021) Microsoft. 2011–2021. Power BI. https://powerbi.microsoft.com.
- Microstrategy (2021) Microstrategy. 1989–2021. Microstrategy. http://www.microstrategy.com.
- Nardi and Miller (1990) Bonnie A. Nardi and James R. Miller. 1990. The Spreadsheet Interface: A Basis for End User Programming. In INTERACT.
- Notion (2021) Notion. 2016–2021. Notion. https://www.notion.so/.
- OpenRefine (2021) OpenRefine. 2010–2021. OpenRefine. http://openrefine.org.
- Pérez and Granger (2007) Fernando Pérez and Brian E. Granger. 2007. IPython: a System for Interactive Scientific Computing. Computing in Science and Engineering (2007).
- PostgreSQL (2021) PostgreSQL. 1996–2021. PostgreSQL. https://www.postgresql.org/.
- Qlik (2021) Qlik. 1994–2021. QlikView. https://www.qlik.com/us/products/qlikview.
- Rahman et al. (2020) Sajjadur Rahman, Kelly Mack, Mangesh Bendre, Ruilin Zhang, Karrie Karahalios, and Aditya Parameswaran. 2020. Benchmarking Spreadsheet Systems. In SIGMOD.
- Raman et al. (1999) Vijayshankar Raman, Andy Chou, and Joseph M Hellerstein. 1999. Scalable Spreadsheets for Interactive Data Analysis. In 1999 ACM SIGMOD Workshop on Research Issues in Data Mining and Knowledge Discovery.
- Salton and Buckley (1988) Gerard Salton and Christopher Buckley. 1988. Term-weighting approaches in automatic text retrieval. Information processing & management (1988).
- Satyanarayan et al. (2016) Arvind Satyanarayan, Ryan Russell, Jane Hoffswell, and Jeffrey Heer. 2016. Reactive Vega: A Streaming Dataflow Architecture for Declarative Interactive Visualization. IEEE Trans. Visualization & Comp. Graphics (Proc. InfoVis) (2016).
- Snowflake (2021) Snowflake. 2015–2021. Snowflake. https://www.snowflake.com/workloads/data-warehouse-modernization/.
- Stolte and Hanrahan (2000) Chris Stolte and Pat Hanrahan. 2000. Polaris: A System for Query, Analysis and Visualization of Multi-Dimensional Relational Databases. In Proc. InfoVis.
- Stolte et al. (2003) Chris Stolte, Diane Tang, and Pat Hanrahan. 2003. Multiscale visualization using data cubes. IEEE TVCG (2003).
- Tableau ([n.d.]) Tableau. [n.d.]. Tableau: Order of Operations. https://help.tableau.com/current/pro/desktop/en-us/order_of_operations.htm.
- Tableau (2021) Tableau. 2003–2021. Tableau. www.tableau.com.
- Tableau (2017) Tableau. 2017. Tableau Prep. https://www.tableau.com/products/prep.
- Trifacta (2021) Trifacta. 2012–2021. Trifacta. https://www.trifacta.com.
- Tyszkiewicz (2010) Jerzy Tyszkiewicz. 2010. Spreadsheet as a relational database engine. In SIGMOD. 195–206.
- Victor (2012) Bret Victor. 2012. Learnable Programming. http://worrydream.com/LearnableProgramming.
- Witkowski et al. (2003) Andrew Witkowski, Srikanth Bellamkonda, Tolga Bozkaya, Gregory Dorman, Nathan Folkert, Abhinav Gupta, Lei Shen, and Sankar Subramanian. 2003. Spreadsheets in RDBMS for OLAP. In SIGMOD. 52–63.
- Witkowski et al. (2005) Andrew Witkowski, Srikanth Bellamkonda, Tolga Bozkaya, Aman Naimat, Lei Sheng, Sankar Subramanian, and Allison Waingold. 2005. Query by excel. In VLDB. 1204–1215.
- Zanna (2019) Luca Zanna. 2019. Power BI: Chort Analysis. https://finance-bi.com/power-bi-cohort-analysis.