Multi-wavelength Observations of AT2019wey:
a New Candidate Black Hole Low-mass X-ray Binary
Abstract
AT2019wey (SRGA J043520.9552226, SRGE J043523.3552234) is a transient first reported by the ATLAS optical survey in 2019 December. It rose to prominence upon detection, three months later, by the Spektrum-Roentgen-Gamma (SRG) mission in its first all-sky survey. X-ray observations reported in Yao2020 suggest that AT2019wey is a Galactic low-mass X-ray binary (LMXB) with a black hole (BH) or neutron star (NS) accretor. Here we present ultraviolet, optical, near-infrared, and radio observations of this object. We show that the companion is a short-period ( hr) low-mass () star. We consider AT2019wey to be a candidate BH system since its locations on the – and – diagrams are closer to BH binaries than NS binaries. We demonstrate that from 2020 June to August, despite the more than 10 times brightening at radio and X-ray wavelengths, the optical luminosity of AT2019wey only increased by 1.3–1.4 times. We interpret the UV/optical emission before the brightening as thermal emission from a truncated disk in a hot accretion flow and the UV/optical emission after the brightening as reprocessing of the X-ray emission in the outer accretion disk. AT2019wey demonstrates that combining current wide-field optical surveys and SRG provides a way to discover the emerging population of short-period BH LMXB systems with faint X-ray outbursts.
1 Introduction
1.1 Low-mass X-ray Binaries and SRG
Low-mass X-ray binaries (LMXBs) contain an accreting neutron star (NS) or black hole (BH) in orbit with a low-mass () companion star. Most of the known BH LMXBs were discovered by X-ray all-sky monitors (ASMs) during X-ray outbursts induced by instabilities in the accretion processes. The most sensitive X-ray ASM to date, the Monitor of All-sky X-ray Image (MAXI; Matsuoka2009), has a transient triggering threshold of mCrab ( over 2–10 keV) sustained for 4 days (Negoro2016). Due to the relatively shallow sensitivity of ASMs, the sample of LMXBs is biased toward nearby sources that exhibit bright X-ray outbursts.
Prior to 2020, the most sensitive all-sky X-ray imaging survey was carried out in 1990/1991 by ROSAT at 0.1–2.4 keV (Truemper1982; Voges1999). It cataloged X-ray sources brighter than , providing the deepest X-ray all-sky reference at the time (Boller2016). Three decades after ROSAT, the dynamic X-ray sky is being surveyed by the eROSITA (0.2–10 keV; Predehl2021) and the Mikhail Pavlinsky ART-XC (4–30 keV; Pavlinsky2021) telescopes on board the Spektrum-Roentgen-Gamma (SRG) mission (Sunyaev2021). This planned four-year survey obtaining full-sky images created every six months is a powerful X-ray time domain facility. The first eROSITA All-Sky Survey (eRASS1; 2019 December–2020 June) was sensitive to point sources down to (Predehl2021).
1.2 AT2019wey
On 2020 March 18, SRG discovered a new X-ray (mCrab) transient, SRGA J043520.9552226 (SRGE J043523.3552234; Mereminskiy2020). It coincided with an optical () transient, AT2019wey, first reported by ATLAS (Tonry2019). This transient, bright at both X-ray and optical wavelengths, and located at low Galactic latitude () was not present in the Palomar Observatory Sky Survey or the ROSAT catalog. We conducted an extensive follow-up campaign, revealing that AT2019wey is a Galactic LMXB with unique properties.
Yao2020 presented X-ray observations of AT2019wey from 2019 January to 2020 November, suggesting that AT2019wey is a LMXB with a BH or NS accretor. In this work, we present multi-wavelength observations of AT2019wey. We conclude that the compact object is probably a BH and the companion star must be of low mass (). We therefore call AT2019wey a candidate BH LMXB. This class of objects and the classification of their X-ray states is reviewed in McClintock2006; Remillard2006; Belloni2011; Zhang2013; Tetarenko2016.
The paper is organized as follows. The association between the optical and X-ray transients is outlined in Section 2. We present optical and ultraviolet (UV) photometry in Section 3, optical and near-infrared (NIR) spectroscopy in Section 4, and radio observations in Section 5. We discuss the nature of the source in Section LABEL:sec:discussion, and summarize out findings and conclusions in Section LABEL:sec:conclusion.
Throughout this paper, times are reported in UT. Optical magnitudes are reported in the AB system. We adopt the reddening law of Cardelli1989 with .
2 Association between the Optical and X-ray Transients
On 2019 December 2 05:18:40 (MJD 58819.2213), the Zwicky Transient Facility (ZTF; Bellm2019b; Graham2019) detected AT2019wey at a -band (Å) magnitude of . The last non-detection was obtained by ATLAS at an -band (Å) magnitude of , on 2019 December 1 12:18:30 (MJD 58818.5129).
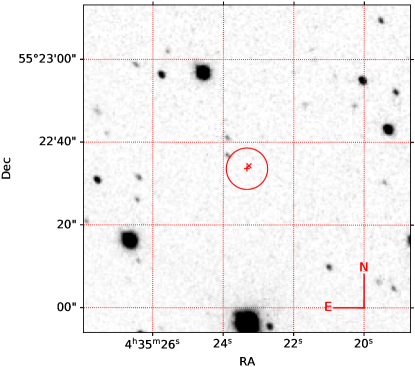
In Figure 1 we display the X-ray localization on an optical image. The AT2019wey and SRGE J043523.3552234 locations are separated by only , well within the X-ray error circle radius, thereby confirming the association first suggested by Mereminskiy2020. The Galactic coordinates of AT2019wey, and , a priori favors a Galactic source in the Galactic anti-center direction.
3 Photometry
3.1 ZTF, ATLAS, and Gaia Photometry
We constructed the optical light curve using the forced-photometry services of ZTF111https://ztfweb.ipac.caltech.edu/cgi-bin/requestForcedPhotometry.cgi (Masci2019) and ATLAS222https://fallingstar-data.com/forcedphot/ (Smith2020). We obtained Gaia photometry from the Gaia alerts page333http://gsaweb.ast.cam.ac.uk/alerts/alert/Gaia20aua/. See Table LABEL:tab:phot for the ZTF photometry.
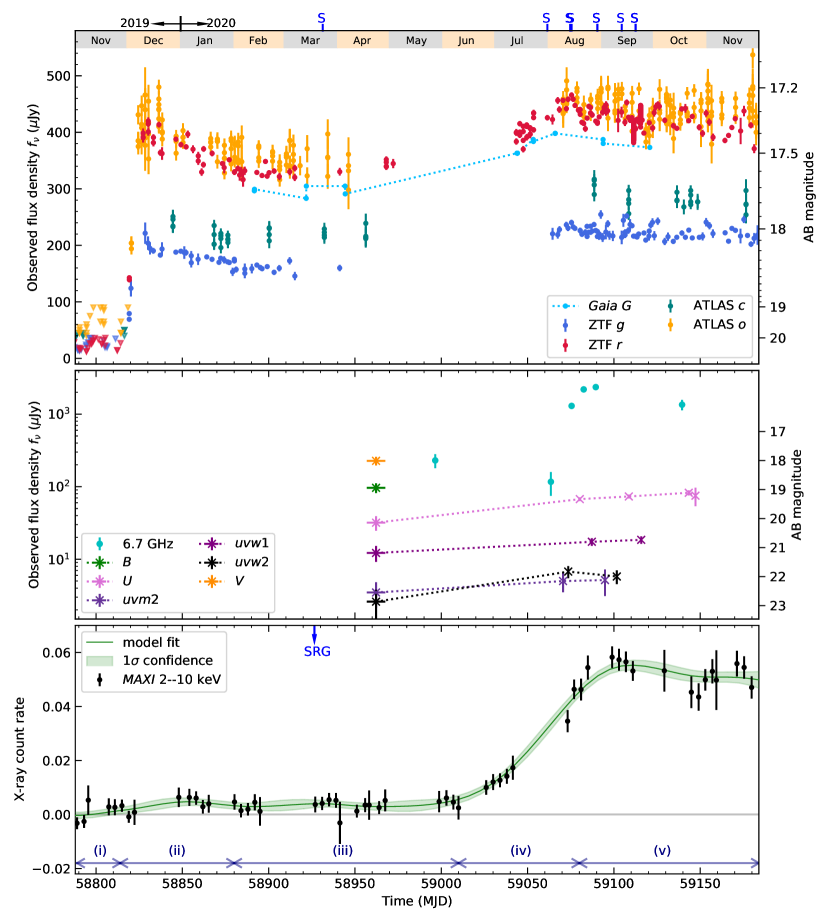
The upper panel of Figure 2 shows the ZTF, ATLAS, and Gaia light curves of AT2019wey. Over the first two weeks, the light curve rose to mag. After that, the light curve displayed small amplitude ( mag) variability for more than 300 days. The lack of photometry between to is due to the source being in the day sky. On September 9 and 13 we undertook continuous observations as part of the ZTF “deep drilling” program (Kupfer2021). On each day, -band exposure frames were obtained.
3.2 CHIMERA Photometry
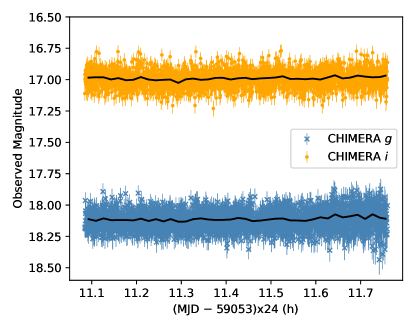
On 2020 July 23 (MJD 59053), we obtained high-speed photometry in the SDSS and band using the Caltech HIgh-speed Multi-color camERA (CHIMERA; Harding2016) on the 200-inch Hale telescope of the Palomar Observatory. We operated the detectors using the 1 MHz conventional amplifier in frame-transfer mode with a frame exposure time of 1 s, and obtained 3300 frames in each filter. We reduced the data with a custom pipeline444https://github.com/mcoughlin/kp84. Figure 3 shows the CHIMERA light curve. AT2019wey appears to exhibit intra-night variability of mag.
3.3 Period Search
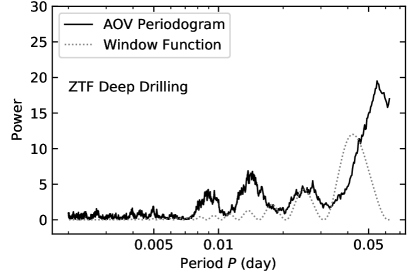
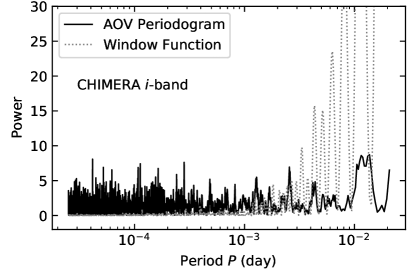
We ran a periodicity search on the CHIMERA and the ZTF deep drilling datasets using the analysis of variance (AOV) method (Schwarzenberg-Czerny1998)555We used the python script provided by https://users.camk.edu.pl/alex/#software. We used a frequency grid from 16 d to 500 d for the ZTF data, and a frequency grid from 48 d to 40,000 d for the CHIMERA data. To see how the observational cadence affects the periodogram, we used the Lomb-Scargle algorithm (see a recent review by VanderPlas2018) to compute the window function.
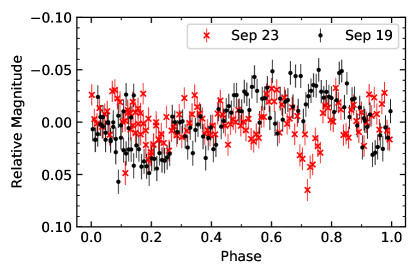
We define “significance” of a period as the maximum value in the periodogram divided by the standard deviation of values across the full periodogram. A possible period at 0.055 d (1.3 hr) at a significance of 9.2 can be seen in the ZTF periodogram (upper panel of Figure 4). We note that the 1.3 hr peak is mainly caused by the sinusoidal-like structure observed on September 19, not the dip-like structure observed on September 23. Since the data on September 19 and 23 do not follow the same trend as a function of phase (see lower panel of Figure 4), we consider the possible period at 1.3 hr to be spurious. No period above 8 can be identified from the CHIMERA periodogram.
3.4 UV Photometry
We obtained UV observations of AT2019wey with the Ultra-Violet/Optical Telescope (UVOT; Roming2005) on board the Neil Gehrels Swift Observatory (Gehrels2004) from 2020 April to September. The UVOT data were processed using HEASoft. We extracted the photometry with uvotsource using a circular aperture. Background counts were estimated in a source-free circular aperture. AT2019wey was only marginally detected in April. Therefore, for the April datasets, we undertook photometry on co-added images.
In October 2020, we obtained -band photometry using the Spectral Energy Distribution Machine (SEDM, Blagorodnova2018, Rigault2019) on the robotic Palomar 60-inch telescope (P60, Cenko2006). Data reduction was performed using the FPipe pipeline (Fremling2016). The UVOT and SEDM photometry are presented in Table LABEL:tab:uvot and is shown in the middle panel of Figure 2.
4 Optical and NIR Spectroscopy
| Date | Telescope/ | Range | Exp. | Air |
|---|---|---|---|---|
| in 2020 | Instrument | (Å) | (s) | Mass |
| Mar 23 | Keck-I/LRIS | 3200–10250 | 300 | 2.22 |
| Jul 31 | P200/DBSP | 3410–5550, 5750–9995 | 600 | 1.38 |
| Aug 13 | Keck-II/NIRES | 9400–24650 | 360 | 1.38 |
| Aug 14 | P200/DBSP | 3410–5550, 5750–9995 | 600 | 1.34 |
| Aug 29 | P200/DBSP | 3410–5550, 5750–9995 | 6002 | 1.40 |
| Sep 12 | Keck-II/ESI | 3950–10200 | 1800 | 1.32 |
| Sep 20 | Keck-I/LRIS | 3200–10250 | 3002 | 1.28 |
Note. — All spectra have been uploaded to the TNS page of this source (https://www.wis-tns.org/object/2019wey). Multiple exposures were obtained on 2020 August 29 and September 20. Since no significant variability was observed on the timescale of 5–10 min, summed spectra were produced for the two dates.
A log of our spectroscopic observations is given in Table 1. The instrumental and observational details can be found in Appendix LABEL:sec:obsinfo.
4.1 Optical Spectroscopy
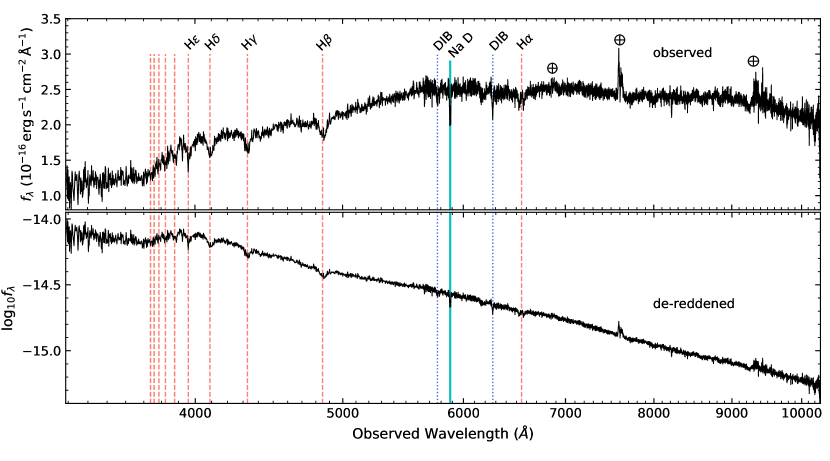
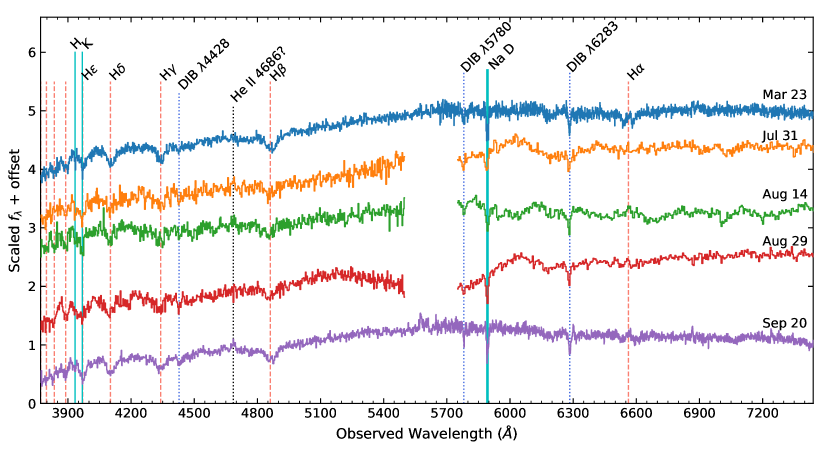
We identify the following features at redshift in all of our spectra: Balmer absorption lines, Ca II H and K lines, the Na I D doublet, diffuse interstellar band (DIB) , absorption features, and the Balmer jump (Figure 5, 6). He II emission seems to be detected in the spectra obtained on July 31, August 14, and September 20. We conclude that AT2019wey is a transient of Galactic stellar origin.
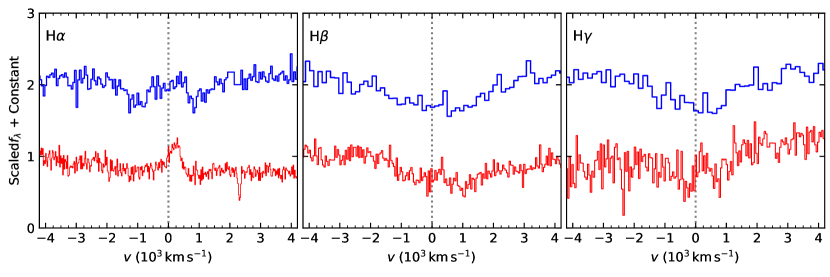
From March to September, the hydrogen profile clearly changed (Figure 6). Figure 7 presents the velocity profiles of Balmer lines in the March 23 and the September 12 spectra. On March 23, we observed a relatively narrower () emission component in the middle of a rotationally broadened () shallow absorption trough. At the same epoch, we also observed broad H and H absorption features with –. There was a marginal detection of narrow emission cores redshifted by – from the line center of the absorption troughs. On September 12, we observed flat-topped H in emission (), while the H and H profiles were similar to the H profile on March 23. The variable Balmer features are discussed further in Section LABEL:subsec:balmer.
The reddening of AT2019wey can be constrained to (Appendix LABEL:subsec:extinction) using the equivalent width () of the interstellar absorption lines. We find a lower limit to the distance of AT2019wey of kpc using the velocities of the Na I doublet in the ESI spectrum (Appendix LABEL:subsec:distance). In addition, since AT2019wey is in the Galactic anti-center direction, the distance to AT2019wey is likely less than 10 kpc. Taken together, we conclude that the distance of AT2019wey is between 1 kpc and 10 kpc.
4.2 NIR Spectroscopy
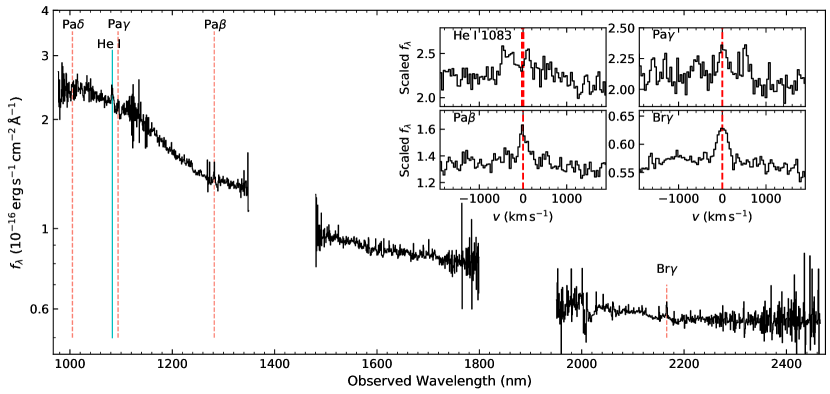
The NIR spectrum of AT2019wey is shown in Figure 8. Hydrogen emission lines of Pa, Pa, and Br are clearly distinguished. We tentatively attribute the emission lines around 1083 nm to double-peaked He I. No absorption lines or molecular bands from the secondary star can be identified. With a FWHM of –, the velocities of NIR emission features are much narrower than the H line, hinting at different formation locations in the accretion disk.
5 Radio Observations
| Date | (GHz) | (Jy) | |
|---|---|---|---|
| 2020-05-27 | 5.0 | ||
| 6.0 | |||
| 7.0 | |||
| 2020-08-02 | 2.5 | ||
| 3.5 | |||
| 10.0 | |||
| 2020-08-14 | 1.5 | ||
| 2.5 | |||
| 3.5 | |||
| 8.5 | |||
| 9.5 | |||
| 10.5 | |||
| 11.5 | |||
| 2020-08-21 | 1.5 | ||
| 2.5 | |||
| 3.5 | |||
| 8.5 | |||
| 9.5 | |||
| 10.5 | |||
| 11.5 | |||
| 2020-08-28 | 1.5 | ||
| 2.5 | |||
| 3.5 | |||
| 8.5 | |||
| 9.5 | |||
| 10.5 | |||
| 11.5 | |||
| 2020-10-17 | 6.7 | — | |
| 2021-02-17 | 1.5 | ||
| 2.5 | |||
| 3.5 | |||
| 8.5 | |||
| 9.5 | |||
| 10.5 | |||
| 11.5 |
Note. — is central frequency. The spectral index () is fitted using the Markov chain Monte Carlo (MCMC) approach with emcee (Foreman-Mackey2013). The uncertainties are calculated using the 90% quantiles from the MCMC run.