Unsupervised learning for economic risk evaluation in the context of Covid-19 pandemic
Abstract
Justifying draconian measures during the Covid-19 pandemic was difficult not only because of the restriction of individual rights, but also because of its economic impact. The objective of this work is to present a machine learning approach to identify regions that should implement similar health policies. For that end, we successfully developed a system that gives a notion of economic impact given the prediction of new incidental cases through unsupervised learning and time series forecasting. This system was built taking into account computational restrictions and low maintenance requirements in order to improve the system’s resilience. Finally this system was deployed as part of a web application for simulation and data analysis of COVID-19, in Colombia, available at (https://covid19.dis.eafit.edu.co).
1 Introduction
The Covid-19 pandemic brought with it both health and economic problems for public administrations. Lockdowns lau2020positive (7), increased Government spending dell2020economic (3), and compulsory mask usage feng2020rational (4) were among the measurements taken by governments. Some of these measures were claimed as necessary but were unpopular among the citizens, mainly because of their economic impact, as well as the restriction of individual liberties. Public policies during the Covid-19 outbreak should be based on holistic approaches that consider health, economical and social variables in a given territory. There have been some unsupervised approaches to establish the economic impact of Covid-19 pandemic(carrillo2020using (2) rahman2020data (10)), but those studies are focused exclusively on health variables.
In this work we propose a system that generates clusters among Colombian regions based on Covid-19 new incidences forecasts, health, geographic, demographic and economic variables (see Table 1). Hence, such clusters generate geographical regions with similar impact due to the pandemic in several dimensions. This delivers public administrators a source to identify vulnerable population and identifying the impact of policies in different regions, thus providing an extra input for the generation and justification of public policies among uncertainty to contain the pandemic at a regional level.
2 Design
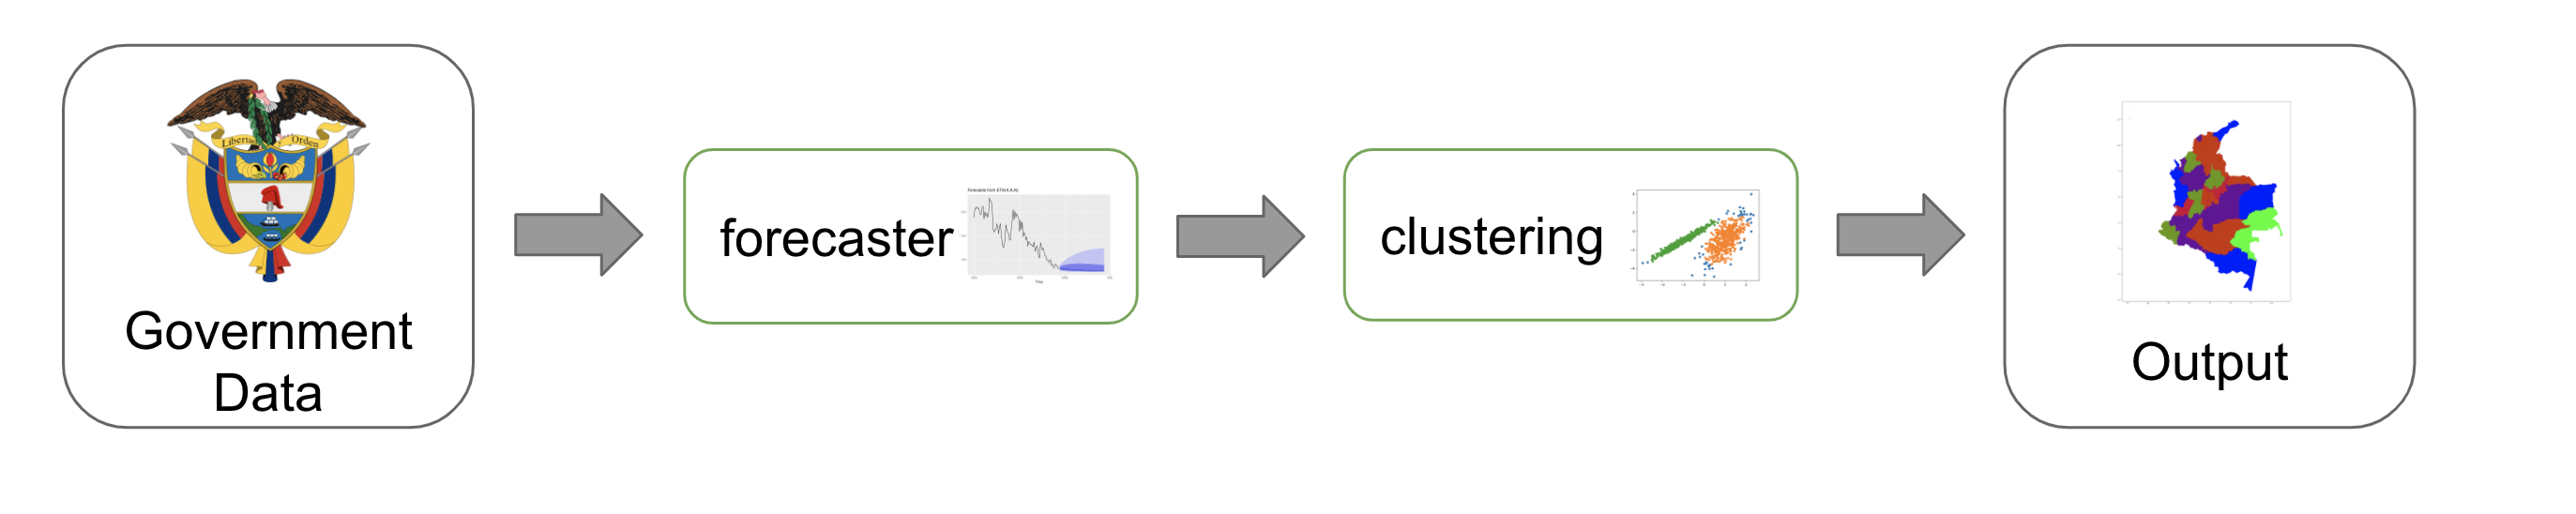
The system proposed consists of two parts. On the one hand, a forecasting model that predicts the number of cases for each of the next 7 days in all 33 Colombian departments. On the other hand, a clustering process that, with the help of some dimensionality reduction techniques, generates clusters associated to each department.
The forecast of new incidences is included in a vector representation that also contains the variables shown in Table 1 for each department. Those variables are static in time, as it is assumed that they do not change significantly during each week of forecast. The demographic and economic variables were extracted from the official sources of the National Administrative Department of Statistics (DANE) and the National Planning Department (DNP). The information of the geographical variables was obtained from the official page of Colombia’s Institute of Hydrology, Meteorology and Environmental Studies (IDEAM). The health variables are available on the official web sites of the National Institute of Health (INS), and on that of the Ministry of Health and Social Protection.
| Gathered variables | ||||
|---|---|---|---|---|
| altitude | population between 15 and 24 years | Child labour | Total population | population with Diabetes |
| precipitation | population over 65 years | Dependency ratio | Life expectancy | Deaths by chronic diseases |
| temperature | population density | Informal economy | Deaths by digestive diseases | Deaths by acute diseases |
| humidity | women population | illiteracy | Deaths by respiratory illness | Deaths by endocrine disorders |
| population under 15 years | Multidimensional Poverty Index | school dropout | Deaths by cardiac complications | Death by maligne Neoplasm |
These embeddings make a vector representation of each political subdivision of interest that contains, the pandemic’s progression, economical, healthcare, geographical and demographic data. Then, the embeddings are clustered (after applying a dimensionality reduction technique) and such clusters are the system’s final output.
3 Implementation
3.1 Forecaster
The chosen forecaster model is a neural net that only uses the new Covid-19 cases as external variables (this is due to the scarcity of APIs with updated public data). The series of new positive cases by department have several peaks, explained maybe by delays in testing. To overcome this problem, three features were included in the model. First, the input data is normalized by taking the logarithm of the raw data. Then, an exponential moving average (equation 1), with , is computed for all the new incidences series and used as feature(as is suggested in smyl2020hybrid (11)). Finally, the day of the week was incorporated as an input using an embedding layer.
| (1) |
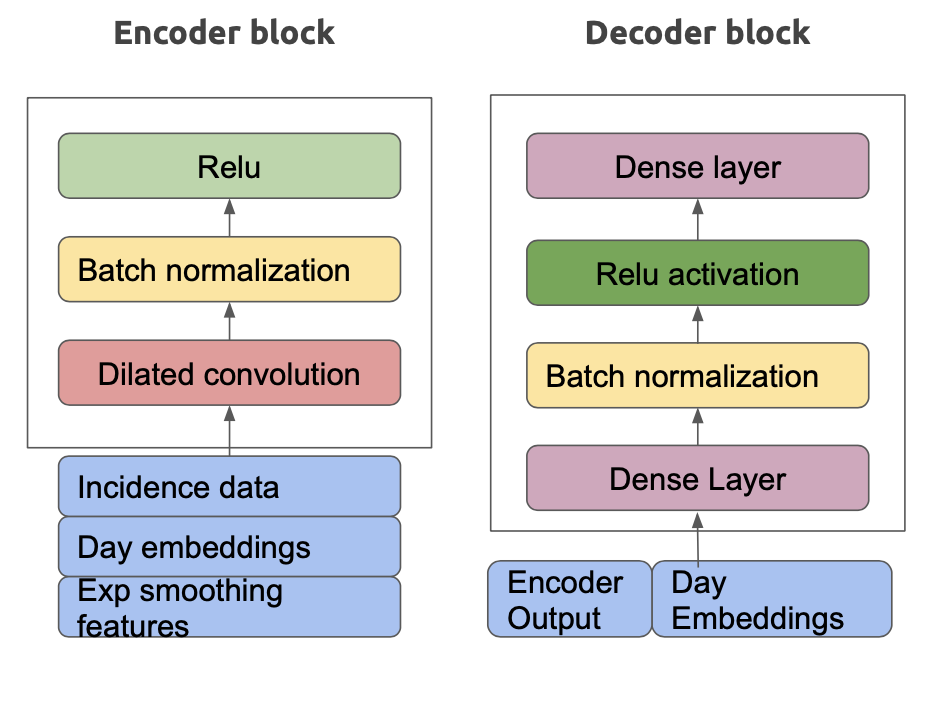
Encoder-decoder architectures have been satisfactorily used for time series forecasting sutskever2014sequence (12). In particular, 2014 deep Mind’s wave net oord2016wavenet (9) proposed a way to stack convolutional layers to extract features from sequence data, and keep the number of parameters in the model low. This last property reduces the amount of computational power required to train and deploy the system. This is the reason why, the used architecture consists of an encoder that is made of a series of blocks, each one composed of a dilated convolution with 128 filters of size 2 and causal padding, a Dense layer followed by batch normalization, and finally, a ReLu activation jin2015deep (6). There were 6 of these blocks with 1,2,3,4,5 and 6 as dilation rates, respectively. The decoder takes as inputs the encoder output and one dimensional embeddings for the day of the week in the forecasted window, and then passes these inputs through to dense layers with ReLu activations. The predictions are made by a dense layer with the size of the forecasted windows as its number of units.
The net is trained using the quantile loss in order to predict confidence intervals. The 5, 90 and 50 quantiles are predicted, and the last one is taken as the prediction. Before computing the loss, the net output is re-scaled using the last value of the exponential smoothing in the training window:
| (2) |
3.2 Clustering
Once the inference is made, the forecasted mean of the predicted window is added to a vector that contains all the other gathered variables. Those vectors are normalized and then, in order to avoid the curse of dimensionality friedman2001elements (5), a dimensionality reduction is done before applying the k-means or k-medoids algorithm.
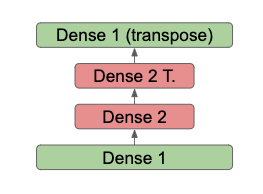
Three dimensionality reduction techniques were used. The first one, was a PCA that captures 90 percent of the original variance. Then, we used genetic algorithms for feature selection as they can be used to improve silhouette scores lleti2004selecting (8). Lastly, we tried two simple auto-encoders with the same architectures. In the symmetric one the weights between layers are shared, thus reducing the number of weights as pictured in Figure 2. Both auto-encoders were trained for one epoch.
We used silhouette metric to evaluate cluster consistency, as the popular elbow method is not ideal to fit the clusters in production because it needs a person’s input. The system then uses the highest silhouette obtained after clustering.
4 Results
The first set of experiments was to validate the forecaster net’s architecture. The baseline to beat was an ARIMA model for each political subdivision (33 in total) trained on the whole history to predict a 7-day window. A single net was trained to predict all 33 series with windows of size of 10 and a forecast window of size seven. As seven is the total size of the test set, the net does not use any test data to predict the forecast, hence avoiding data leakage. Another neural net was trained without the day embeddings in order to validate the hypothesis that this feature helps to overcome series with peaks due to delayed tests. The seven days chosen for validation was the week from August 23 to August 29. This time window seemed appropriate, as it was during this week that the pandemic reached the peak of new daily infected cases in Colombia. The number of epochs used was four and the optimizer chosen was ADAM with a learning rate of . The training data was the daily number of infected people from March 3 until August 22.
The results are summarized in Table 2, the chosen metric to evaluate the forecast was SMAPE, rather than MAPE as there were a lot of series with a value of 0 in several days and hence the MAPE could not be computed on those cases. The SMAPE reported is the average SMAPE for each of the seven days forecast for the 33 Colombian departments.
| model | Average SMAPE |
|
||
|---|---|---|---|---|
| base-line | 0.5769 | 0.3557 | ||
| Neural net | 0.5932 | 0.3437 | ||
|
0.5717 | 0.3861 |
It is worth noticing that even though the neural net with the day embeddings had a better overall performance, it actually did worse on average in Colombia’s Departments with the highest population (Bogotá, Antioquia, Valle del Cauca and Atlántico ).
The second set of experiments were relative to the clustering process. Once the new cases of infection were forecasted, those values were averaged and used as a feature for the data-set described in section 2. The results are summarized in Table 3.
| number of clusters | ||||||||
|---|---|---|---|---|---|---|---|---|
| experiment | 3 | 4 | 5 | 6 | 7 | 8 | 9 | 10 |
| No dim. reduction, k-means | 0.243 | 0.238 | 0.225 | 0.232 | 0.190 | 0.194 | 0.162 | 0.143 |
| All Variables, k-medoids | 0.069 | 0.069 | 0.010 | -0.042 | 0.099 | 0.047 | -0.081 | -0.105 |
| PCA, k-means | 0.247 | 0.231 | 0.230 | 0.236 | 0.195 | 0.199 | 0.168 | 0.148 |
| PCA, k-medoids | 0.071 | 0.070 | 0.012 | -0.057 | 0.102 | -0.051 | -0.085 | -0.114 |
| Stacked Autoencoder, k-means | 0.294 | 0.338 | 0.372 | 0.354 | 0.323 | 0.326 | 0.335 | 0.329 |
| Stacked Autoencoder, k-medoids | 0.249 | 0.268 | 0.216 | 0.195 | 0.111 | 0.202 | 0.190 | 0.303 |
| Shared Weights Autoencoder, k-means | 0.353 | 0.408 | 0.426 | 0.422 | 0.416 | 0.373 | 0.370 | 0.358 |
| Shared Weights Autoencoder, k-medoids | 0.274 | 0.321 | 0.388 | 0.319 | 0.259 | 0.235 | 0.216 | 0.196 |
| GA - All Variables, k-means | 0.412 | 0.386 | 0.414 | 0.385 | 0.396 | 0.369 | 0.349 | 0.333 |
| GA - All Variables, k-medoids | 0.335 | 0.303 | 0.259 | 0.241 | 0.261 | 0.193 | 0.219 | 0.208 |
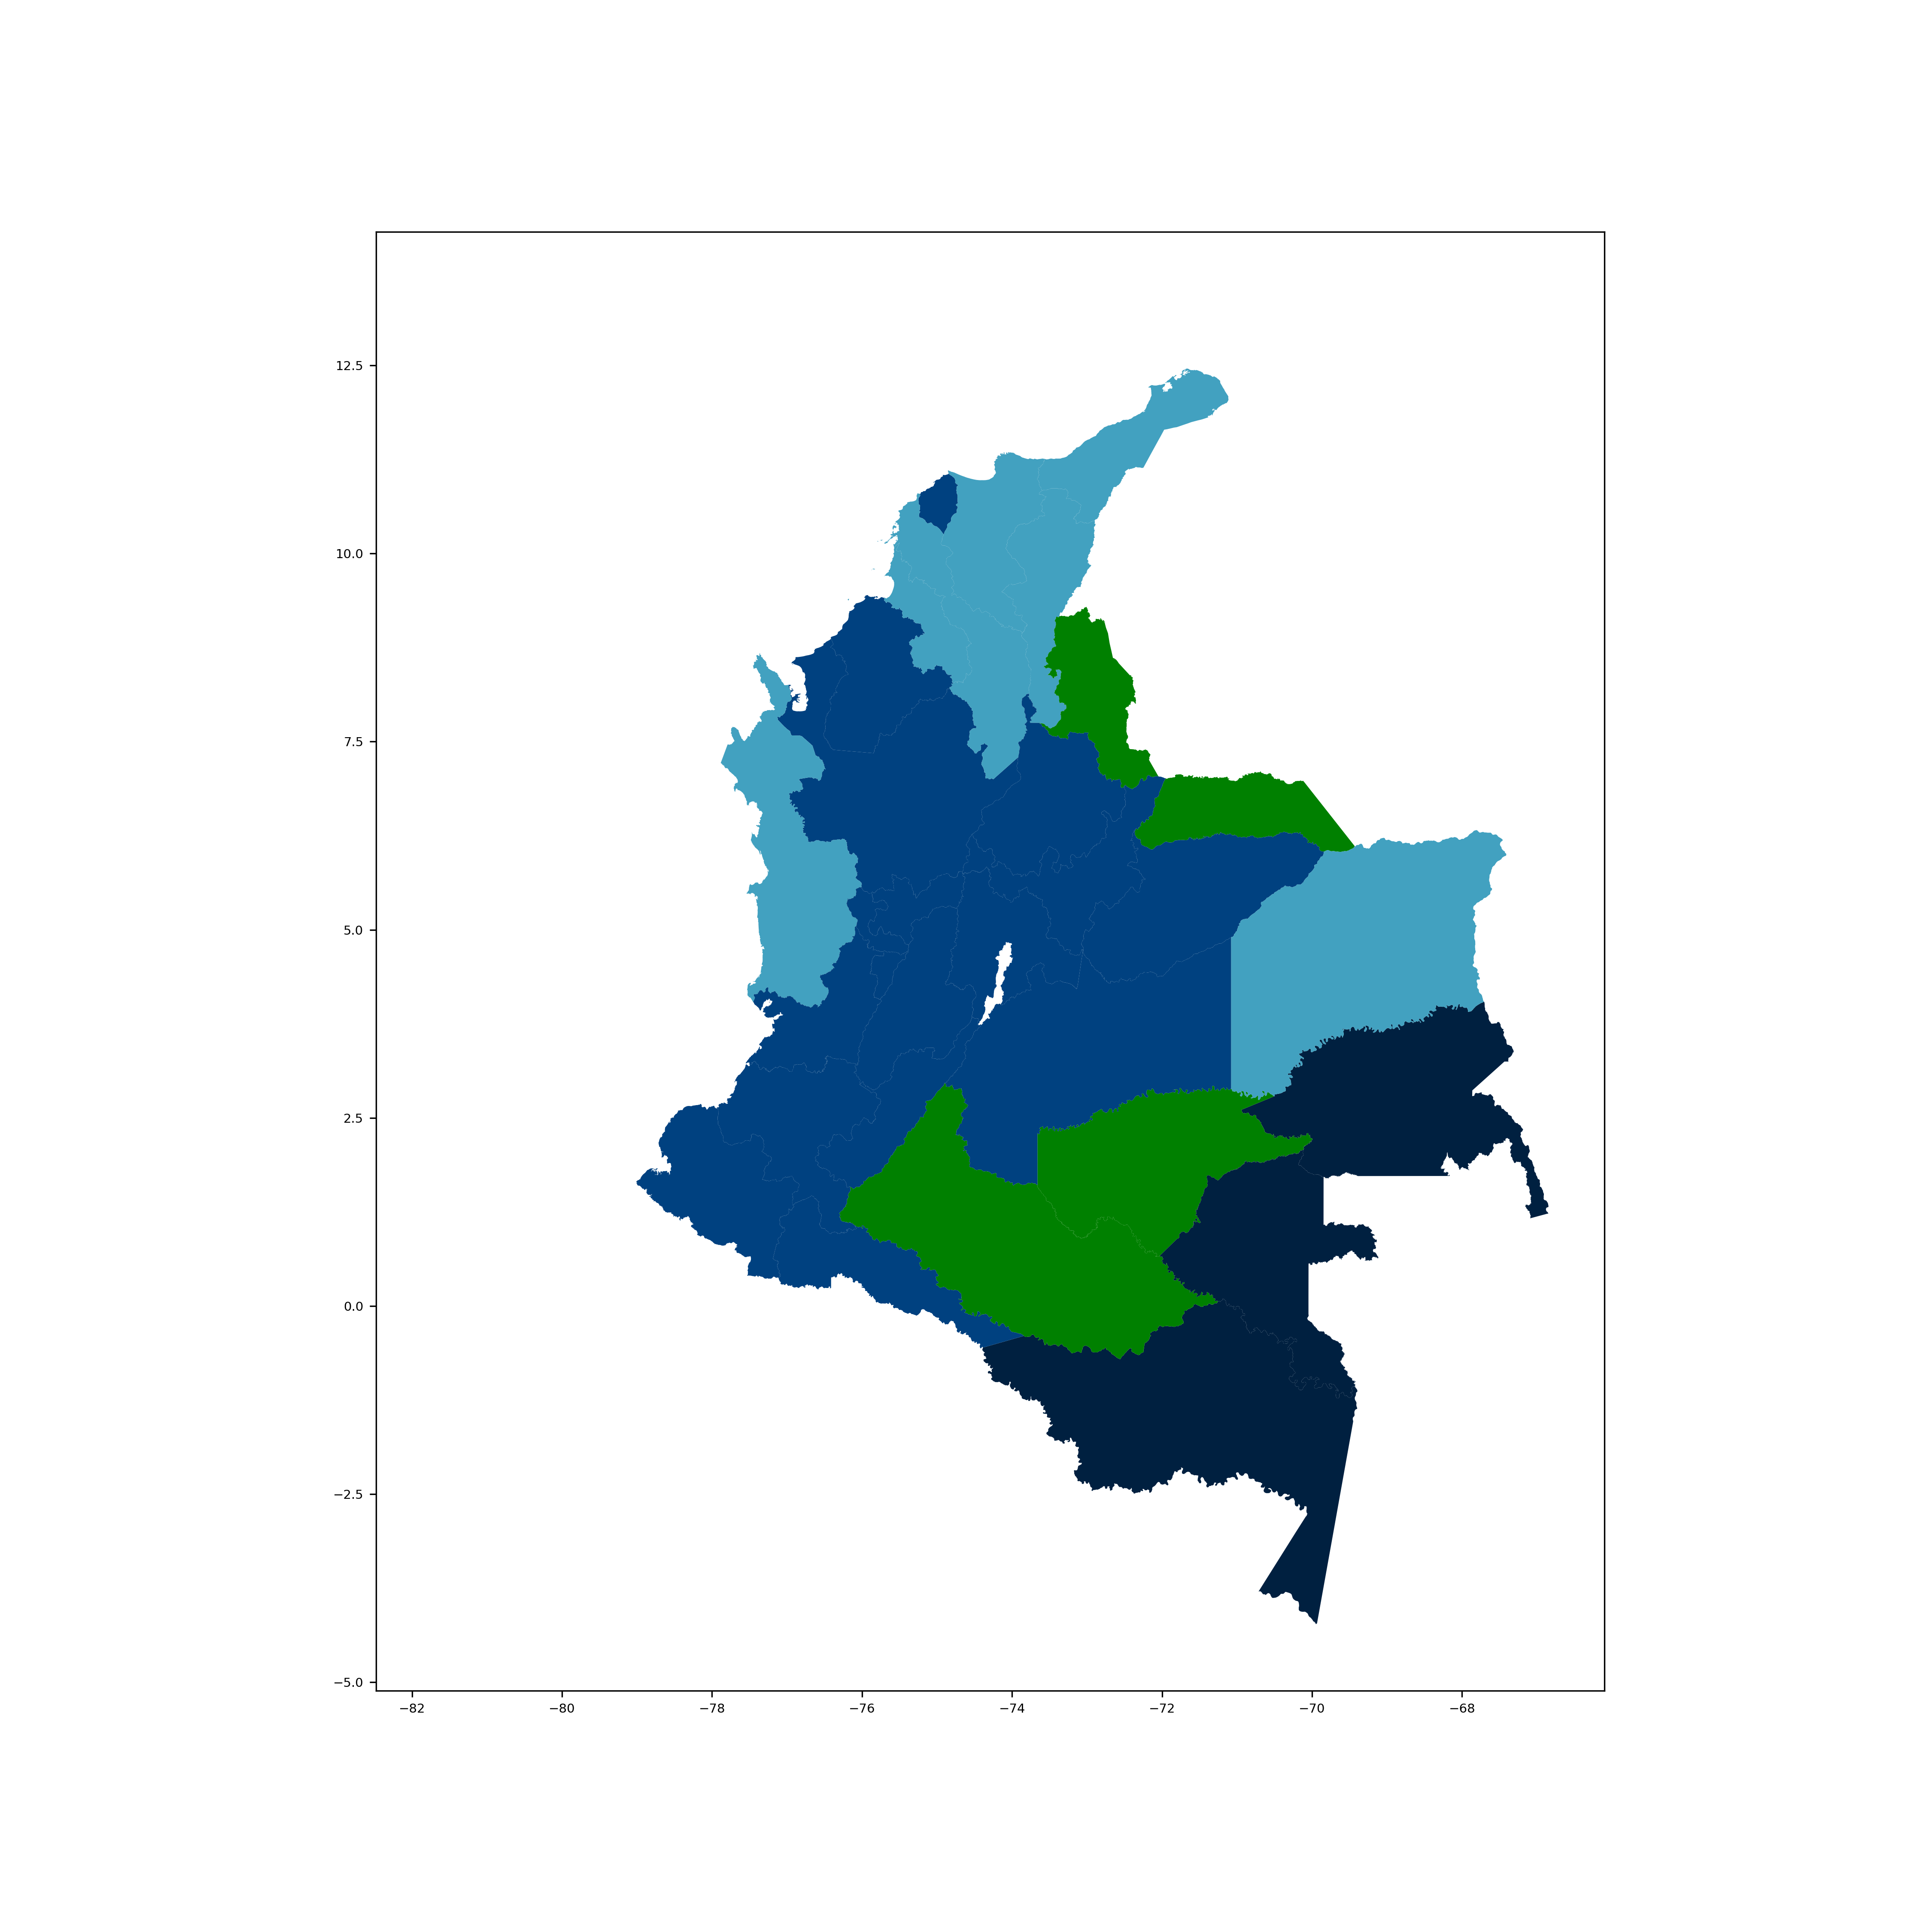
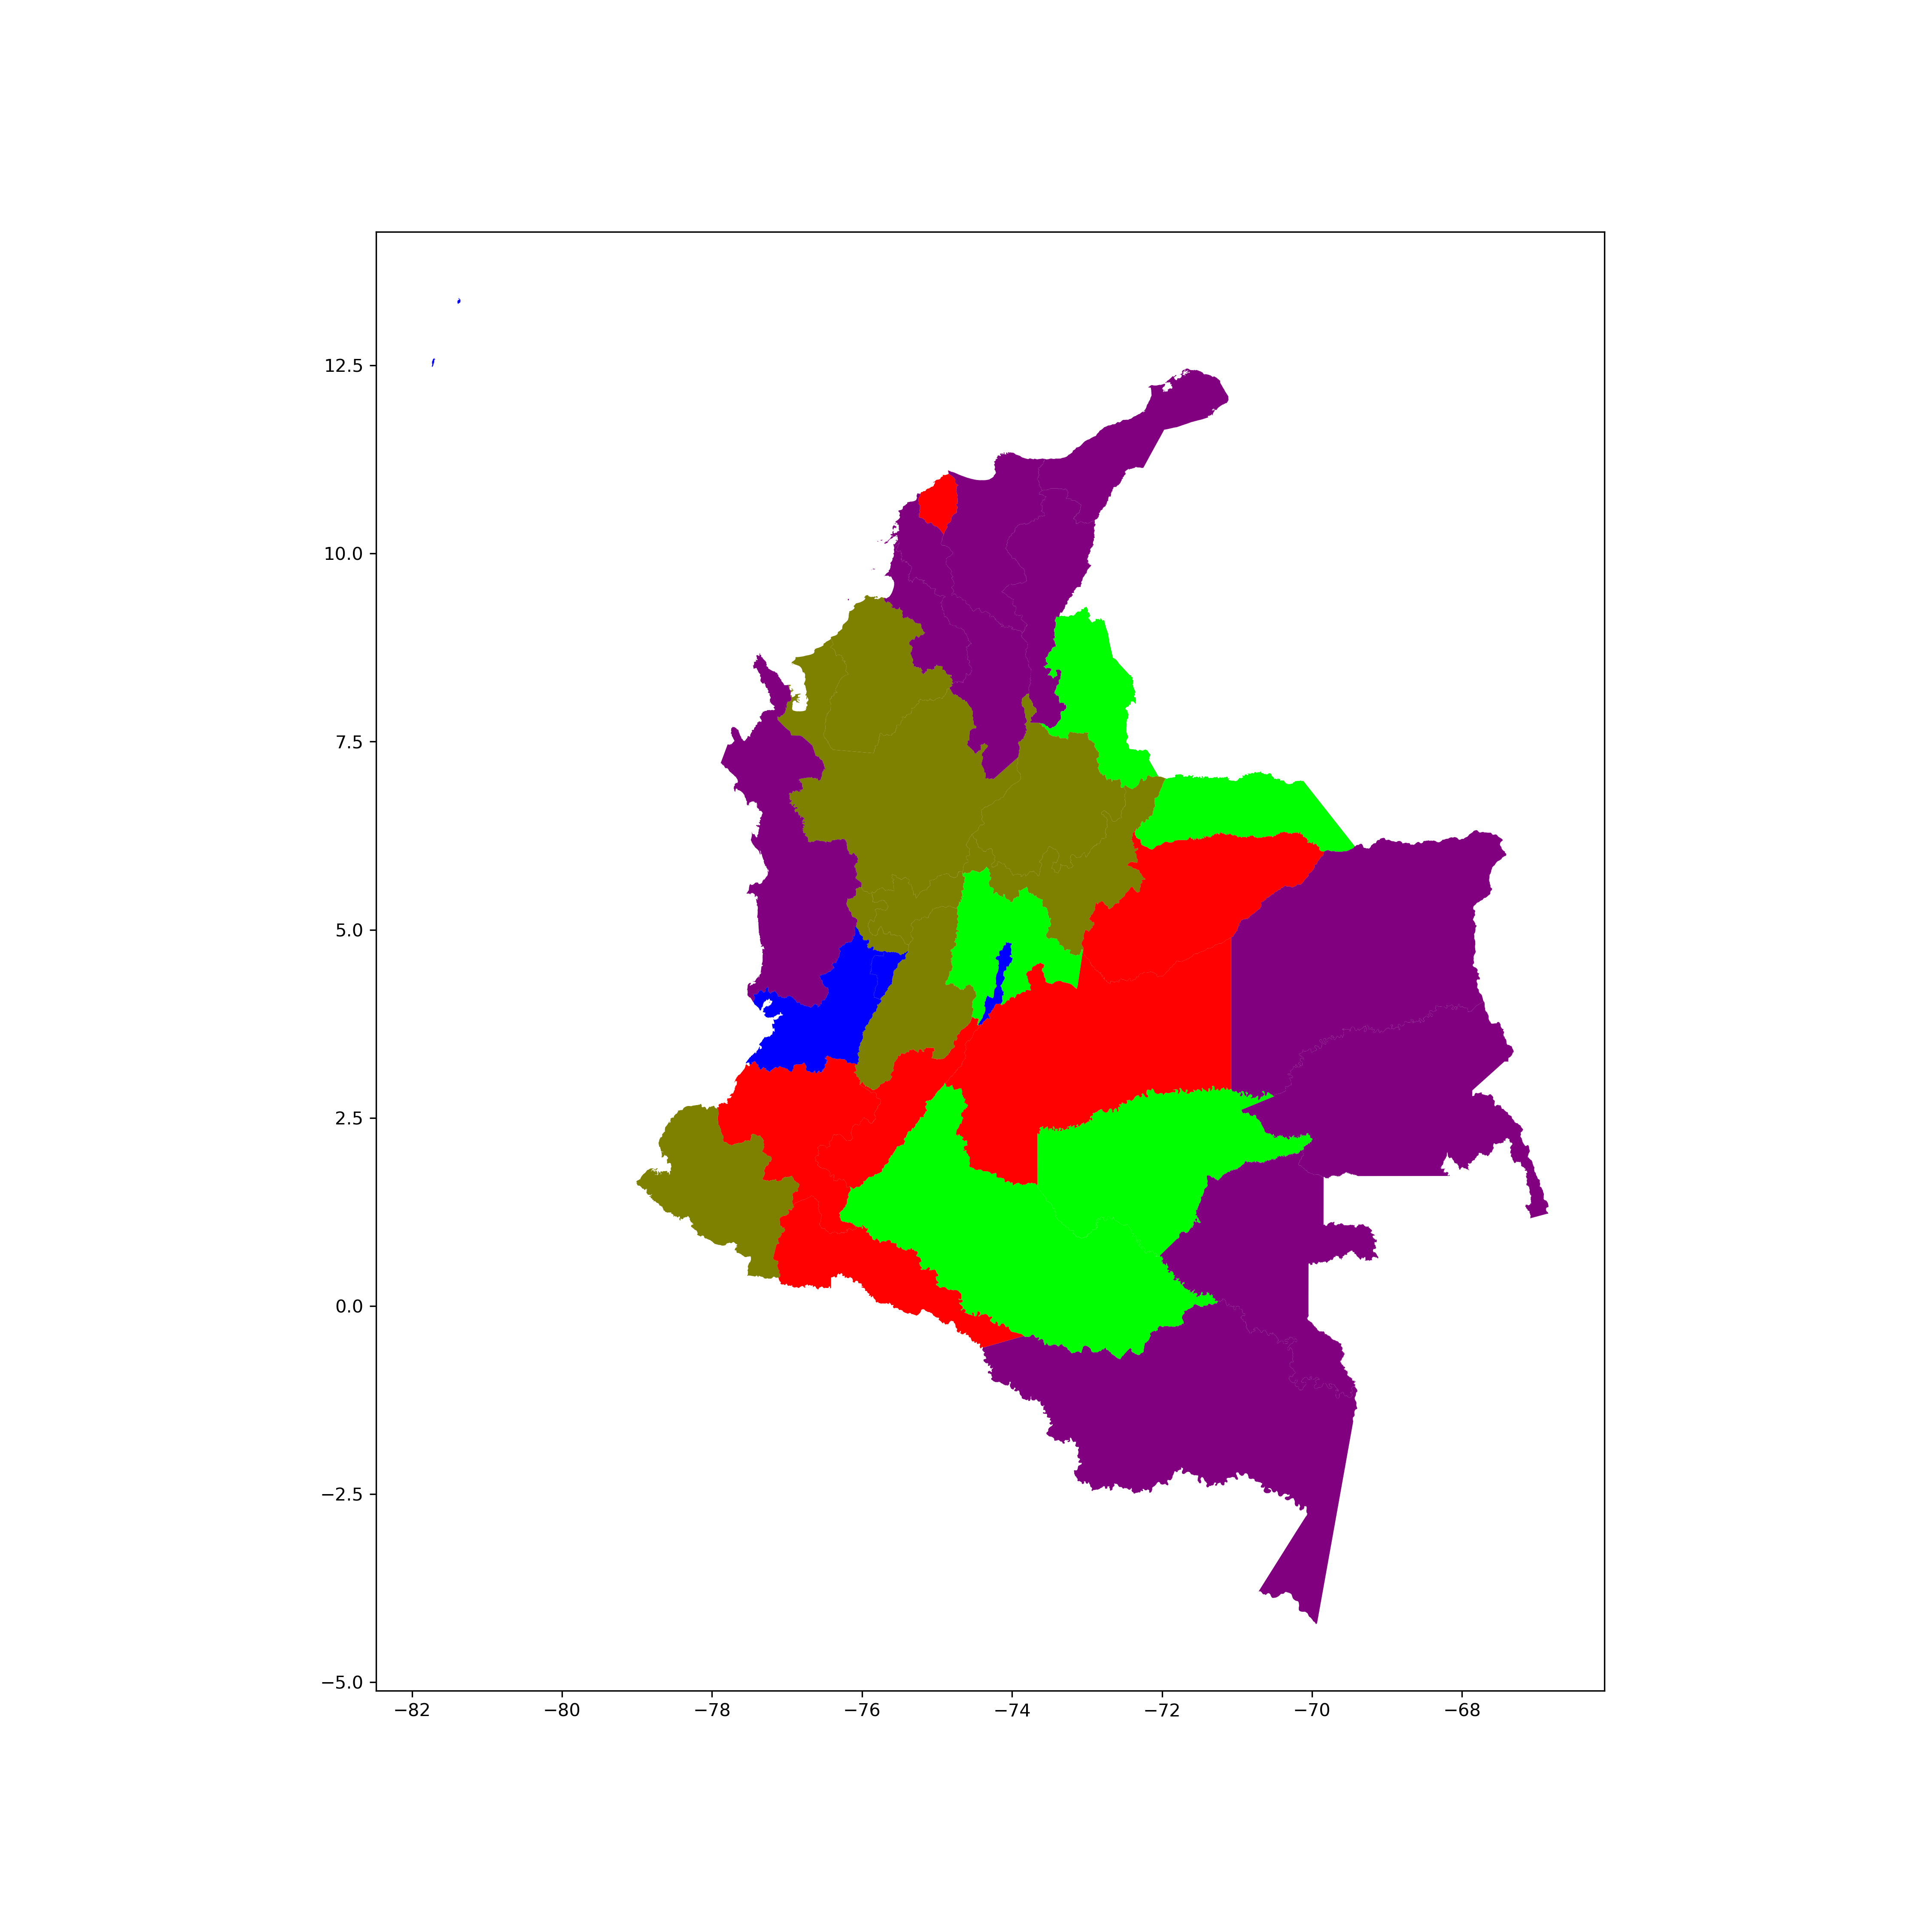
For the case of the symmetric auto-encoder and the genetic algorithms, the suggested number of clusters was very satisfactory (Figure 3). The clusters obtained from the symmetric auto encoder embedings clearly distinguished the four most densely populated Colombian departments. In contrast, the genetic algorithms produced one big contiguous cluster where only the capital city (Bogota) is differentiated.
5 Conclusions
Machine learning methods could provide reliable systems to assist in the development of public policies. In this work we proposed and tested a simple approach to generate groups of regions in Colombia with similar social, economic and health impact by the Covid-19 pandemic. The results obtained were satisfactory, the system naturally suggests five clusters and distinguishes departments with high populations regions from their surroundings.
Important questions arise for future works, such as the analysis of cluster centroids to gain some interpretability on the clustering process. Another downstream task is to compare the clusters generated at different dates by the system, and try to identify patterns related to vulnerable population, or the economic impact of a lockdown. We hope that this work will encourage more applications of machine learning related to the development of public policies.
Acknowledgments and Disclosure of Funding
We want to thank professor José Aguilar for supporting the project and the comments he gave on the manuscript also, to researcher Nicolás Páez for the fruitful discussions. Finally to EAFIT university and Colombian government that funded this work.
References
- (1) Franco Camila, Jaramillo Luis and Paez Nicolas “Estudio de la Geografía Sanitaria de Colombia (Study of the Sanitary Geography of Colombia)” Technical Report, Ministerio de Salud y Proteccion Social (Spanish), 2013 URL: https://www.minsalud.gov.co/sites/rid/Paginas/freesearchresults.aspx?k=paez
- (2) Rodrigo M Carrillo-Larco and Manuel Castillo-Cara “Using country-level variables to classify countries according to the number of confirmed COVID-19 cases: An unsupervised machine learning approach” In Wellcome Open Research 5.56 F1000 Research Limited, 2020, pp. 56
- (3) Giovanni Dell’Ariccia, Paolo Mauro, Antonio Spilimbergo and Jeromin Zettelmeyer “Economic policies for the COVID-19 war” In IMF Blog 1, 2020
- (4) Shuo Feng et al. “Rational use of face masks in the COVID-19 pandemic” In The Lancet Respiratory Medicine 8.5 Elsevier, 2020, pp. 434–436
- (5) Jerome Friedman, Trevor Hastie and Robert Tibshirani “The elements of statistical learning” Springer series in statistics New York, 2001
- (6) Xiaojie Jin et al. “Deep learning with s-shaped rectified linear activation units” In arXiv preprint arXiv:1512.07030, 2015
- (7) Hien Lau et al. “The positive impact of lockdown in Wuhan on containing the COVID-19 outbreak in China” In Journal of travel medicine 27.3 Oxford University Press, 2020, pp. taaa037
- (8) Rosa Lletı, M Cruz Ortiz, Luis A Sarabia and M Sagrario Sánchez “Selecting variables for k-means cluster analysis by using a genetic algorithm that optimises the silhouettes” In Analytica Chimica Acta 515.1 Elsevier, 2004, pp. 87–100
- (9) Aaron van den Oord et al. “Wavenet: A generative model for raw audio” In arXiv preprint arXiv:1609.03499, 2016
- (10) Md Arafatur Rahman et al. “Data-driven dynamic clustering framework for mitigating the adverse economic impact of Covid-19 lockdown practices” In Sustainable Cities and Society 62 Elsevier, 2020, pp. 102372
- (11) Slawek Smyl “A hybrid method of exponential smoothing and recurrent neural networks for time series forecasting” In International Journal of Forecasting 36.1 Elsevier, 2020, pp. 75–85
- (12) Ilya Sutskever, Oriol Vinyals and Quoc V Le “Sequence to sequence learning with neural networks” In Advances in neural information processing systems, 2014, pp. 3104–3112