Two young planetary systems around field stars with ages between Myr from TESS
Abstract
Planets around young stars trace the early evolution of planetary systems. We report the discovery and validation of two planetary systems with ages Myr from observations by the Transiting Exoplanet Survey Satellite. TOI-251 is a Myr old G star hosting a mini-Neptune with a day period. TOI-942 is a Myr old K star hosting a system of inflated Neptune-sized planets, with TOI-942b orbiting with a period of days, with a radius of , and TOI-942c orbiting in a period of days with a radius of . Though we cannot place either host star into a known stellar association or cluster, we can estimate their ages via their photometric and spectroscopic properties. Both stars exhibit significant photometric variability due to spot modulation, with measured rotation periods of days. These stars also exhibit significant chromospheric activity, with age estimates from the chromospheric calcium emission lines and X-ray fluxes matching that estimated from gyrochronology. Both stars also exhibit significant lithium absorption, similar in equivalent width to well-characterized young cluster members. TESS has the potential to deliver a population of young planet-bearing field stars, contributing significantly to tracing the properties of planets as a function of their age.
”
1 Introduction
The first few hundred million years of planet evolution sculpts the population of exoplanetary systems we observe today. The properties of young planetary systems help unravel the factors that shape the present-day population: in-situ formation, migration, and photo-evaporation. Probing the timescales of these mechanisms motivates us to search for planets within the first few hundred million years of their birth.
Recent searches for young planets have yielded a handful of discoveries with targeted radial velocity surveys and space-based transit monitoring. Dozens of planets have been identified in the 600-800 Myr old Praesepe and Hyades clusters (Quinn et al., 2012, 2014; Obermeier et al., 2016; Mann et al., 2016a; Ciardi et al., 2018; Mann et al., 2017; Livingston et al., 2018; Mann et al., 2018; Vanderburg et al., 2018; Rizzuto et al., 2018; Livingston et al., 2019). These discoveries enabled estimates of planet occurrence rates in million-year old cluster environments (e.g. Rizzuto et al., 2017).
To sample the earlier stages of planet evolution, transit searches have focused on members of known young stellar associations, finding planets with ages ranging from Myr. Observations from the K2 mission revealed planets within the Upper Scorpius moving group (Mann et al., 2016b; David et al., 2016) and Taurus-Auriga star-forming region (David et al., 2019b, a).
With the library of all sky photometry made available by the Transiting Exoplanet Survey Satellite (TESS, Ricker et al., 2016), planets around bright, young stars have been identified (e.g. Newton et al., 2019; Rizzuto et al., 2020; Mann et al., 2020, Plavchan et al. 2020, Newton et al. in-prep). These are the first planets around bright young stars that are suitable for in-depth characterizations, enabling the first obliquity measurements of newly formed planets (Zhou et al., 2020; Montet et al., 2020), as well as atmospheric studies in the near future.
However, star forming clusters begin to disperse within the first hundred million years of formation (Krumholz et al., 2019). Left behind are relatively young stars that can no longer be traced back to their source of origin. These stars can still be identified by their signatures of youth. Mamajek & Hillenbrand (2008) summarizes the activity signatures that can be used to provide approximate ages of Sun-like stars. The rapid rotation of these young stars lead to enhanced chromospheric activity and X-ray emission. Their current rotation rates can help guide the age estimates via gyrochronology. The abundance of lithium in the atmospheres of main-sequence Sun-like stars is also a useful youth indicator. Recent efforts to trace young field stars have made use of all-sky spectroscopic surveys to catalog large numbers of chromospherically active (e.g. Žerjal et al., 2013) and lithium bearing (e.g. Žerjal et al., 2019) stars.
These photometric and spectroscopic signatures of youth, however, are often detrimental to our ability to identify and characterize the planets these stars harbor. The photometric variations due to star spots and stellar rotation make transit planet searches more difficult. The same spot activity induces radial velocity variations on the level, masking the planetary orbits. Despite these difficulties, Sanchis-Ojeda et al. (2013) identified Kepler-63 b as a giant planet around a Myr young field star, and made use of the spot activity to infer its orbital obliquity via transit spot-crossing events. The small planets around K2-233 (David et al., 2018b) and EPIC 247267267 (David et al., 2018a) are additional examples of young field stars with ages of 100-700 Myr discovered by the K2 mission.
We report the discovery of a mini-Neptune around TOI-251, which we determine to have an age of Myr based on its rotational, spectroscopic, and X-ray properties. We also report the two inflated Neptunes around TOI-942, with an age of Myr from its rotation, spectroscopic, and X-ray age indicators. These planets were validated by a campaign of ground-based photometric and spectroscopic observations. In particular, the ability to predict future transit times degraded substantially over the year between the TESS discovery and subsequent follow-up efforts. Our ground based photometric follow-up campaign demonstrates the effectiveness of small telescopes in recovering the shallow 1 mmag transits that these small planets exhibit. These young planets around field stars open an untapped population that can help us construct the properties of planetary systems over time.
2 Candidate identification and follow-up observations
2.1 Identification of planet candidates by TESS
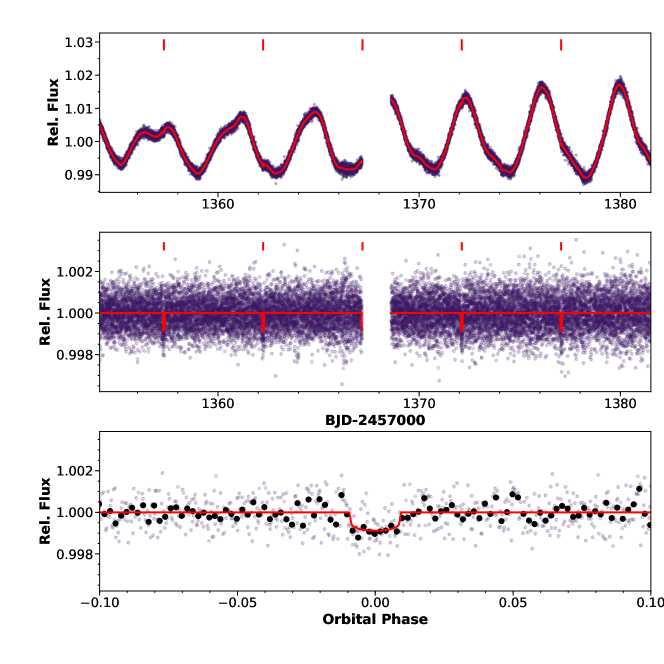
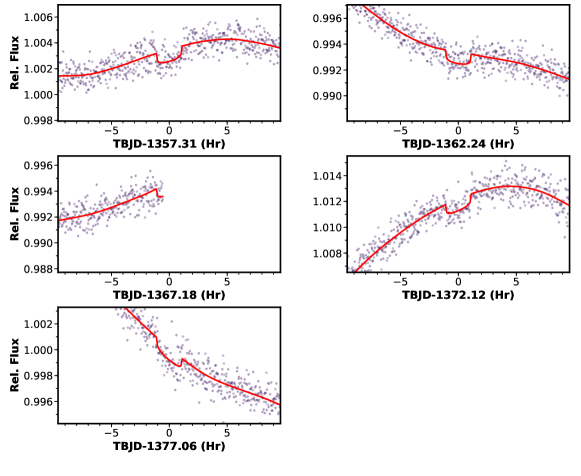
TIC 224225541 received TESS 2 minute cadenced target pixel stamp observations, as part of the TESS Candidate Target List (CTL Stassun et al., 2018) during Sector 2, between 2018 August 08 and September 09, with the target star being located on Camera 2, CCD 4 of the TESS array. Light curves and transit identification were made possible via the Science Processing Observation Center (SPOC, Jenkins et al., 2016). The transits of the mini-Neptune were detected as per Twicken et al. (2018) and Li et al. (2019), with a multiple event statistic of 10.9, and were released to the community as TOI-251b, with an orbital period of days. We make use of the Simple Aperture Photometry made available for this star for further analysis (Twicken et al., 2010; Morris et al., 2020). The TESS light curve of TOI-251 is shown in Figure 1, and individual transits of TOI-251b in Figure 2.
TIC 146520535 was observed during Sector 5 of the primary mission, between 2018 November 15 and December 11, by the Camera 2 CCD 2 Full Frame Images at 30 minute cadence. The MIT quicklook pipeline (Huang et al., 2019) identified a set of transit events at 4.331 day with signal to pink noise ratio of 11.7, and released as TOI-942b. In subsequent visual examinations of the light curves, two single transits of slightly deeper depth than TOI-942b were identified in the light curves spaced days apart. Further analysis showed that these two single transits are identical in depth and duration, and are due to a second planet candidate TOI-942c.
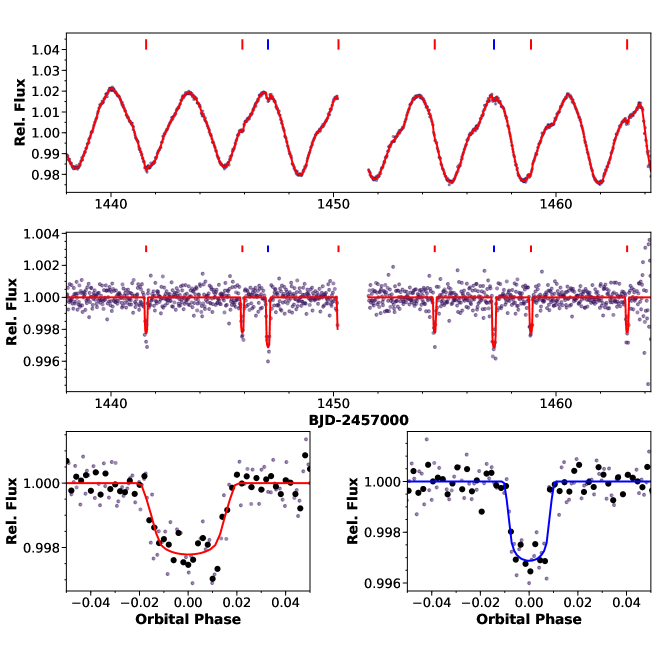
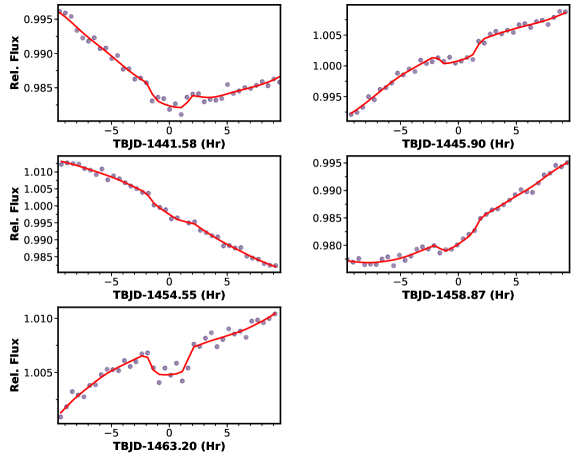
We then extracted the light curves for TOI-942 from the public Full Frame Images (FFIs) made available on the MAST archive using the lightkurve package (Barentsen et al., 2019). A pixel FFI cutout was extracted around the target star using the TESScut function (Brasseur et al., 2019). The photometric aperture was defined to encompass the brightest of pixels, within a maximum radius of 3 pixels from the target star coordinates. Surrounding pixels without nearby stars are used for background subtraction. The TESS light curve of TOI-942 is shown in Figure 3, individual transits of TOI-942b and c are shown in Figure 4 and 5 respectively.

2.2 Spectroscopic follow-up
2.2.1 SMARTS 1.5 m / CHIRON
We obtained a series of spectroscopic observations with the CHIRON facility to characterize the host star properties and constrain the masses of the planets in each system. CHIRON is a high resolution spectrograph on the 1.5 m SMARTS telescope, located at Cerro Tololo Inter-American Observatory (CTIO), Chile (Tokovinin et al., 2013). CHIRON is fed through an image slicer via a fiber, yielding a spectral resolving power of over the wavelength region 4100 to Å.
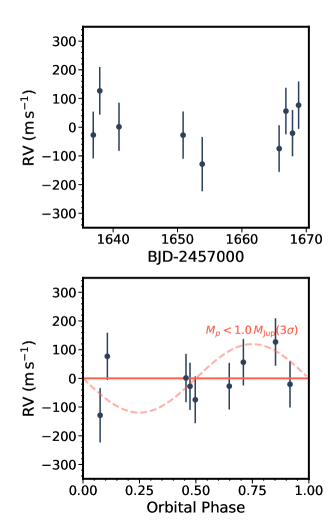
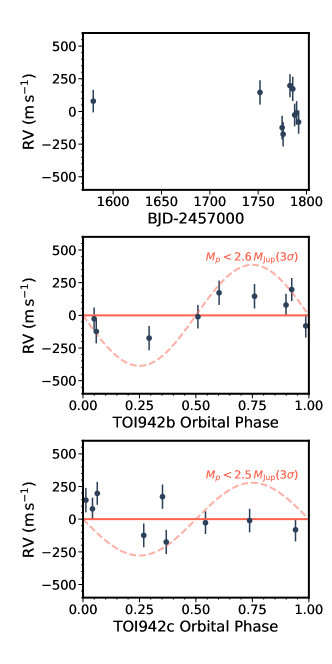
Radial velocities were extracted from CHIRON spectra by fitting the line profiles derived from each spectra. The line profiles are measured via a least-squares deconvolution of the observed spectra against synthetic templates (following Donati et al., 1997), and are listed in Table 1 and Table 2, and plotted in Figures 6 and 7.
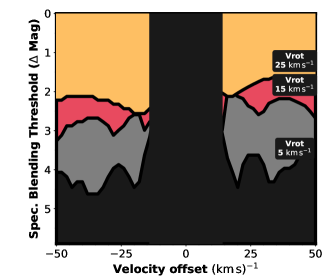
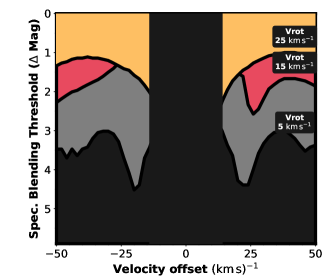
In addition to providing radial velocity and stellar atmosphere parameter measurements, the CHIRON spectra also allow us to search for additional blended spectral companions that may be indicative of other astrophysical false positive scenarios for these systems. We perform a signal injection and recovery exercise to determine the detection thresholds for any additional spectroscopic stellar companion that may be blended in the spectrum. The detectability of the blended source is determined by its flux ratio and velocity separation to the target star, and its rotational broadening. As such, we performed iterations of the injection, with different combinations of these factors, to the averaged spectroscopic line profile for each target star. The derived detection thresholds are shown in Figure 8. We can rule out non-associated any stellar companions with for TOI-251, assuming they exhibit minimal rotational broadening and substantial velocity separation between the target star and the blended companion. Similarly, we can rule out blended, non-associated, slowly rotating stellar companions with for TOI-942. Our ability to detect such companions degrade significantly if they are rapidly rotating, or if they have similar systemic velocities to the target star.
We also made use of the CHIRON observations to measure the projected rotational velocity of the host stars. Following Zhou et al. (2018), we model the line profiles derived from the CHIRON spectra via a convolution of kernels representing the rotation, radial-tangential macroturbulence, and instrument broadening terms. The rotational and radial-tangential macroturbulence kernels follow the prescription in Gray (2005), while the instrument broadening kernel is represented by a Gaussian function of width that of the instrument resolution. For TOI-251, we measured a projected rotational broadening velocity of , and macroturbulent velocity of . For TOI-942, we measure , and . We note that for slowly rotating stars, there is significant degeneracy between various line broadening parameters. These degeneracies can systematically impact future observations, such as transit spectroscopic obliquity observations, or estimates of the line-of-sight inclination of the system.
| BJD-TDB | RV | RV Error | Inst |
|---|---|---|---|
| 2458472.59427 | -2.323 | 0.031 | TRES |
| 2458636.91068 | -2.087 | 0.013 | CHIRON |
| 2458637.92204 | -1.933 | 0.019 | CHIRON |
| 2458640.90185 | -2.058 | 0.024 | CHIRON |
| 2458650.86649 | -2.087 | 0.018 | CHIRON |
| 2458653.83789 | -2.188 | 0.050 | CHIRON |
| 2458665.79446 | -2.134 | 0.013 | CHIRON |
| 2458666.84512 | -2.004 | 0.010 | CHIRON |
| 2458667.86580 | -2.080 | 0.006 | CHIRON |
| 2458668.80856 | -1.983 | 0.019 | CHIRON |
| BJD-TDB | RV | RV Error | Inst |
|---|---|---|---|
| 2458579.51343 | 25.400 | 0.024 | CHIRON |
| 2458751.87828 | 25.467 | 0.043 | CHIRON |
| 2458774.79336 | 25.197 | 0.038 | CHIRON |
| 2458775.80474 | 25.147 | 0.043 | CHIRON |
| 2458782.85938 | 25.518 | 0.031 | CHIRON |
| 2458785.79240 | 25.493 | 0.044 | CHIRON |
| 2458787.72494 | 25.294 | 0.026 | CHIRON |
| 2458789.71153 | 25.310 | 0.036 | CHIRON |
| 2458791.77641 | 25.240 | 0.033 | CHIRON |
| 2458775.91595 | 25.181 | 0.267 | TRES |
| 2458786.92907 | 25.024 | 0.074 | TRES |
TOI-251
 TOI-942
2.2.2 FLWO 1.5 m / TRES
We also obtained observations of TOI-251 and TOI-942 with the Tillinghast Reflect Echelle Spectrograph (TRES, Fűrész, 2008) on the 1.5 m reflector at the Fred Lawrence Whipple Observatory (FLWO), Arizona, US. TRES is a fiber-fed echelle spectrograph with a resolution of over the spectral region of . The observing strategy and reduction procedure are outlined in Buchhave et al. (2012).
One observation was obtained for TOI-251, and two for TOI-942. These spectra were used to measure the stellar atmospheric properties of the host stars via the Stellar Parameter Classification pipeline (Buchhave et al., 2010), subsequently used as priors in our global analyses (Section 5). We find TOI-251 to be a Sun-like stellar surface effective temperature of K, surface gravity of dex, and metallicity of dex. TOI-942 is an early K star with K, dex, and dex.
2.3 Photometric follow-up
| Target | Facility | Date(s) | Number of Images aa Outlying exposures have been discarded. | Cadence (s) bb Median time difference between points in the light curve. Uniform sampling was not possible due to visibility, weather, pauses. | Filter |
|---|---|---|---|---|---|
| TOI-251 | WASP | 2006-05-15 – 2014-12-06 | 132002 | 37 | WASP |
| (Over 8 observing campaigns) | |||||
| TOI-251 | TESS | 2018-08-23 – 2018-09-20 | 18316 | 120 | |
| TOI-251 | LCO-SSO | 2019-07-23 | 148 | 127 | |
| TOI-251 | MKO | 2019-07-28 | 168 | 89 | |
| TOI-251 | MEarth | 2019-08-22 | 1749 | 12 | MEarth band |
| TOI-942 | WASP | 2006-09-15 – 2014-12-09 | 87361 | 30 | WASP |
| (Over 10 observing campaigns) | |||||
| TOI-942 | TESS | 2018-11-15 – 2018-12-11 | 1188 | 1799 | |
| TOI-942 | MEarth | 2019-11-05 | 1680 | 10 | MEarth band |
| TOI-942 | MEarth | 2019-11-13 | 1791 | 10 | MEarth band |
| TOI-942 | MEarth | 2019-11-15 | 1814 | 11 | MEarth band |
| TOI-942 | MEarth | 2019-11-17 | 2346 | 6 | MEarth band |
| TOI-942 | MEarth | 2019-11-25 | 1974 | 10 | MEarth band |
| TOI-942 | MEarth | 2019-11-30 | 2049 | 11 | MEarth band |
| TOI-942 | MEarth | 2019-12-05 | 2488 | 10 | MEarth band |
| TOI-942 | MEarth | 2019-12-26 | 2223 | 5 | MEarth band |
We obtained a series of ground-based photometric follow-up observations to confirm that the transits are on-target, eliminate false-positive scenarios, and refine the ephemeris and orbital parameters.
Full and partial transits of TOI-251b, TOI-942b, and TOI-942c were obtained by an array of ground-based observatories. In particular, with only two transits in the TESS observations, the ephemeris uncertainty for TOI-942c was as large as 5 hours, whilst the uncertainties for the shorter period planets TOI-251b and TOI-942b were 2 hours. The first attempts at recovering the transits of both planets failed due to these large uncertainties, but were still useful in refining the transit predictions. Subsequent attempts fortuitously captured partial transits, leading to the recovery of the ephemeris.
2.3.1 Las Cumbres Observatory
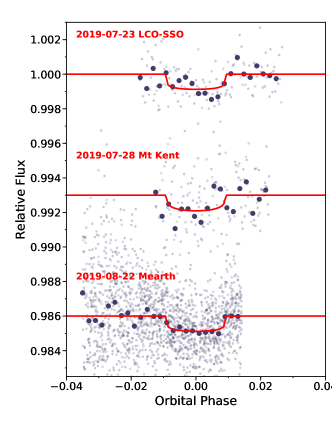
Las Cumbres Observatory Global Telescope (LCOGT) is a global network of small robotic telescopes (Brown et al., 2013). A full transit of TOI-251b was observed by the 1 m LCOGT telescope located at Siding Spring Observatory, Australia. The observations are scheduled via the TESS Transit Finder, which is a customized version of the Tapir software package (Jensen, 2013). The observations were obtained with the Sinistro camera, in the band on the night of 2019-07-23. The LCOGT images were calibrated by the standard LCOGT BANZAI pipeline (McCully et al., 2018) and the photometric data were extracted using the AstroImageJ (AIJ) software package (Collins et al., 2017a), showing a likely detection of the 1 mmag transit event. Nearby stars were cleared for signs of eclipsing binaries, showing that the transit event is on target to within seeing limits. The observation is shown in Figure 9.
2.3.2 Mt. Kent Observatory
A full transit of TOI-251b was observed with the University of Louisville Research Telescope at Mt. Kent Observatory, Queensland, Australia. The University of Louisville Research Telescope is a PlaneWave Instruments CDK700 0.7 m telescope equipped with a 4 K4 K detector. The observation on 2019-07-28 was obtained in the band, spanning four hours, with an average exposure time of . Photometry was extracted using AstroImageJ (Collins et al., 2017b), showing a successful detection of the transit event. The nearby stars were again checked for signatures of eclipsing binaries, with none detected.
2.3.3 MEarth
The MEarth instruments are described in detail by Irwin et al. (2015) and for brevity we do not repeat those details here.
For the majority of the MEarth observations listed in Table 3, we adopted a standard observational strategy used for bright TOIs where all but one of the available telescopes at a given observing site are operated defocused to obtain photometry of the target star, and one telescope observes in focus with the target star saturated to obtain photometry of any nearby contaminating stars not properly resolved in the defocused observations. Once these stars had been fully ruled out as the source of the transits, we simply used all telescopes in defocused mode to obtain a slight improvement in sampling. This was done for the observation of TOI-251 and for the last two observations of TOI-942 (2019-12-05 and 2019-12-26) only.
With the exception of the observation of TOI-251 on 2019-11-17 which was gathered from both MEarth-North and MEarth-South simultaneously (using a total of 15 telescopes, 8 at MEarth-North and 7 at MEarth-South), all other observations were gathered from MEarth-South using 7 telescopes. For TOI-942 exposure times were 60s on all telescopes and the defocused telescopes used a half flux diameter (HFD) of 12 pixels. For TOI-942 we used a defocus setting of 6 pixels HFD and an exposure time of 60s for the defocus telescopes and 30s for the single in-focus telescope at MEarth-South, and 8 pixels HFD with all telescopes using 60s exposure times at MEarth-North. These instruments use a different model of CCD so have different pixel scales (0.84 arcsec/sec at MEarth-South and 0.76 arcsec/sec at MEarth-North) and require slightly different observational setups to achieve the same saturation limit.
Data were gathered continuously subject to twilight, zenith distance, and weather constraints. Telescope 7 at MEarth-South used in the defocus ensemble had a shutter stuck in the open position for all observations but this does not appear to affect the light curves despite visible smearing during readout. All data were reduced following standard procedures detailed in Irwin et al. (2007); Berta et al. (2012). Photometric aperture radii for extraction of the defocus time series of the target star were 24 pixels for TOI-251, 9.9 pixels for TOI-942 at MEarth-South, and 12.7 pixels for TOI-251 at MEarth-North.
 |
 |
2.3.4 WASP archival observations
TOI-251 and TOI-942 also received multi-season monitoring by ground-based transit surveys. The Wide Angle Search for Planets (WASP) Consortium (Pollacco et al., 2006) observed both target stars with the Southern SuperWASP facility, located at the Sutherland Station of the South African Astronomical Observatory. Each SuperWASP station consists of arrays of eight commonly mounted 200 mm f/1.8 Canon telephoto lenses, equipped with a detector yielding a field of view of per camera.
TOI-251 and TOI-942 received eight years of WASP observations, spanning 2006 to 2014. The spot modulation signal is clear in the WASP datasets for both host stars. We made use of these observations in Section 4 to confirm that the rotation period we measure from TESS is robust and consistent with that seen over the significantly longer timescales of the WASP observations.
2.4 High spatial resolution imaging
We obtained a series of high spatial resolution imagery of the target stars to check for blended nearby stellar companions. Such companions can be the source of false positive signals due to stellar eclipsing binaries, or dilute the planetary transit signal leading to systematically smaller planet radius measurements.
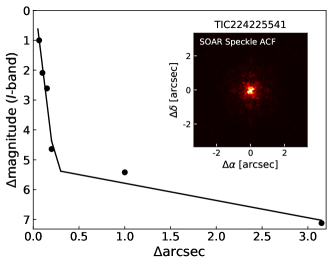
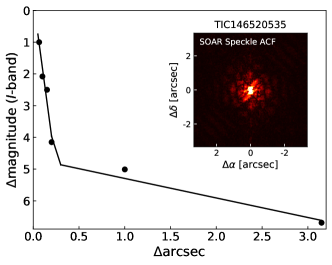
Observations of TOI-251 and TOI-942 were obtained as part of the Southern Astrophysical Research (SOAR) TESS survey (Ziegler et al., 2020). Speckle imaging observations were obtained with the Andor iXon-888 camera on the 4.1 m SOAR telescope. Observations of TOI-251 were obtained on 2019 May 18, and TOI-942 on 2019 November 19. Each target star observation involved 400 frames of binned pixels about the target, with a pixel scale of , obtained over the course of 11 s. The observations were reduced as per Tokovinin (2018). The speckle auto cross correlation functions from these observations are shown in Figure 11. No stellar companions were detected for either target star.
 |
 |
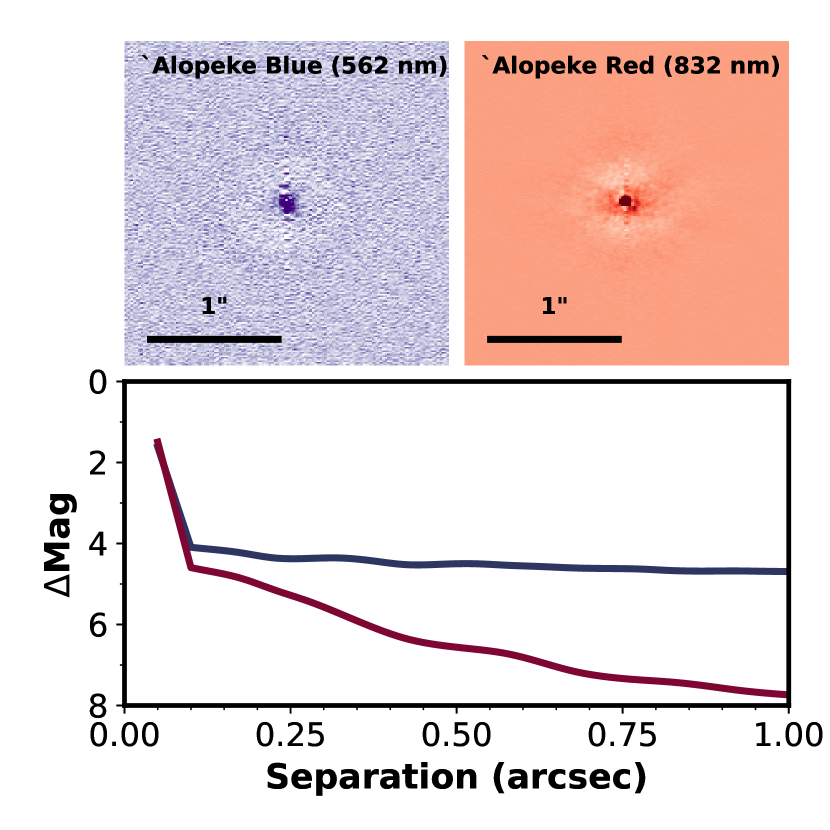
We also obtained speckle observations of TOI-942 with ′Alopeke at the 8 m Gemini-North observatory, located on Mauna Kea, Hawaii. The observation, obtained on 2019 October 14, incorporates a 1-minute integration involving 1000 60 ms exposures of pixel subarrays about the target star. These observations have resulting spatial resolutions of FWHM in the blue, and in the red, yielding an inner working angle of 3 AU at the distance to TOI-942. The analysis and detection limits were derived as per Howell et al. (2011) and Howell et al. (2016). The speckle images and limits on companions are shown in Figure 12. Note that the observations were obtained at relatively high airmass, and as such the blue reconstructed image is adversely affected. No stellar companions are detected in either channel.
3 Elimination of false positive scenarios
A number of astrophysical false positive scenarios can imitate the transit signals of planetary systems. Eclipsing binaries in grazing geometries, or nearby faint eclipsing binaries can exhibit transits of depths similar to that of transiting super-Earths and Neptunes in extreme scenarios.
The possibility that our target stars are actually grazing eclipsing binaries is extremely unlikely given their well-resolved box-shaped transits. Nevertheless we obtained a series of radial velocity observations for both target stars. Radial velocity variation at the level can be indicative of the companion being of stellar mass, or the target star being spectroscopically blended with a background eclipsing binary.
We obtained nine spectra of each target star, and derived radial velocities from each via a least-squares deconvolution analysis (Section 2.2.1). As expected for young stars, these velocities exhibited significant astrophysical jitter beyond their velocity uncertainties. The mean uncertainty of the velocities for TOI-251 is , while the velocity scatter is significantly higher at . Similarly, the mean uncertainty in the velocities of TOI-942 is , but the velocity scatter is at .
Nevertheless, the lack of a detectable radial velocity orbit to within for both target stars rules out the possibility that they are orbited by stellar companions. In section 5, we derive upper limits to the masses of any orbiting companions around our target stars. The velocities of each system are modeled assuming circular orbits for each planet; the stellar activity is accounted for via a jitter term. We make no attempts at correcting for the stellar jitter via decorrelation against stellar activity indicators, nor make use of Gaussian processes to model possible rotational signals in the velocities. Through this simple exercise, we find mass upper limits of for TOI-251b, for TOI-942b, and for TOI-942c. Future examination making use of stellar activity markers can further refine the masses of these planets.
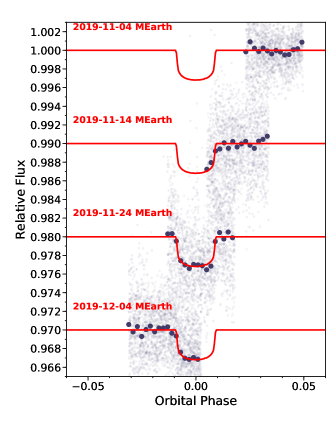
The plate scale of TESS often makes it difficult to distinguish the true source of transit signals in crowded fields. Fainter eclipsing binaries whose depths are diluted by the flux from the target star can often be misinterpreted as planet candidates. We obtained ground-based follow-up photometric confirmation of all planet candidates around TOI-251 (Figure 9) and TOI-942 (Figure 10). The on-target detection of the transits shows that the transit signal originates from the target stars to within the spatial resolution of of our ground-based follow-up facilities.
From the high spatial resolution speckle images presented in Section 2.4, we can also eliminate the presence of any stellar companions with within of our target stars. No Gaia stars are catalogued within of these target stars. Similarly, no slowly rotating spectroscopic blended companions were detected from our CHIRON observations (Section 2.2.1) at .
We can estimate the probability that a faint eclipsing binary lying unresolved by our high resolution speckle images is causing the transit signals. The transit shape, and the ratio between the ingress and totality timescales, can inform us about the brightness of any diluted background eclipsing binary that may be causing the transit signal (Seager & Mallén-Ornelas, 2003). We follow Vanderburg et al. (2019) and estimate the brightest possible background eclipsing binary that may be inducing our transit signal. The maximum difference in magnitude is given by , where is the duration of ingress, is the duration between first and third contact, and is the depth of the transit.
We find that for TOI-251b, the transit can only be caused by a background eclipsing binary with and 3.0 significance. From our diffraction limited observations of TOI-251, we excluded stellar blends within 0.2′′ to a brightness contrast of magnitudes. For a randomly chosen star in a direction near TOI-251, the density of stars within the ground-based exclusion radius of 0.2′′ is . Though TOI-251 is not randomly chosen, it is far from the galactic plane, where background eclipsing binaries are expected to be roughly two orders of magnitude less common than true planets (Sullivan et al., 2015, Figure 30). While not formally impossible, the combined transit shape, lack of companions detectable by diffraction limited imaging, lack of secondary spectroscopic lines, and line of sight of TOI-251 lead background eclipsing binary scenarios to be highly disfavored.
For TOI-942, a similar calculation yields that a background eclipsing binary no fainter than 2.68 magnitudes is required to cause the transits of either one of its two planets. If it were a randomly chosen star, then the chance of there being another background star within ” is at . The chance that two such background eclipsing binaries exist inducing our multi-planet transiting signal is . The low probability of such an occurrence, the multi-planet nature of the system, and the lack of any companions from diffraction limited imaging and spectroscopy, lead to eclipsing binary scenarios being disfavored.
4 Estimating the age of young field stars
It is notoriously difficult to estimate the ages of field stars. However, young Sun-like stars exhibit rotational and activity induced photometric and spectroscopic behavior that make it possible to approximate their ages. These activity and rotation period properties can typically be calibrated via well-characterized clusters (Mamajek & Hillenbrand, 2008) to provide age relationships that can be used for dating purposes.
Sun-like stars spin down over their main-sequence lifetimes through mass loss via stellar-wind processes. Whilst the Sun has a present-day rotation period of 24 days, similar stars in the 120 Myr old Pleiades cluster have rotation periods of days. The rapid rotation and consequentially stronger dynamo of young stars excites strong spot and chromospheric activity. Observable chromospheric activity indicators, such as emission in the core of the calcium II lines, as well as X-ray emission, can be used as proxies for rotation and age of young Sun-like stars. The element lithium is destroyed in the cores of Sun-like stars through proton collisions. Through convective mixing processes, this leads to a rapid depletion of lithium in the stellar atmosphere within the first Myr of their lives. The strength of the lithium 6708 Å absorption feature has traditionally being used as a youth indicator for Sun-like stars.
We made use of these photometric and spectroscopic properties to estimate the ages of TOI-251 and TOI-942. Though these estimates are imprecise given the field nature of our target stars, they generally agree sufficiently for us to place meaningful age constraints on these target stars.
4.1 Lithium depletion
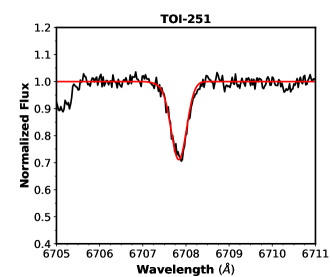
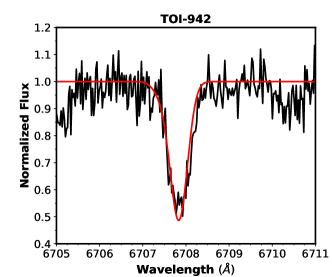
The strength of atmospheric lithium absorption in the spectra of convective envelope stars is also a commonly adopted age indicator. We make use of the Li line as another age estimator for our targets. The Li line equivalent widths are estimated by fitting three Gaussian profiles, accounting for the Li doublet at and , and the nearby Fe I line at that is often blended with the Li features. Each line is assumed to be of equal width, and the two Li lines are also assumed to be of equal height. Using the TRES observations we obtained for both target stars, we measured equivalent widths of the Li line to be for TOI-251, and for TOI-942.
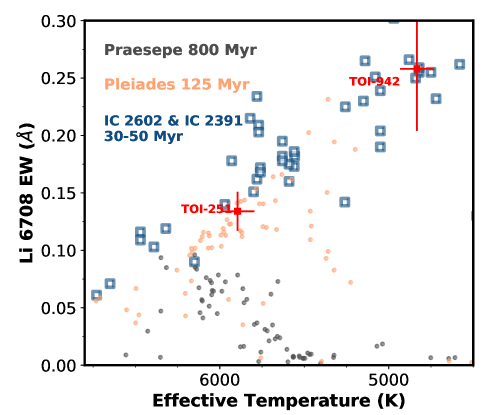
To compare the lithium absorption feature of our target stars against stars in well characterized clusters and associations, we obtained a series of spectra of members of the IC 2602, IC 2391, Pleiades, and Praesepe groups. Spectra and measurements of Pleiades and Praespe members come from long-term radial-velocity surveys for planets in open clusters using the TRES spectrograph. Two such surveys, in Praesepe and the Hyades, are described in Quinn et al. (2012) and Quinn et al. (2014). With the goal of measuring low-amplitude RV variation, the spectra are typically high SNR, and therefore support precise measurement of Li equivalent widths. Li measurements for IC 2602 and IC 2391 members are adapted from Randich et al. (1997) and Randich et al. (2001).
Figure 13 shows the Li 6708 Å equivalent widths of the target stars, in comparison with the same measurements for membership stars. The Li line strength of TOI-251 agrees with that of Pleiades members, whilst TOI-942 exhibits significantly stronger Li absorption than equivalent stars in Pleiades.
 |
 |
4.2 Activity-age relationships
Both stars exhibit significant chromospheric emission in the near-ultraviolet calcium II H and K lines and the near-infrared calcium II triplet. Both stars are also detected in X-ray with the ROSAT all-sky survey, while TOI-942 is detected in the GALEX NUV band. Chromospheric emission is a proxy for stellar rotation, being generated due to the stronger magnetic dynamo of the rapidly rotating young stars (e.g. Noyes et al., 1984). We make use of the Mount Wilson index to compare the chromospheric emission of our target stars from the TRES spectra against literature activity-age relationships, as explained in the next section.
4.2.1 Calcium II HK emission
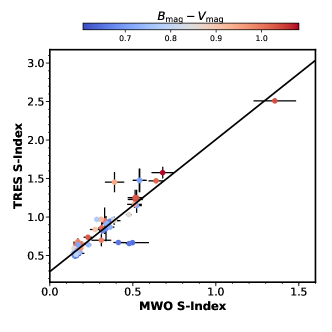
Both calcium II H and K lines are captured within TRES echelle orders. We measure calcium II HK emission core emissions in a band wide centered about each line. The baseline flux is estimated from wide bands over the continuum regions on either side of the line center. Figure 14 shows our calcium line strength measurements for Sun-like stars against that of catalog values of the same stars from the Mount Wilson Observatory HK Project (Wilson, 1978; Vaughan et al., 1978; Duncan et al., 1991; Baliunas et al., 1995). With the exception of a few active outlying stars, we find that our line emission flux estimates can be translated to the index with a simple linear transformation, with an uncertainty of . The calcium II HK line strength, as a function of the bolometric flux , is then calibrated using the relationship from Noyes et al. (1984), via the PyAstronomy (Czesla et al., 2019) SMW_RHK function. The and values for the target stars are listed in Table 4. The uncertainties in these values are computed as the quadrature addition of uncertainty in the TRES emission flux to calibration, and the scatter of the measurements between each observation.
The calcium II HK luminosity can be correlated with stellar age. We make use of the calibration from Mamajek & Hillenbrand (2008) (Equation 3) to calculate the calcium II HK ages of our target stars. TOI-251 has an age of Myr, with a regime ranging from 3 to 170 Myr, consistent with the gyrochronology estimate. TOI-942 is estimated to have an age of Myr, with a upper limit of 100 Myr. The activity age estimate is significantly younger than that from gyrochronology. We note that with , the calcium II HK emission from TOI-942 is near the limits of the calibrated range of the Mamajek & Hillenbrand (2008) relations of , corresponding to a lower age boundary of 8 Myr. Stars as young as TOI-942 have saturated chromospheric emission features, making it difficult for us to derive precise ages from these spectroscopic indicators.
 |
 |
4.2.2 Infrared calcium II triplet emission
The infrared calcium II triplet at , and also exhibit line core emission in active stars. Both TOI-251 and TOI-942 exhibit strong core emission in the infrared. The and lines are well placed within the TRES spectral orders. To measure the core emission equivalent widths of these lines, we first fit and remove a synthetic spectral template, and fit the residuals about the calcium lines with a Gaussian profile. The synthetic template is an ATLAS9 (Castelli & Kurucz, 2004) atmosphere model, convolved with the instrumental and rotational broadening kernel of the target star. The synthetic template is then subtracted from the continuum normalized observed spectrum. The resulting residuals about each calcium line are fitted with a Gaussian, with width corresponding to the line broadening of the spectrum, and with centroid fixed to the expected central wavelength of each line.
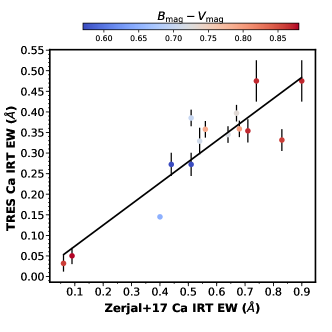
Figure 14 shows the equivalent widths as measured from TRES against the same stars that were characterized by Žerjal et al. (2017). For Sun-like stars, a linear transformation between our TRES observations and the literature values is sufficient, with a scatter in the resulting relationship of .
We measure calcium II infrared triplet equivalent widths of for TOI-251 and for TOI-942. Žerjal et al. (2017) offers a qualitative age – calcium triplet relationship from their calibration of cluster stars. The infrared triplet emission of TOI-251 makes it compatible with similar stars in the 100-1000 Myr range, whilst TOI-942 falls in the Myr age range.
4.2.3 X-ray emission
Young, rapidly rotating stars are also known to exhibit X-ray emission. TOI-251 is an X-ray source in The Second ROSAT Source Catalog of Pointed Observations (Rosat, 2000), while TOI-942 is an X-ray source in the ROSAT all-sky faint source catalog (Voges et al., 2000). Their X-ray count rates, hardness ratios, and luminosities are provide in Table 4. We adopt the calibration provided in Fleming et al. (1995) for the conversion between the X-ray count rate to an X-ray luminosity , finding an X-ray luminosity of for TOI-251, and for TOI-942. Using the age – X-ray luminosity relationship from Mamajek & Hillenbrand (2008) (Equation A3), we derive an estimated age of Myr for TOI-251, but the age upper limit is not constraining due to the scatter in the distribution. For TOI-942, we find an X-ray age of Myr, with a upper limit of 250 Myr. Like our Ca II HK and infrared triplet estimates, the X-ray luminosity is saturated for this calibration above (corresponding to an 8 Myr lower limit). TOI-942 is more active than the calibrated range of the Mamajek & Hillenbrand (2008) relationships, so our age estimate is at best qualitative.
4.2.4 NUV detection
Ultraviolet emission from active chromospheres can also be an indicator of youth for Sun-like stars. TOI-942 has a measurable flux in the NUV band of the GALEX all-sky catalogue (Bianchi et al., 2017). Findeisen et al. (2011) calibrated a / colour-colour relationship using Hyades, Blanco 1, and moving group members, with a resulting scatter in the determined ages of dex. We adopt this relationship, and find an NUV age for TOI-942 of Myr. We note that there is significant scatter in the relationship between NUV flux and age, and as such the range of the NUV age estimate is only constraining to Gyr.
4.3 Rotation Period and Gyrochronology
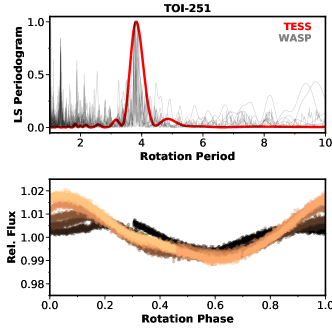
TOI-251 and TOI-942 exhibit significant spot-induced rotational modulation in their TESS light curves. These light curves, folded over the rotational period, are shown in Figure 15. The periodograms from a Lomb-Scargle analysis of the single sector of TESS observations, as well as each observing campaign of the WASP observations, are shown.
 |
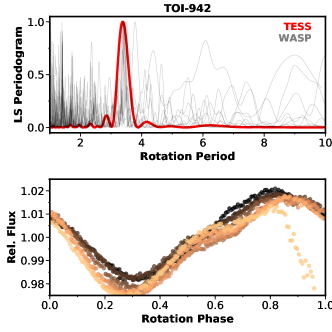 |
From the TESS light curves, we measure a rotation period for TOI-251 of days, while TOI-942 has a rotation period of days. Similarly, the WASP observations yielded rotation periods of days for TOI-251, and for TOI-942. The longevity of this activity signal from TESS and WASP gives us confidence that the periodicity we quote is the rotation period of the host stars.
We adopt a few gyrochronology relationships to estimate the ages of TOI-251 and TOI-942. These relationships were calibrated by interpolating the slow rotating sequence in well characterized clusters. We note that by adopting these relationships, we are making the assumption that TOI-251 and TOI-942 follow the age spin-down trends seen in slow rotators amongst Sun-like stars. Many of these young clusters also show a spread in rotation at a given mass. By Pleiades age, the rapid rotators are usually all binaries (e.g. Douglas et al., 2016; Stauffer et al., 2018), but at the youngest ages, we cannot confirm that our stars lie on the main sequence. If TOI-251 and TOI-942 are rapid rotators for their age, then their ages will be difficult to estimate using gyrochronology. Given that both stars exhibit significant chromospheric activity and Lithium absorption, we think it is reasonable to assume these stars are relatively young. By assuming that they are also slow rotators for their age, we can apply gyrochronology relations to derive an additional age constraint.
Using the relationship in Barnes (2007), we find an age of Myr for TOI-251, with a age range of 40-220 Myr. TOI-942 is considerably younger at Myr, with a age range of 20-90 Myr. The uncertainties are the quadrature addition of the intrinsic uncertainties in the gyrochronology relationship, as prescribed in Barnes (2007), and the uncertainties resulting from the TESS rotation period measurements. Similarly, applying the age relationship from Mamajek & Hillenbrand (2008), we get an age range of Myr for TOI-251, and Myr for TOI-942.
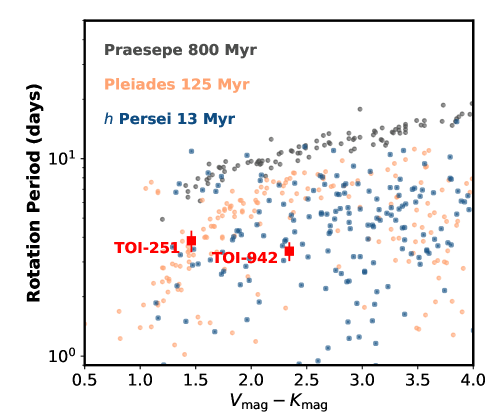
Qualitatively, we can compare the rotation periods of our target stars against those in known clusters and associations. Figure 16 shows the rotation periods of the target stars against known members of the 120 Myr old Pleiades measured by Rebull et al. (2016), and 800 Myr old Praesepe measured by Rebull et al. (2017). For comparison, we also plot the rotation of members of the Persei cluster, at an age of Myr from Moraux et al. (2013), to illustrate that both TOI-251 and TOI-942 are older than some of the youngest cluster and associations. The Persei members are marked by the blue squares in Figure 16. The colors of stars in Persei have been de-reddened according to the 3D dust maps via dustmap (Green, 2018) using maps from Green et al. (2019). In this qualitative comparison, the rotation period of TOI-251 agrees well with the Pleiades population, supporting the gyrochronology estimate of Myr. TOI-942 is rotating faster than an equivalent star within the Pleiades distribution, and as such supports our estimate of it being younger than 100 Myr. We note though that there is a possibility for our targets to be young, rapid rotators, as with stars in the significantly younger Persei cluster.
4.3.1 Infrared excess
The spectroscopic and gyrochronology age estimates described above have placed meaningful upper age limits. Lower limits from these measurements are more difficult for TOI-942 given that many of its activity indicators are saturated.
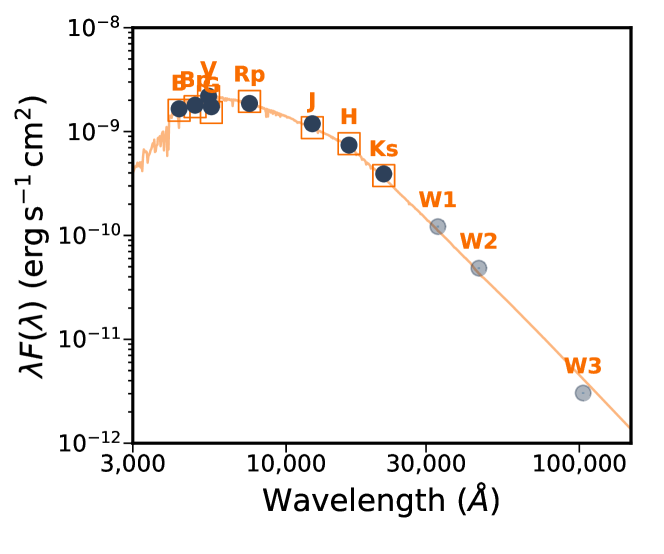
A qualitative argument for the lower limits of both TOI-251 and TOI-942 can be made due to their lack of any infrared excess in the WISE bands. The spectral energy distribution of TOI-251 and TOI-942 are shown in Figure 19. Disks can be traced by emission and infrared excess, and typically dissipate by Myr (See reviews by Mamajek, 2009; Williams & Cieza, 2011). As such, we adopt a lower limit of 10 Myr for the age of TOI-942.
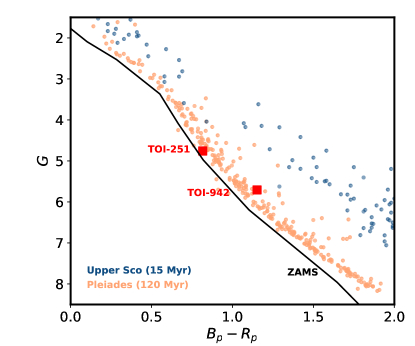
4.3.2 Color-magnitude diagram
Further lower bound age limits may be inferred by comparing the colors and magnitudes of the target stars against members of well known clusters. Figure 17 shows the Gaia color-magnitude diagram for TOI-251 and TOI-942. Stars from the 120 Myr old Pleiades cluster (Lodieu et al., 2019) and 15 Myr old Upper Sco association (Damiani et al., 2019) are shown for comparison.
TOI-251 is consistent with having an age similar to stars in the Pleiades cluster, as per our spectroscopic and gyrochronology estimates above. Having reached the main sequence, it is difficult to estimate its age from the spectral energy distribution, and the ages from isochrone models provide no further constraints to the age of the system.
TOI-942 lies marginally above the zero-age main sequence. The activity-based age estimates described above have trouble placing an lower bound on the age of TOI-942. From the color-magnitude diagram, TOI-942 clearly sits below stars from the 15 Myr old Upper Sco association. As part of the global analysis, the isochrone-fitted age from Section 5 provides a lower age limit of 23 Myr, consistent with that provided by gyrochronology.
4.4 Kinematics
To the best of our knowledge, neither TOI 251 nor TOI 942 is a member of any known coeval stellar population. To check, we searched the CDIPS target star list (Bouma et al. 2019 Table 1), which is a concatenation of stars from across the literature reported to be in known moving groups and open clusters. This concatenation included large surveys ( cluster stars) such as those of Kharchenko et al. (2013), Dias et al. (2014), Oh et al. (2017), Cantat-Gaudin et al. (2018), Gaia Collaboration et al. (2018a), Zari et al. (2018), Cantat-Gaudin et al. (2019), and Kounkel & Covey (2019). It also included targetted surveys, for instance those of Röser et al. (2011), Rizzuto et al. (2011), Kraus et al. (2014), Bell et al. (2017), Gagné et al. (2018a), Gagné et al. (2018b), and Gagné & Faherty (2018). We also verified that we could not place these targets into any known associations via the online BANYAN tool (Gagné et al., 2018b).
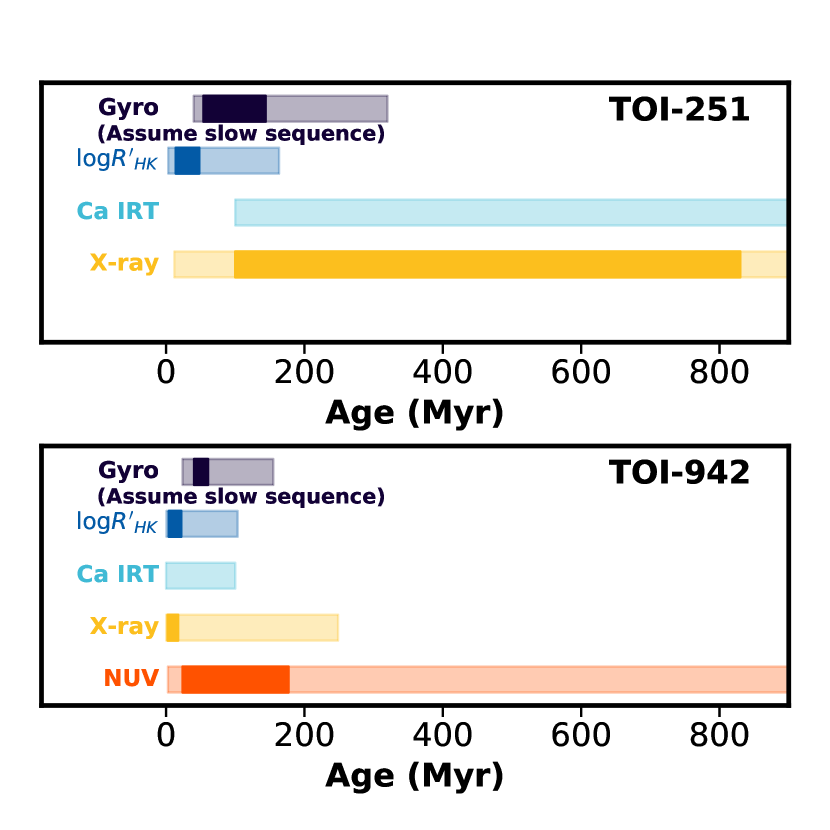
4.5 Summary of age estimates
Figure 18 summarizes the ages of TOI-251 and TOI-942 as estimated from the age indicators. For TOI-251, gyrochronology and chromospheric Ca II HK emissions provide constraining age estimates. We adopt an estimated age range of 40-320 Myr for TOI-251, encompassing the upper range of both gyrochronology relationships we tested, and the upper limit of chromospheric Ca II HK emission estimates – the two age indicators that yielded constraining estimates in our analysis. This age range also agrees with the estimates from the less constraining Ca II infrared triplet and X-ray emission estimates, which put the age of TOI-251 below 1 Gyr.
TOI-942 is clearly more active than TOI-251 and members of the Pleiades cluster. Constraining measurements for the age of TOI-251 come from gyrochronology, Ca II HK emissions, and the Ca II infrared triplet emissions, placing a age range at Myr. The age estimates from X-ray and NUV emissions are less constraining, but still consistent with a young age for TOI-942. The fact that the rotation of the star is significantly slower than similar stars in the 13 Myr Persei cluster at zero-age main sequence, and the lack of infrared excess for TOI-942 allowed us to place an approximate lower limit of 20 Myr.
5 System modeling
To derive accurate system parameters, we present a series of global models for each system incorporating the TESS discovery light curve, ground-based follow-up light curves, radial velocities, spectroscopic and broadband atmospheric parameters, and stellar isochrone constraints.
The light curves of young stars exhibit large variations due to spot modulation. The variability signal often dwarfs the planetary transits, and as such needs to be carefully considered so as to yield un-biased system parameters. The modeling of spot activity is simplified by the quasi-sinusoidal nature of the light curves, with well defined periods that can be easily modeled. We adopt the celerite package (Foreman-Mackey et al., 2017) to model the stellar variability via its simple harmonic oscillator kernel, with free parameters describing the frequency of the stellar variability , the dampening factor , and the power of the oscillator . We impose a Gaussian prior on based on the rotation period of each star, with the specific limits shown in Table 5. Linear uniform priors were imposed for and . The follow-up light curves are also included in the global analysis. These light curves are not modeled as part of the Gaussian process. To account for any environmental systematics in the light curves, we instead include a linear trend for each transit, a linear coefficient detrending against airmass, and an additional offset term for meridian flips.
The transits are modeled via the batman package (Kreidberg, 2015), with free parameters defining the periods , transit center ephemeris , planet-star radius ratio , and line of sight inclination for each transiting planet. Limb darkening parameters are interpolated from Claret & Bloemen (2011) and Claret (2017), and fixed through the modeling process. The radial velocities are further modeled by circular orbits, with masses of each planet , and a jitter term to account for the radial velocity jitter. Given the large stellar-activity induced jitter for these young stars, we only provide upper limits on the masses of the planets reported here.
In addition, we model the stellar parameters simultaneously with the transits and radial velocities. The stellar properties are modeled via the MESA Isochrones & Stellar Tracks (MIST Dotter, 2016), interpolated using stellar evolution tracks with ages below 1 Gyr and with initial masses . Free parameters include the stellar mass , radius , and stellar metallicity [M/H]. These are constrained by the spectroscopic effective temperature , surface gravity , and metallicity as measured by SPC from the TRES spectra. We also incorporate photometric magnitudes from visual HIPPARCOS (Perryman et al., 1997), Gaia (Gaia Collaboration et al., 2018b) and near infrared 2MASS bands (Skrutskie et al., 2006) in the modeling of the spectral energy distribution. We incorporate de-biased Gaia DR2 distance estimates from Bailer-Jones et al. (2018) into the SED analysis. Though we have estimates of the stellar age, we apply no age prior to the stellar evolution modeling beyond limiting the ages to below 1 Gyr. The resulting age posteriors are largely uninformative, allowing for all ages within the given range.
The final parameters for the host stars are presented in Table 4, and the planet properties are presented in Table 5. The spectral energy distributions are shown in Figure 19, with the best fit atmospheric model overlaid.
TOI-251
TOI-942

| Parameter | TOI-251 | TOI-942 | Source |
|---|---|---|---|
| Catalogue Information | |||
| TIC | 224225541 | 146520535 | Stassun et al. (2018) |
| Tycho-2 | 7520-00369-1 | 5909-00319-1 | Høg et al. (2000) |
| Gaia DR2 Source ID | 6539037542941988736 | 2974906868489280768 | Gaia Collaboration et al. (2018b) |
| Gaia RA (2015.5) | 23:32:14.9 | 05:06:35.91 | Gaia Collaboration et al. (2018b) |
| Gaia DEC (2015.5) | -37:15:21.11 | -20:14:44.21 | Gaia Collaboration et al. (2018b) |
| Gaia | Gaia Collaboration et al. (2018b) | ||
| Gaia | Gaia Collaboration et al. (2018b) | ||
| Gaia DR2 Parallax | Gaia Collaboration et al. (2018b) | ||
| Systemic Radial Velocity () aa
Derived from the global modeling described in Section 5, co-constrained by spectroscopic stellar parameters and the Gaia DR2 parallax.
|
… | ||
| U | |||
| V | |||
| W | |||
| Stellar atmospheric properties | |||
| (K) | |||
| aa
Derived from the global modeling described in Section 5, co-constrained by spectroscopic stellar parameters and the Gaia DR2 parallax.
|
|||
| () | |||
| () | |||
| Stellar activity properties | |||
| (d) | |||
| Ca II IRT EW | |||
| ROSAT X-ray Counts | Rosat (2000); Voges et al. (2000) | ||
| ROSAT X-ray Hardness Ratio | Rosat (2000); Voges et al. (2000) | ||
| X-ray luminosity | |||
| Li 6708 EW | |||
| Photometric properties | |||
| GALEX NUV (mag) | Bianchi et al. (2017) | ||
| TESS (mag) | Stassun et al. (2018) | ||
| Gaia (mag) | Gaia Collaboration et al. (2018b) | ||
| Gaia (mag) | Gaia Collaboration et al. (2018b) | ||
| Gaia (mag) | Gaia Collaboration et al. (2018b) | ||
| TYCHO (mag) | Perryman et al. (1997) | ||
| TYCHO (mag) | Perryman et al. (1997) | ||
| 2MASS (mag) | Skrutskie et al. (2006) | ||
| 2MASS (mag) | Skrutskie et al. (2006) | ||
| 2MASS (mag) | Skrutskie et al. (2006) | ||
| WISE (mag) | Wright et al. (2010); Cutri & et al. (2013) | ||
| WISE (mag) | Wright et al. (2010); Cutri & et al. (2013) | ||
| WISE (mag) | Wright et al. (2010); Cutri & et al. (2013) | ||
| Stellar properties | |||
| () | |||
| () | |||
| (cgs) | |||
| () | |||
| Line of sight inclination | |||
| Age (Myr) | |||
| Distance (pc) | |||
| Parameter | TOI-251b | TOI-942b | TOI-942c |
|---|---|---|---|
| Light curve parameters | |||
| (days) | |||
| () aa : Reference epoch of mid transit that minimizes the correlation with the orbital period. : total transit duration, time between first to last contact; | |||
| (days) aa : Reference epoch of mid transit that minimizes the correlation with the orbital period. : total transit duration, time between first to last contact; | |||
| (deg) | |||
| Limb-darkening and gravity darkening coefficients bb Values for a quadratic law given separately for each of the filters with which photometric observations were obtained. These values were adopted from the tabulations by Claret & Bloemen (2011) according to the spectroscopic an initial estimate of the stellar parameters. | |||
| 0.3817 | … | … | |
| 0.3393 | … | … | |
| 0.1428 | … | … | |
| 0.3642 | … | … | |
| 0.1925 | 0.3201 | … | |
| 0.3552 | 0.2797 | … | |
| 0.2831 | 0.4006 | … | |
| 0.2873 | 0.2243 | … | |
| RV parameters | |||
| () | |||
| 0 (fixed) | 0 (fixed) | 0 (fixed) | |
| RV jitter () | … | ||
| Gaussian process hyperparameters | |||
| SHOT Frequency | … | ||
| (Gaussian prior ) | (Gaussian prior ) | ||
| SHOT Quality factor | … | ||
| SHOT S | … | ||
| Planetary parameters | |||
| () | |||
| () | |||
| (AU) | |||
6 Discussion
We report the discovery and validation of planets around TOI-251 and TOI-942. The two systems of small planets orbiting relatively young field stars, with TOI-251 estimated to be Myr old, and TOI-942 at Myr old. The mini-Neptune TOI-251 b has an orbital period of days, and a radius of . Two inflated Neptunes orbit TOI-942, with TOI-942b in a day orbit with a radius of , and TOI-942c in a day orbit with a radius of .
6.1 The radius-period diagram for young planets, and the detectability of smaller planets
Discoveries of super-Earths and Neptunes around young stars give us a unique opportunity to explore the evolution of small planets in their early stages of evolution. Figure 20 shows the period-radius distribution of close-in small planets, comparing the planets characterized by the Kepler survey and those subsequently discovered around stars younger than Myr. Photoevaporation is key in sculpting this distribution, creating a sub-Saturn desert devoid of close-in Neptunes and super-Earths (e.g. Lopez et al., 2012; Owen & Wu, 2013; Owen & Lai, 2018) and carving the radius valley between rocky and gaseous planets further out (e.g. Fulton et al., 2017; Owen & Wu, 2017).
TOI-251b straddles along the evaporation gap between solid cores and planets still retaining their gaseous envelopes. It is amongst the smallest planets known around stars younger than 500 Myr; only the planets around the Ursa Major moving group member TOI-1726 (Mann et al., 2020) are smaller. The planets around TOI-942 lie in the sub-Saturn radius regime, similar in radii and periods to other young planetary systems at the Myr age regime, such as DS Tuc Ab (Newton et al., 2019), and V1298 Tau c and d (David et al., 2019a).
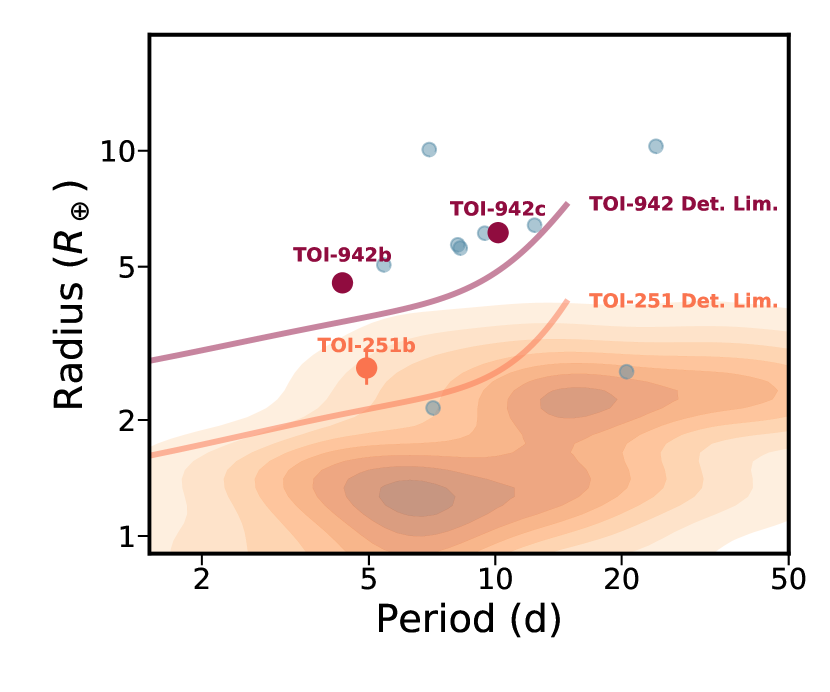
The planets around TOI-251 and TOI-942, as well as most other planets found around young stars, have larger radii than most in the Kepler sample. However, it may be difficult to compare this sample of planets around young, active stars against those identified by the Kepler sample around quiet stars with higher precision light curves.
To see if smaller planets could be recovered from similar light curves, we performed a signal injection and recovery exercise on the TESS observations of TOI-251 and TOI-942. Figure 20 shows the detection thresholds derived from 1000 injected planets across the radius-period space. Each injection is drawn from a uniform distribution in period between 1 and 15 days, radius from 0.5 to 15 , and impact parameter from 0 to 1. A circular orbit is assumed for every injected planet. The light curves are then detrended via a cosine-filtering (Mazeh & Faigler, 2010) algorithm, and the transits recovered via a BLS (Kovács et al., 2002) search. The injection and recovery exercise shows that the planets we discovered are nearly the smallest detectable planets. The detection thresholds worsen significantly for planets in orbits longer than 10 days. Importantly, the predominant population of close-in small planets with , and those with and orbital periods days, would not be detectable around either star. Similar injection and recovery exercises of previous analyses (e.g. Newton et al., 2019; Rizzuto et al., 2020) show similar results, that our detectability for planets smaller than is only complete at periods shorter than 10 days.
6.2 Orbital eccentricity and prospects for obliquity measurements
One main tracer for the origins of close-in planets is the properties of the orbits they currently inhabit. High eccentricity or highly oblique orbits can be indicative of strong dynamical interaction in the early history of these planets.
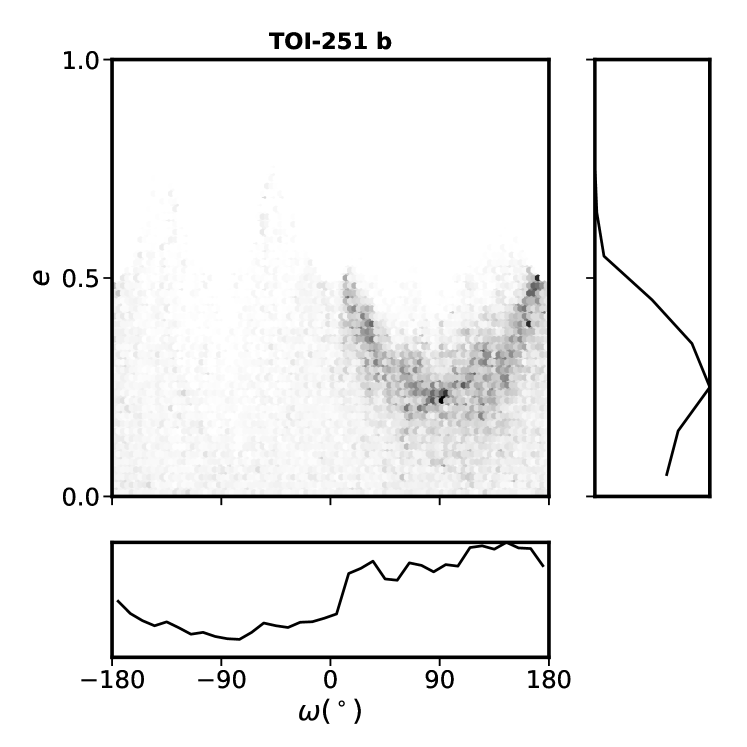
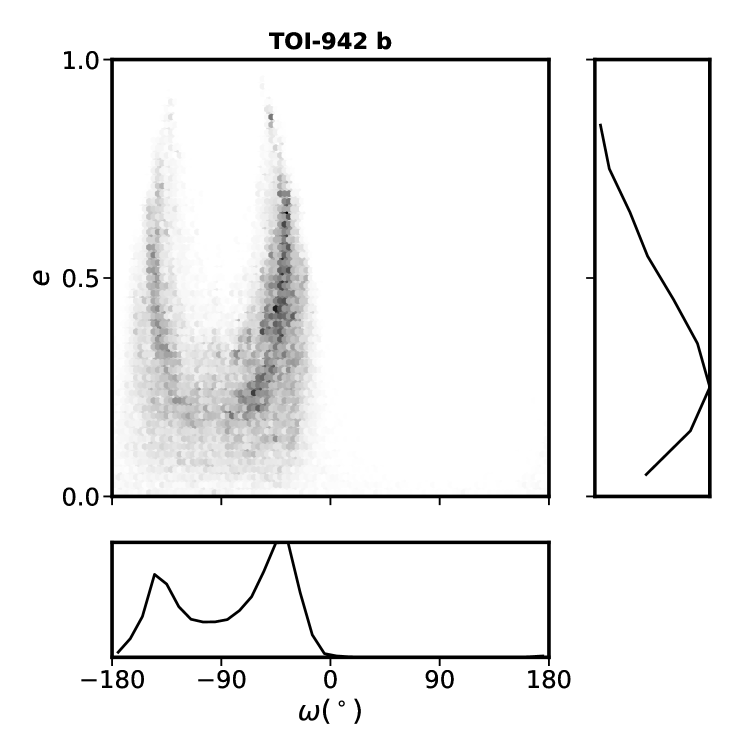
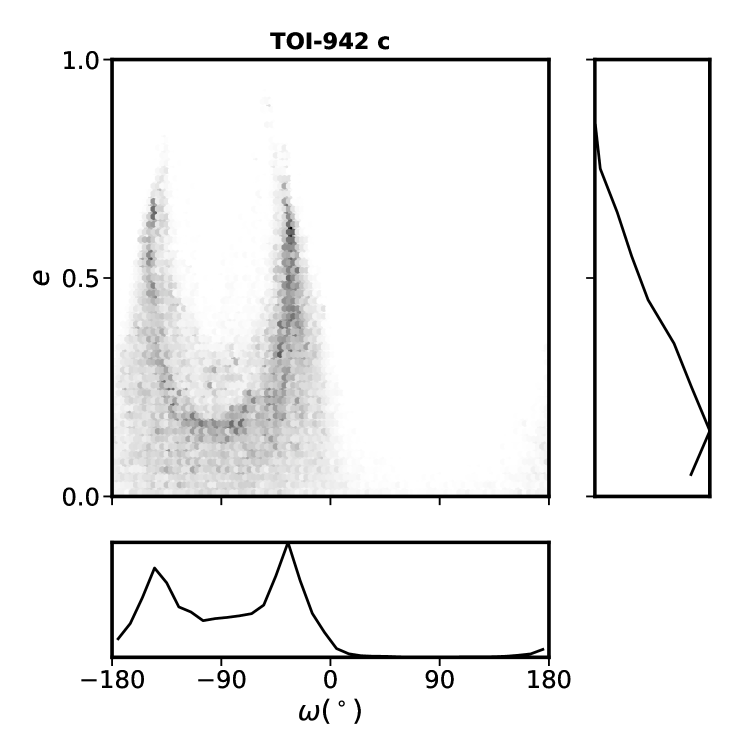
We modified our analysis (Section 5) to allow eccentricity, modeled as and , to be free during the global modeling. To prevent the large jitter of radial velocities and systematic effects from ground base transit observations from influencing our eccentricity estimates, we make use of only the TESS light curves and the SED in this analysis.
Figure 21 and 22 show the resulting posteriors in eccentricity and longitude of periastron . For both systems, the eccentricity can only be loosely constrained with existing datasets. We find upper limits for TOI-251b, for TOI-942b, and for TOI-942c.
Given the difficulty in measuring precise radial velocity orbits for these planets around young, active stars, a potentially easier observational constraint on their dynamical histories is their projected orbital obliquity angles. The obliquity angle is the relative angle between the orbital planes of the planets and the rotation axis of the host star. Planets that experienced significant dynamical interactions in their past can often be found in highly oblique orbits (e.g. Triaud, 2017).
The line of sight inclination of the host stars can be used to approximate the orbital obliquity for the planets. Following Masuda & Winn (2020), we compute the stellar inclination angle via the isochrone-derived stellar radius , the spectroscopic rotational broadening velocity , and the photometric rotation period of each system. Though tight constraints cannot be placed with our existing observations, TOI-251 and TOI-942 appear both to be well aligned, with lower limits of for both stars (see Table 4 for their precisely derived values).
A much more precise technique of measuring the orbital obliquities of these transiting systems is to observe their spectroscopic transits via the Rossiter-McLaughlin (Rossiter, 1924; McLaughlin, 1924) effect, or via the Doppler tomographic transit shadow detection (Donati et al., 1997; Collier Cameron et al., 2010). Based on our measured rotational broadening velocity, TOI-251b should exhibit an in-transit velocity anomaly of , while TOI-942b and TOI-942c should exhibit significant velocity variations at the levels of . Planets around bright, young, rapidly rotating stars are good targets for mapping the orbital obliquity – age relationship, and determining the origins of the abundance of small planets around Sun-like stars.
7 Conclusions
TOI-251 and TOI-942 are two field stars exhibiting photometric and spectroscopic signatures of youth, hosting transiting Neptunes that were identified by TESS observations.
TOI-251b is a mini-Neptune in a day period around a G-type star. The period and transit ephemeris of the system were refined by three ground-based follow-up observations that successfully detected the 1 mmag transit events on the target star. We were able to eliminate false positive scenarios with extensive spectroscopic follow-up and speckle imaging of the host star, validating the planetary nature of the transits.
We estimated the age of TOI-251 to be Myr, based on its photometric rotation period, spectroscopic calcium II core emission in the HK and infrared triplet lines, and the presence of X-ray emission from the ROSAT all-sky survey. The rotation period and 6708 Å lithium absorption strength are comparable to that of stars in the Pleiades cluster, agreeing with our age estimates for the system.
TOI-942 hosts two Neptune sized planets around a K-type star. TOI-942b is a planet in a day period orbit, while TOI-942c has a radius of and an orbital period of days. The transits of TOI-942b and c were both successfully recovered by an extensive ground-based follow-up campaign with the MEarth telescope array. The planetary nature of the system were further validated by diffraction limited imaging and spectroscopic analyses.
The age of TOI-942 is significantly younger than TOI-251, estimated at Myr. It exhibits strong X-ray and calcium emission that are stronger and beyond the range of calibrated literature age-activity relationships. The rotation period and lithium absorption strength of TOI-942 suggest that it has an age younger than the Pleiades cluster, and more in agreement with younger stellar associations.
TOI-251 and TOI-942 are examples of young planet hosting field stars that can contribute significantly to characterizing the relationship between planet properties and their ages. TESS is likely to yield numerous systems like TOI-251 and TOI-942, amenable to extensive follow-up observations that can characterize the orbital and atmospheric properties of planets at early stages of their evolutions.
References
- Astropy Collaboration et al. (2013) Astropy Collaboration, Robitaille, T. P., Tollerud, E. J., et al. 2013, A&A, 558, A33
- Astropy Collaboration et al. (2018) Astropy Collaboration, Price-Whelan, A. M., Sipőcz, B. M., et al. 2018, AJ, 156, 123
- Bailer-Jones et al. (2018) Bailer-Jones, C. A. L., Rybizki, J., Fouesneau, M., Mantelet, G., & Andrae, R. 2018, AJ, 156, 58
- Baliunas et al. (1995) Baliunas, S. L., Donahue, R. A., Soon, W. H., et al. 1995, ApJ, 438, 269
- Barentsen et al. (2019) Barentsen, G., Hedges, C., Vinícius, Z., & Saunders, N. e. a. 2019, KeplerGO/lightkurve: Lightkurve v1.0b29 (Version v1.0b29)., Zenodo, doi:10.5281/zenodo.2565212
- Barnes (2007) Barnes, S. A. 2007, ApJ, 669, 1167
- Bell et al. (2017) Bell, C. P. M., Murphy, S. J., & Mamajek, E. E. 2017, MNRAS, 468, 1198
- Berta et al. (2012) Berta, Z. K., Irwin, J., Charbonneau, D., Burke, C. J., & Falco, E. E. 2012, AJ, 144, 145
- Bianchi et al. (2017) Bianchi, L., Shiao, B., & Thilker, D. 2017, ApJS, 230, 24
- Bouma et al. (2019) Bouma, L. G., Hartman, J. D., Bhatti, W., Winn, J. N., & Bakos, G. . 2019, ApJS, 245, 13
- Brasseur et al. (2019) Brasseur, C. E., Phillip, C., Fleming, S. W., Mullally, S. E., & White, R. L. 2019, Astrocut: Tools for creating cutouts of TESS images, ascl:1905.007
- Brown et al. (2013) Brown, T. M., Baliber, N., Bianco, F. B., et al. 2013, PASP, 125, 1031
- Buchhave et al. (2010) Buchhave, L. A., Bakos, G. Á., Hartman, J. D., et al. 2010, ApJ, 720, 1118
- Buchhave et al. (2012) Buchhave, L. A., Latham, D. W., Johansen, A., et al. 2012, Nature, 486, 375
- Cantat-Gaudin et al. (2018) Cantat-Gaudin, T., Jordi, C., Vallenari, A., et al. 2018, å, 618, A93
- Cantat-Gaudin et al. (2019) Cantat-Gaudin, T., Jordi, C., Wright, N. J., et al. 2019, å, 626, A17
- Castelli & Kurucz (2004) Castelli, F., & Kurucz, R. L. 2004, ArXiv Astrophysics e-prints, astro-ph/0405087
- Ciardi et al. (2018) Ciardi, D. R., Crossfield, I. J. M., Feinstein, A. D., et al. 2018, AJ, 155, 10
- Claret (2017) Claret, A. 2017, A&A, 600, A30
- Claret & Bloemen (2011) Claret, A., & Bloemen, S. 2011, A&A, 529, A75
- Collier Cameron et al. (2010) Collier Cameron, A., Guenther, E., Smalley, B., et al. 2010, MNRAS, 407, 507
- Collins et al. (2017a) Collins, K. A., Kielkopf, J. F., Stassun, K. G., & Hessman, F. V. 2017a, AJ, 153, 77
- Collins et al. (2017b) —. 2017b, AJ, 153, 77
- Cutri & et al. (2013) Cutri, R. M., & et al. 2013, VizieR Online Data Catalog, II/328
- Czesla et al. (2019) Czesla, S., Schröter, S., Schneider, C. P., et al. 2019, PyA: Python astronomy-related packages, ascl:1906.010
- Damiani et al. (2019) Damiani, F., Prisinzano, L., Pillitteri, I., Micela, G., & Sciortino, S. 2019, A&A, 623, A112
- David et al. (2019a) David, T. J., Petigura, E. A., Luger, R., et al. 2019a, ApJ, 885, L12
- David et al. (2016) David, T. J., Hillenbrand, L. A., Petigura, E. A., et al. 2016, Nature, 534, 658
- David et al. (2018a) David, T. J., Mamajek, E. E., Vanderburg, A., et al. 2018a, AJ, 156, 302
- David et al. (2018b) David, T. J., Crossfield, I. J. M., Benneke, B., et al. 2018b, AJ, 155, 222
- David et al. (2019b) David, T. J., Cody, A. M., Hedges, C. L., et al. 2019b, AJ, 158, 79
- Dias et al. (2014) Dias, W. S., Monteiro, H., Caetano, T. C., et al. 2014, å, 564, A79
- Donati et al. (1997) Donati, J.-F., Semel, M., Carter, B. D., Rees, D. E., & Collier Cameron, A. 1997, MNRAS, 291, 658
- Dotter (2016) Dotter, A. 2016, ApJS, 222, 8
- Douglas et al. (2016) Douglas, S. T., Agüeros, M. A., Covey, K. R., et al. 2016, ApJ, 822, 47
- Duncan et al. (1991) Duncan, D. K., Vaughan, A. H., Wilson, O. C., et al. 1991, ApJS, 76, 383
- Fűrész (2008) Fűrész, G. 2008, PhD thesis, Univ. of Szeged, Hungary
- Findeisen et al. (2011) Findeisen, K., Hillenbrand, L., & Soderblom, D. 2011, AJ, 142, 23
- Fleming et al. (1995) Fleming, T. A., Schmitt, J. H. M. M., & Giampapa, M. S. 1995, ApJ, 450, 401
- Foreman-Mackey et al. (2017) Foreman-Mackey, D., Agol, E., Angus, R., & Ambikasaran, S. 2017, ArXiv
- Foreman-Mackey et al. (2013) Foreman-Mackey, D., Hogg, D. W., Lang, D., & Goodman, J. 2013, PASP, 125, 306
- Fulton et al. (2017) Fulton, B. J., Petigura, E. A., Howard, A. W., et al. 2017, AJ, 154, 109
- Gagné & Faherty (2018) Gagné, J., & Faherty, J. K. 2018, ApJ, 862, 138
- Gagné et al. (2018a) Gagné, J., Roy-Loubier, O., Faherty, J. K., Doyon, R., & Malo, L. 2018a, ApJ, 860, 43
- Gagné et al. (2018b) Gagné, J., Mamajek, E. E., Malo, L., et al. 2018b, ApJ, 856, 23
- Gaia Collaboration et al. (2018a) Gaia Collaboration, Babusiaux, C., van Leeuwen, F., et al. 2018a, å, 616, A10
- Gaia Collaboration et al. (2018b) Gaia Collaboration, Brown, A. G. A., Vallenari, A., et al. 2018b, A&A, 616, A1
- Gray (2005) Gray, D. F. 2005, The Observation and Analysis of Stellar Photospheres
- Green (2018) Green, G. 2018, The Journal of Open Source Software, 3, 695
- Green et al. (2019) Green, G. M., Schlafly, E., Zucker, C., Speagle, J. S., & Finkbeiner, D. 2019, ApJ, 887, 93
- Høg et al. (2000) Høg, E., Fabricius, C., Makarov, V. V., et al. 2000, A&A, 355, L27
- Howell et al. (2016) Howell, S. B., Everett, M. E., Horch, E. P., et al. 2016, ApJ, 829, L2
- Howell et al. (2011) Howell, S. B., Everett, M. E., Sherry, W., Horch, E., & Ciardi, D. R. 2011, AJ, 142, 19
- Huang et al. (2019) Huang, X., Burt, J., Vanderburg, A., et al. 2019, in American Astronomical Society Meeting Abstracts, Vol. 233, American Astronomical Society Meeting Abstracts #233, 209.08
- Irwin et al. (2007) Irwin, J., Irwin, M., Aigrain, S., et al. 2007, MNRAS, 375, 1449
- Irwin et al. (2015) Irwin, J. M., Berta-Thompson, Z. K., Charbonneau, D., et al. 2015, in Cambridge Workshop on Cool Stars, Stellar Systems, and the Sun, Vol. 18, 18th Cambridge Workshop on Cool Stars, Stellar Systems, and the Sun, 767–772
- Jenkins et al. (2016) Jenkins, J. M., Twicken, J. D., McCauliff, S., et al. 2016, in Proc. SPIE, Vol. 9913, Software and Cyberinfrastructure for Astronomy IV, 99133E
- Jensen (2013) Jensen, E. 2013, Tapir: A web interface for transit/eclipse observability, Astrophysics Source Code Library, ascl:1306.007
- Kharchenko et al. (2013) Kharchenko, N. V., Piskunov, A. E., Schilbach, E., Röser, S., & Scholz, R.-D. 2013, å, 558, A53
- Kounkel & Covey (2019) Kounkel, M., & Covey, K. 2019, arXiv:1907.07709 [astro-ph], arXiv: 1907.07709
- Kovács et al. (2002) Kovács, G., Zucker, S., & Mazeh, T. 2002, A&A, 391, 369
- Kraus et al. (2014) Kraus, A. L., Shkolnik, E. L., Allers, K. N., & Liu, M. C. 2014, AJ, 147, 146
- Kreidberg (2015) Kreidberg, L. 2015, PASP, 127, 1161
- Krumholz et al. (2019) Krumholz, M. R., McKee, C. F., & Bland -Hawthorn, J. 2019, ARA&A, 57, 227
- Li et al. (2019) Li, J., Tenenbaum, P., Twicken, J. D., et al. 2019, PASP, 131, 024506
- Livingston et al. (2018) Livingston, J. H., Dai, F., Hirano, T., et al. 2018, AJ, 155, 115
- Livingston et al. (2019) —. 2019, MNRAS, 484, 8
- Lodieu et al. (2019) Lodieu, N., Pérez-Garrido, A., Smart, R. L., & Silvotti, R. 2019, A&A, 628, A66
- Lopez et al. (2012) Lopez, E. D., Fortney, J. J., & Miller, N. 2012, ApJ, 761, 59
- Mamajek (2009) Mamajek, E. E. 2009, in American Institute of Physics Conference Series, Vol. 1158, American Institute of Physics Conference Series, ed. T. Usuda, M. Tamura, & M. Ishii, 3–10
- Mamajek & Hillenbrand (2008) Mamajek, E. E., & Hillenbrand, L. A. 2008, ApJ, 687, 1264
- Mann et al. (2016a) Mann, A. W., Gaidos, E., Mace, G. N., et al. 2016a, ApJ, 818, 46
- Mann et al. (2016b) Mann, A. W., Newton, E. R., Rizzuto, A. C., et al. 2016b, AJ, 152, 61
- Mann et al. (2017) Mann, A. W., Gaidos, E., Vanderburg, A., et al. 2017, AJ, 153, 64
- Mann et al. (2018) Mann, A. W., Vanderburg, A., Rizzuto, A. C., et al. 2018, AJ, 155, 4
- Mann et al. (2020) Mann, A. W., Johnson, M. C., Vanderburg, A., et al. 2020, arXiv e-prints, arXiv:2005.00047
- Masuda & Winn (2020) Masuda, K., & Winn, J. N. 2020, AJ, 159, 81
- Mazeh & Faigler (2010) Mazeh, T., & Faigler, S. 2010, A&A, 521, L59
- McCully et al. (2018) McCully, C., Volgenau, N. H., Harbeck, D.-R., et al. 2018, in Society of Photo-Optical Instrumentation Engineers (SPIE) Conference Series, Vol. 10707, Proc. SPIE, 107070K
- McLaughlin (1924) McLaughlin, D. B. 1924, ApJ, 60, 22
- Montet et al. (2020) Montet, B. T., Feinstein, A. D., Luger, R., et al. 2020, AJ, 159, 112
- Moraux et al. (2013) Moraux, E., Artemenko, S., Bouvier, J., et al. 2013, A&A, 560, A13
- Morris et al. (2020) Morris, R. L., Twicken, J. D., Smith, J. C., et al. 2020, Kepler Data Processing Handbook: Photometric Analysis, Kepler Data Processing Handbook (KSCI-19081-003)
- Newton et al. (2019) Newton, E. R., Mann, A. W., Tofflemire, B. M., et al. 2019, ApJ, 880, L17
- Noyes et al. (1984) Noyes, R. W., Hartmann, L. W., Baliunas, S. L., Duncan, D. K., & Vaughan, A. H. 1984, ApJ, 279, 763
- Obermeier et al. (2016) Obermeier, C., Henning, T., Schlieder, J. E., et al. 2016, AJ, 152, 223
- Oh et al. (2017) Oh, S., Price-Whelan, A. M., Hogg, D. W., Morton, T. D., & Spergel, D. N. 2017, AJ, 153, 257
- Owen & Lai (2018) Owen, J. E., & Lai, D. 2018, MNRAS, 479, 5012
- Owen & Wu (2013) Owen, J. E., & Wu, Y. 2013, ApJ, 775, 105
- Owen & Wu (2017) —. 2017, ApJ, 847, 29
- Perryman et al. (1997) Perryman, M. A. C., Lindegren, L., Kovalevsky, J., et al. 1997, A&A, 500, 501
- Pollacco et al. (2006) Pollacco, D. L., Skillen, I., Collier Cameron, A., et al. 2006, PASP, 118, 1407
- Quinn et al. (2012) Quinn, S. N., White, R. J., Latham, D. W., et al. 2012, ApJ, 756, L33
- Quinn et al. (2014) —. 2014, ApJ, 787, 27
- Randich et al. (1997) Randich, S., Aharpour, N., Pallavicini, R., Prosser, C. F., & Stauffer, J. R. 1997, A&A, 323, 86
- Randich et al. (2001) Randich, S., Pallavicini, R., Meola, G., Stauffer, J. R., & Balachandran, S. C. 2001, A&A, 372, 862
- Rebull et al. (2017) Rebull, L. M., Stauffer, J. R., Hillenbrand, L. A., et al. 2017, ApJ, 839, 92
- Rebull et al. (2016) Rebull, L. M., Stauffer, J. R., Bouvier, J., et al. 2016, AJ, 152, 113
- Ricker et al. (2016) Ricker, G. R., Vanderspek, R., Winn, J., et al. 2016, in Proc. SPIE, Vol. 9904, Space Telescopes and Instrumentation 2016: Optical, Infrared, and Millimeter Wave, 99042B
- Rizzuto et al. (2011) Rizzuto, A. C., Ireland, M. J., & Robertson, J. G. 2011, MNRAS, 416, 3108
- Rizzuto et al. (2017) Rizzuto, A. C., Mann, A. W., Vanderburg, A., Kraus, A. L., & Covey, K. R. 2017, AJ, 154, 224
- Rizzuto et al. (2018) Rizzuto, A. C., Vanderburg, A., Mann, A. W., et al. 2018, AJ, 156, 195
- Rizzuto et al. (2020) Rizzuto, A. C., Newton, E. R., Mann, A. W., et al. 2020, arXiv e-prints, arXiv:2005.00013
- Rosat (2000) Rosat, C. 2000, VizieR Online Data Catalog, IX/30
- Röser et al. (2011) Röser, S., Schilbach, E., Piskunov, A. E., Kharchenko, N. V., & Scholz, R.-D. 2011, A deep all-sky census of the Hyades, doi:10.1051/0004-6361/201116948
- Rossiter (1924) Rossiter, R. A. 1924, ApJ, 60, 15
- Sanchis-Ojeda et al. (2013) Sanchis-Ojeda, R., Winn, J. N., Marcy, G. W., et al. 2013, ApJ, 775, 54
- Seager & Mallén-Ornelas (2003) Seager, S., & Mallén-Ornelas, G. 2003, ApJ, 585, 1038
- Skrutskie et al. (2006) Skrutskie, M. F., Cutri, R. M., Stiening, R., et al. 2006, AJ, 131, 1163
- Stassun et al. (2018) Stassun, K. G., Oelkers, R. J., Pepper, J., et al. 2018, AJ, 156, 102
- Stauffer et al. (2018) Stauffer, J., Rebull, L. M., Cody, A. M., et al. 2018, AJ, 156, 275
- Sullivan et al. (2015) Sullivan, P. W., Winn, J. N., Berta-Thompson, Z. K., et al. 2015, ApJ, 809, 77
- Tokovinin (2018) Tokovinin, A. 2018, PASP, 130, 035002
- Tokovinin et al. (2013) Tokovinin, A., Fischer, D. A., Bonati, M., et al. 2013, PASP, 125, 1336
- Triaud (2017) Triaud, A. H. M. J. 2017, The Rossiter-McLaughlin Effect in Exoplanet Research, 2
- Twicken et al. (2010) Twicken, J. D., Clarke, B. D., Bryson, S. T., et al. 2010, in Proc. SPIE, Vol. 7740, Software and Cyberinfrastructure for Astronomy, 774023
- Twicken et al. (2018) Twicken, J. D., Catanzarite, J. H., Clarke, B. D., et al. 2018, PASP, 130, 064502
- Vanderburg et al. (2018) Vanderburg, A., Mann, A. W., Rizzuto, A., et al. 2018, AJ, 156, 46
- Vanderburg et al. (2019) Vanderburg, A., Huang, C. X., Rodriguez, J. E., et al. 2019, ApJ, 881, L19
- Vaughan et al. (1978) Vaughan, A. H., Preston, G. W., & Wilson, O. C. 1978, PASP, 90, 267
- Voges et al. (2000) Voges, W., Aschenbach, B., Boller, T., et al. 2000, VizieR Online Data Catalog, IX/29
- Žerjal et al. (2013) Žerjal, M., Zwitter, T., Matijevič, G., et al. 2013, ApJ, 776, 127
- Žerjal et al. (2017) —. 2017, ApJ, 835, 61
- Žerjal et al. (2019) Žerjal, M., Ireland, M. J., Nordlander, T., et al. 2019, MNRAS, 484, 4591
- Williams & Cieza (2011) Williams, J. P., & Cieza, L. A. 2011, ARA&A, 49, 67
- Wilson (1978) Wilson, O. C. 1978, ApJ, 226, 379
- Wright et al. (2010) Wright, E. L., Eisenhardt, P. R. M., Mainzer, A. K., et al. 2010, AJ, 140, 1868
- Zari et al. (2018) Zari, E., Hashemi, H., Brown, A. G. A., Jardine, K., & de Zeeuw, P. T. 2018, å, 620, A172
- Zhou et al. (2018) Zhou, G., Rodriguez, J. E., Vanderburg, A., et al. 2018, AJ, 156, 93
- Zhou et al. (2020) Zhou, G., Winn, J. N., Newton, E. R., et al. 2020, ApJ, 892, L21
- Ziegler et al. (2020) Ziegler, C., Tokovinin, A., Briceño, C., et al. 2020, AJ, 159, 19