Rapid CO gas dispersal from NO Lup’s class III circumstellar disc
Abstract
We observed the K7 class III star NO Lup in an ALMA survey of the 1-3 Myr Lupus association and detected circumstellar dust and CO gas. Here we show that the J = 3-2 CO emission is both spectrally and spatially resolved, with a broad velocity width km s-1 for its resolved size ( au). We model the gas emission as a Keplerian disc, finding consistency, but only with a central mass of , which is implausible given its spectral type and X-Shooter spectrum. A good fit to the data can also be found by modelling the CO emission as outflowing gas with a radial velocity km s-1. We interpret NO Lup’s CO emission as the first imaged class III circumstellar disc with outflowing gas. We conclude that the CO is continually replenished, but cannot say if this is from the break-up of icy planetesimals or from the last remnants of the protoplanetary disc. We suggest further work to explore the origin of this CO, and its higher than expected velocity in comparison to photoevaporative models.
keywords:
circumstellar matter - planetary systems - submillimetre: planetary systems.1 Introduction
Stars are born with protoplanetary discs containing large quantities of primordial gas and dust which persist for several Myr before dispersing on rapid 0.1 Myr timescales (Ercolano &
Pascucci, 2017).
Circumstellar discs are also seen around older stars (10 Myr), known as debris discs, where the dust and gas is inferred to be secondary, created in the destruction of planetesimals that must be volatile-rich to replenish the gas (Wyatt, 2008; Dent et al., 2014; Marino
et al., 2016; Moór
et al., 2017; Matrà
et al., 2017; Kral et al., 2017).
The transition between the two types of disc is not well understood, but is thought to involve a combination of gas being accreted onto the star, or being expelled from the system by disc winds driven by photoevaporation or magneto-hydrodynamics (MHD), as well as planet formation processes (Williams &
Cieza, 2011; Wyatt et al., 2015; Lesur, 2020).
Class III stars are those in star forming regions for which infrared emission shows an absence of hot dust suggesting that the star’s protoplanetary disc has either recently dispersed or is in the process of dispersal (Adams
et al., 1987).
However, these stars usually have limited constraints on the presence of cold dust or gas with which to constrain their nature.
A recent ALMA survey of class III stars in Lupus found dust in several systems with dust masses orders of magnitude lower than protoplanetary disc levels and consistent with originating in the progenitors of debris discs seen at later ages, though this does not rule out the possibility that this dust is a remnant of the protoplanetary disc (Lovell
et al., 2020).
For one of these class III stars, NO Lup, J = 3-2 CO gas was also detected, allowing a more thorough assessment of the nature of its circumstellar environment.
Comparison of the inferred mass of CO with that of the 10 Myr old M star TWA 7, for which the level was consistent with secondary production (i.e., , see Matrà et al., 2019), shows that the CO could indeed be secondary, though as for the dust interpretation, such plausibility does not preclude the possibility that the CO is primordial.
This paper presents a detailed analysis of the CO detected towards NO Lup, using spectral and spatial data not reported in Lovell
et al. (2020), constraining the kinematic structure of the gas disc.
While circumstellar gas is usually seen in a Keplerian disc, other gas morphologies are possible, such as an outflowing component which could be a feature of either a depleting primordial disc (Haworth &
Owen, 2020) or a debris disc.
In 2 we provide a summary of the NO Lup system, and introduce new X-Shooter observations.
In 3 we extend the analysis of the CO gas by showing the problem with modelling this as a Keplerian disc, and show better consistency in 4 by modelling this with an outward radial velocity.
We interpret our results in 5, and conclude in 6.
2 NO Lup in Context
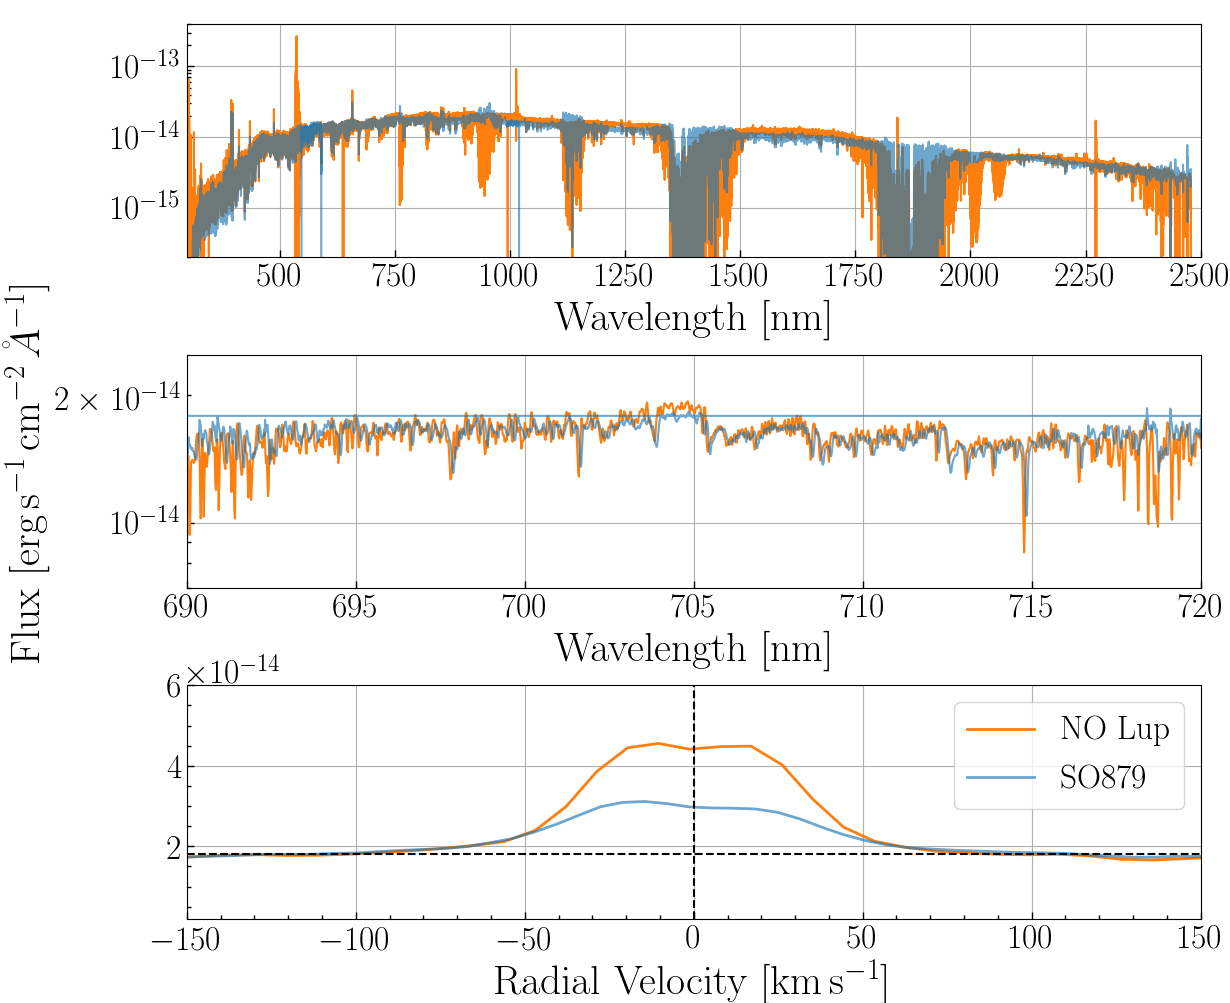
NO Lup (2MASS J160311.8-323920) is located in Cloud I of Lupus at 16:03:11.812, -32:39:20.31 (J2000) at a distance of pc (Gaia Collaboration et al., 2018). NO Lup has previously been classified spectrally as non-accreting (Cieza et al., 2013), and as a K7 star (Krautter et al., 1997). The latter is consistent with its Gaia DR2 temperature, 3994, and stellar luminosity, and its well constrained spectral energy distribution (given observations with WISE, Spitzer, and 2MASS, which found the blackbody planetesimal belt radius as au, see Lovell et al., 2020). Analysing the X-Shooter spectrum of NO Lup (project 093.C-0506 A), we confirm both spectral and accretion analyses. By reducing this data using the standard pipeline version 3.5.0 (Modigliani et al., 2010), we show in Fig. 1 (top and middle) the full and zoomed-in X-Shooter spectra for NO Lup, which are consistent with the spectral features of the well characterised class III K7 star, SO879. In the lower panel we show the H emission line with an EW=, which we find to be centred on a radial velocity (RV) of km s-1, consistent with the Gaia DR2 RV of km s-1, and the average RV of Lupus stars, (Frasca et al., 2017). This EW is consistent with non-accretion and only slightly higher than, but also consistent with, the line width of non-accreting SO879. Hardy et al. (2015) estimated the stellar mass of NO Lup to be . With the models of Siess et al. (2000) and Baraffe et al. (2015), and the Gaia DR2 and Teff, we estimated between 0.7-0.8, consistent with the literature. Although NO Lup has significant emission above the photosphere at 12 and 24m, these excesses are small, resulting in mid-IR spectral slopes steeper than those of protoplanetary discs. Unresolved continuum emission was detected by ALMA, implying a dust mass of and disc radius <56 au (Lovell et al., 2020). These observations also detect CO J=3-2 line emission, with Jy km s-1, and a width of km s-1 (between -11.0 to +8.1 ), consistent with being centred on the stellar RV discussed above. Assuming this emission is optically thin and in LTE at , this flux corresponds to a CO gas mass of , which for an ISM CO abundance implies a gas-to-dust ratio of (Lovell et al., 2020). We note that a wider temperature range of K, consistent with the range of literature gas temperatures, could change this gas mass by at most a factor of 2 (see equations 2 and 8 of Matrà et al., 2017).
3 The Problem with a Keplerian Disc
Assuming the gas is in Keplerian rotation, the width of the CO line can be used to estimate the spatial extent of the emission.
For example, if the star has a mass (see 2), the line width indicates a radius of au (or smaller if the disc is not edge on), well below the spatial resolution limit of our measurements.
However, we find that the CO emission is spatially resolved.
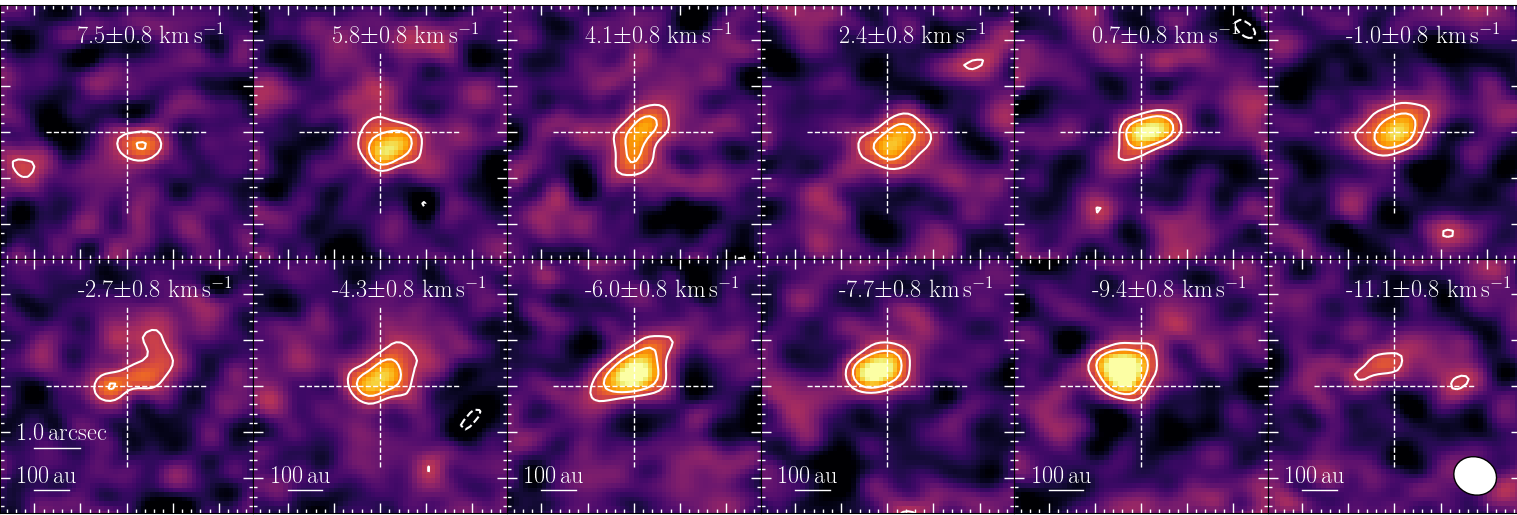
Fig. 2 shows that the centroid of the CO emission transitions from the South-West to the North-East when binned in channels with decreasing RV, as expected for emission that originates in a disc inclined to the plane of the sky.
To resolve this emission given a beam of () (at position angle ), the disc emission would have to have a radius .
This however would then be inconsistent with the previously inferred au radius for the assumed stellar mass.
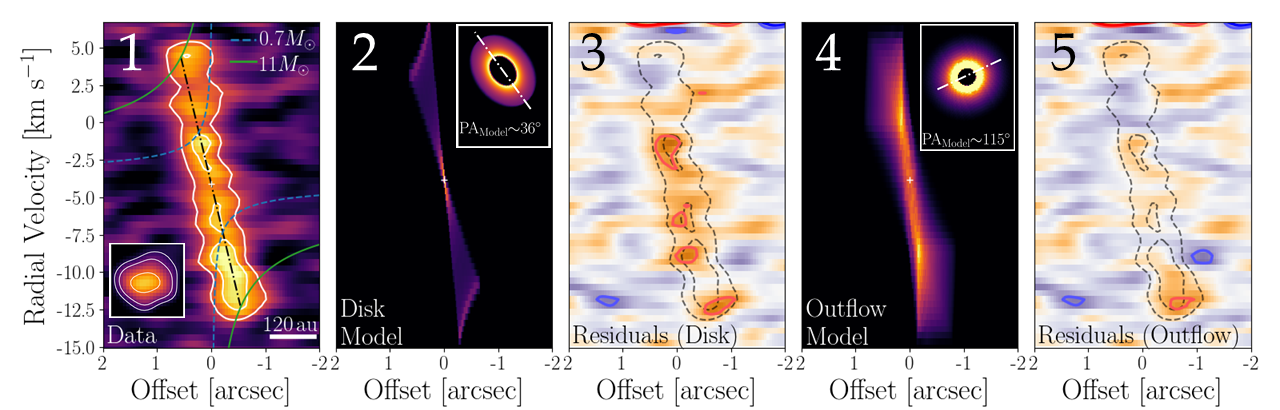
This conclusion can also be illustrated with the position-velocity (PV) diagram in Fig. 3 (see left-hand plot 1), produced with a 36∘ position angle and 2 slit width, which shows how the offset varies with radial velocity.
This agrees with the previous analysis that the velocities are unexpectedly high at a large separation (nearly at au).
The curves and radial extension line on this same plot show that for gas to be in a Keplerian orbit the stellar mass would have to be , i.e., much higher than .
We use a simple model to explore this Keplerian disc interpretation by assuming the gas is in a Keplerian orbit with the stellar mass of NO Lup left as a free parameter, .
This Disc Model computes the density of emitting CO for each pixel in a cube that has RA, Dec, and line of sight, , as axes.
The orientation, position and RV of the disc in the cube are set by the ascending node, (i.e., the PA of the disc major axis), the inclination, , a phase centre offset in RA and Dec (xoff and yoff), the systemic velocity, , and the fixed distance to NO Lup of 133.7 pc (see 2).
The model assumes that the CO density can be modelled with a total flux, , and a power-law radial profile, defined between and with index , for which the volume density goes as .
The model assumes a Gaussian scale height with a fixed aspect ratio, , meaning that the surface density goes as .
We fitted the visibilities of channels -15.1 to km s-1 from the CO line (as done in Kennedy
et al., 2019), using the emcee package (Foreman-Mackey et al., 2013), with 40 walkers and 2000 steps to achieve convergence.
The fit gives reasonable results, showing no residuals in the PV diagram (see Fig. 3, plots 2 and 3), with the best-fit model values shown in Table 1.
We note that the best-fit km s-1 is consistent with that in 2, and that this model did not constrain , which uniformly varied between the imposed limits of -2 to 1.
A similar result was found with a Gaussian radial distribution.
This fitting procedure therefore comes to the same conclusion as shown earlier in requiring a stellar mass that is significantly greater than expected.
Since the stellar luminosity rules out K-type stars within 10s of au of NO Lup, and the X-Shooter spectra rules out NO Lup being a mis-classified star, we conclude that we cannot consistently interpret the CO emission as originating from a Keplerian disc.
| Mod | ||||||
|---|---|---|---|---|---|---|
| deg | deg | au | au | km s-1 | ||
| D | - | |||||
| O |
4 An Outflowing Gas Interpretation
Having ruled out the Keplerian disc interpretation, we explore the possibility that the gas emission is dominated by a radially outflowing velocity component. We define an Outflow Model with a stellar mass fixed at (which sets the azimuthal velocity), where the CO emission extends between and with a radial velocity, , which models the CO gas outflow. This is a variant of the Disc Model of 3, with the same disc parameters and geometry, except that the gas also has an additional radial velocity component and the vertical density distribution is modelled as uniform, with fixed lower and upper edges, such that a vertical cross-section through the disc looks like a wedge with an opening angle . Allowing for a larger scale height is a rough approximation to disc wind models, where material flows both vertically off the disc and radially outwards. We fitted the visibilities as described above for the Disc Model. We again find reasonable results (see Fig. 3, plots 4 and 5), and quote the best-fit model parameters in Table 1, also finding , and an unconstrained , which we therefore fixed as 111 is the value expected for mass conservation if the CO is being created at the inner disc edge.. The Outflow Model finds km s-1, which is higher than the measured velocity from the CO line width and thus dominates the azimuthal velocity for the modelled and . The Outflow Model finds a large opening angle of ; the disc inclination is required to be low to reproduce the spatial extent, thus the scale height is large to maximise the radial component of the velocity, and is significantly larger than the minimum possible value of km s-1. Though the flow in the model is mostly radial, the large scale height can be thought of as approximating the significant vertical component present in outflow models. Despite the simplicity of assuming the gas to have an additional radial velocity component, this model shows that the observations are broadly consistent with a scenario in which the gas is radially outflowing.
5 First Imaged Class III Gas Dispersal
Whilst we model the CO emission over all the channels in which it is detected, for simplicity we have plotted the two models of 3 and 4 in Fig. 3 as PV diagrams, with their corresponding moment-0 maps as thumbnails.
These show that whereas the models have similar PV diagrams, the position angles of their disc midplanes are different, discussed further in Appendix A.
At low spatial resolution, Keplerian disc models and high radial velocity outflowing models (i.e., those in which the radial velocity dominates the azimuthal velocity) can have indistinguishable PV diagrams.
This degeneracy can be broken with higher resolution imaging to measure the PA of the continuum emission which would confirm the radial (or azimuthal) nature of observed CO velocities.
The simple Outflow Model presented in 4 showed that the observations can be fitted with a constant km s-1 radial velocity component.
While it may be possible to explain the observations with a lower outflow velocity, for example with a more detailed model of the gas kinematics, any gas flow must be km s-1, given the spectrum line width of km s-1.
This is high compared to the photoevaporative models of Haworth &
Owen (2020), in which the outflowing wind velocity is km s-1.
In fact, this high velocity rules out a scenario in which the gas is a pure photoevaporative wind, since such a wind velocity should be set by the sound speed, and so to reach even km s-1 would require the CO gas to be at K, which exceeds the CO thermal dissociation temperature.
To accelerate CO gas to such high speeds, additional forces are required (e.g., such as MHD driven winds, see Lesur, 2020, and references therein).
Winds thought to be driven by the disc magnetic field have been observed towards less evolved class II stars with similarly high velocities (see Pontoppidan et al., 2011).
Theoretically, magnetically driven disc winds can be launched with velocities several factors of the Keplerian velocity at 10s of au (Bai, 2016), which at the location of our disc inner edge ( au) is consistent with our modelled outflow velocity.
Thus the 10s of km s-1 velocities inferred here are plausible via this mechanism.
Though we are not aware of theoretical works that have looked into the launching of a magnetised disc wind in the conditions of a debris disc, we note that 4-12 km s-1 dust outflows were detected towards AU Mic by Boccaletti
et al. (2018), and it is worth exploring whether these are launched by a similar mechanism.
Interpretation of NO Lup’s CO emission may therefore require modelling a 3D velocity field and MHD driving, in addition to CO photodissociation and shielding (which we discuss below, Kral et al., 2019; Marino et al., 2020).
While we have discussed the parameter in the Outflow Model as an outflowing velocity, the fit to the observations is insensitive to the sign of , thus we next explore whether the gas is more likely to be infalling or outflowing.
To do so, we compare the observed CO mass loss rate with the upper limit on the CO accretion rate.
Assuming /, we find Myr-1, for , at km s-1, from the mean disc radius (+)/2 au.
Since the estimate of assumes it is in LTE and that the gas is optically thin, this mass loss rate is a lower limit.
Next, by fitting a polynomial to the continuum near the H line (with the EW stated in 2), we obtain a continuum-subtracted line flux of erg s-1 cm-2, from which we estimate the accretion luminosity as , using the empirical relation between line luminosity and accretion luminosity of Alcalá
et al. (2017).
With , and from 2, and a stellar radius of (Gaia
Collaboration et al., 2018), we find a upper limit CO mass accretion rate of <0.1 Myr-1, for an ISM H2/CO abundance ratio of 10,000 (i.e., consistent with the ratio in primordial gas).
This is consistent with other non-accreting class III stars (see Manara
et al., 2013), however it is more than 30 times lower than the inferred CO mass loss rate, indicating that if primordial the CO gas cannot be inflowing.
While this cannot rule out inflowing gas for lower H2/CO ratios (e.g., if the gas is produced in a secondary scenario), we rule out inflowing secondary gas later. However, the upper limit on the CO mass accretion rate may provide an important constraint on models for the outflow that require an inflowing component to conserve angular momentum.
To explore the origin of the gas, we first note that CO at 10-20 km s-1 (i.e., 2-4 au yr-1) would travel 200 au in 100 yr, i.e., over the CO photodissociation time (Visser
et al., 2009), although if well shielded the CO could survive much longer.
This may suggest that the gas was formed during the recent break-up of a massive planetesimal, however such an event would be both rare and leave a distinctive asymmetry in the gas distribution (Jackson et al., 2014) which we do not observe.
Rather, the measured au extent of the CO gas could still be consistent with a 100 yr lifetime, as at larger distances from the star cooler CO is less collisionally excited, and so difficult to detect (Matrà et al., 2015).
Thus, comparing the extent, velocity and gas lifetime does not lead to strong constraints, though this may not be the case for neutral CI gas, which is likely a better probe of outflowing gas at larger distances, as suggested by Haworth &
Owen (2020).
Given typical stellar/disc timescales of 0.1-1 Myr, the high velocity however suggests that the CO must be continuously replenished, as it is extremely unlikely that the CO was imaged within 100 yr after a single or final production event.
The CO reservoir that replenishes the gas may either be in gaseous form (a protoplanetary disc remnant) or in solid form (icy planetesimals in a debris disc).
Protoplanetary discs are expected to disperse on 100 kyr timescales (e.g. Ercolano &
Pascucci, 2017).
While NO Lup’s SED suggests that it has already lost its protoplanetary disc, the dust may have dispersed first, leaving a primordial CO reservoir (e.g., as suggested by Owen &
Kollmeier, 2019).
The detection of CO gas towards 1/30 of the 2 Myr old Lupus class III stars in Lovell
et al. (2020) implies plausible dispersal timescales for such primordial gas remnants of 70 kyr.
A potential problem with this, however, is that no CO reservoir with a Keplerian disc signature is present in our observations.
For such a CO reservoir to go undetected its surface brightness, which in the optically thick limit is (where is the CO emission area, and is the beam area), should be below the 3 noise level of mJy beam-1 (see Lovell
et al., 2020).
If CO emission fills the beam (), then this upper limit implies a temperature below 4 K, significantly below the CO sublimation temperature and thus unlikely.
For a more reasonable temperature of 50 K, the CO emitting area would need to be 150 times smaller than the beam, and thus a ring at au must have a width narrower than 0.01 au, which is also unlikely.
This argues against an optically thick ring of CO being the gas source, though further high-resolution imaging is required to definitively conclude this.
A more plausible explanation may be that the wind is replenished by a reservoir of CO in icy planetesimals in the au belt. Since blackbody disc radii estimates can be smaller than physical planetesimal belt radii (see Eq.8 of Pawellek &
Krivov, 2015), this is consistent with the modelled inner edge of the gas. Moreover, if the CO gas in this scenario is produced in the known planetesimal belt and observed at au, this backs up the previous claim that the gas must be outflowing. Thus, we may be witnessing a short-lived phase after protoplanetary disc dispersal in which CO ice is released and dispersed.
For example, it may be that following primordial gas dispersal a previously stable reservoir of CO ice became susceptible to sublimation (similar to the mechanism suggested on 486958 Arrokoth by Steckloff et al., 2020), or CO was released as planetesimals were ground down in collisions (Marino et al., 2020).
If this is the case, then we may find more examples of class III stars with rapidly dispersing gas winds.
Gas winds have not been seen towards older gaseous debris discs which may indicate that these winds are linked to the evolutionary stage (or spectral type) of the star, or perhaps suppressed by the build-up of other gaseous species over many Myr.
6 Conclusions
By analysing the CO gas detected towards the class III star, NO Lup, we have demonstrated that the CO has a high velocity width and is spatially resolved. Although we showed that this can be fitted with a Keplerian Disc Model, this requires the stellar mass of NO Lup to be implausibly high, i.e., 10 times higher than expected. Instead, we have shown that the gas may be outflowing with a high radial velocity, explaining the km s-1 width and 130 au spatial scale. We conclude that this gas is outflowing and is being continually replenished, and suggest possible interpretations. We note further work to explore the nature of this detection, such as new high resolution imaging of the continuum, measurements for the neutral CI gas, and detailed modelling.
Acknowledgements
We thank the anonymous reviewer for their comments which improved the quality of this work. JBL is supported by an STFC postgraduate studentship. GMK is supported by the Royal Society as a Royal Society University Research Fellow. SM is supported by a Research Fellowship from Jesus College, Cambridge. GR acknowledges support from the Netherlands Organisation for Scientific Research (NWO, program number 016.Veni.192.233). M.T. has been supported by the UK Science and Technology research Council (STFC), and by the European Union’s Horizon 2020 research and innovation programme under the Marie Sklodowska-Curie grant agreement No. 823823 (RISE DUSTBUSTERS project). JPW acknowledges support from NSF grant AST-1907486. MK gratefully acknowledges funding by the University of Tartu ASTRA project 2014-2020.4.01.16-0029 KOMEET. This work was partly supported by the Deutsche Forschungs-Gemeinschaft (DFG, German Research Foundation) - Ref no. FOR 2634/1 TE 1024/1-1. This work was partly supported by the Italian Ministero dell’Istruzione, Università e Ricerca (MIUR) through the grant Progetti Premiali 2012 iALMA (CUP C52I13000140001) and by the DFG cluster of excellence Origin and Structure of the Universe (www.universe-cluster.de).
Data Availability
This work makes use of the following ALMA data: . ALMA is a partnership of ESO (representing its member states), NSF (USA) and NINS (Japan), together with NRC (Canada), MOST and ASIAA (Taiwan), and KASI (Republic of Korea), in cooperation with the Republic of Chile. The Joint ALMA Observatory is operated by ESO, AUI/NRAO and NAOJ. Based on observations collected at the European Southern Observatory under ESO programme 093.C-0506(A).
References
- Adams et al. (1987) Adams F. C., Lada C. J., Shu F. H., 1987, ApJ, 312, 788
- Alcalá et al. (2017) Alcalá J. M., et al., 2017, A&A, 600, A20
- Bai (2016) Bai X.-N., 2016, ApJ, 821, 80
- Baraffe et al. (2015) Baraffe I., Homeier D., Allard F., Chabrier G., 2015, A&A, 577, A42
- Boccaletti et al. (2018) Boccaletti A., et al., 2018, A&A, 614, A52
- Cieza et al. (2013) Cieza L. A., et al., 2013, ApJ, 762, 100
- Dent et al. (2014) Dent W. R. F., et al., 2014, Science, 343, 1490
- Ercolano & Pascucci (2017) Ercolano B., Pascucci I., 2017, Royal Society Open Science, 4, 170114
- Foreman-Mackey et al. (2013) Foreman-Mackey D., Hogg D. W., Lang D., Goodman J., 2013, Publications of the Astronomical Society of the Pacific, 125, 306
- Frasca et al. (2017) Frasca A., Biazzo K., Alcalá J. M., Manara C. F., Stelzer B., Covino E., Antoniucci S., 2017, A&A, 602, A33
- Gaia Collaboration et al. (2018) Gaia Collaboration et al., 2018, Astronomy and Astrophysics, 616, A1
- Hardy et al. (2015) Hardy A., et al., 2015, A&A, 583, A66
- Haworth & Owen (2020) Haworth T. J., Owen J. E., 2020, MNRAS, 492, 5030
- Jackson et al. (2014) Jackson A. P., Wyatt M. C., Bonsor A., Veras D., 2014, MNRAS, 440, 3757
- Kennedy et al. (2019) Kennedy G. M., et al., 2019, Nature Astronomy, 3, 230
- Kral et al. (2017) Kral Q., Matrà L., Wyatt M. C., Kennedy G. M., 2017, Monthly Notices of the Astronomical Society, 469, 521
- Kral et al. (2019) Kral Q., Marino S., Wyatt M. C., Kama M., Matrà L., 2019, MNRAS, 489, 3670
- Krautter et al. (1997) Krautter J., Wichmann R., Schmitt J. H. M. M., Alcala J. M., Neuhauser R., Terranegra L., 1997, Astronomy and Astrophysics Supplement Series, 123, 329
- Lesur (2020) Lesur G., 2020, arXiv e-prints, p. arXiv:2007.15967
- Lovell et al. (2020) Lovell J. B., et al., 2020, Monthly Notices of the Royal Astronomical Society
- Manara et al. (2013) Manara C. F., et al., 2013, A&A, 551, A107
- Marino et al. (2016) Marino S., et al., 2016, Monthly Notices of the Royal Astronomical Society, 460, 2933
- Marino et al. (2020) Marino S., Flock M., Henning T., Kral Q., Matrà L., Wyatt M. C., 2020, MNRAS, 492, 4409
- Matrà et al. (2015) Matrà L., Panić O., Wyatt M. C., Dent W. R. F., 2015, Monthly Notices of the Royal Astronomical Society, 447, 3936
- Matrà et al. (2017) Matrà L., et al., 2017, Monthly Notices of the Royal Astronomical Society, 464, 1415
- Matrà et al. (2019) Matrà L., Öberg K. I., Wilner D. J., Olofsson J., Bayo A., 2019, AJ, 157, 117
- Modigliani et al. (2010) Modigliani A., et al., 2010, in Observatory Operations: Strategies, Processes, and Systems III. p. 773728, doi:10.1117/12.857211
- Moór et al. (2017) Moór A., et al., 2017, ApJ, 849, 123
- Owen & Kollmeier (2019) Owen J. E., Kollmeier J. A., 2019, MNRAS, 487, 3702
- Pawellek & Krivov (2015) Pawellek N., Krivov A. V., 2015, Monthly Notices of the Royal Astronomical Society, 454, 3207
- Pontoppidan et al. (2011) Pontoppidan K. M., Blake G. A., Smette A., 2011, ApJ, 733, 84
- Siess et al. (2000) Siess L., Dufour E., Forestini M., 2000, A&A, 358, 593
- Steckloff et al. (2020) Steckloff J. K., Lisse C. M., Safrit T. K., Bosh A. S., Lyra W., Sarid G., 2020, arXiv e-prints, p. arXiv:2007.12657
- Visser et al. (2009) Visser R., van Dishoeck E. F., Black J. H., 2009, A&A, 503, 323
- Williams & Cieza (2011) Williams J. P., Cieza L. A., 2011, ARA&A, 49, 67
- Wyatt (2008) Wyatt M. C., 2008, Annual Review of Astronomy and Astrophysics, 46, 339
- Wyatt et al. (2015) Wyatt M. C., Panić O., Kennedy G. M., Matrà L., 2015, Ap&SS, 357, 103
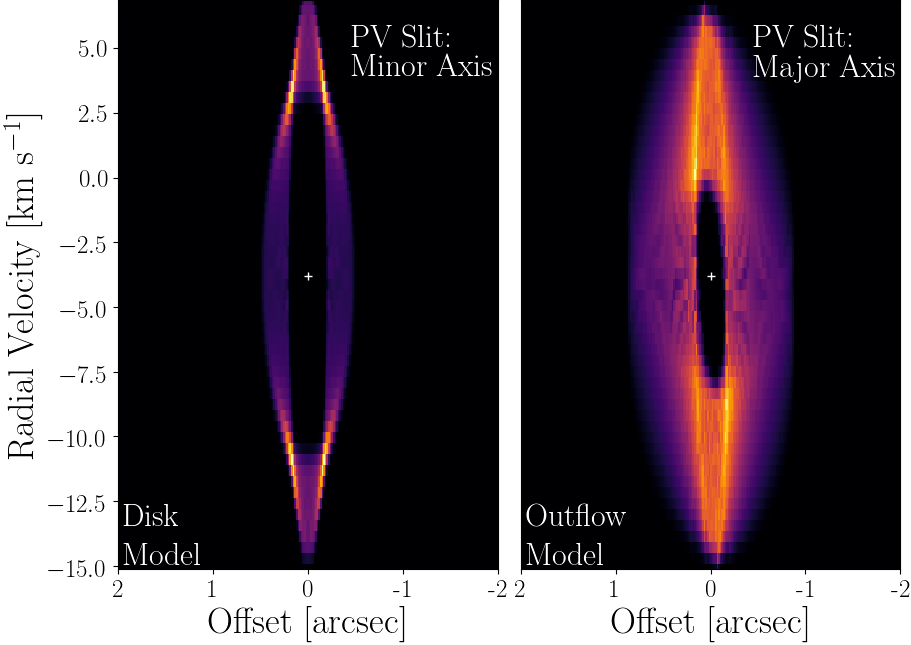
Appendix A PV Diagrams
In Table 1 we show that the two models that fit the observations have disc position angles that are different. Since our modelling fits all channel maps in the data set (i.e., it does not fit a PV diagram) we have a choice in how we present this. In Fig. 3 we used a slit angle of , i.e., parallel to direction of motion of the peak in the channel maps, the Disc Model major axis, and the Outflow Model minor axis, which produced a stripe (see panels 1, 2 and 4). If instead we place the PV diagram slit PA along the major axis of the Outflow Model and the minor axis of the Disc Model, these yield model PV diagrams that are then elliptical as can be seen in Fig. 4, and similar to those presented in Haworth & Owen (2020). Thus, although the choice of slit PA does not bias our modelling, a different choice will result in a different visualisation, but not one that can distinguish between the Keplerian Disc Model and the Outflow Model.