Viability of Optical Coherence Tomography for Iris Presentation Attack Detection
Abstract
In this paper, we propose the use of Optical Coherence Tomography (OCT) imaging for the problem of iris presentation attack (PA) detection. We assess its viability by comparing its performance with respect to traditional iris imaging modalities, viz., near-infrared (NIR) and visible spectrum. OCT imaging provides a cross-sectional view of an eye, whereas traditional imaging provides 2D iris textural information. PA detection is performed using three state-of-the-art deep architectures (VGG19, ResNet50 and DenseNet121) to differentiate between bonafide and PA samples for each of the three imaging modalities. Experiments are performed on a dataset of 2,169 bonafide, 177 Van Dyke eyes and 360 cosmetic contact images acquired using all three imaging modalities under intra-attack (known PAs) and cross-attack (unknown PAs) scenarios. We observe promising results demonstrating OCT as a viable solution for iris presentation attack detection.
I Introduction
An iris recognition system recognizes an individual based on their iris texture. A majority of commercial iris recognition systems acquire iris images in the near-infrared (NIR) spectral band. Recently, iris recognition systems have been deployed on mobile devices that capture the iris in the visible spectrum (VIS).
Iris systems are vulnerable to presentation attacks (PAs) where an adversary presents an artificial or altered biometric sample to the sensor to obfuscate their own identity or to spoof someone else’s identity or to create a virtual identity [25]. Examples of PAs include printed eye, artificial eye (artificial eye or plastic eye), replay attack, cosmetic contact lens, etc. Our objective is to detect iris PAs when presented to an iris recognition system.
Techniques proposed in the literature to counter iris PAs can be categorized as software-based or hardware-based. Software-based techniques utilize the iris image captured by the standard iris sensor to detect PAs. Various texture-based features are extracted from the captured iris image to detect the PA, for instance, SIFT [35], LBP [9] and BSIF [22]. More recently, deep-learning based approaches have been utilized for PA detection from the captured iris image [19, 3, 11, 28]. The techniques referenced above are mostly based on NIR iris images except [9, 22] which operate on VIS images. Menotti et al. [19] showed results on both NIR and VIS iris images. Raghavendra and Busch [24] exploited characteristics of the Light Field Camera (LFC) for iris PA detection in the VIS spectrum. Sequeira et al. [27] suggested the use of a one-class classifier on VIS images for generalization across unseen attacks, i.e., attacks that were not used in the training phase. In [23], the authors utilized Eulerian Video Magnification (EVM) to detect PAs in VIS videos.
Hardware-based techniques require additional hardware in addition to the iris sensor to capture the liveness characteristics of the iris. Techniques include analyzing pupil dynamics [6], 3D structural modeling of the eye using stereo imaging [15], observing change in pupil size and iris texture with changes in light intensity [16] and gleaning eye movement cues [17]. There are some techniques that employ multi-spectral illumination for iris PA detection. Park and Kang [21] utilized a specialized tunable filter to capture iris images at different spectral bands ranging from 650nm to 1100nm. These multi-spectral images are then fused at the image-level to detect PAs. Lee et al. [18] analyzed the reflectance properties of the iris and sclera in multi-spectral illumination. Chen et al. [4] captured images at the near-infrared (860nm) and blue (480nm) wavelengths, and then analyzed the conjunctival vasculature patterns and the iris textural patterns for liveness detection.111Early literature used the term “liveness detection” to refer to the problem of PA detection. Connell et al. [5] exploited the anatomy and geometry of the human eye using structured light to detect cosmetic contact lens. Thavalengal et al. [31] used both VIS and NIR images for iris liveness detection in smartphones. Hsieh et al. [12] utilized dual-band imaging hardware (VIS and NIR) to distinguish between the textured pattern of contact lens from real iris patterns using independent component analysis. Assessment reports of other state-of-the-art iris PA detection techniques are presented in [34, 7, 8].
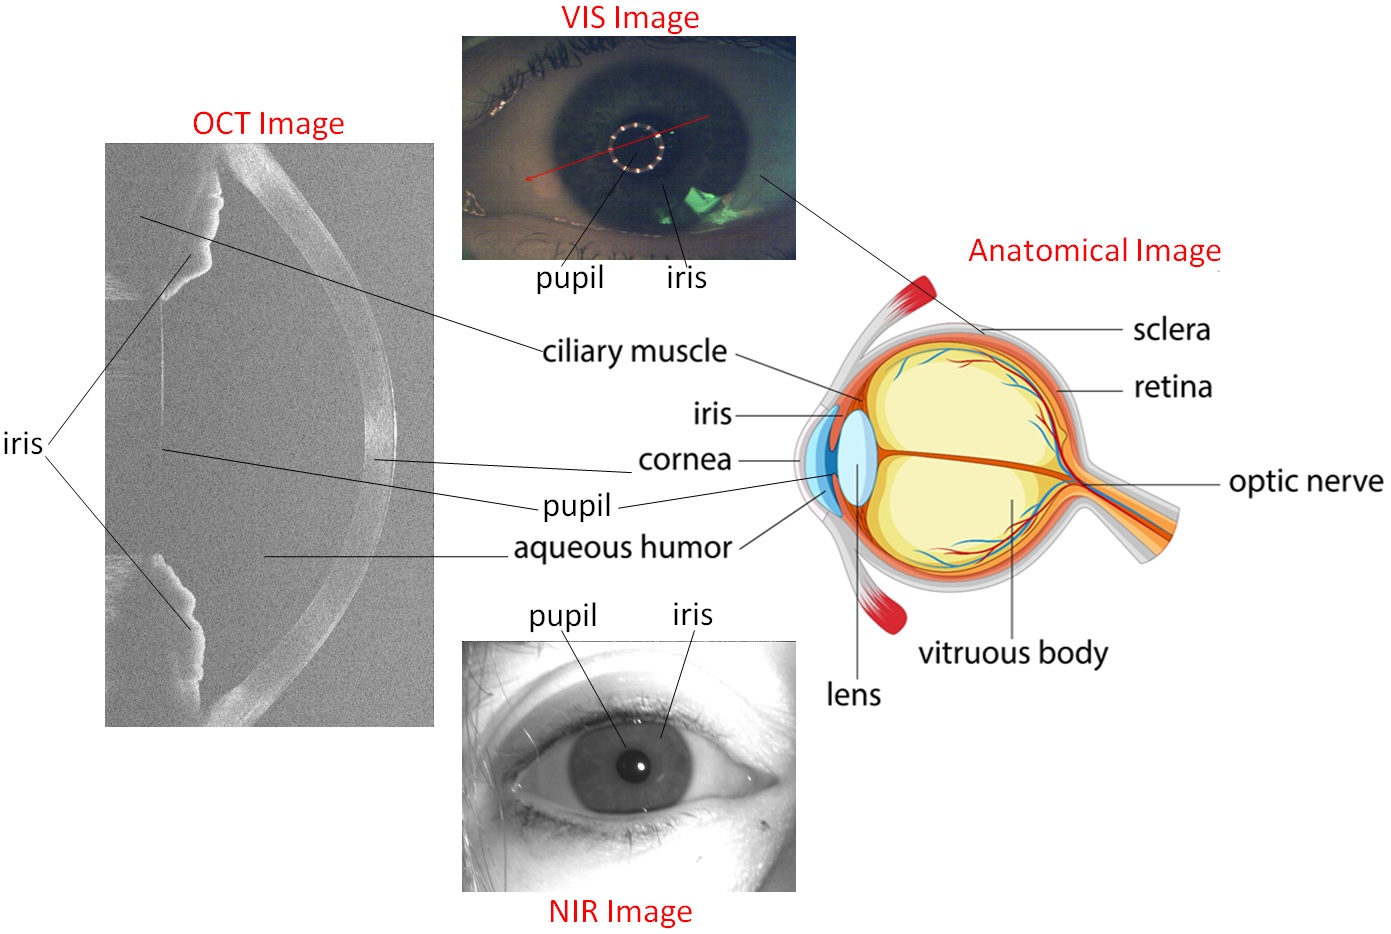
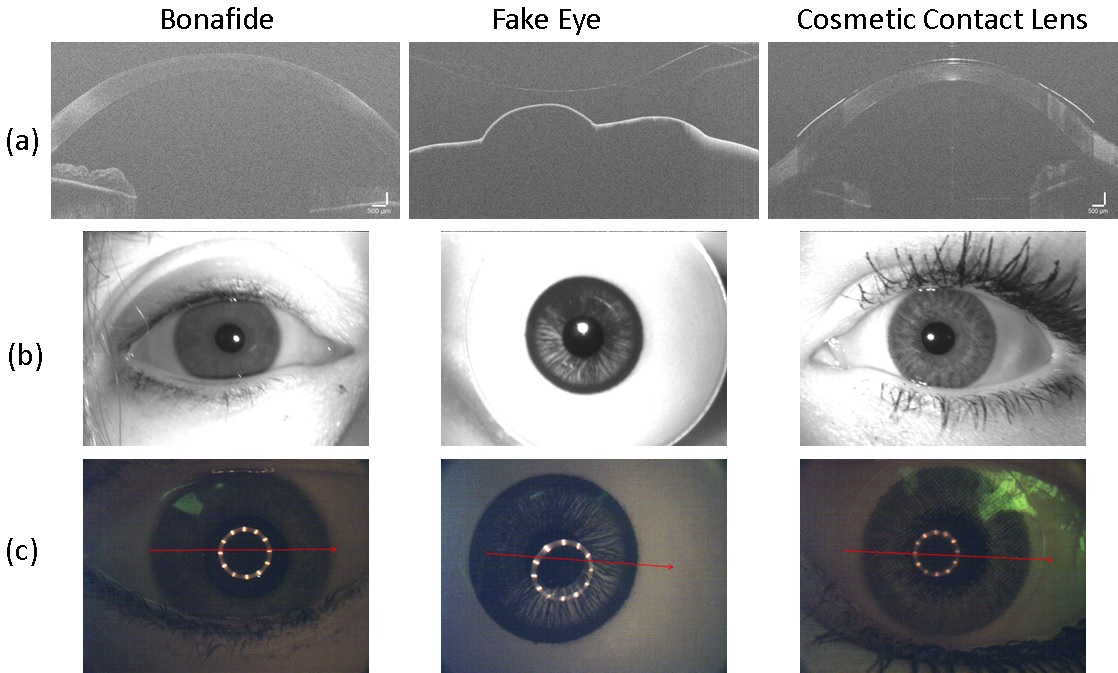
In contrast to conventional PA detection algorithms based on NIR or VIS imaging, we propose a novel approach that uses Optical Coherence Tomography (OCT) imaging for iris PA detection. 222OCT also employs NIR illumination, but obtains cross-sectional views not textural details. NIR and VIS images capture the stromal textural patterns of the iris, whereas OCT images capture the internal structure of the eye and the iris (Figure 1). OCT imaging has been utilized for fingerprint PA detection [20]. But the unavailability of an OCT iris dataset and the high hardware costs associated with OCT have traditionally prevented its exploration for iris PA detection. However, the development of cost-effective OCT hardware [30] motivates us to consider it for iris PA detection. To the best of our knowledge, this is the first time an OCT-based solution has been introduced for iris PA detection. The main contributions of our work are as follows:
-
1.
We propose a hardware-based iris PA detection technique based on OCT imaging technology. We also assess its viability by comparing its performance against traditional NIR and VIS imaging modalities.
- 2.
-
3.
We evaluate PA detection performance on a dataset of 2,169 bonafide, 177 Van Dyke eyes and 360 cosmetic contact lens images under intra-attack and cross-attack scenarios. Each input sample is captured in all three imaging modalities.
-
4.
We also generate CNN visualizations (heatmaps [26] and t-SNE plots [32]) to further analyze the results on OCT, NIR and VIS images. Heatmaps are used to identify salient image regions that the deep architectures utilize to detect PAs. t-SNE plots aid in visualization of features extracted by the CNN architectures.
The rest of the paper is organized as follows. Section 2 discusses background of the imaging modalities. Section 3 describes the proposed approach. Section 4 provides a description of the dataset. Section 5 describes the experimental setup and reports the results. Section 6 concludes the work.
II Background of Iris Imaging Modalities
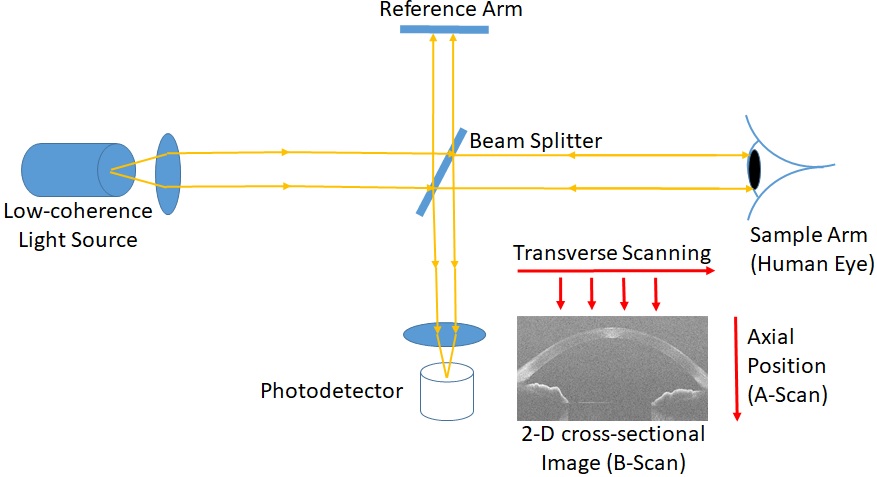
The complex texture of the iris is characterized by its components, including, pigments (chromophore), blood vessels, muscles, crypts, contractile furrows, freckles, collarette and pupillary frills. Different spectral bands can potentially be used to capture different components of the iris. NIR illumination, which operates in the 700-900nm range, predominantly captures the stromal features (fibrovascular layer) of the iris, whereas VIS (400-700nm) captures information about the pigment melanin. Optical Coherence Tomography (OCT) [13] is a non-invasive, micrometer-resolution imaging modality, that can be used to capture 2-D cross-sectional or 3-D volumetric images of an eye. It is mainly used for biomedical and clinical purposes, such as ophthalmology, optometry, cardiology and dermatology. It works with a low-coherence near-infrared (800nm-1325nm) light source. OCT imaging captures cornea (circular arc), iris tissue structure, anterior humor (the space between iris and cornea) and the ciliary muscles (next to the iris tissues) of the eye as shown in Figure 1. OCT images are captured by shining the light source over a beam splitter, which splits the light into two beams, one directed to the sample arm (human eye) and another to the reference arm (mirror). The time delay and intensity of the back-reflected light from both the arms are estimated to create an axial back-scattering profile called A-Scan. Combination of A-Scans along transverse axis forms a 2-D cross-sectional image called B-Scan. The imaging setup of an OCT sensor is shown in Figure 2. OCT imaging primarily captures the structure and morphology of the eye as opposed to texture information that is typically observed in NIR and VIS images.
A majority of commercial iris recognition systems and iris PA detection algorithms utilize NIR images for the following reasons. Firstly, NIR illumination penetrates deeper into the iris and elicits the textural pattern of both light and dark irides; in contrast, majority of VIS illumination is absorbed by higher levels of melanin in dark-colored irides resulting in poorly discernible iris texture. Secondly, background illumination variations and corneal reflections do not affect NIR imaging as much as RGB imagers. However, some iris recognition and PA detection algorithms have started using VIS imaging due to inexpensive hardware and a wide range of applications (mobile devices, surveillance, etc.) [9, 33]. Due to expensive hardware, OCT imaging has not been traditionally discussed in the literature for either iris recognition or PA detection.
III Proposed Approach
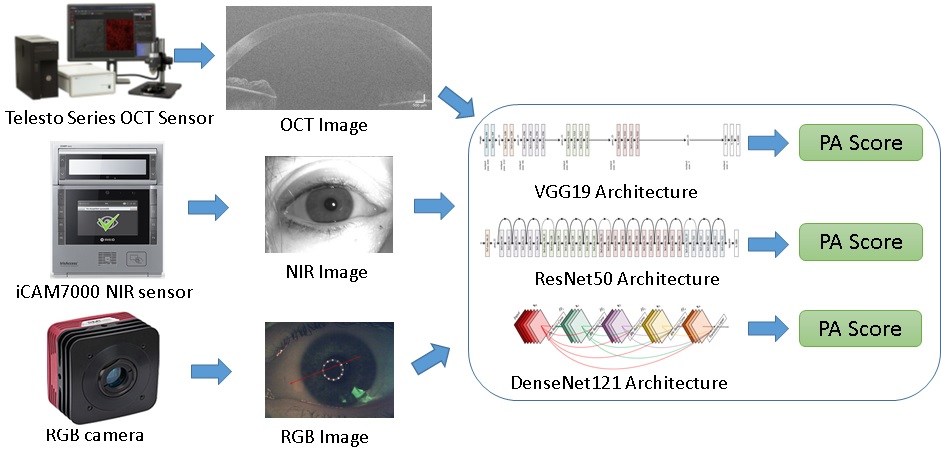
In this work, we discuss the use of OCT imaging for iris PA detection. For classification of iris OCT images as bonafide or PA, we used three state-of-the-art deep CNN architectures: VGG19 [29], ResNet50 [10] and DenseNet121 [14]. These architectures output a single PA score in the range [0, 1], with a ‘1’ indicating a PA and ‘0’ indicating a bonafide. Using the same CNN architectures, we compare the PA detection capability of OCT images against NIR and VIS images. Overview of the approach is depicted in Figure 3. In the subsequent sub-section, we provide implementation details of all three network architectures.
To classify bonafide and PA iris images acquired from all three imaging modalities, we used three state-of-the-art deep architectures: VGG19 [29], ResNet50 [10] and DenseNet121 [14]. These three networks differ by the number of the convolutional layers, the number of trainable parameters and the connection type. VGG19 [29] has 19 convolutional layers with kernels of fixed size 3 3 throughout the network. It has 143,667,240 trainable parameters. ResNet50 [10] has 50 convolutional layers with residual connections (skip connections) to moderate gradient flow and allow the training of a large network. It has 35,610,216 trainable parameters. DenseNet121 [14] consists of 121 convolutional layers, where each layer is connected to every other layer resulting in a much reduced set of trainable parameters (7,978,856). Three different sized architectures are utilized in the study to eliminate the bias created due to the network architecture (under-fitting or over-fitting) in the comparison results. As the dataset used in the study is insufficient to train these deep architectures, we utilize pre-trained models on ImageNet dataset. Pre-trained models also help in faster convergence during the training process. ImageNet is a large dataset used for object classification containing 1.2 million images of 1000 classes. The images in ImageNet dataset are visible spectrum images, i.e., RGB. To preserve the usefulness of pre-trained weights for the OCT and NIR spectrum images, we normalize OCT, NIR and VIS images using the mean and the standard deviation calculated from the ImageNet dataset images. The photometrically normalized images are then re-sized to 224 224 and input to the aforementioned architectures. All three models are then fine-tuned using OCT, NIR and VIS iris images resulting in nine trained models. The learning rate used in the training is 0.005, the batch size is 20, the optimization algorithm is stochastic gradient descent with momentum of 0.9, the number of epochs is 50, and the loss function is cross-entropy. During test and evaluation, each of these networks produce a single PA score which is used along with a threshold to determine if the input image is a PA or a bonafide.
IV Dataset
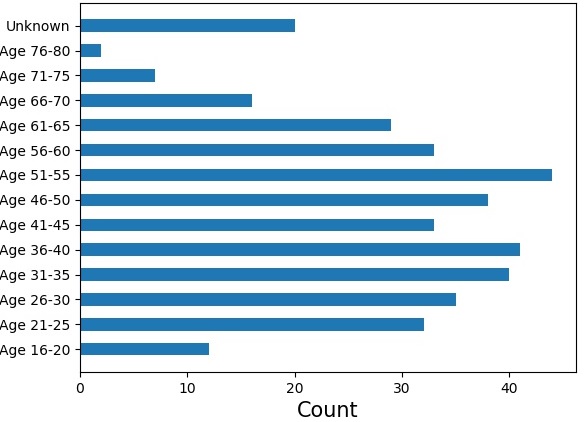
The dataset is collected under the Odin program of IARPA [1] from 740 eyes (370 subjects). Figure 4 provides age distribution of subjects. The number of male and female subjects are 136 and 243, respectively. OCT, NIR and VIS images are collected sequentially for a subject using an RGB camera, iCAM7000 NIR sensor and THORLabs Telesto series (TEL1325LV2) OCT sensor [2], respectively. The OCT images are acquired at 1325nm wavelength having 7mm imaging depth and 12m axial imaging resolution. For a single sample, 50 cross-sectional frames are captured by the OCT sensor. However, temporal information is not significant among frames, so we use only the first frame. Iris PAs considered in this study are artificial eyes (Van Dyke eyes) and cosmetic contact lenses. For OCT and VIS, the dataset contains 844 bonafide images, 61 artificial eyes and 120 cosmetic contact lens images, whereas, for NIR, there are 1,371 bonafide images, 111 artificial eyes and 120 cosmetic contact lens images. Further sub-categorization of PA images is provided in Table I. Figure 5 shows examples of bonafide and PA images acquired in all three spectra (OCT, NIR and VIS).
| Classes | Sub-Classes | Imaging Modality | ||
| OCT | RGB | NIR | ||
| Bonafide | 844 | 844 | 1371 | |
| Artificial Eyes | Van Dyke Eye (Brown) | 30 | 30 | 51 |
| Van Dyke Eye (Blue) | 29 | 29 | 56 | |
| Face Mask | 2 | 2 | 4 | |
| Cosmetic Contacts | Acuvue Accent Vivid | 37 | 37 | 43 |
| Air Optix Sterling Grey | 41 | 41 | 43 | |
| Extreme FXS Halloween Blackout | 42 | 42 | 34 | |
V Experimental Setup and Results
Before evaluating the three imaging modalities (OCT, NIR and VIS), we assess the performance of three fine-tuned architectures (VGG19, ResNet50 and DenseNet121) on the LivDet-iris 2017 [34] dataset for iris PA detection. The dataset is an amalgamation of Clarkson, Warsaw, Notre Dame and IIITD-WVU datasets. Print and cosmetic contact lens PAs are included in the dataset. The experimental setup is kept the same as specified in the competition [34]. Evaluation measures are Attack Presentation Classification Error Rate (APCER) and Bonafide Presentation Classification Error Rate (BPCER), where APCER is the proportion of PA samples misclassified as bonafide and BPCER is the proportion of bonafide samples misclassified as PAs. All three architectures either outperform or are comparable to the state-of-the-art algorithms (CASIA, Anon1 and UNINA) on the LivDet-iris 2017 competition as shown in Table II.
Utilizing the three architectures, we perform comparative evaluation of OCT, NIR and VIS images in detecting iris PAs. Experiments are performed under intra- and cross-attack scenarios. Samples that were successfully captured in all three imaging modalities are selected for experiments. The dataset used for evaluation eventually has 723 bonafide samples, 59 artificial eyes and 120 cosmetic contact lens images captured in all three imaging modalities. The train, validation and test sets are eye-disjoint, i.e., they have data from different eyes and samples in the three sets are mutually exclusive. Intra-attack experiments examine which imaging modality performs best with known PAs (used during training), whereas cross-attack experiments analyze the generalizability across unknown PAs (not used in training). The evaluation measures used are True Detection Rate (TDR) at 0.2% False Detection Rate (FDR), and Average Classification Error Rate (ACER). TDR is the percentage of PA samples that were correctly detected, whereas FDR is a percentage of bonafide samples that were misclassified as PA. ACER is the average of APCER and BPCER. Receiver operating characteristic (ROC) curves are also provided for a comprehensive overview. For successful detection, TDR should be comparatively higher and ACER should be comparatively lower.
V-A Intra-attack Setup and Results
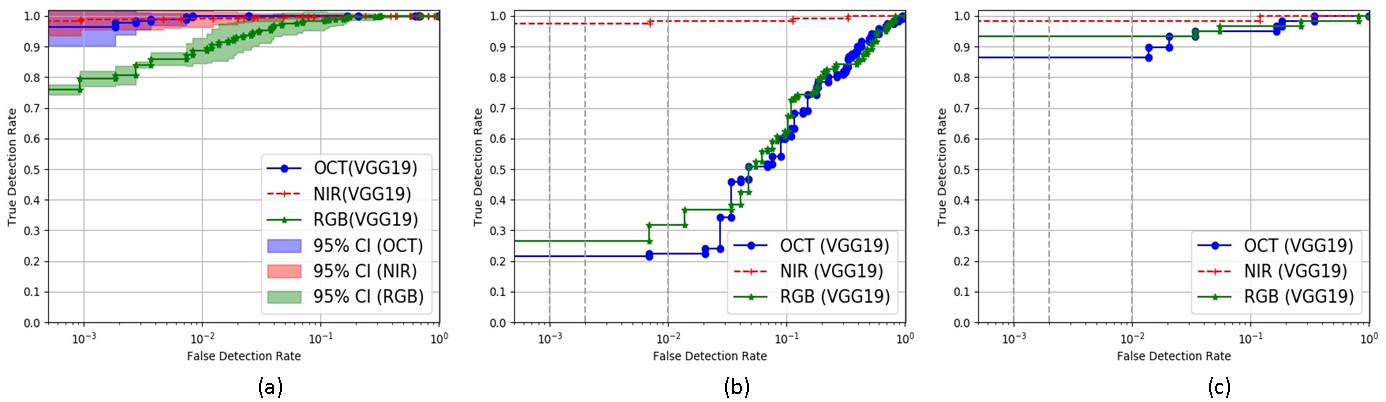
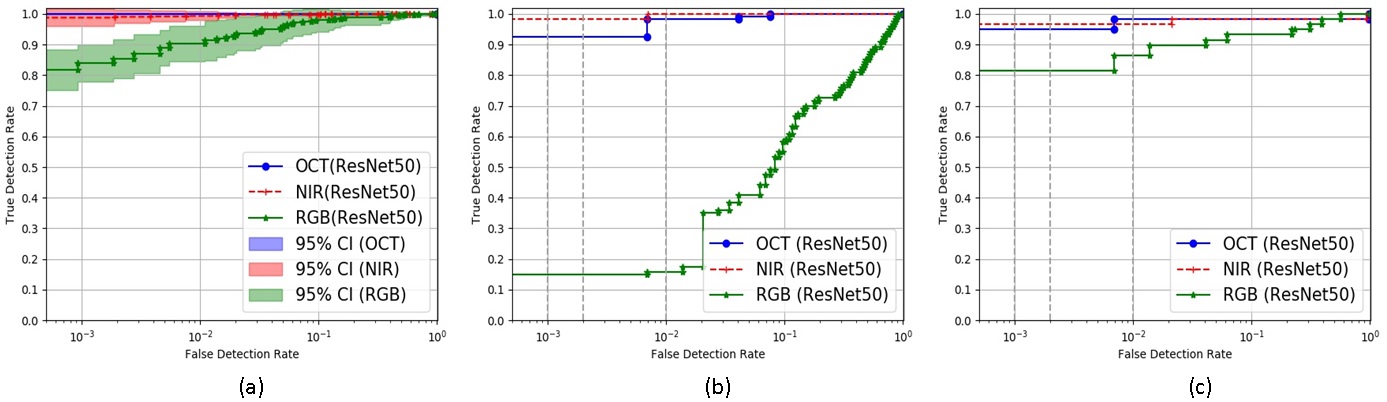
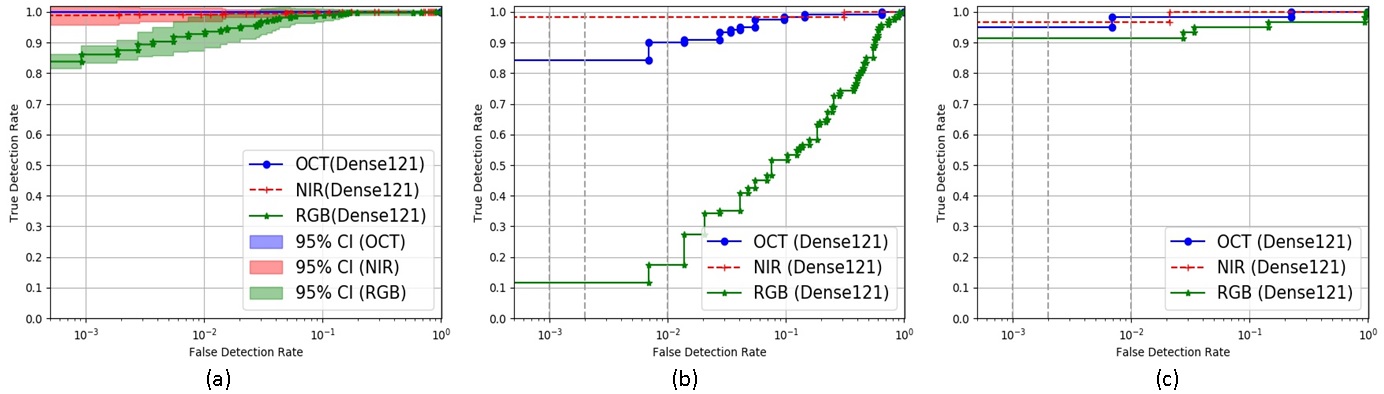
In the intra-attack setup, three experiments are performed: Intra-EXP 1, Intra-EXP 2 and Intra-EXP 3. Intra-EXP 1 includes both the PAs (artificial eyes and cosmetic contact lens) and bonafide images in the training and test sets, whereas Intra-EXP 2 and Intra-EXP 3 include images from only one PA along with bonafide images for training and testing. Intra-EXP 2 and Intra-EXP 3 experiments are performed to test the difficulty level of differentiating a specific PA from bonafide samples. Details about the train, validation and test sets of all three experimental setups are provided in Table III. In the first experiment (Intra-EXP 1), the data are split in a 70:30 ratio, where 70% of eyes is used for training and the remaining for testing (30%). Thereafter, five-fold cross-validation is employed on the training set, where 4 folds are used for training and one for validation. The validation set is used to estimate the threshold to be used on the test set for calculating ACER. The TDR at 0.2% FDR and the ACER for VGG19, ResNet50 and DenseNet121 architectures are provided in Table IV. ROC curves of Intra-EXP 1 for all three architectures are shown in Figures 6(a), 7(a) and 8(a).
In the Intra-EXP 1 experiment, the best results are observed on OCT images, second-best on NIR images, and then on VIS images. All trained models (five) obtained from cross-validation show low standard deviation in the results when tested on OCT images (Figures 7(a) and 8(a)) compared to NIR and VIS images. Similar results are observed across all three network architectures (VGG19, ResNet50 and DenseNet121). This validates the robustness of PA detection when using OCT images. Considering individual PAs in Intra-EXP 2 and Intra-EXP 3 experiments, it is found that both types of PAs are perfectly classified (100% TDR) by the OCT and NIR modalities. There are a few errors when detecting cosmetic contact PAs using the VIS modality (98.63% TDR). So, in the intra-attack scenario, where attacks are known and used during training, the OCT modality perfectly separates (100% TDR at 0.2% FDR) bonafide and PA iris images by a higher margin compared to the NIR and VIS modalities.
| Experiments | Train Set | Validation Set | Test Set | |||||
|---|---|---|---|---|---|---|---|---|
| Bonafide | PAs | Bonafide | PAs | Bonafide | PAs | |||
|
404 | 100 | 101 | 25 | 218 | 54 | ||
|
435 | 35 | 145 | 12 | 146 | 12 | ||
|
435 | 72 | 145 | 24 | 146 | 24 | ||
|
435 | 41 | 145 | 18 | 146 | 120 | ||
|
435 | 84 | 145 | 36 | 146 | 59 | ||
V-B Cross-attack Setup and Results
To perform the cross-attack (generalization to unknown attacks) analysis, two experiments are conducted: Cross-EXP 1 and Cross-EXP 2. In the first experiment (Cross-EXP 1), training is performed on bonafide and artificial eye images, and testing is done on bonafide and cosmetic contact lens images. Bonafide images are split in a 60:20:20 ratio for the training, validation and test sets, respectively. Artificial eye images are split in a 70:30 ratio for the training and validation sets, respectively. All cosmetic contact images constitute the test set. In the second experiment (Cross-EXP 2), training is performed on bonafide and cosmetic contact lens images, and testing is done on bonafide and artificial eye images. Bonafide images are split in the same way as Cross-EXP 1. Cosmetic contact lens images are split in a 70:30 proportion for the training and validation sets, respectively. All artificial eye images are used in the test set. Further details of both the experimental setups are given in Table III. The TDR at 0.2% FDR and the ACER for VGG19, ResNet50 and DenseNet121 architectures are provided in Table IV. ROC curves of all three architectures for the two experiments are shown in Figures 6(b) and 6(c), 7(b) and 7(c), and 8(b) and 8(c), respectively.
In the cross-attack scenario, the best results are observed on NIR images, followed by OCT images and then VIS images. Basically, the OCT and VIS modalities failed in detecting cosmetic contact images when training is performed using artificial eye PAs (see Figures 6(b), 7(b) and 8(b)). The feature sub-spaces of bonafide samples and cosmetic contact lens seem to overlap (middle column of Figure 10). However, when classifiers are trained on cosmetic contact images (Figure 6(c), 7(c) and 8(c)), they can detect artificial eye PAs as feature sub-space of artificial eyes seems to be well separated from that of bonafide samples (last column of Figure 10). Difficulty in detecting cosmetic contact PAs is also reflected in the Intra-EXP 2 and Intra-EXP 3 experiments. ResNet50 and DenseNet121 architectures are better suited for the cross-attack scenario than the VGG19 network, as a higher number of trainable parameters are present in VGG19 and the training data is insufficient. As the networks are pre-trained on the ImageNet dataset (containing VIS images), trainable parameters converge in the case of VIS and NIR images, but fail to converge for OCT images due to the fundamentally different image modality (Figure 5(a)).
| VGG19 | ResNet50 | DenseNet121 | ||||||||
| Experiments | Evaluation Measure | OCT | NIR | RGB | OCT | NIR | RGB | OCT | NIR | RGB |
| ACER | 0.08 ± 0.15 | 0.02 ± 0.01 | 0.09 ± 0.03 | 0.00 ± 0.00 | 0.00 ± 0.01 | 0.08 ± 0.00 | 0.02 ± 0.03 | 0.02 ± 0.02 | 0.07 ± 0.02 | |
| Intra-EXP 1 (Both Artificial & CC) | TDR | 100 ± 0.00 | 97.99 ± 2.66 | 82.58 ± 6.88 | 100 ± 0.00 | 97.33 ± 3.88 | 89.62 ± 3.62 | 100 ± 0.00 | 97.66 ± 3.26 | 86.66 ± 3.59 |
| ACER | 0.00 | 0.00 | 0.00 | 0.00 | 0.00 | 0.04 | 0.00 | 0.00 | 0.00 | |
| Intra-EXP 2 (Only Artificial Eyes) | TDR | 100 | 100 | 100 | 100 | 100 | 100 | 100 | 100 | 100 |
| ACER | 0.00 | 0.00 | 0.03 | 0.00 | 0.00 | 0.00 | 0.00 | 0.00 | 0.03 | |
| Intra-EXP 3 (Only CC) | TDR | 100 | 100 | 95.83 | 100 | 100 | 100 | 100 | 100 | 100 |
| ACER | 0.39 | 0.01 | 0.19 | 0.20 | 0.01 | 0.27 | 0.16 | 0.01 | 0.30 | |
| Cross-EXP 1 (CC are unknown) | TDR | 21.66 | 97.58 | 26.66 | 92.50 | 98.38 | 15.00 | 84.16 | 98.38 | 11.66 |
| ACER | 0.06 | 0.03 | 0.04 | 0.01 | 0.02 | 0.07 | 0.05 | 0.01 | 0.04 | |
| Cross-EXP 2 (Artificial eyes are unknown) | TDR | 86.44 | 98.38 | 93.22 | 94.91 | 96.77 | 81.35 | 94.91 | 96.77 | 91.52 |
The main findings of the comparative analysis are:
-
1.
In the intra-attack scenario, when PAs are known and used during training, OCT images provide more discriminative information for distinguishing between bonafide and PA samples. However, NIR imaging provides better generalizability across unknown iris PA attacks.
-
2.
Cosmetic contact PAs are difficult to detect compared to artificial eyes, especially on VIS images.
-
3.
ResNet50 and DenseNet121 architectures are well-suited for iris PA detection in the OCT imaging modality possibly due to the smaller number of trainable parameters compared to VGG-19.
VI CNN Visualization
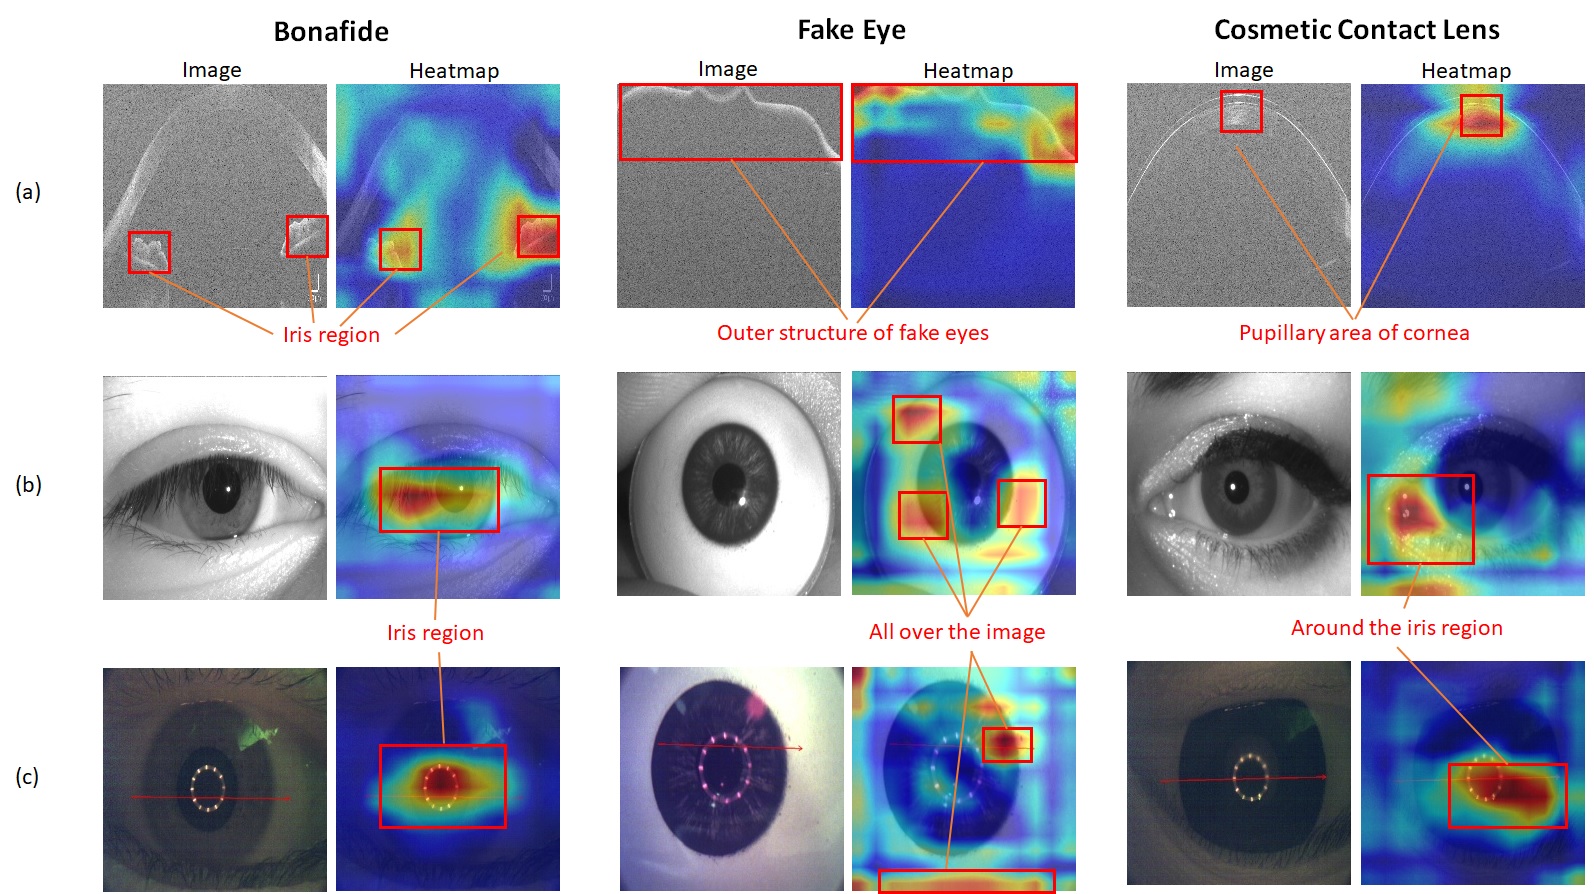
The performance of all three architectures is nearly perfect on OCT and NIR images. To further analyze the results, we generate heatmaps [26] and t-SNE plots [32]. Heatmaps provide the salient regions in OCT, NIR and VIS images where the classifier (ResNet50) focused on, in order to discriminate PAs from bonafide samples. Heatmaps are generated using Grad-CAM [26]. Grad-CAM uses a gradient of the loss function and backpropagates it through the convolutional layers to generate activations on the input image. OCT, NIR and VIS images of a bonafide, artificial eye and cosmetic contact lens are shown along with their heatmaps in Figure 9. In the case of OCT images (Figure 9(a)), the heatmap of the bonafide image highlights the iris regions, which is the most discriminative region compared to OCT PA images. The heatmap of an artificial eye image focuses over the outer structure. Cosmetic contact lens conceals the underlying iris pattern (partially or fully), which causes the focus to shift over to the corneal region corresponding to the pupil. In the case of NIR and VIS imaging (Figure 9(a) and 9(b)), heatmaps of bonafide sample focus over the iris pattern. For an artificial eye image, the heatmap is activated all over the image, whereas for a textured contact lens more emphasis is given to the circumference of the iris. Different regions of focus for different categories (bonafide and PA) aid the CNN architecture to discriminate between them.
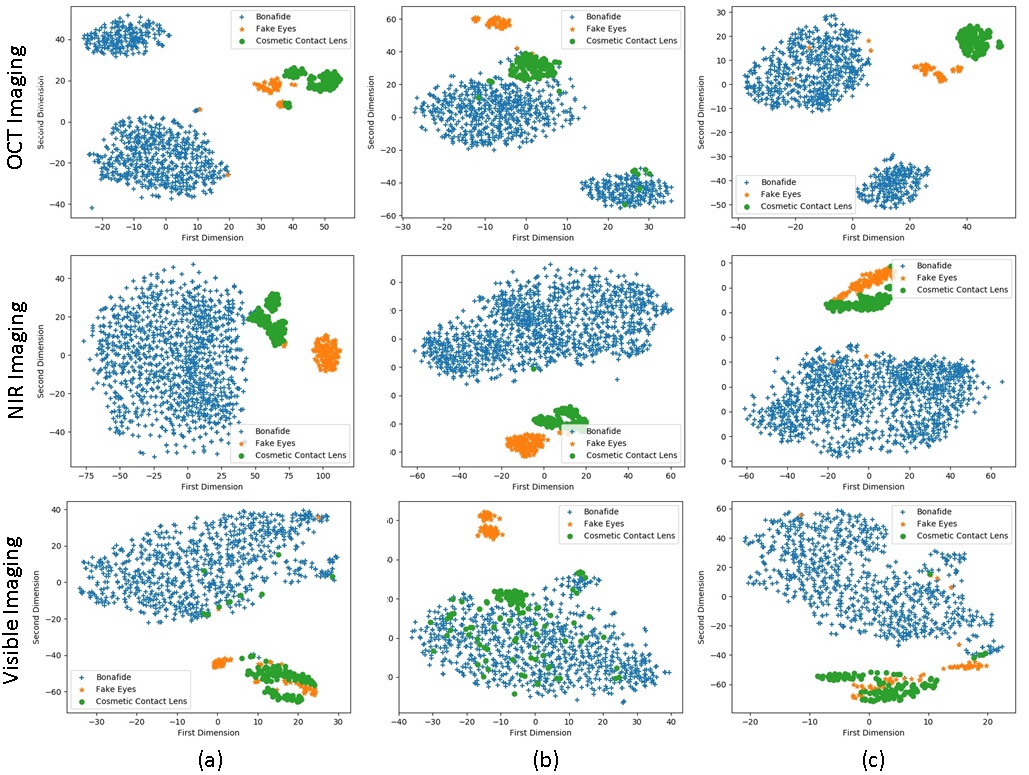
After visualizing activations on the input image, we also visualize the CNN features using a t-SNE plot [32]. The CNN features are extracted from the average pooling layer (penultimate layer, a layer before the last fully connected layer) of the ResNet50 architecture. The dimensionality of the features is 2048, which is reduced to two dimensions using t-Distributed Stochastic Neighbor Embedding (t-SNE). The t-SNE plots are shown in Figure 10. These t-SNE plots correspond to Intra-EXP 1 (first column), Cross-EXP 1 (second column) and Cross-EXP 2 (third column) test data. Distribution of bonafide, artificial eyes and cosmetic contact images are observed to be well separated in OCT imaging in the case of Intra-EXP 1 and Cross-EXP 2 experiments. Separation of these features is also prominent in NIR imaging under the cross-attack scenario (Cross-EXP 1 and Cross-EXP 2). Features in the case of Cross-EXP 1 experiment overlap for VIS images. These plots substantiate our observations that OCT imaging works efficiently in the intra-attack scenario and moderately in the cross-attack scenario, while NIR imaging generalizes well in the cross-attack scenario.
VII Conclusion and Future Work
In this paper, we described the use of the OCT imaging modality for iris PA detection. By comparative analysis against other imaging modalities (traditional NIR and VIS), we determined that OCT is a viable solution for iris PA detection. Extensive experiments were conducted both in the intra-attack and cross-attack scenarios using three state-of-the-art deep architectures, and results were analyzed using CNN visualizations (heatmaps and t-SNE plots). Future work will involve collecting OCT data from more subjects and other types of PAs. Hardware cost continues to be a barrier for the use of OCT in iris recognition applications. However, as sophisticated presentation attacks are launched in the future, the OCT modality is likely to be of great benefit.
Acknowledgment
This research is based upon work supported in part by the Office of the Director of National Intelligence (ODNI), Intelligence Advanced Research Projects Activity (IARPA), via IARPA R&D Contract No. 2017 - 17020200004. The IRB number is IRB00123321. The views and conclusions contained herein are those of the authors and should not be interpreted as necessarily representing the official policies, either expressed or implied, of ODNI, IARPA, or the U.S. Government. The U.S. Government is authorized to reproduce and distribute reprints for governmental purposes notwithstanding any copyright annotation therein.
References
- [1] Intelligence Advanced Research Projects Activity (IARPA), ODNI: IARPA-BAA-16-04 (Thor). https://www.iarpa.gov/index.php/research-programs/odin/odin-baa.
- [2] THORLabs Telesto series (TEL1325LV2) Spectral domain OCT scanner. https://www.thorlabs.com/catalogpages/Obsolete/2017/TEL1325LV2-BU.pdf.
- [3] C. Chen and A. Ross. A multi-task convolutional neural network for joint iris detection and presentation attack detection. Winter Applications of Computer Vision Workshops (WACV-W), pages 44–51, 2018.
- [4] R. Chen, X. Lin, and T. Ding. Liveness detection for iris recognition using multispectral images. Pattern Recognition Letters (PRL), 33(12):1513–1519, 2012.
- [5] J. Connell, N. Ratha, J. Gentile, and R. Bolle. Fake iris detection using structured light. International Conference on Acoustics, Speech and Signal Processing (ICASSP), pages 8692–8696, 2013.
- [6] A. Czajka and B. Becker. Application of Dynamic Features of the Pupil for Iris Presentation Attack Detection, pages 151–168. Springer International Publishing, 2019.
- [7] A. Czajka and K. W. Bowyer. Presentation attack detection for iris recognition: An assessment of the state of the art. ACM Computing Surveys, 1(1):1–35, 2018.
- [8] P. Das, J. McGrath, A. B. Z. Fang, G. Jang, A. Mohammadi, S. Purnapatra, D. Yambay, S. Marcel, M. Trokielewicz, P. Maciejewicz, K. Bowyer, A. Czajka, S. Schuckers, J. Tapia, S. Gonzalez, M. Fang, N. Damer, F. Boutros, A. Kuijper, R. Sharma, C. Chen, and A. Ross. Iris Liveness Detection Competition (LivDet-Iris) – The 2020 Edition. International Joint Conference on Biometrics (IJCB), 2020.
- [9] D. Gragnaniello, C. Sansone, and L. Verdoliva. Iris liveness detection for mobile devices based on local descriptors. Pattern Recognition Letters (PRL), 57:81–87, 2015.
- [10] K. He, X. Zhang, S. Ren, and J. Sun. Deep residual learning for image recognition. Conference on Computer Vision and Pattern Recognition (CVPR), pages 770–778, 2016.
- [11] S. Hoffman, R. Sharma, and A. Ross. Iris + ocular: Generalized iris presentation attack detection using multiple convolutional neural networks. International Conference on Biometrics (ICB), 2019.
- [12] S.-H. Hsieh, Y. Li, W. Wang, and C.-H. Tien. A novel anti-spoofing solution for iris recognition toward cosmetic contact lens attack using spectral ICA analysis. Sensors, 18:795–810, 2018.
- [13] D. Huang, E. A. Swanson, C. P. Lin, J. S. Schuman, W. G. Stinson, W. Chang, M. R. Hee, T. Flotte, K. Gregory, C. A. Puliafito, and et al. Optical coherence tomography. Science, 254:1178–1181, 1991.
- [14] G. Huang, Z. Liu, L. v. d. Maaten, and K. Q. Weinberger. Densely connected convolutional networks. Conference on Computer Vision and Pattern Recognition (CVPR), pages 2261–2269, 2017.
- [15] K. Hughes and K. W. Bowyer. Detection of contact-lens-based iris biometric spoofs using stereo imaging. Hawaii International Conference on System Sciences (HICSS), pages 1763–1772, 2013.
- [16] M. Kanematsu, H. Takano, and K. Nakamura. Highly reliable liveness detection method for iris recognition. SICE Annual Conference, pages 361–364, 2007.
- [17] O. Komogortsev and A. Karpov. Liveness detection via oculomotor plant characteristics: Attack of mechanical replicas. International Conference on Biometrics (ICB), pages 1–8, 2013.
- [18] S. J. Lee, K. R. Park, and J. Kim. Robust fake iris detection based on variation of the reflectance ratio between the iris and the sclera. Biometrics Symposium: Special Session on Research at the Biometric Consortium Conference, pages 1–6, 2006.
- [19] D. Menotti, G. Chiachia, A. da Silva Pinto, W. R. Schwartz, H. Pedrini, A. X. Falcao, and A. Rocha. Deep representations for iris, face, and fingerprint spoofing detection. Transactions on Information Forensics and Security (TIFS), 10:864–879, 2015.
- [20] Y. Moolla, L. Darlow, A. Sharma, A. Singh, and J. V. D. Merwe. Optical coherence tomography for fingerprint presentation attack detection. Handbook of Biometric Anti-Spoofing, pages 49–70, 2019.
- [21] J. H. Park and M.-G. Kang. Multispectral iris authentication system against counterfeit attack using gradient-based image fusion. Optical Engineering, 46(11):1–14, 2007.
- [22] R. Raghavendra and C. Busch. Robust scheme for iris presentation attack detection using multiscale binarized statistical image features. Transactions on Information Forensics and Security (TIFS), 10:703–715, 2015.
- [23] K. B. Raja, R. Raghavendra, and C. Busch. Video presentation attack detection in visible spectrum iris recognition using magnified phase information. Transactions on Information Forensics and Security (TIFS), 10(10):2048–2056, 2015.
- [24] R. Ramachandra and C. Busch. Presentation attack detection on visible spectrum iris recognition by exploring inherent characteristics of light field camera. International Joint Conference on Biometrics (IJCB), 2014.
- [25] A. Ross, S. Banerjee, C. Chen, A. Chowdhury, V. Mirjalili, R. Sharma, T. Swearingen, and S. Yadav. Some research problems in biometrics: The future beckons. International Conference on Biometrics (ICB), 2019.
- [26] R. R. Selvaraju, M. Cogswell, A. Das, R. Vedantam, D. Parikh, and D. Batra. Grad-CAM: Visual explanations from deep networks via gradient-based localization. International Conference on Computer Vision (ICCV), pages 618–626, 2017.
- [27] A. F. Sequeira, S. Thavalengal, J. Ferryman, P. Corcoran, and J. S. Cardoso. A realistic evaluation of iris presentation attack detection. Conference on Telecommunications and Signal Processing (TSP), pages 660–664, 2016.
- [28] R. Sharma and A. Ross. D-NetPAD: An explainable and interpretable iris presentation attack detector. International Joint Conference on Biometrics (IJCB), 2020.
- [29] K. Simonyan and A. Zisserman. Very deep convolutional networks for large-scale image recognition. International Conference on Learning Representations (ICLR), 2015.
- [30] G. Song, K. K. Chu, S. Kim, M. Crose, B. Cox, E. T. Jelly, N. Ulrich, and A. Wax. First clinical application of low-cost OCT. Translational vision science and technology (TVST), 8(3):61, 2019.
- [31] S. Thavalengal, T. Nedelcu, P. Bigioi, and P. Corcoran. Iris liveness detection for next generation smartphones. Transactions on Consumer Electronics (TCE), 62:95–102, 2016.
- [32] L. van der Maaten and G. Hinton. Visualizing high-dimensional data using t-sne. Journal of Machine Learning Research (JMLR), pages 2579–2605, 2008.
- [33] R. Vyas, T. Kanumuri, and G. Sheoran. Cross spectral iris recognition for surveillance based applications. Multimedia Tools and Applications (MTA), 78(5):5681–5699, 2019.
- [34] D. Yambay, B. Becker, N. Kohli, D. Yadav, A. Czajka, K. W. Bowyer, S. Schuckers, R. Singh, M. Vatsa, A. Noore, D. Gragnaniello, C. Sansone, L. Verdoliva, L. He, Y. Ru, H. Li, N. Liu, Z. Sun, and T. Tan. LivDet iris 2017 — iris liveness detection competition 2017. International Joint Conference on Biometrics (IJCB), pages 733–741, 2017.
- [35] H. Zhang, Z. Sun, T. Tan, and J. Wang. Learning hierarchical visual codebook for iris liveness detection. International Joint Conference on Biometrics (IJCB), pages 1–8, 2015.