Establishing Earth’s minimoon population through characterization of asteroid 2020 CD3
Abstract
We report on our detailed characterisation of Earth’s second known temporary natural satellite, or minimoon, asteroid 2020 CD3. An artificial origin can be ruled out based on its area-to-mass ratio and broad-band photometry, which suggest that it is a silicate asteroid belonging to the S or V complex in asteroid taxonomy. The discovery of 2020 CD3 allows for the first time a comparison between known minimoons and theoretical models of their expected physical and dynamical properties. The estimated diameter of meters and geocentric capture approximately a decade after the first known minimoon, 2006 RH120, are in agreement with theoretical predictions. The capture duration of 2020 CD3 of at least 2.7 years is unexpectedly long compared to the simulation average, but it is in agreement with simulated minimoons that have close lunar encounters, providing additional support for the orbital models. 2020 CD3’s atypical rotation period, significantly longer than theoretical predictions, suggests that our understanding of meter-scale asteroids needs revision. More discoveries and a detailed characterisation of the population can be expected with the forthcoming Vera C. Rubin Observatory Legacy Survey of Space and Time (LSST).
1 Introduction
Asteroids and comets can be temporarily captured by planets as natural satellites. Theoretical models (Granvik et al., 2012; Fedorets et al., 2017) predict that the Earth is also surrounded by a cloud of such temporarily captured asteroids, colloquially called minimoons. The largest minimoon captured at any given time is one meter in diameter, while larger bodies are captured less frequently.
Minimoons possess a number of attributes which make them objects of particular interest. As they spend an extended amount of time in the vicinity of the Earth, they can provide several windows of opportunity to obtain observations of the little studied population of meter-class asteroids. The systematic discovery and population statistics of meter to decameter-class minimoons, a sub-population of the near-Earth objects (NEO), could resolve existing disagreements between extrapolations of different NEO size-frequency distribution models to this size range – i.e. those based, on telescopic observations (e.g., Rabinowitz et al., 2000; Harris & D’Abramo, 2015; Granvik et al., 2016; Tricarico, 2017) and those based on on bolide data (Brown et al., 2002, 2013). Also, due to their relatively long capture duration, accessibility, and small size, minimoons are viable targets for taking the first practical steps in the emerging field of asteroid in situ resource utilisation (Granvik et al., 2013; Jedicke et al., 2018a). So far, the primary obstacle for organizing their study has been a lack of observational evidence supporting the existence of a minimoon population to the extent predicted by the models.
Until 2020, only one minimoon (2006 RH120; Bressi et al., 2008; Kwiatkowski et al., 2009) had been discovered. The second known minimoon, 2020 CD3, was discovered on 2020 February 15.51 UT by the Catalina Sky Survey (CSS; Christensen et al., 2018) 1.5 m telescope on Mt. Lemmon (Minor Planet Center, 2020). One day later, an alert automatically sent out by the NASA Jet Propulsion Laboratory’s Scout system (Farnocchia et al., 2015a, 2016) announced that it was likely temporarily captured in the Earth-Moon system. Discovering an object on a geocentric orbit always raises suspicion of an artificial origin, but during the 2.5 weeks following its discovery 2020 CD3 could not be linked to any known artificial object nor could a natural origin be ruled out. On 2020 February 26 the Minor Planet Center (MPC) therefore added 2020 CD3 to the catalogue of asteroids as a temporarily-captured object with a request for further follow-up observations to establish its nature (Minor Planet Center, 2020).
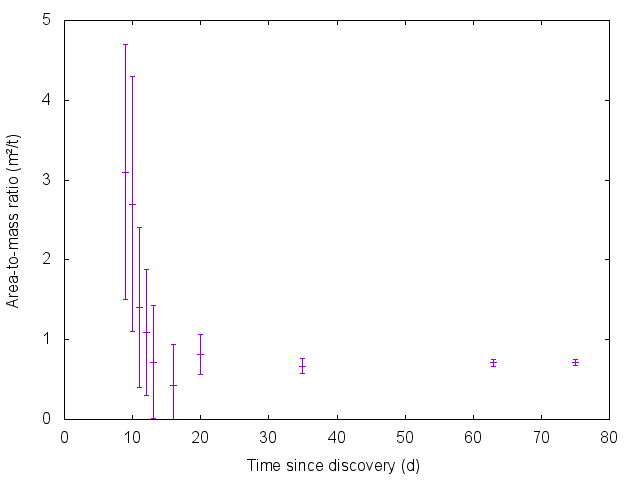
The nominal solution for the area-to-mass ratio of 2020 CD3 — calculated from the solar radiation pressure signature on the orbital solution, and a diagnostic quantity for distinguishing between natural and artificial objects (Jedicke et al., 2018a) — decreased during the two weeks after discovery (Fig. 1), indicating that it might be a natural object. To characterize the potential minimoon, we obtained high-precision astrometric follow-up observations in February-May 2020 with the Nordic Optical Telescope (NOT), Canada-France-Hawai’i Telescope (CFHT), Lowell Discovery Telescope (LDT), University of Hawai’i 2.2 m telescope (UH2.2) and the Calar Alto Schmidt telescope; broad-band photometric observations from Gemini North; and rotational lightcurve observations with LDT. In addition, a search for pre-discovery detections with the Pan-STARRS surveys (Chambers et al., 2016), Zwicky Transient Facility (Bellm et al., 2019; Masci et al., 2019), Catalina Sky Survey (Christensen et al., 2018), and Chinese Near-Earth Object Survey Telescope (Zhao et al., 2007) was performed.
In this work, we provide a detailed characterization of the physical properties and orbital evolution of 2020 CD3. We also discuss its detectability and assess the possibility of its lunar origin. We describe the observations and precovery attempts in detail in Sect. 2; outline the data reduction and methods for physical characterization and orbit computation in Sect. 3; present the results and discuss the implications in Sect. 4; and offer our conclusions in Sect. 5.
2 Data acquisition
2.1 Instruments and observations
An overview of all instruments used in this analysis is provided in Appendix Table LABEL:tab:telescope. 2020 CD3 was discovered on 2020 February 15.51 UT by the Catalina Sky Survey (CSS; Christensen et al., 2018) 1.5 m telescope on Mt. Lemmon (MPC observatory code G96). Upon discovery, the object was favorably placed near the ecliptic plane 45∘ east of opposition. The discovery image sequence consisted of four 30 s exposures, with minutes separation between each successive image, that were inspected soon after the final image by two observers and submitted to the MPC as a new NEO candidate. After the object was placed on the MPC’s NEO Confirmation Page, additional same-night follow-up observations were performed with the same telescope that was used to discover 2020 CD3.
Multiple broadband photometric imaging was performed on 2020 February 24 with the 8.1 m Frederick C. Gillett Gemini North Telescope located on Maunakea, Hawai‘i, USA. The Gemini Multi-Object Spectrograph (GMOS; Hook et al., 2004) observations consisted of three sequences with the G0301, G0303, and G0302 filters, taken in photometric conditions with Image Quality 85 (1.05′′ full zenith corrected seeing) or better seeing. The telescope was tracked non-sidereally at 2020 CD3’s rate of motion, thereby maintaining its stellar point spread function (PSF) for photometry but elongating the reference field stars. We also obtained sidereally tracked images in the three filters immediately before and after the non-sidereal tracking of 2020 CD3 in order to perform absolute photometry.
To obtain 2020 CD3’s photometric lightcurve we employed the Large Monolithic Imager (LMI) on the 4.3 m Lowell Discovery Telescope (LDT, G37) for approximately 1 hour on 2020 February 27 UTC. Exposures were taken with 30 s integrations using a broad band filter that provides high throughput between approximately 500 and 700 nm. LMI was binned for an effective plate scale of 0.36"/pixel and the telescope was tracked at the non-sidereal rates of the target. On several later occasions we used LDT/LMI to obtain astrometry with a similar technique but without any filters.
The 3.6 m Canada France Hawaii Telescope (CFHT, 568) on Maunakea, Hawai‘i, USA, was used to obtain astrometry using non-sidereal tracking with exposures of up to 120 s in gri-band MegaCam images with no pixel binning. MegaCam has pixels allowing for precise astrometric measurements under good seeing conditions.
Astrometric observations were also made with the Alhambra Faint Object Spectrograph and Camera (ALFOSC) at the 2.5 m Nordic Optical Telescope (NOT, Z23) at the Roque de los Muchachos Observatory, La Palma, Canary islands, Spain. The exposures were tracked non-sidereally on 2020 CD3. Each image’s exposure time was set equal to the time it would take for 2020 CD3 to move at most one stellar FWHM on the sky. Most of the 2020 CD3 detections had but the last observations reached only as the target reached the detection threshold. The observations were performed without any filters with pixel binning.
The University of Hawaii 2.2 m (UH2.2, 568) telescope was used for astrometric observations with non-sidereal tracking at 2020 CD3’s apparent rates of motion in unfiltered 300 s exposures. Additional astrometric observations were extracted from dedicated early observations obtained with the Calar Alto Schmidt telescope (Z84) in Spain. The detections were obtained from a set of short sidereally tracked frames, stacked with respect to the known motion of the object.
2.2 Search for pre-discovery detections
The image archives for several survey telescopes were searched for pre-discovery observations of 2020 CD3 by generating an ephemeris for each exposure and visually examining any potential matches. The 1.8 m Pan-STARRS1 telescope (F51) has an extensive archive dating back to 2010 (Chambers et al., 2016) and is sensitive to but no detections were found. The Zwicky Transient Facility (ZTF, I41) is an ongoing wide-field optical survey using the 1.2 m Palomar Oschin Schmidt telescope and has been in operation since 2018 (Bellm et al., 2019; Graham et al., 2019; Masci et al., 2019). No detections were found in its Data Release 3 (DR3) archive that extends from March 2018 to the end of December 2019.
The Chinese NEO Survey Telescope (CNEOST, D29; Zhao et al., 2007) is a 1.0 m Schmidt telescope at Xuyi, Jiangsu, China, equipped with a camera. We searched images taken between January 2018 and May 2019 (when the telescope went offline for hardware upgrades) but did not find any matching fields. Lastly, we checked all the telescopes used by the Catalina Sky Survey for pre-discovery opportunities and found only two suitable fields imaged by the Mt. Lemmon telescope (G96) on 2019 November 9 and 2019 January 24, close to times when the object was expected to be at perigee and therefore relatively bright. Significant trailing losses, the spreading of the light from the target over many pixels due to its motion during an exposure, combined with non-optimal sky conditions, prevented a detection in both images. In summary, the signals in the possible images were mostly smeared by trailing losses, and no detections were found from any of the mentioned surveys.
3 Data reduction and calculations
3.1 Astrometric data reduction
Due to the different observing strategies and capabilities of each instrument/telescope combination, each image set was astrometrically analyzed with different techniques. In some cases, a direct measurement on individual frames was possible by fitting 2020 CD3’s detection to a stellar PSF or trail. In other cases, especially later in the apparition, we stacked multiple frames at 2020 CD3’s (often rapidly changing) rates of motion to achieve sufficient SNR for a measurable detection. We carefully estimated our formal astrometric uncertainty taking into account contributions from the object’s SNR (often dominant), but also from the astrometric solution, now typically negligible thanks to the Gaia DR2 catalogue (Gaia Collaboration et al., 2016, 2018; Lindegren et al., 2018), to which all the astrometry was calibrated. For all instruments used in the analysis, an assessment of the timing accuracy was also included. In most cases, a conservative timing uncertainty of one second was assumed. When timing biases were suspected, we only included the cross-track component of the astrometric position in the astrometric fit, and deweighted the along-track direction. All acquired and remeasured astrometry is provided in Appendix Table LABEL:tab:astrometry.
The peculiarities of 2020 CD3’s outgoing trajectory and, in particular, its low relative velocity with respect to Earth, kept the object at small geocentric distances for many weeks after discovery. As a result, most of the astrometric coverage was obtained when topocentric parallax was significant, and it is essential to know the precise and accurate location of the observing telescope, ideally to within a few meters in the Gaia catalog era. We therefore dedicated significant effort to obtain accurate coordinates and/or codes for all the telescopes we used to extract observations of 2020 CD3.
3.2 Photometric data reduction
The raw GMOS-N data frames were reduced using standard techniques with the Gemini DRAGONS Python package (Data Reduction for Astronomy from Gemini Observatory North and South, AURA Gemini Observatory-Science User Support Department, 2018). Nightly bias frames and twilight flats from the several nights surrounding the observations were used to create the master bias and flat-fields. The DAOPHOT software package (Stetson, 1987), embedded in the Image Reduction and Analysis Facility (IRAF, Tody, 1986, 1993), was used to perform aperture photometry for all the GMOS images. The photometry was calibrated to the Sloan Digital Sky Survey (SDSS) photometric system (, and , Fukugita et al., 1996) with the SDSS Data Release catalog 12 (Alam et al., 2015), accessed through the SkyServer platform. The resulting individual measurements and errors of GMOS photometry is provided in Appendix Table LABEL:tab:photometry. The resulting magnitudes in each filter are mean values of individual measurements with respective filters. That way we diminish the effect of the brightness variations induced by the rotation of the asteroid.
The set of images obtained with LDT/LMI for the lightcurve were reduced using standard bias subtraction and flat field correction from facility dome flats. 2020 CD3’s photometry was measured using the Photometry Pipeline (Mommert, 2017). This pipeline extracted sources with SourceExtractor using a 3 pixel (1.08") aperture (Bertin & Arnouts, 1996), astrometrically registered the images based on the Gaia DR2 catalog (Gaia Collaboration et al., 2018), and then determined the zero point calibration for each image by referencing to approximately 50 field stars from the Pan-STARRS DR1 catalog (Flewelling et al., 2016). The photometric calibration was performed by tying the -images to the Pan-STARRS1 band. This technique introduces errors in the absolute photometric calibration as the bands are not identical but they are significantly smaller than the typical uncertainty ( magnitude) on the individual measurements. All data points for the lightcurve are provided in Appendix Table LABEL:tab:lightcurve.
3.3 Calculations of area-to-mass ratio, albedo, density and phasecurve
The astrometric data shows that the motion of 2020 CD3 is significantly affected by solar radiation pressure. Establishing its signature with a detection in about three weeks is times faster than similar analyses in the past. The evolution of the development of the radiation pressure as a function of time is presented in Fig. 1. This improvement is due to the enhanced precision and accuracy of the astrometry enabled by the Gaia DR2 catalogue (Gaia Collaboration et al., 2018; Lindegren et al., 2018) which permits measuring individual ground-based positions with 0.05′′ accuracy.
In what follows, we interpret the non-gravitational acceleration as a result of Solar radiation pressure. Following Farnocchia et al. (2015b), we modelled solar radiation pressure perturbation as a purely radial acceleration , where is the heliocentric distance. The off-radial components, and , of the Marsden non-gravitational force model (Marsden, 1969; Marsden et al., 1973) do not play a significant role in the albedo-density modelling, unlike for the orbital evolution. The parameter is proportional to the area-to-mass ratio and therefore can provide useful constraints on the physical properties of the object and discern between a natural and artificial origin. For a spherical object,
| (1) |
where is the Bond albedo, is the solar constant, is the speed of light, the effective diameter, and the density (Vokrouhlický & Milani, 2000; Mommert et al., 2014a). We note that this formulation does not take into account the Yarkovsky effect (cf. Vokrouhlický, 1998), which could contribute to 10-20% of the total radial non-gravitational acceleration (e.g., Chesley et al., 2014). Therefore, our calculation is an upper bound estimate of .
The effective diameter , absolute magnitude , and geometric albedo are related by (Pravec & Harris, 2007):
while the Bond albedo is the product of the geometric albedo and the phase integral ,
where we have expressed the phase integral in terms of the , and photometric parameters (Muinonen et al., 2010).
3.4 Orbit computation
We used a Monte Carlo approach to analyze 2020 CD3’s past trajectory. We generated 1000 synthetic sets of orbital elements and area-to-mass ratios by sampling the uncertainty region as calculated from the fit to the astrometry. We modelled the solar radiation perturbation using all three coefficients () of the Marsden non-gravitational model (Marsden, 1969; Marsden et al., 1973). Given the size of 2020 CD3 and its unknown shape, unlike for the calculation of the area-to-mass ratio, for orbit computation the off-radial components of the solar radiation pressure signature are significant on the timescale of the capture duration. We integrated each synthetic object backwards from 2020 until the object had been captured into the Earth-Moon system. The date of the first perigee within 1 lunar distance (LD) after the insertion into the Earth-Moon system is used as a proxy for the capture date.
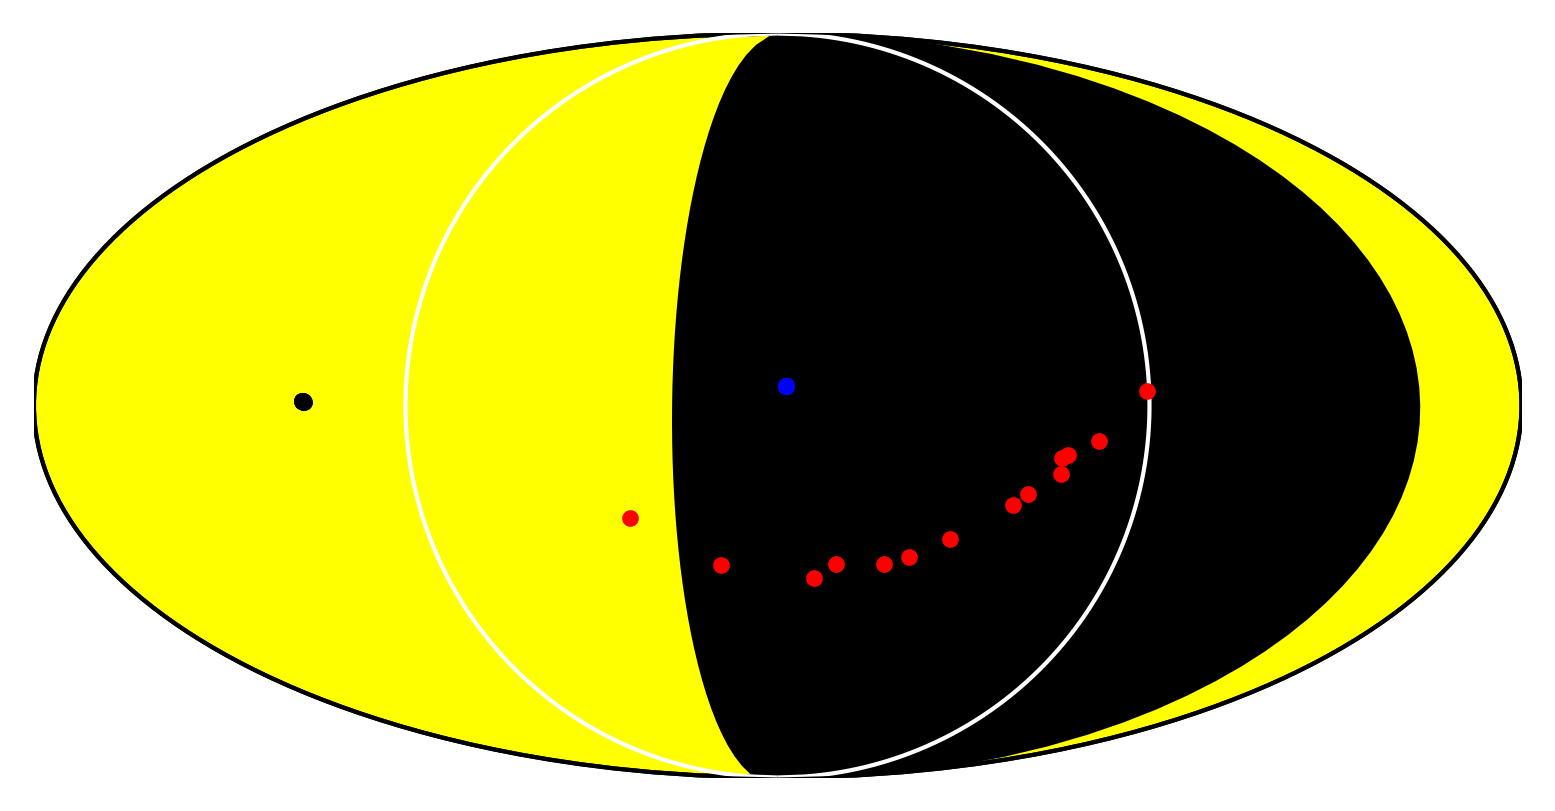
Several synthetic objects’s orbits were consistent with a lunar origin and their distribution at launch from the Moon’s surface is provided in Appendix Fig. 6 assuming that the Moon is a sphere of radius 1737 km. In order to trace the possible origin of 2020 CD3 from the Moon, we mapped the outbound trajectories of the samples originating from the Moon on the Lunar surface. We computed the state vectors of the samples when leaving the Moon’s surface and transformed them into the Lunar mean Earth/polar axis body-fixed frame (Seidelmann et al., 2002) using NASA’s Navigation and Ancillary Information Facility (NAIF) SPICE tools (Acton, 1996; Acton et al., 2018).
4 Results and discussion
4.1 Physical characterisation
We used astrometric observations obtained during the apparition to clearly detect solar radiation pressure acting on 2020 CD3 and measure its area-to-mass ratio, m2 kg-1. This value implies a natural origin for 2020 CD3 because it is consistent with for other natural objects in the same size range (Micheli et al., 2012, 2013, 2014; Mommert et al., 2014a, b; Farnocchia et al., 2017) and much lower than typical for artificial objects (Jenniskens et al., 2016).
The derived photometric colors (, ) support 2020 CD3’s natural origin as we do not detect extreme reddening which is associated with artificial objects (Miles, 2011). Our broadband photometry suggests that 2020 CD3 belongs to the group of silicate asteroids (Fig. 2a), i.e., to the S or V complexes in the asteroid taxonomy (DeMeo & Carry, 2013). Based on physical characterization alone, we cannot exclude that 2020 CD3 is lunar ejecta, as lunar colors are similar to those of V-type asteroids. The C- and X-complexes, however, can be ruled out.
We also extracted low-precision Gaia -band photometry (Jordi et al., 2010) from our astrometric observations to derive the photometric phase curve and used it in an independent approach to constrain the spectral classification. The observations of 2020 CD3 are limited to phase angles so that the backscattering region is not covered at all. The poor phase curve coverage does not allow for the photometric data to be fit with the standard system in linear brightness space (Muinonen et al., 2010). Instead, we resort to the alternative technique of fitting for in nonlinear magnitude space (Penttilä et al., 2016) where is forced to stay non-negative and, thus, physically meaningful. The nominal solution, after converting to and band to band assuming , is (Fig. 2b). We note that the formal uncertainty estimate for is meaningless because its nominal value is a result of forcing it to be non-negative and the above uncertainty estimates have been obtained by bootstrapping.
Assuming characteristic slope parameters for different asteroid taxonomic types (Shevchenko et al., 2016) and fitting only for we find better fits when using slope parameters typical for E, S and M types than for P, C, and D types (Fig. 2b and Appendix Table 5). Fixing the slope parameters and fitting only for results in lower values for the Bayesian Information Criterion than fitting for both and suggesting that the amount of data is not necessarily sufficient for a meaningful fit let alone a full fit. The fit is also consistent with slope parameters typical for asteroid (4) Vesta (Gehrels, 1967; Shevchenko et al., 2016), the most prominent member of V-type asteroids. These results are in excellent agreement with the photometric colors.
In an alternative, synoptic, approach when fitting the radial component to photometry, the fit to the photometric phase curve results in an absolute magnitude for 2020 CD3. The value is consistent with the purely photometric fit, but the error estimates are more conservative. Assuming the distribution of possible values of the geometric albedo ( for S-types, and for V-types, Mainzer et al., 2012) and the phase curve fit for the magnitude for S- or V-class asteroids, we obtain a diameter of m, one of the ten smallest NEOs ever found as of 2020 August 10, and amongst the best characterized with colors, rotation period, and AMR. The derived size is consistent with the non-detection of 2020 CD3 by the Arecibo radar assuming a non-metallic material composition, excluding an artificial body or an M-type asteroid (Patrick Taylor, personal communication).
Thus, all our evidence suggests that 2020 CD3 is of spectral type S or V. Although little is known of the color distribution of meter-class asteroids, our result is consistent with the observed taxonomic distribution of NEOs with diameters <200 meters where S-class objects dominate (Binzel et al., 2019). Furthermore, it is consistent with extrapolations of the asteroid taxonomic and orbital element distribution to small NEOs on Earth-like orbits, the minimoon source population, which suggest that for , corresponding to S-type asteroids m diameter, S-types make up about 40% of the population (Jedicke et al., 2018b).
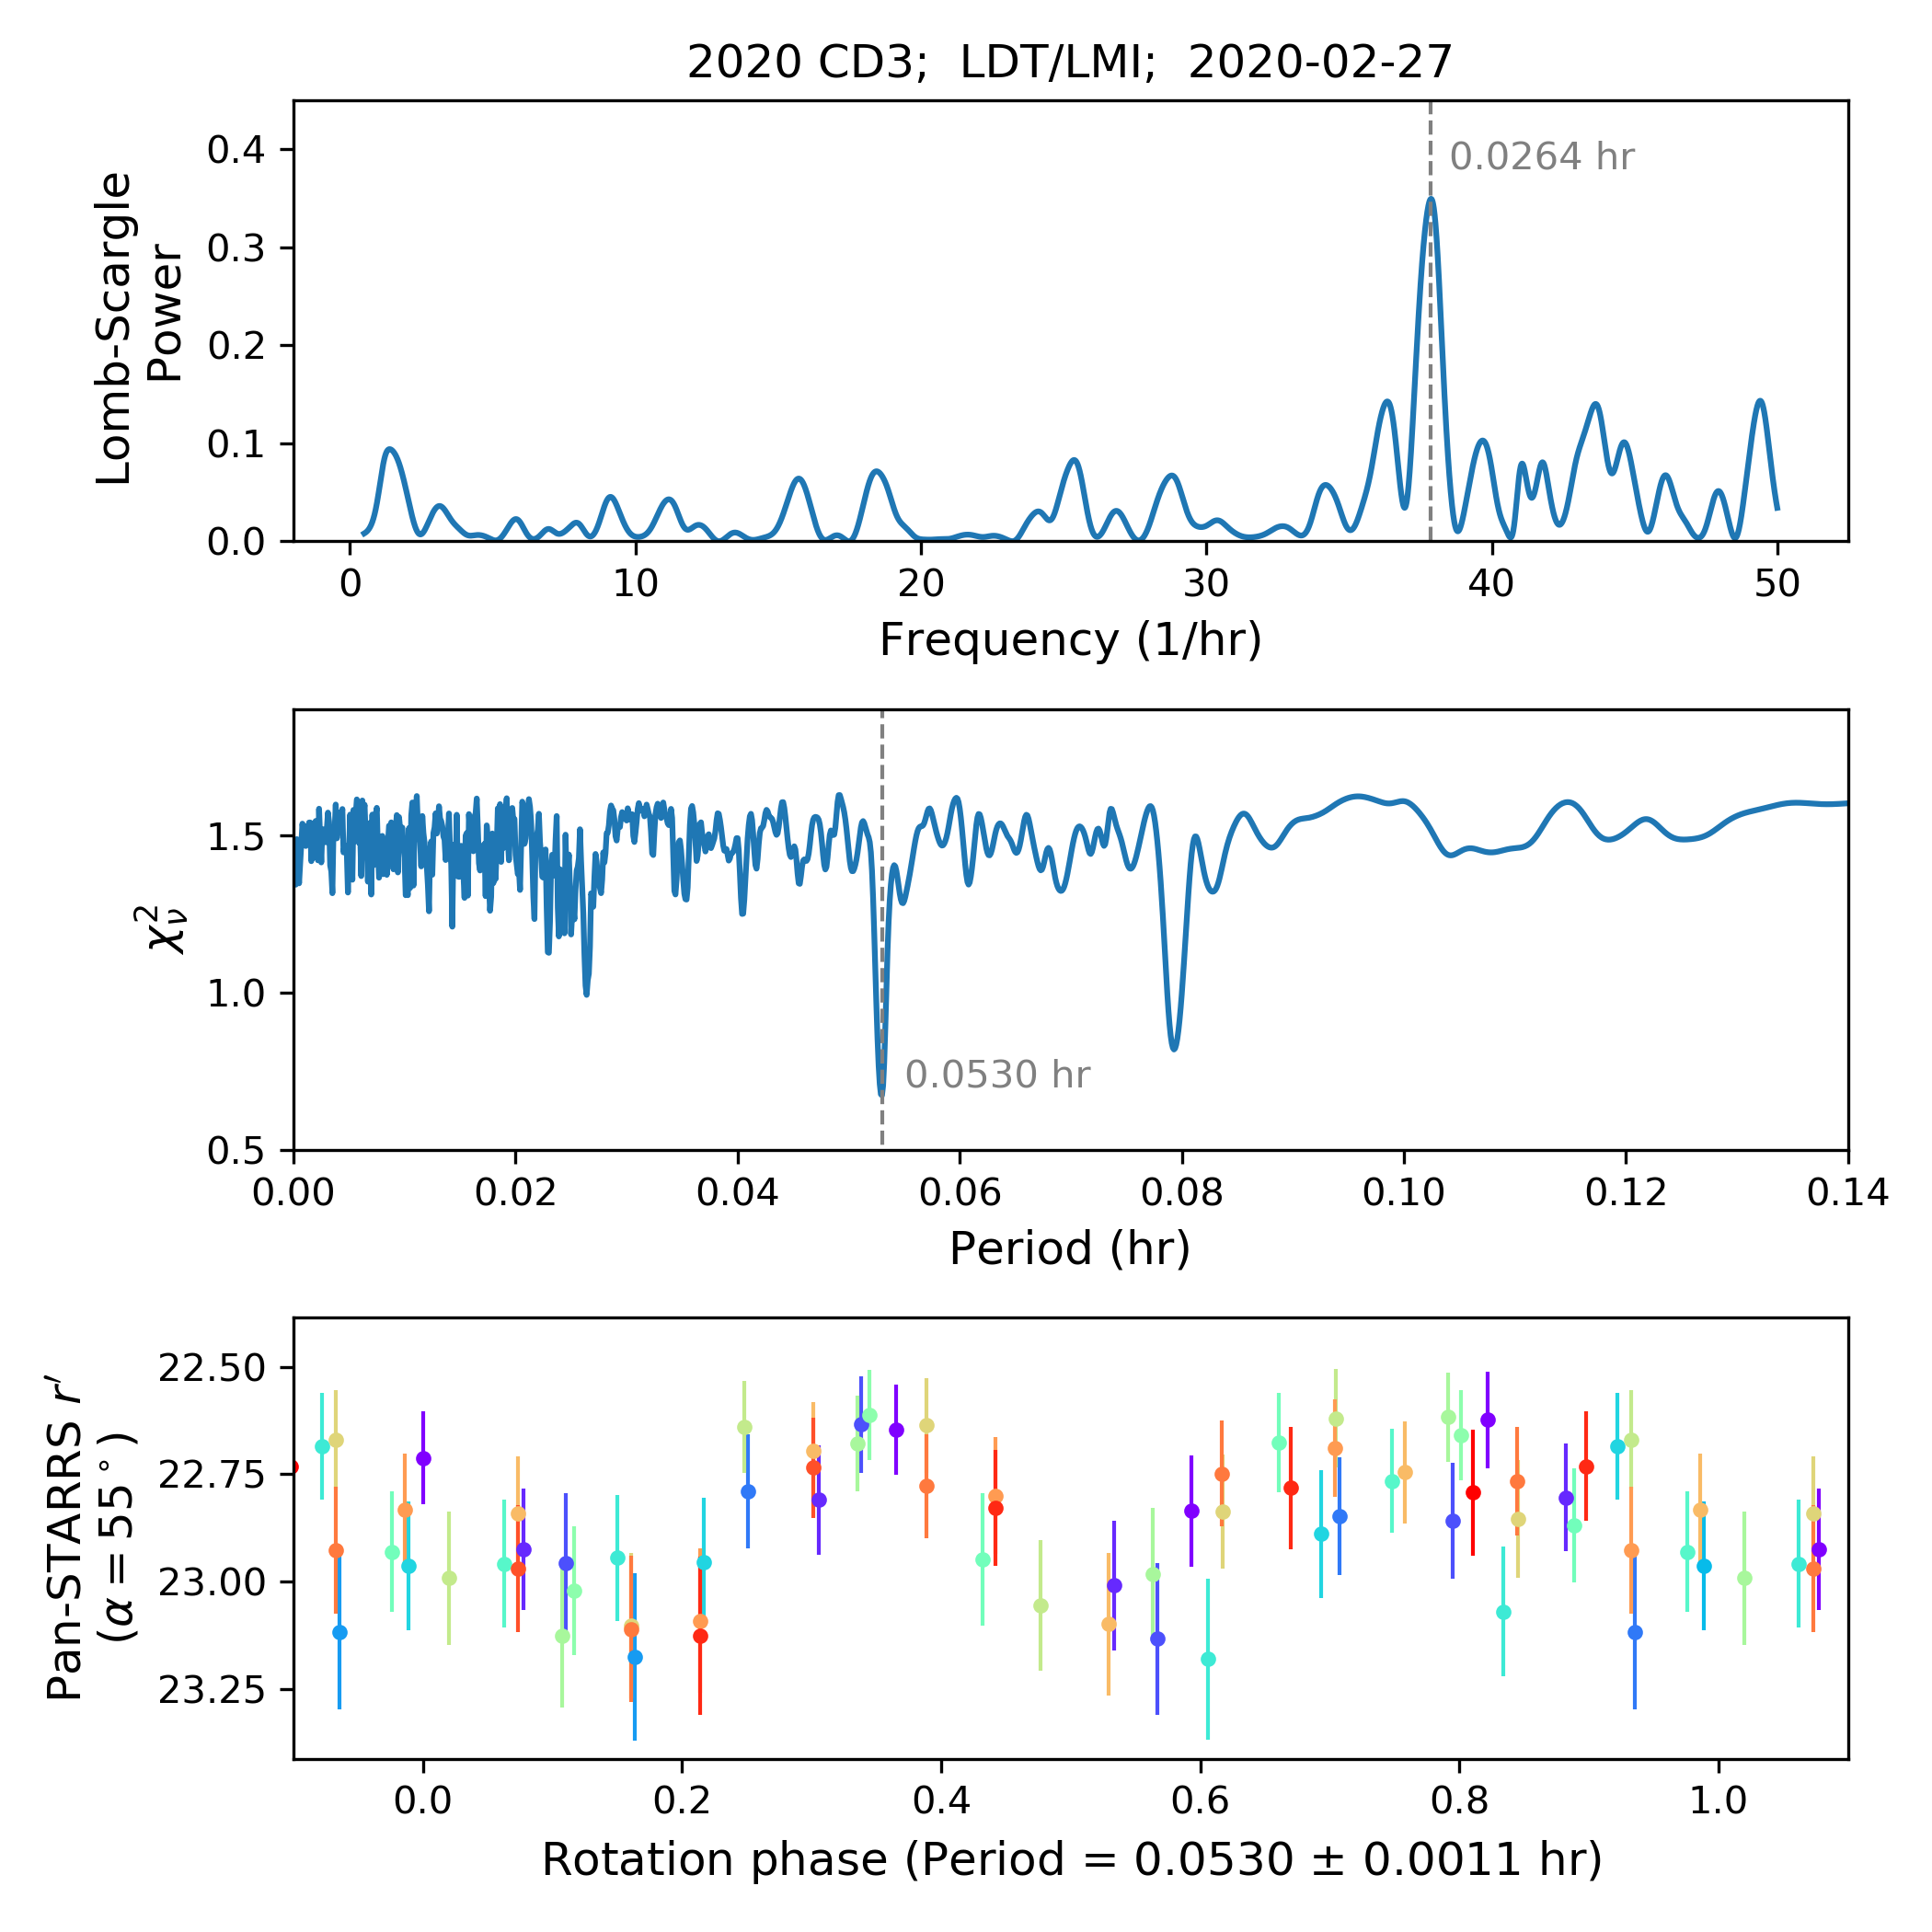
The lightcurve of 2020 CD3, despite its relatively low signal-to-noise ratio, shows a strong peak at 0.026 h in a Lomb-Scargle periodogram and a clear minimum in residuals from Fourier fits to the data at a period = 0.0530 h (Fig. 3). These reduced residuals (normalized by the degrees of freedom) were computed for 3rd order Fourier fits across a range of periods from 0.0001 to 2 h at a step size of 0.0001 h. Second and fourth order Fourier series produced overall higher values. An approximate 1-sigma error on the period of 0.0011 h was estimated as the full width at half maximum of the deepest minimum in the plot. Phasing the data to periods at the limits of this uncertainty range resulted in clear decoherence of the periodic signal. The best-fit period h is consistent with the Lomb-Scargle periodogram. In particular, given the apparent magnitude peak-to-peak amplitude, the second-order harmonic ( h) is the most probable interpretation of the Lomb-Scargle peak for data obtained at a phase angle of (Butkiewicz-Bąk et al., 2017). We note that the best-fit rotational period is shorter than the individual integration times of the color photometry. Therefore, the brightness variation due to the rotation of 2020 CD3 is averaged out in individual photometric color measurements. Assuming a double-peaked lightcurve, a period of about 3.2 minutes ( s) is a reasonable interpretation, however due to the low signal-to-noise of these data, the period is not strongly constrained. Non-principal axis rotation cannot be ruled out with the available data. The observed rotational period is at least an order of magnitude slower than the predicted mean value from a Maxwellian rotational distribution for meter-sized objects (Bolin et al., 2014). This implies that radar may be better suited for the detection of minimoons than had been previously anticipated, because the radar signal is smeared less by asteroid rotation than suggested by extrapolations of size-rotation-rate models.
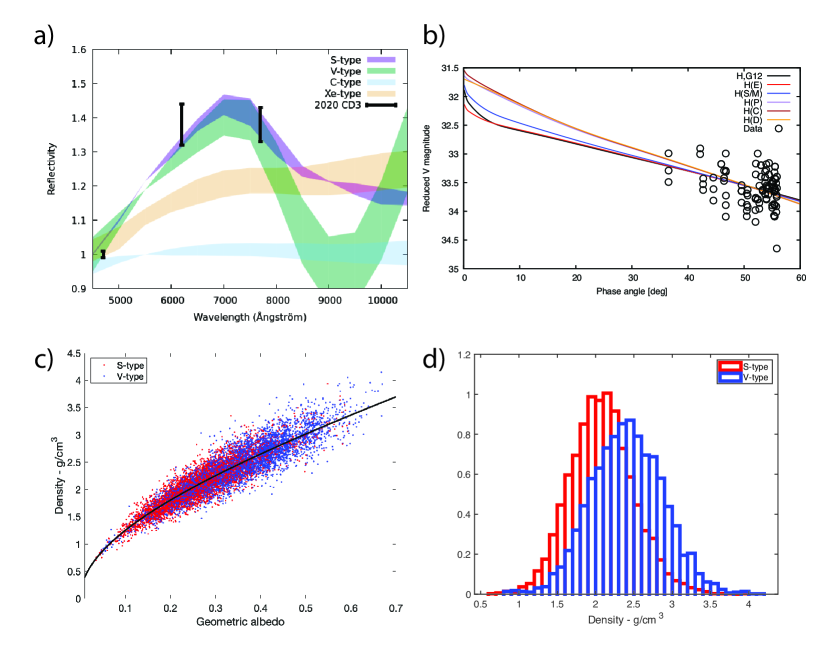
The two unknowns in Eq. 1 are the albedo and density but they are constrained by the other measured parameters. Given that our photometric model implies that 2020 CD3 is either an S or V type asteroid, we generated synthetic albedos for of each type according the type-specific albedo distributions of Mainzer et al. (2012). Similarly, we generated the same number of random values using a normal distribution with a mean and width given by the central value and uncertainty on our measured m s-2. The pairs of synthetic albedo- values were then used to calculate the object’s density (Fig. 2c-d). For the S-type assumption we find g cm-3 whereas for the V-type assumption g cm-3. In both cases, the inferred density is consistent with typical asteroid densities (Carry, 2012). We note that the possible effect of the Yarkovsky force can potentially increase the estimated density values by 10-20% (Chesley et al., 2014) so that our density estimates represent the lower bound of values. However, this does not have a major impact on the interpretation of the results.
Thus, our physical characterization of 2020 CD3 indicates that it is a silicate body, perhaps a free-floating analogue of what appear to be monolithic boulders found on the surface of larger asteroids such as (25143) Itokawa, the S-type asteroid investigated in-situ by the Hayabusa spacecraft (Saito et al., 2006). Alternatively, it could be a small rubble-pile aggregate more like the 2008 TC3 (e.g. Jenniskens et al., 2009). While the internal structure of meter-scale asteroids is currently unknown we expect that favourable appearances of small NEOs and future minimoons will provide more opportunities for detailed characterization of these small asteroids.
4.2 Orbital evolution
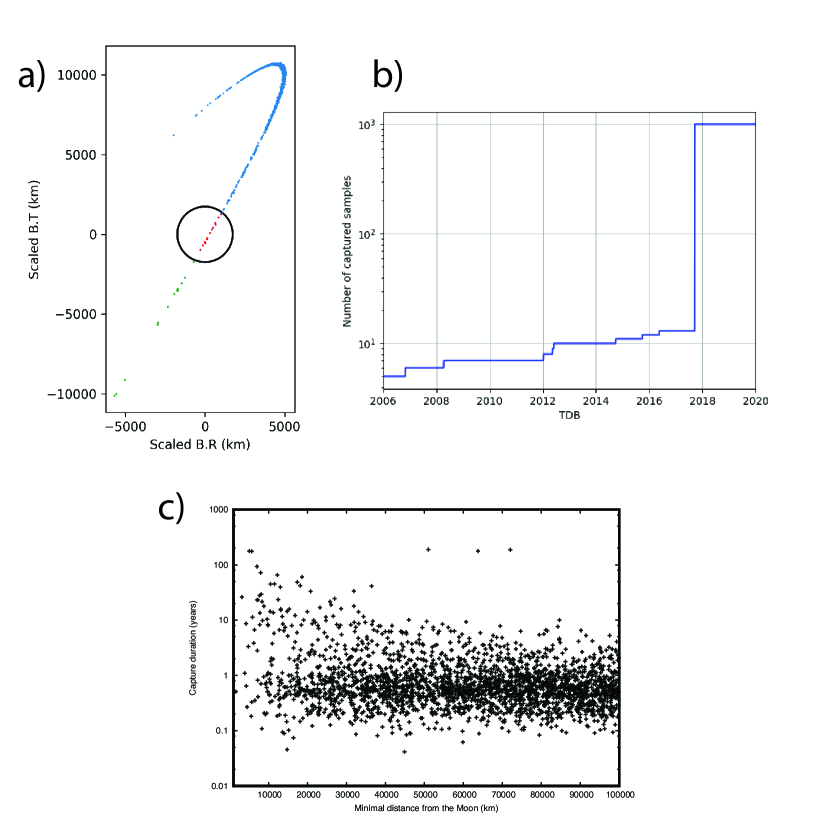
Integrating 2020 CD3’s trajectory into the past indicates that it was bound to the Earth and it’s orbit was deterministic after a close approach to the Moon on 2017 September 15 (Figure 4a). Prior to this encounter there are three possible behaviors: 1) escape the Earth-Moon system, corresponding to a scenario in which this encounter is responsible for the capture of 2020 CD3 by the Earth-Moon system; 2) intersect the Moon’s surface, which corresponds to the hypothesis that 2020 CD3 is lunar ejecta; 3) remain in Earth orbit (potentially for more than 10 years). Therefore, we conclude that 2020 CD3 was in orbit around Earth since at least 2017 September 15. Since then, it completed 11 orbits around the Earth with intervals between successive perigees of 70 to 90 days. Its minimum geocentric distance was between and km on 2019 April 4 and it escaped the Earth’s Hill sphere (0.01 au) on 2020 March 7 after a final perigee on 2020 February 13 at a geocentric distance of about km. Oddly, it passed its last perigee just two days before its discovery. 2020 CD3’s Earth-like orbit means it has a long synodic orbital period so it will not approach Earth again until March 2044 at about 10 lunar distances, well outside Earth’s Hill sphere.
The capture duration of 2020 CD3 of at least 2.7 years (Fig. 4b) may seem exceptionally long considering that orbital simulations suggest that the average capture duration of minimoons is about nine months (Fedorets et al., 2017). However, there is an inverse correlation between the average capture duration and the minimum lunacentric distance when the encounter distance is less than km (Fig. 4c). In such cases, minimoons may become captured for years or even decades. Although only % of minimoons have capture durations greater than three years those objects’ total capture duration time is 23% of the cumulative capture duration time of all simulated minimoons. Based on the close encounter of 2020 CD3 with the Moon, it is not surprising that 2020 CD3 undergoes a longer geocentric capture than an average minimoon. The distribution of possible capture durations of 2020 CD3 is thus in agreement with theoretical predictions (Fig. 4b).
We argue that a lunar origin for 2020 CD3 is highly unlikely (see Subsect. 4.3) and therefore assume that the object originated in the main asteroid belt. Based on its pre-capture heliocentric orbit it has a % probability of having been ejected by the secular resonance with, primarily, Saturn (Granvik et al., 2018). A provenance in the inner main belt would also favor its identification in the S-type taxonomy since S-types dominate that region of the belt. There is a % for it having originated in the Hungaria region and a negligible % probability that it was ejected from the outer region of the main belt by the 3:1 mean-motion resonance with Jupiter. The reported uncertainties on the probabilities are the standard error on the mean across several discrete cells in the Granvik et al. (2018) NEO population model. An inner belt source for 2020 CD3 is in agreement with a silicate-rich asteroid composition which is dominant in that region (DeMeo & Carry, 2014).
4.3 Exploring the lunar ejecta hypothesis
There is a possibility that 2020 CD3 could have been spall ejected by a recent lunar impact event (Subsect. 4.2) and we assess the likelihood of this scenario by examining the contemporary production rate of small craters on the Moon.
The largest crater to form annually on the Moon is approximately 50 m in diameter based on a survey of fresh impact craters identified on the Moon using "before" and "after" images from the Lunar Reconnaissance Orbiter (LRO) Narrow Angle Camera (NAC) (Speyerer et al., 2016). Accordingly, if 2020 CD3 was launched from the lunar surface on 2017 September 15 a crater of this scale would need to be capable of launching a meter-sized minimoon off the Moon and onto the trajectory described above.
An asteroid striking the Moon creates a crater approximately 20 times its own size (Melosh, 1989) so a 2.5 m diameter projectile can make a 50 m diameter crater. Hirase et al. (2004) investigated the relationship of ejecta velocity relative to the ejecta-to-impactor diameter ratio in laboratory experiments, an analysis of secondary craters produced by lunar and Martian craters, and ejecta from the asteroid (4) Vesta that make up the Vesta family (often called Vestoids). At an ejecta/impactor diameter ratio of , corresponding to the ejection of a 1 m diameter minimoon by a 2.5 m diameter projectile, the typical ejection speed are a few tens of m s-1 and certainly m s-1 — much smaller than lunar escape velocity ( m s-1). Indeed, the results of Hirase et al. (2004)’s analysis suggest that launching a 1 m diameter minimoon off the lunar surface requires the impact of a km-scale asteroid, an unlikely event that surely would have been noticed on or soon after 2017 September 15. Furthermore, the population of NEOs is % known at this time and no impacts were predicted on that date. Accordingly, we reject a lunar ejecta origin for 2020 CD3. In summary, while NEO-based models (Granvik et al., 2012; Fedorets et al., 2017) indicate that an annual capture of a meter-sized asteroid is likely, the production of similar-sized lunar ejecta at the same rate can be ruled out. Hence, minimoon capture from the NEO population is a dominating mechanism for maintaining the minimoon steady-state population.
An additional blow to the lunar origin hypothesis for 2020 CD3 comes from lunar meteorites that were blasted off the Moon in the past. Warren (1994), whose analysis builds on the work of Melosh (1985), argues that most lunar meteorites came from lunar craters that were hundreds of meters to several km in diameter and that the meteoroid precursor bodies to the meteorites were 2-10 cm in diameter prior to entering Earth’s atmosphere. Lunar meteorite cosmic ray exposure ages indicate that only about half took less than years to get to Earth (Warren, 1994). Given that minimoon orbital lifetimes are typically on the order of a year it implies that those meteoroids spent most of their time on heliocentric orbits before being delivered back to Earth, not in the Earth-Moon system. Taken together, it suggests that it is difficult for small craters to launch sizeable bodies off the Moon; if small impact events could do so, we might expect very young lunar meteorites to dominate the fall and find record on Earth.
We emphasize that the impact capable of producing an ejecta of the size of 2020 CD3 would have been very bright. Moreover, the distribution of the subset of sample orbits originating from the Moon point the majority of them to the part of the dark size of the Moon facing towards Earth, providing optimal observing conditions (Appendix Fig. 6). No major impacts have been reported, including the NELIOTA telescope (Xilouris et al., 2018), the NASA lunar impact monitoring (William Cooke, private communication). Moreover, no reports of a new km-sized craters on the Moon have been announced.
In summary, we consider the lunar origin of 2020 CD3 to be extremely unlikely.
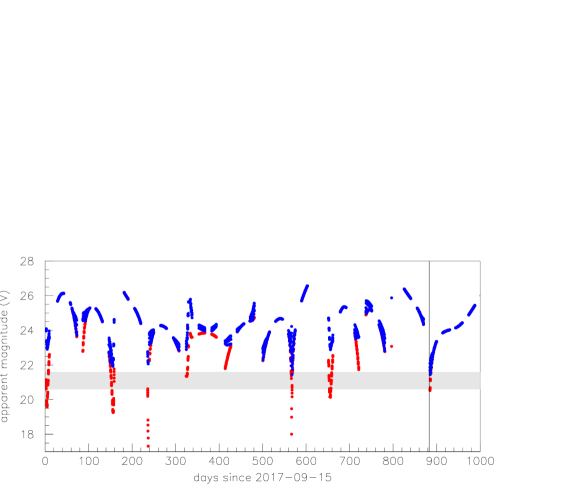
4.4 Detectability of 2020 CD3
The discovery of 2020 CD3 occurred at the last window of opportunity (Fig. 5). However, simulations by Fedorets et al. (2020), and the fact that 2006 RH120was discovered only three months into its captured time period of one year, suggest that the last-minute discovery of 2020 CD3 is not a typical situation. During the undisputed capture period of 2.7 years there were six distinct intervals during which 2020 CD3 was brighter than the discovery observatory’s (CSS’s Mt. Lemmon) limiting magnitude (Fig. 5). It even briefly reached when it approached to within about km, below the orbits of geosynchronous satellites. The problem is that during the detectability windows, when it was bright and close to Earth, it also had a high apparent rate of motion so that it would have left a trailed image on the detector, spreading out the light from the object and reducing the per pixel signal-to-noise ratio (SNR) to a level below the system’s detection threshold. Taking these trailing losses into account, there were only three 2-hour time segments during the entire 2.7 years in which 2020 CD3 was detectable by the Mt. Lemmon telescope, corresponding to % of the time under the best of circumstances. A similar analysis for the Pan-STARRS1 telescope (Chambers et al., 2016) finds that there were only four short time periods during which it could have detected 2020 CD3. Pan-STARRS1 reaches a fainter limiting magnitude than Mt. Lemmon due to its larger aperture and better seeing statistics but its smaller pixels makes it less sensitive to fast-moving objects like minimoons.
4.5 Minimoon population
We expect there to exist a much larger but undiscovered population of minimoons that are similar or smaller in size to 2020 CD3(Fedorets et al., 2017; Granvik et al., 2012) — they are just difficult to detect due to their faintness, rate of motion, and infrequent windows of observational opportunity (Fig. 5). Estimating the minimoon populations size-frequency distribution by debiasing the discovered population of two objects is essentially impossible given that they are so difficult to detect and were at the limit of the system’s detection capability. In addition to the two minimoons discovered by CSS, observations of meteors created by meteoroids that had a high probability of being geocentric prior to entering the atmosphere (Clark et al., 2016; Shober et al., 2019) support the existence of a minimoon population. These meteor observations are also difficult to convert into a minimoon population estimate because a meteor’s apparent brightness, in both the optical and radar, is dominated by the meteoroids diameter and its speed. Since meteors generated by minimoons have the lowest possible meteor speed, essentially equal to Earth’s escape speed, they are the faintest possible meteors. Thus, in order for them to be bright enough to be detected they must be large and therefore rare.
To quantify the detection frequency of minimoons we apply Bolin et al. (2014)’s modelling of the performance of Pan-STARRS1 survey (PS1; Chambers et al., 2016) to the CSS’s Mt. Lemmon observatory that discovered both of the telescopically identified minimoons. The application is appropriate because the two observatories have roughly similar capabilities, especially considering all the difficulties involved in modeling the detection of faint, fast-moving minimoons, and the statistics of just two objects. The modelled PS1 survey has a peak probability of detecting minimoons at so Mt. Lemmon’s discovery of 2020 CD3 with is not surprising. Furthermore, Bolin et al. (2014) estimated that PS1 (and therefore Mt. Lemmon) could detect about minimoons per lunation or about one every 8.1 years as compared to the 14 year interval since CSS’s discovery of 2006 RH120. We think the discrepancy in the time interval is not significant given that 1) Bolin et al. (2014) used the earlier and larger minimoon size-frequency distribution of Granvik et al. (2012) compared to the revised distribution of Fedorets et al. (2017) and because 2) it is intrinsically difficult to model discovery rates at the limits of detectability in both flux and rate of motion (see Fig. 5). Moreover, assuming Poisson-like discovery statistics, and that the CSS Mt. Lemmon survey has been in operation at roughly the same capability level for 20 years, over the same period there is a % probability of discovering minimoons. Therefore, the discovery of 2020 CD3 14 years after the discovery of 2006 RH120, a minimoon with , is in line with the capture frequency of minimoons predicted by existing population models, and consistent with their predicted discovery rate (Bolin et al., 2014).
An additional complication in debiasing the minimoon population identified in asteroid surveys is the difficulty of identifying rare natural objects among numerous artificial ones (Jedicke et al., 2018a). As sky surveys have become more powerful and efficient at identifying faint and trailed objects they have been detecting ever more artificial geocentric objects, often on minimoon-like orbits. Distinguishing both 2020 CD3 and 2006 RH120 from artificial objects upon their discovery was initially inadvertently affected by human biases that objects on geocentric orbits are artificial and correcting the observation statistics for this bias will be difficult.
5 Conclusions
We provide an in-depth study of the orbital and physical characteristics of Earth’s second discovered minimoon, 2020 CD3. The combination of its area-to-mass ratio derived from its solar radiation pressure signature, its reflectance spectrum that is consistent with silicate asteroids, and its non-detection by radar provides evidence that 2020 CD3 is a natural object. Its derived geometric albedo - bulk density distributions are consistent with values typical of silicate asteroids. 2020 CD3 could be a free-floating silicate analogue of boulders discovered on surfaces of larger asteroids.
High precision astrometry enabled by the Gaia mission permits the measurement of ground-based astrometry of asteroids to a level of 0.05′′ in the best cases. This, in turn, provides better, faster constraints on the solar radiation pressure signature for small asteroids. For the best possible results, special attention needs to be paid to 1) using accurate and precise geographical coordinates for ground-based observatories and 2) time-keeping.
The geocentric orbital evolution of 2020 CD3 includes a close dynamical interaction with the Moon on 2017 September 15. It was bound on a geocentric orbit for at least 2.7 years, which makes it an exceptionally long capture compared to typical capture duration results from simulations. However, a long duration is actually typical for minimoons that experience close approaches to the Moon. Some orbital trajectories suggest a lunar ejecta origin of 2020 CD3, but we showed that this possibility is unlikely.
The discovery of 2020 CD3 is in line with the most recent theoretical predictions for the steady-state population of minimoons (Fedorets et al., 2017), supporting the prediction for an increased discovery rate of minimoons (Fedorets et al., 2020) with the upcoming Vera C. Rubin Observatory’s Legacy Survey of Space and Time (LSST; Ivezić et al., 2019). More discoveries of minimoons are also anticipated through improvements to the ongoing NEO surveys such as CSS (Bolin et al., 2014) but trailing losses remain a major factor affecting the discovery of minimoons. A rapid determination of the nature of temporarily-captured objects after their discovery remains a challenge which is expected to become even more pressing with the anticipated increase in their discovery rate with LSST.
The discovery and characterization of 2020 CD3 paves the way for the observational study of minimoons as a population instead of a curiosity with serendipitous discoveries, as well as for identifying candidate targets for cost-effective space missions to these unexplored objects at the asteroid-meteoroid boundary (Granvik et al., 2013; Jedicke et al., 2018a).
Author contributions
G.F., M.M., R.J., S.N, D.Fa., M.G., N.M., M.S., R.We., K.W., E.C., Q.Y., W.B. wrote the paper. K.W. and T.P. discovered the object. G.F and M.M. acquired the NOT data, supported by A.D. R.We. and R.Wa. acquired the CFHT data. N.M., Q.Y., M.D. and M.M. acquired the LDT data. D.Fö. acquired the UH88 data. G.F., M.S., L.B., M.M., M.G. wrote the Gemini North DD proposal. M.S., G.F., T.S., D.M.F., J.R., A.S. acquired the Gemini North data. M.M., R. We., Q.Y. searched for precovery images. M.M. and D.Fa. computed the area-to-mass ratio. N.M. derived the rotational period. D.Fa., M.M., M.G., R.J., G.F. physically characterised the object. S.N., D.Fa. and M.M. calculated the orbit. W.B. and R.J. investigated the lunar ejecta hypothesis. M.G. estimated the source region of the object. R.J., E.C., R.We. and M.M. investigated the detectability of the object. R.J., G.F., M.M., M.G., D.Fa. interpreted the results.
References
- Acton et al. (2018) Acton, C., Bachman, N., Semenov, B., & Wright, E. 2018, Planetary and Space Science, 150, 9 , doi: https://doi.org/10.1016/j.pss.2017.02.013
- Acton (1996) Acton, C. H. 1996, Planet. Space Sci., 44, 65, doi: 10.1016/0032-0633(95)00107-7
- Alam et al. (2015) Alam, S., Albareti, F. D., Allende Prieto, C., et al. 2015, ApJS, 219, 12, doi: 10.1088/0067-0049/219/1/12
- AURA Gemini Observatory-Science User Support Department (2018) AURA Gemini Observatory-Science User Support Department. 2018, DRAGONS: Gemini Observatory data reduction platform. http://ascl.net/1811.002
- Bellm et al. (2019) Bellm, E. C., Kulkarni, S. R., Graham, M. J., et al. 2019, PASP, 131, 018002, doi: 10.1088/1538-3873/aaecbe
- Bertin & Arnouts (1996) Bertin, E., & Arnouts, S. 1996, A&AS, 117, 393, doi: 10.1051/aas:1996164
- Binzel et al. (2019) Binzel, R., DeMeo, F., Turtelboom, E., et al. 2019, Icarus, 324, 41 , doi: https://doi.org/10.1016/j.icarus.2018.12.035
- Bolin et al. (2014) Bolin, B., Jedicke, R., Granvik, M., et al. 2014, Icarus, 241, 280
- Bressi et al. (2008) Bressi, T. H., Hergenrother, C. W., Christensen, E. J., et al. 2008, Minor Planet Electronic Circulars, 2008-D12
- Brown et al. (2002) Brown, P., Spalding, R. E., ReVelle, D. O., Tagliaferri, E., & Worden, S. 2002, Nature, 420, 294
- Brown et al. (2013) Brown, P. G., Assink, J. D., Astiz, L., et al. 2013, Nature, 503, 238 , doi: 10.1038/nature12741
- Butkiewicz-Bąk et al. (2017) Butkiewicz-Bąk, M., Kwiatkowski, T., Bartczak, P., Dudziński, G., & Marciniak, A. 2017, Monthly Notices of the Royal Astronomical Society, 470, 1314
- Carry (2012) Carry, B. 2012, Planet. Space Sci., 73, 98, doi: 10.1016/j.pss.2012.03.009
- Chambers et al. (2016) Chambers, K. C., Magnier, E. A., Metcalfe, N., et al. 2016, arXiv e-prints, arXiv:1612.05560. https://arxiv.org/abs/1612.05560
- Chesley et al. (2014) Chesley, S. R., Farnocchia, D., Nolan, M. C., et al. 2014, Icarus, 235, 5, doi: 10.1016/j.icarus.2014.02.020
- Christensen et al. (2018) Christensen, E., Africano, B., Farneth, G., et al. 2018, in AAS/Division for Planetary Sciences Meeting Abstracts #50, AAS/Division for Planetary Sciences Meeting Abstracts, 310.10
- Clark et al. (2016) Clark, D. L., Spurný, P., Wiegert, P., et al. 2016, Astronomical Journal, 151, 135
- DeMeo et al. (2009) DeMeo, F. E., Binzel, R. P., Slivan, S. M., & Bus, S. J. 2009, Icarus, 202, 160
- DeMeo & Carry (2013) DeMeo, F. E., & Carry, B. 2013, Icarus, 226, 723
- DeMeo & Carry (2014) DeMeo, F. E., & Carry, B. 2014, Nature, 505, 629, doi: 10.1038/nature12908
- Farnocchia et al. (2015a) Farnocchia, D., Chesley, S., & Micheli, M. 2015a, Icarus, 258, 18
- Farnocchia et al. (2016) Farnocchia, D., Chesley, S. R., & Chamberlin, A. B. 2016, in AAS/Division for Planetary Sciences Meeting Abstracts #48, AAS/Division for Planetary Sciences Meeting Abstracts, 305.03
- Farnocchia et al. (2015b) Farnocchia, D., Chesley, S. R., Milani, A., Gronchi, G. F., & Chodas, P. W. 2015b, in Asteroids IV, ed. P. Michel, F. DeMeo, & W. F. Bottke, 815–834, doi: 10.2458/azu_uapress_9780816532131-ch041
- Farnocchia et al. (2019) Farnocchia, D., Eggl, S., Chodas, P. W., Giorgini, J. D., & Chesley, S. R. 2019, Celestial Mechanics and Dynamical Astronomy, 131, 36, doi: 10.1007/s10569-019-9914-4
- Farnocchia et al. (2017) Farnocchia, D., Tholen, D. J., Micheli, M., et al. 2017, in AAS/Division for Planetary Sciences Meeting Abstracts #49, AAS/Division for Planetary Sciences Meeting Abstracts, 100.09
- Fedorets et al. (2017) Fedorets, G., Granvik, M., & Jedicke, R. 2017, Icarus, 285, 83
- Fedorets et al. (2020) Fedorets, G., Granvik, M., Jones, R. L., Jurić, M., & Jedicke, R. 2020, Icarus, 338, 113517
- Flewelling et al. (2016) Flewelling, H. A., Magnier, E. A., Chambers, K. C., et al. 2016, arXiv e-prints, arXiv:1612.05243. https://arxiv.org/abs/1612.05243
- Fukugita et al. (1996) Fukugita, M., Ichikawa, T., Gunn, J. E., et al. 1996, AJ, 111, 1748, doi: 10.1086/117915
- Gaia Collaboration et al. (2018) Gaia Collaboration, Brown, A. G. A., Vallenari, A., Prusti, T., & et al. 2018, A&A, 616, A1, doi: 10.1051/0004-6361/201833051
- Gaia Collaboration et al. (2016) Gaia Collaboration, Prusti, T., de Bruijne, J. H. J., et al. 2016, A&A, 595, A1
- Gehrels (1967) Gehrels, T. 1967, The Astronomical Journal, 72, 929
- Graham et al. (2019) Graham, M. J., Kulkarni, S. R., Bellm, E. C., et al. 2019, PASP, 131, 078001, doi: 10.1088/1538-3873/ab006c
- Granvik et al. (2013) Granvik, M., Jedicke, R., Bolin, B., et al. 2013, in Asteroids. Prospective Energy and Material Resources, ed. V. Badescu (Springer), 151 – 167
- Granvik et al. (2012) Granvik, M., Vaubaillon, J., & Jedicke, R. 2012, Icarus, 218, 262
- Granvik et al. (2016) Granvik, M., Morbidelli, A., Jedicke, R., et al. 2016, Nature, 530, 303
- Granvik et al. (2018) Granvik, M., Morbidelli, A., Jedicke, R., et al. 2018, Icarus, 312, 181, doi: 10.1016/j.icarus.2018.04.018
- Harris & D’Abramo (2015) Harris, A. W., & D’Abramo, G. 2015, Icarus, 257, 302
- Hirase et al. (2004) Hirase, Y., Nakamura, A. M., & Michikami, T. 2004, Planetary and Space Science, 52, 1103
- Hook et al. (2004) Hook, I. M., Jørgensen, I., Allington-Smith, J. R., et al. 2004, PASP, 116, 425, doi: 10.1086/383624
- Ivezić et al. (2019) Ivezić, Ž., Kahn, S. M., Tyson, J. A., & 311 authors. 2019, The Astrophysical Journal, 873, 111
- Jedicke et al. (2018a) Jedicke, R., Bolin, B. T., Bottke, W. F., et al. 2018a, Frontiers in Astronomy and Space Sciences, 5, A13
- Jedicke et al. (2018b) Jedicke, R., Sercel, J., Gillis-Davis, J., Morenz, K. J., & Gertsch, L. 2018b, Planet. Space Sci., 159, 28, doi: 10.1016/j.pss.2018.04.005
- Jenniskens et al. (2009) Jenniskens, P., Shaddad, M. H., Numan, D., et al. 2009, Nature, 458, 485, doi: 10.1038/nature07920
- Jenniskens et al. (2016) Jenniskens, P., Albers, J., Koop, M. W., et al. 2016, in AIAA Science and Technology Forum and Exposition
- Jordi et al. (2010) Jordi, C., Gebran, M., Carrasco, J. M., et al. 2010, A&A, 523, A48, doi: 10.1051/0004-6361/201015441
- Kwiatkowski et al. (2009) Kwiatkowski, T., Kryszczyńska, A., Polińska, M., et al. 2009, Astronomy & Astrophysics, 495, 967
- Lindegren et al. (2018) Lindegren, L., Hernández, J., Bombrun, A., et al. 2018, A&A, 616, A2, doi: 10.1051/0004-6361/201832727
- Mainzer et al. (2012) Mainzer, A., Masiero, J., Grav, T., et al. 2012, ApJ, 745, 7, doi: 10.1088/0004-637X/745/1/7
- Marsden (1969) Marsden, B. 1969, The Astronomical Journal, 74, 720
- Marsden et al. (1973) Marsden, B., Sekanina, Z., & Yeomans, D. K. 1973, The Astronomical Journal, 78, 211
- Masci et al. (2019) Masci, F. J., Laher, R. R., Rusholme, B., et al. 2019, PASP, 131, 018003, doi: 10.1088/1538-3873/aae8ac
- Melosh (1985) Melosh, H. J. 1985, Geology, 13, 144
- Melosh (1989) Melosh, H. J. 1989, Impact cratering : a geologic process (Oxford University Press, Oxford, UK)
- Micheli et al. (2012) Micheli, M., Tholen, D. J., & Elliott, G. T. 2012, New Astronomy, 17, 446
- Micheli et al. (2013) —. 2013, Icarus, 226, 251
- Micheli et al. (2014) —. 2014, The Astrophysical Journal Letters, 788, L1
- Miles (2011) Miles, R. 2011, Journal of British Astronomical Association, 121, 350
- Minor Planet Center (2020) Minor Planet Center. 2020, Minor Planet Electronic Circular 2020-D104
- Mommert (2017) Mommert, M. 2017, Astronomy and Computing, 18, 47, doi: 10.1016/j.ascom.2016.11.002
- Mommert et al. (2014a) Mommert, M., Hora, J. L., Farnocchia, D., et al. 2014a, ApJ, 786, 148, doi: 10.1088/0004-637X/786/2/148
- Mommert et al. (2014b) Mommert, M., Farnocchia, D., Hora, J. L., et al. 2014b, ApJ, 789, L22, doi: 10.1088/2041-8205/789/1/L22
- Muinonen et al. (2010) Muinonen, K., Belskaya, I. N., Cellino, A., et al. 2010, Icarus, 209, 542, doi: 10.1016/j.icarus.2010.04.003
- Penttilä et al. (2016) Penttilä, A., Shevchenko, V. G., Wilkman, O., & Muinonen, K. 2016, Planet. Space Sci., 123, 117, doi: 10.1016/j.pss.2015.08.010
- Pravec & Harris (2007) Pravec, P., & Harris, A. W. 2007, Icarus, 190, 250, doi: 10.1016/j.icarus.2007.02.023
- Rabinowitz et al. (2000) Rabinowitz, D., Helin, E., Lawrence, K., & Pravdo, S. 2000, Nature, 403, 165
- Saito et al. (2006) Saito, J., Miyamoto, H., Nakamura, R., et al. 2006, Science, 312, 1341, doi: 10.1126/science.1125722
- Seidelmann et al. (2002) Seidelmann, P. K., Abalakin, V. K., Bursa, M., et al. 2002, Celestial Mechanics and Dynamical Astronomy, 82, 83
- Shevchenko et al. (2016) Shevchenko, V. G., Belskaya, I. N., Muinonen, K., et al. 2016, Planetary and Space Science, 123, 101 , doi: https://doi.org/10.1016/j.pss.2015.11.007
- Shober et al. (2019) Shober, P. M., Jansen-Sturgeon, T., Sansom, E. K., et al. 2019, The Astronomical Journal, 158, 183
- Speyerer et al. (2016) Speyerer, E. J., Povilaitis, R. Z., Robinson, M. S., Thomas, P. C., & Wagner, R. W. 2016, Nature, 538, 215
- Stetson (1987) Stetson, P. B. 1987, Publications of the Astronomical of the Pacific, 99, 191
- Tody (1986) Tody, D. 1986, in Society of Photo-Optical Instrumentation Engineers (SPIE) Conference Series, Vol. 627, Instrumentation in astronomy VI, ed. D. L. Crawford, 733, doi: 10.1117/12.968154
- Tody (1993) Tody, D. 1993, in Astronomical Society of the Pacific Conference Series, Vol. 52, Astronomical Data Analysis Software and Systems II, ed. R. J. Hanisch, R. J. V. Brissenden, & J. Barnes, 173
- Tricarico (2017) Tricarico, P. 2017, Icarus, 284, 416
- Vokrouhlický (1998) Vokrouhlický, D. 1998, Astronomy & Astrophysics, 335, 1093
- Vokrouhlický & Milani (2000) Vokrouhlický, D., & Milani, A. 2000, A&A, 362, 746
- Warren (1994) Warren, P. H. 1994, Icarus, 111, 338 , doi: https://doi.org/10.1006/icar.1994.1149
- Xilouris et al. (2018) Xilouris, E. M., Bonanos, A. Z., Bellas-Velidis, I., et al. 2018, A&A, 619, A141, doi: 10.1051/0004-6361/201833499
- Zhao et al. (2007) Zhao, H., Yao, J., & Lu, H. 2007, Proceedings of the International Astronomical Union, 3, 565
| Telescope | Aperture (m) | Astrometry | Photometry | Lightcurve |
|---|---|---|---|---|
| CSS Mt. Lemmon | 1.5 | ✓ | ||
| Calar Alto Schmidt | 0.8 | ✓ | ||
| Nordic Optical Telescope | 2.5 | ✓ | ||
| Gemini North | 8.1 | ✓ | ||
| Canada-France-Hawai’i Telescope | 3.6 | ✓ | ||
| Lowell Discovery Telescope | 4.3 | ✓ | ✓ | |
| U. of Hawai’i 2.2-meter | 2.2 | ✓ |
| Date (UTC) | G | Code | Telescope | ||||
|---|---|---|---|---|---|---|---|
| 2020 02 15.526427 | 13 03 37.570 | +09 17 38.40 | 19.6 | G96 | 0.11 | 0.16 | CSS Mt. Lemmon |
| 2020 02 17.975500 | 13 45 24.910 | +19 18 44.71 | 21.0 | Z84 | 0.30 | 0.30 | Calar Alto Schmidt |
| 2020 02 17.984601 | 13 45 26.960 | +19 20 34.07 | 20.9 | Z84 | 0.32 | 0.32 | Calar Alto Schmidt |
| 2020 02 17.993701 | 13 45 28.601 | +19 22 22.81 | 21.1 | Z84 | 0.21 | 0.21 | Calar Alto Schmidt |
| 2020 02 18.002805 | 13 45 29.872 | +19 24 10.44 | 21.0 | Z84 | 0.22 | 0.22 | Calar Alto Schmidt |
| 2020 02 18.011907 | 13 45 30.718 | +19 25 57.10 | 21.3 | Z84 | 0.17 | 0.17 | Calar Alto Schmidt |
| 2020 02 18.021008 | 13 45 31.196 | +19 27 42.04 | 21.3 | Z84 | 0.19 | 0.19 | Calar Alto Schmidt |
| 2020 02 21.093805 | 14 03 50.575 | +24 20 51.66 | 21.8 | Z84 | 0.24 | 0.24 | Calar Alto Schmidt |
| 2020 02 21.114761 | 14 03 44.360 | +24 22 47.25 | 21.8 | Z84 | 0.27 | 0.27 | Calar Alto Schmidt |
| 2020 02 21.177717 | 14 03 22.794 | +24 27 37.51 | 21.8 | Z84 | 0.23 | 0.23 | Calar Alto Schmidt |
| 2020 02 21.198677 | 14 03 15.400 | +24 28 53.86 | 21.7 | Z84 | 0.15 | 0.15 | Calar Alto Schmidt |
| 2020 02 21.174711 | 14 03 52.507 | +24 31 07.79 | 22.0 | Z23 | 0.13 | 0.15 | NOT |
| 2020 02 21.199832 | 14 03 42.272 | +24 33 04.85 | 21.6 | Z23 | 0.10 | 0.12 | NOT |
| 2020 02 21.203876 | 14 03 40.597 | +24 33 22.12 | 21.6 | Z23 | 0.07 | 0.07 | NOT |
| 2020 02 24.586055 | 14 14 38.369 | +27 28 39.86 | 22.6 | 568 | 0.038 | 0.036 | Gemini North |
| 2020 02 24.601986 | 14 14 31.235 | +27 29 19.63 | 22.9 | 568 | 0.053 | 0.054 | Gemini North |
| 2020 02 24.608418 | 14 14 28.325 | +27 29 34.13 | 22.8 | 568 | 0.034 | 0.033 | Gemini North |
| 2020 02 24.621399 | 14 14 22.582 | +27 30 00.12 | 22.4 | 568 | 0.107 | 0.041 | Gemini North |
| 2020 02 25.148888 | 14 16 23.887 | +27 46 14.71 | 23.6 | Z23 | 0.2 | 0.2 | NOT |
| 2020 02 25.156760 | 14 16 21.045 | +27 46 42.49 | 22.7 | Z23 | 0.08 | 0.08 | NOT |
| 2020 02 25.161406 | 14 16 19.302 | +27 46 58.27 | 22.7 | Z23 | 0.11 | 0.11 | NOT |
| 2020 02 26.608875 | 14 18 35.299 | +28 40 16.90 | 23.0 | 568 | 0.047 | 0.041 | UH 2.2 m |
| 2020 02 26.613020 | 14 18 33.500 | +28 40 23.38 | 23.0 | 568 | 0.060 | 0.049 | UH 2.2 m |
| 2020 02 26.616949 | 14 18 31.802 | +28 40 29.28 | 23.2 | 568 | 0.075 | 0.078 | UH 2.2 m |
| 2020 02 26.620998 | 14 18 30.056 | +28 40 34.90 | 23.2 | 568 | 0.057 | 0.049 | UH 2.2 m |
| 2020 02 26.625629 | 14 18 28.070 | +28 40 40.98 | 23.0 | 568 | 0.055 | 0.045 | UH 2.2 m |
| 2020 02 26.620384 | 14 18 30.334 | +28 40 34.01 | 22.76 | 568 | 0.05 | 0.05 | CFHT |
| 2020 02 26.621564 | 14 18 29.827 | +28 40 35.61 | 22.77 | 568 | 0.05 | 0.05 | CFHT |
| 2020 02 26.622763 | 14 18 29.317 | +28 40 37.19 | 22.74 | 568 | 0.05 | 0.05 | CFHT |
| 2020 02 28.594550 | 14 21 41.875 | +29 36 30.86 | 22.77 | 568 | 0.05 | 0.05 | CFHT |
| 2020 02 28.595729 | 14 21 41.374 | +29 36 32.58 | 23.19 | 568 | 0.05 | 0.05 | CFHT |
| 2020 02 28.598103 | 14 21 40.361 | +29 36 36.06 | 23.23 | 568 | 0.05 | 0.05 | CFHT |
| 2020 03 01.477536 | 14 23 44.902 | +30 15 25.54 | 22.6 | G37 | 0.256 | 0.268 | LDT |
| 2020 03 01.479237 | 14 23 44.291 | +30 15 27.50 | 23.0 | G37 | 0.313 | 0.283 | LDT |
| 2020 03 01.480279 | 14 23 43.932 | +30 15 28.52 | 22.8 | G37 | 0.213 | 0.262 | LDT |
| 2020 03 02.162378 | 14 24 45.080 | +30 30 46.94 | 23.2 | Z23 | 0.07 | 0.07 | NOT |
| 2020 03 02.179266 | 14 24 38.827 | +30 31 16.90 | 23.1 | Z23 | 0.09 | 0.09 | NOT |
| 2020 03 02.655003 | 14 24 20.964 | +30 42 13.62 | 23.32 | 568 | 0.05 | 0.05 | CFHT |
| 2020 03 02.656878 | 14 24 20.269 | +30 42 13.26 | 23.08 | 568 | 0.05 | 0.05 | CFHT |
| 2020 03 02.658754 | 14 24 19.596 | +30 42 12.91 | 23.13 | 568 | 0.05 | 0.05 | CFHT |
| 2020 03 04.635008 | 14 25 48.907 | +31 15 21.90 | 23.30 | 568 | 0.05 | 0.05 | CFHT |
| 2020 03 04.636888 | 14 25 48.213 | +31 15 21.78 | 23.28 | 568 | 0.05 | 0.05 | CFHT |
| 2020 03 04.638761 | 14 25 47.512 | +31 15 21.58 | 23.28 | 568 | 0.05 | 0.05 | CFHT |
| 2020 03 05.489286 | 14 26 26.653 | +31 23 51.85 | 23.1 | G37 | 0.06 | 0.06 | LDT |
| 2020 03 05.490947 | 14 26 26.093 | +31 23 52.37 | 22.9 | G37 | 0.06 | 0.06 | LDT |
| 2020 03 05.492737 | 14 26 25.495 | +31 23 52.87 | 22.9 | G37 | 0.05 | 0.05 | LDT |
| 2020 03 06.240152 | 14 26 41.654 | +31 35 09.84 | 23.3 | Z23 | 0.06 | 0.06 | NOT |
| 2020 03 06.246311 | 14 26 39.515 | +31 35 09.81 | 23.7 | Z23 | 0.07 | 0.07 | NOT |
| 2020 03 06.252078 | 14 26 37.524 | +31 35 09.36 | 23.6 | Z23 | 0.06 | 0.06 | NOT |
| 2020 03 21.462672 | 14 22 58.469 | +33 15 41.15 | 23.77 | 568 | 0.05 | 0.05 | CFHT |
| 2020 03 21.464548 | 14 22 57.785 | +33 15 43.12 | 23.72 | 568 | 0.05 | 0.05 | CFHT |
| 2020 03 21.466429 | 14 22 57.087 | +33 15 45.00 | 23.59 | 568 | 0.05 | 0.05 | CFHT |
| 2020 03 25.199063 | 14 17 34.589 | +33 09 50.72 | 24.0 | Z23 | 0.12 | 0.12 | NOT |
| 2020 03 25.210295 | 14 17 30.563 | +33 09 39.14 | 24.2 | Z23 | 0.26 | 0.26 | NOT |
| 2020 03 25.219775 | 14 17 27.296 | +33 09 28.11 | 23.8 | Z23 | 0.10 | 0.10 | NOT |
| 2020 03 29.161561 | 14 11 40.795 | +32 46 19.67 | 23.9 | Z23 | 0.08 | 0.05 | NOT |
| 2020 03 29.171345 | 14 11 37.179 | +32 46 09.34 | 24.1 | Z23 | 0.09 | 0.06 | NOT |
| 2020 03 29.182286 | 14 11 33.175 | +32 45 56.44 | 24.0 | Z23 | 0.09 | 0.06 | NOT |
| 2020 03 30.376555 | 14 09 54.750 | +32 33 45.95 | 23.4 | G37 | 0.09 | 0.08 | LDT |
| 2020 03 30.379675 | 14 09 53.606 | +32 33 43.93 | 23.5 | G37 | 0.17 | 0.17 | LDT |
| 2020 04 17.072836 | 13 41 35.761 | +26 34 34.21 | 24.1 | Z23 | 0.089 | 0.102 | NOT |
| 2020 04 17.083259 | 13 41 32.407 | +26 34 13.83 | 24.3 | Z23 | 0.070 | 0.064 | NOT |
| 2020 04 17.093646 | 13 41 29.074 | +26 33 52.11 | 23.8 | Z23 | 0.207 | 0.207 | NOT |
| 2020 04 29.105118 | 13 25 42.426 | +19 33 24.57 | Z23 | 0.25 | 0.25 | NOT | |
| 2020 04 29.113261 | 13 25 40.749 | +19 33 00.44 | 24.3 | Z23 | 0.25 | 0.25 | NOT |
| 2020 05 15.936339 | 13 21 25.566 | +07 39 09.07 | 25.0 | Z23 | 0.15 | 0.15 | NOT |
| 2020 05 17.244907 | 13 21 56.056 | +06 44 12.63 | 24.5 | 568 | 0.197 | 0.152 | CFHT |
| 2020 05 17.247704 | 13 21 55.726 | +06 44 05.99 | 24.3 | 568 | 0.281 | 0.272 | CFHT |
| 2020 05 20.950021 | 13 23 11.161 | +04 06 13.56 | 25.6 | Z23 | 0.10 | 0.10 | NOT |
| 2020 05 20.967845 | 13 23 09.104 | +04 05 28.13 | 25.4 | Z23 | 0.10 | 0.10 | NOT |
| 2020 05 20.985665 | 13 23 07.102 | +04 04 42.33 | 25.4 | Z23 | 0.10 | 0.10 | NOT |
| Obs. id | Filter | Mag. | ||
|---|---|---|---|---|
| 1 | 22.399 | 0.037 | 0.048 | |
| 2 | 22.269 | 0.039 | 0.054 | |
| 3 | 22.413 | 0.035 | 0.048 | |
| 4 | 23.111 | 0.049 | 0.033 | |
| 5 | 22.267 | 0.050 | 0.054 | |
| 6 | 22.389 | 0.040 | 0.048 | |
| 7 | 23.265 | 0.056 | 0.033 | |
| 8 | 22.340 | 0.053 | 0.054 |
| Date (MJD) | Mag() | ||
|---|---|---|---|
| 58906.4881610 | 22.7116 | 0.0228 | 0.1087 |
| 58906.4889677 | 22.6461 | 0.0215 | 0.1050 |
| 58906.4894715 | 22.8355 | 0.0224 | 0.1289 |
| 58906.4899752 | 22.6235 | 0.0227 | 0.1126 |
| 58906.4905406 | 22.9247 | 0.0216 | 0.1407 |
| 58906.4910444 | 22.8095 | 0.0227 | 0.1270 |
| 58906.4915481 | 23.0082 | 0.0226 | 0.1508 |
| 58906.4923176 | 22.8036 | 0.0218 | 0.1241 |
| 58906.4928214 | 22.9557 | 0.0227 | 0.1618 |
| 58906.4933251 | 22.6341 | 0.0213 | 0.1121 |
| 58906.4938292 | 23.1323 | 0.0232 | 0.1768 |
| 58906.4943329 | 22.8583 | 0.0225 | 0.1346 |
| 58906.4953404 | 22.7895 | 0.0231 | 0.1333 |
| 58906.4963479 | 22.8472 | 0.0229 | 0.1373 |
| 58906.4968516 | 23.1161 | 0.0243 | 0.1807 |
| 58906.4973554 | 23.1744 | 0.0229 | 0.1949 |
| 58906.5013856 | 22.9624 | 0.0229 | 0.1503 |
| 58906.5018894 | 22.9546 | 0.0232 | 0.1508 |
| 58906.5029427 | 22.8884 | 0.0239 | 0.1488 |
| 58906.5034464 | 22.6851 | 0.0234 | 0.1236 |
| 58906.5039502 | 22.9444 | 0.0226 | 0.1473 |
| 58906.5049578 | 23.1792 | 0.0225 | 0.1871 |
| 58906.5054615 | 23.0686 | 0.0220 | 0.1513 |
| 58906.5059652 | 22.9580 | 0.0224 | 0.1486 |
| 58906.5074792 | 22.7658 | 0.0227 | 0.1207 |
| 58906.5079829 | 22.9301 | 0.0223 | 0.1403 |
| 58906.5089904 | 22.9475 | 0.0224 | 0.1535 |
| 58906.5094942 | 22.6765 | 0.0228 | 0.1160 |
| 58906.5099979 | 22.8687 | 0.0225 | 0.1325 |
| 58906.5105017 | 23.0201 | 0.0225 | 0.1490 |
| 58906.5110060 | 22.6124 | 0.0221 | 0.1041 |
| 58906.5120135 | 22.6595 | 0.0231 | 0.1040 |
| 58906.5126895 | 23.1251 | 0.0223 | 0.1675 |
| 58906.5131933 | 22.6779 | 0.0220 | 0.1112 |
| 58906.5136970 | 22.9829 | 0.0231 | 0.1546 |
| 58906.5142007 | 22.6173 | 0.0221 | 0.1030 |
| 58906.5147052 | 22.9908 | 0.0232 | 0.1551 |
| 58906.5152090 | 22.6400 | 0.0225 | 0.1069 |
| 58906.5157131 | 23.0546 | 0.0228 | 0.1527 |
| 58906.5162168 | 22.6199 | 0.0219 | 0.1141 |
| 58906.5167207 | 22.6704 | 0.0226 | 0.1151 |
| 58906.5172244 | 23.1026 | 0.0226 | 0.1690 |
| 58906.5177281 | 22.6366 | 0.0217 | 0.1102 |
| 58906.5182319 | 22.8375 | 0.0225 | 0.1326 |
| 58906.5187356 | 22.8540 | 0.0232 | 0.1375 |
| 58906.5192395 | 22.8399 | 0.0220 | 0.1317 |
| 58906.5197432 | 22.6965 | 0.0221 | 0.1144 |
| 58906.5202471 | 23.0981 | 0.0220 | 0.1653 |
| 58906.5207509 | 22.7457 | 0.0214 | 0.1193 |
| 58906.5212546 | 22.8318 | 0.0218 | 0.1292 |
| 58906.5217587 | 23.0903 | 0.0221 | 0.1685 |
| 58906.5222624 | 22.7996 | 0.0216 | 0.1359 |
| 58906.5228400 | 22.6896 | 0.0227 | 0.1138 |
| 58906.5233449 | 22.9262 | 0.0230 | 0.1470 |
| 58906.5238487 | 23.1095 | 0.0217 | 0.1704 |
| 58906.5243527 | 22.7774 | 0.0224 | 0.1202 |
| 58906.5248564 | 22.7482 | 0.0228 | 0.1234 |
| 58906.5253602 | 22.7669 | 0.0222 | 0.1259 |
| 58906.5258639 | 22.9694 | 0.0228 | 0.1472 |
| 58906.5263677 | 22.7342 | 0.0225 | 0.1164 |
| 58906.5283826 | 23.1254 | 0.0226 | 0.1831 |
| 58906.5288865 | 22.8278 | 0.0224 | 0.1341 |
| 58906.5293902 | 22.7815 | 0.0221 | 0.1421 |
| 58906.5298940 | 22.7310 | 0.0239 | 0.1272 |
| 58906.5319088 | 22.7927 | 0.0230 | 0.1459 |
| Fit type | wRMS | BIC | |||
|---|---|---|---|---|---|
| (E) | 32.13 | 0.1505 | 0.6005 | 1.632 | 0.000 |
| (S/M) | 31.79 | 0.2588 | 0.3721 | 1.635 | 0.4107 |
| (P) | 31.63 | 0.8343 | 0.04887 | 1.658 | 3.310 |
| (C) | 31.54 | 0.8228 | 0.01938 | 1.661 | 3.686 |
| (D) | 31.69 | 0.9617 | 0.01645 | 1.661 | 3.763 |
| 31.88 | 0.000 | 0.5324 | 1.630 | 4.418 |