An ac-susceptibility study of the magnetic relaxation phenomena in antiskyrmion host tetragonal Mn-Pt(Pd)-Sn system
Abstract
Here, we report an exhaustive study of the frequency-dependent ac-magnetic susceptibility of the symmetric Heusler system Mn-Pt(Pd)-Sn that hosts antiskyrmions over a wide temperature range. Magnetic relaxation studies using Cole-Cole formalism reveal a Debye-type relaxation with a nearly negligible distribution in relaxation times. In contrast to the archetypical skyrmion hosts, the high Curie temperature () of the present system ensures shorter switching times, and, correspondingly, higher frequencies are required to probe the relaxation dynamics. We find a non-monotonic variation in the characteristic relaxation time with distinct maxima at the phase boundaries via helical antiskyrmion field-polarized states, indicating slower magnetization dynamics over the region of phase coexistence. The temperature-dependent relaxation time across different phases is of the order of s and follows the well-known Arrhenius law with reasonable values of the energy barriers. The present study concerning the magnetization dynamics in the antiskyrmion host tetragonal Heusler system is an important contribution towards the basic understanding of the dynamical aspects of antiskyrmions for their potential applications.
I INTRODUCTION
Skyrmions represent a particular class of magnetic nano-domains characterized by vortex-like localized spin configurations U.K.Robler , in contrast to the conventional- helical, conical, and spontaneously magnetized spin structures. The twist in the magnetization profile within each domain described by a topological winding number gives robust protection to the spin configurations against continuous deformation N.Nagaosa . Owing to their solitonic nature, skyrmions can interact efficiently with the electrons and magnons in the host material and result in several exotic electromagnetic phenomena such as topological Hall effect A.Neubauer , thermally induced ratchet motion M.Mochizuki , and skyrmion magnetic resonance Y.Onose . The competition between the Heisenberg exchange and the Dzyaloshinskii-Moriya (DM) interaction is one of the main reasons behind the observation of skyrmions in bulk and thin-film magnetic systems A.Neubauer ; S.Muhlbauer ; C.Pappas ; W.Munzer ; X.Z.Yu ; S.X.Huang ; H.Wilhelm ; S.Seki ; S.Heinze . Recently, a new type of topological object named antiskyrmion was observed in an acentric tetragonal Heusler-Mn-Pt(Pd)-Sn system with crystal symmetry A.K.Nayak . Note that the high of this material ( 400 K) ensures that the antiskyrmions get stabilized over a wide temperature range. In the archetypal skyrmion hosting B20 materials, an externally applied magnetic field favours conical helices propagating along the field direction. In contrast, a particular pattern of DM vectors dictated by the crystallographic symmetry in the Mn-Pt(Pd)-Sn system precludes the emergence of the longitudinal conical structure at finite fields.
In most cases, the presence of the skyrmion phase was identified using small-angle neutron scattering S.Muhlbauer , Lorentz transmission electron microscopy (LTEM) X.Z.Yu ; A.K.Nayak and, indirectly by topological Hall transport studies A.Neubauer ; N.Kanazava ; S.X.Huang ; S.X.Huang2 ; S.Sen . It is well-known that ac-susceptibility is a potential technique to identify various magnetic phases and to study their relaxation dynamics A.H.Morrish ; M.Balanda ; S.J.Blundell . Linear and non-linear susceptibilities with various ac-magnetic field amplitudes () and frequencies () in the presence and absence of superimposed dc-magnetic fields () are widely used to unambiguously identify Ferro-, Ferri-, Antiferro-magnetic ordering, canonical-, cluster-, reentrant spin glass nature, spin-reorientation transitions and superparamagnetism M.Balanda ; S.J.Blundell . Recently, it has been shown that ac-susceptibility as a function of dc-magnetic field, , at various fixed frequencies (f) of the oscillating magnetic field can be used to study the relaxation dynamics of the modulated magnetic phases in different skyrmion host materials that include metallic- FeGe H.Wilhelm , MnSi A.Bauer , Fe1-xCoxSi L.J.Bannenberg , Mn1-xFexSi L.J.Bannenberg2 , insulating Cu2OSeO3I.Levatic ; F.Qian and semiconducting GaV4S8A.Butykai . Peak/hump anomalies in the field evolution of ac-susceptibility that characterize the antiskyrmion phase in the tetragonal Heusler Mn-Pt(Pd)-Sn were recently reported S.K.Jamal . However, detailed studies are required to understand the magnetic relaxation and magnetic phase transitions in such a system. To this end, we have undertaken an in-depth study of high-precision ac-susceptibility data on the antiskyrmion hosts-Mn1.4PtSn and Mn1.4Pt0.9Pd0.1Sn.
II Methods
Polycrystalline ingots of Mn1.4PtSn and Mn1.4Pt0.9Pd0.1Sn were synthesized using arc melting technique. Details of the sample preparation and structural characterization are provided in the supplementary information Supp . Nearly disk-shaped samples of Mn1.4PtSn and Mn1.4Pt0.9Pd0.1Sn with a mass of 80.30 mg and 100.2 mg, respectively, were taken for the ac-susceptibility measurements performed on a Quantum Design Physical Property Measurement System. At fixed temperatures (T), ac-susceptibility () as a function of the magnetic field (H) was measured at an r.m.s field () of 10 Oe and frequencies () ranging from 11 Hz to 9999 Hz. For each measurement, the sample was ‘zero-field-cooled’ from 400 K () to the desired temperature at a rate of 10 K/min. The in-phase and out-of-phase components of the oscillating magnetization were measured and normalized by the ac drive amplitude () to obtain the real () and imaginary () parts of the ac-susceptibility, respectively. Note that during the scan, the magnetic field was stabilized at each step in the linear approach mode to achieve high precision data.
III RESULTS AND DISCUSSION
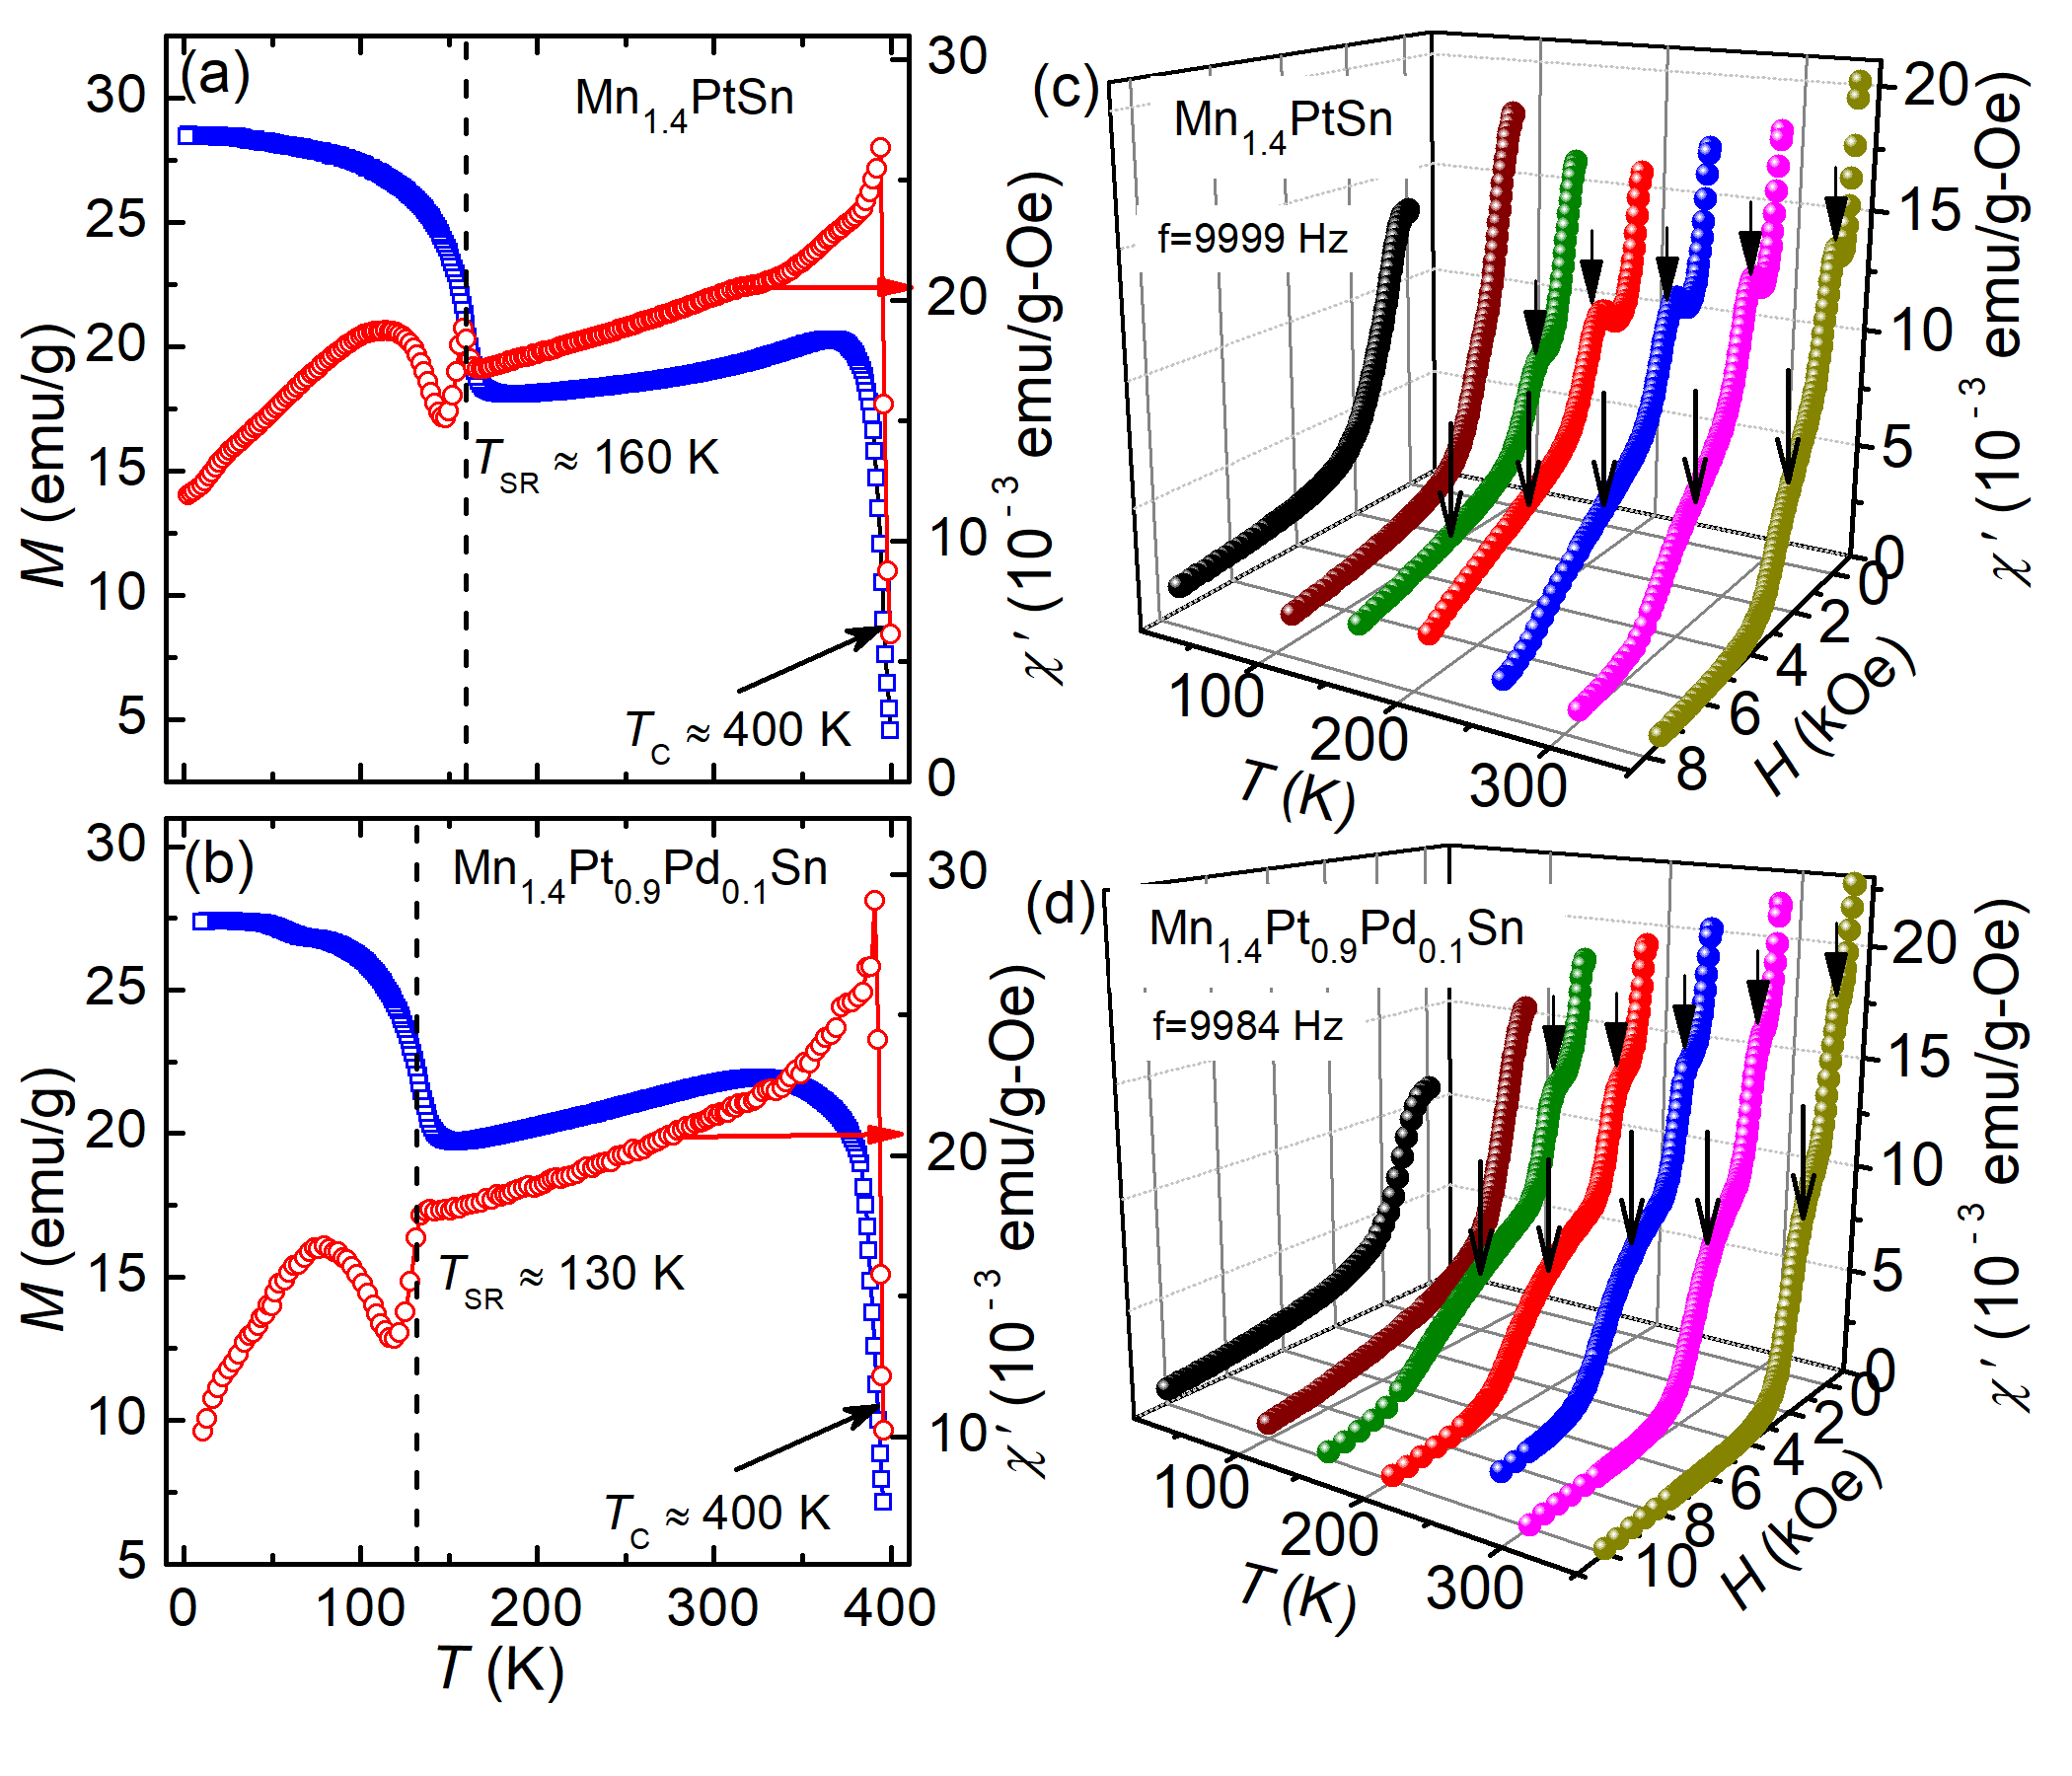
Mn1.4PtSn exhibits a of about 400 K and a low-temperature spin-reorientation transition [] of 160 K, as depicted in the temperature dependent magnetization data plotted in Fig. 1(a). The onset of brings about a sudden change in the magnetization in the data and a peak/dip kind of behavior in the temperature-dependent real part of ac-susceptibility curve [Fig. 1(a)]. In case of Mn1.4Pt0.9Pd0.1Sn, the is found at a temperature of about 400 K and the at 130 K [Fig. 1(b)]. It has been reported that a change in the magnetic structure below the hinders the nucleation process of the antiskyrmion phase A.K.Nayak . Similar inference has also been made from the field-dependent ac-susceptibility and magnetic entropy change measurements in the same materials S.K.Jamal . Since the antiskyrmion phase in the present system is well-established between the and the , the present work mostly focuses on the ac-susceptibility analysis in this particular temperature range. Figure 1(c) and (d) show the field dependent ac-susceptibility [] data measured at different temperatures starting from 10 K to 350 K. The presence of noticeable peak/dip kind of anomalies in the curves suggest that the applied dc-magnetic fields gradually transform the system into different magnetically ordered states. As it can be seen, the curve initially starts decreasing with increasing field before exhibiting a maxima in the field range of 1 kOe - 1.5 kOe for Mn1.4PtSn and 0.6 kOe - 1.3 kOe for Mn1.4Pt0.9Pd0.1Sn (marked by arrows in the low-field regime). Further increasing the field gives rise to a broad hump like behavior (marked by arrows in the intermidiate-field regime) in the data before decreasing monotonically at higher fields. This broad hump in the data is well pronounced at temperatures close to the . The corresponding peak/hump positions signify lower () and upper () critical fields that bound the antiskyrmion (AskX) phase. For , the magnetic state is characterized by a helical spin modulation (H), while for , it is a collinear/field-polarized (FP) state. It can be noted here that no peak/hump kind of behavior is found for the curves measured at 100 K and 2 K, signifying the absence of antiskyrmion phase in this temperature regime.
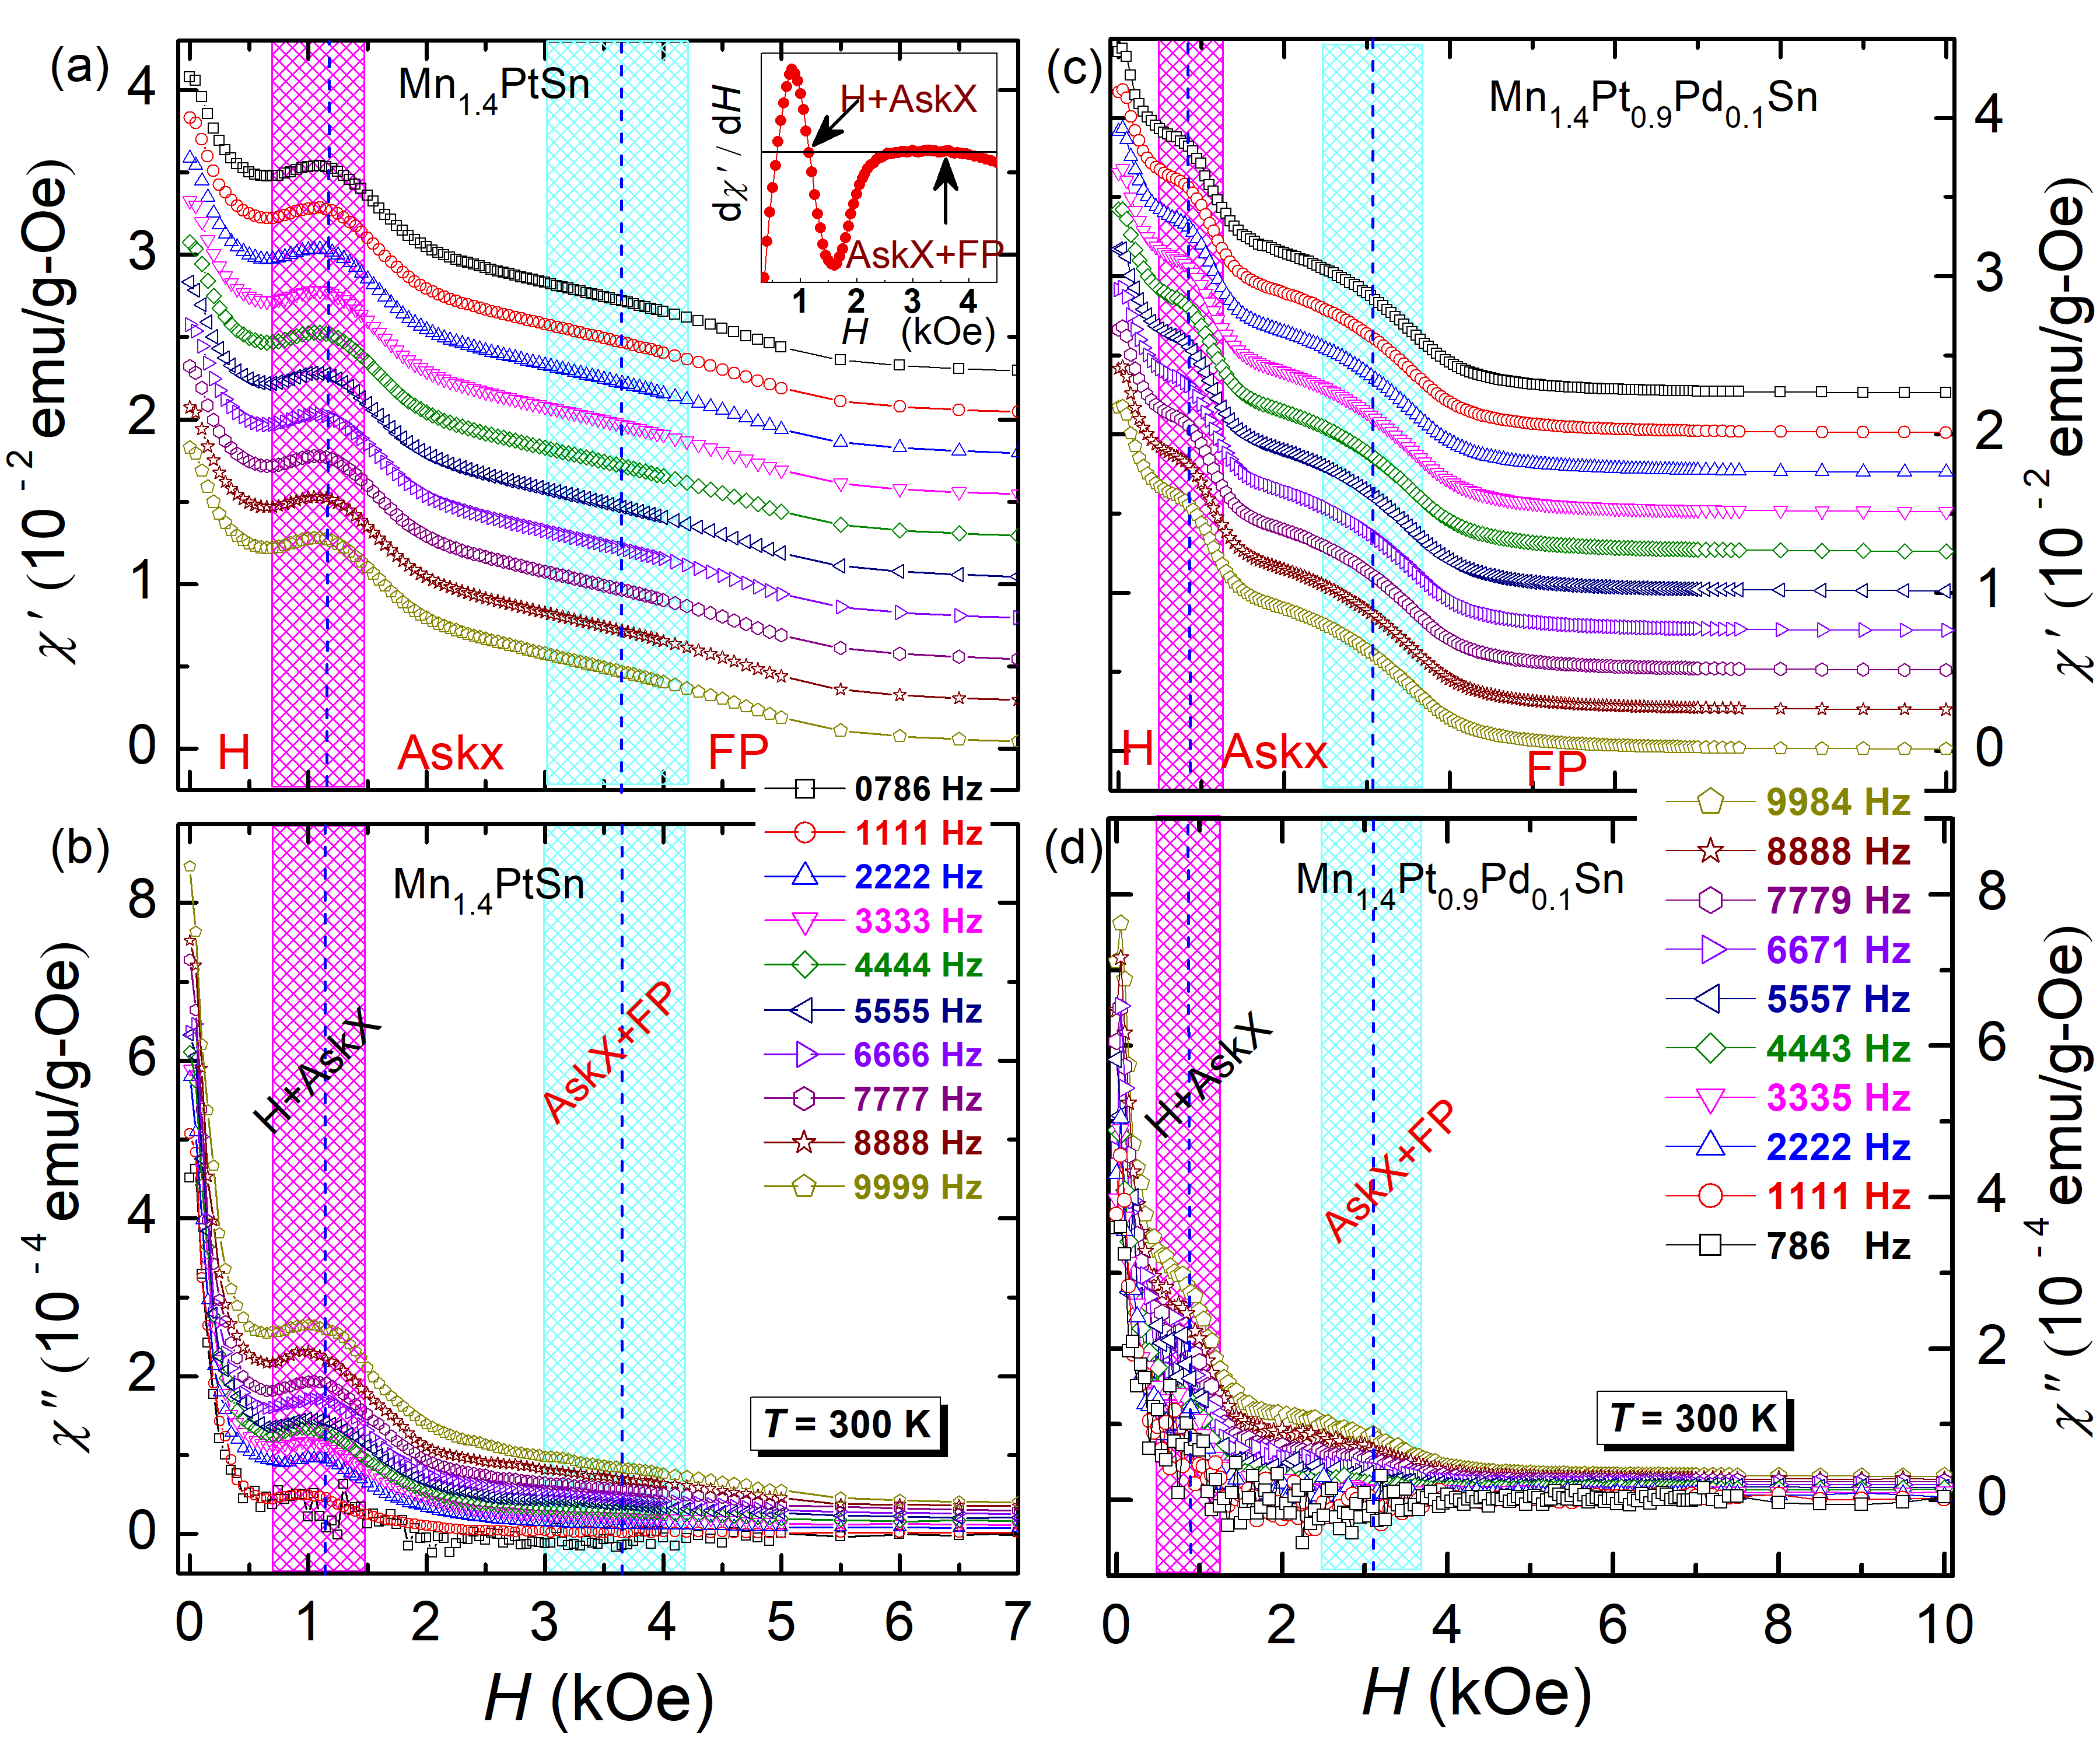
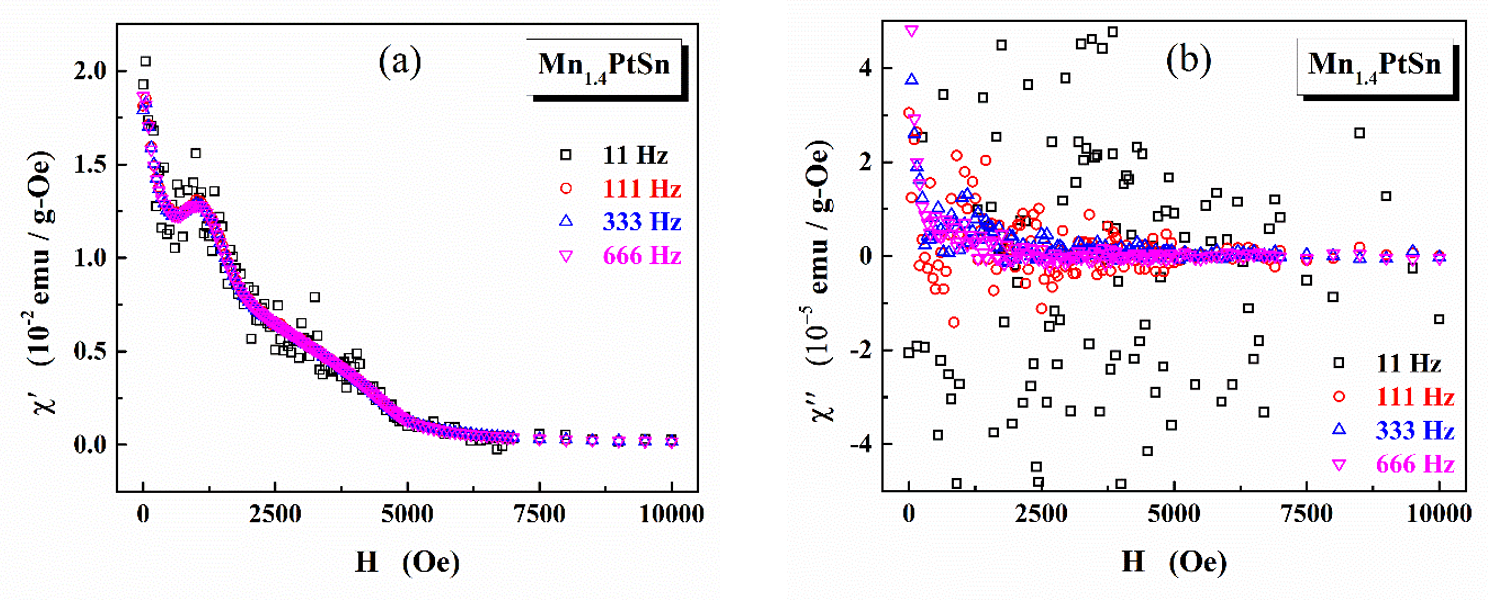
The field dependence of and data measured at 300 K in presence of different frequencies are plotted in Fig. 2. As highlighted by the shaded regions, both and exhibit hump kind of behaviour at the phase transition. Note that the magnitude of is almost independent of the frequency (f) of the , especially when 500 Hz (see Fig. S3) Supp . At low frequencies the response is so weak that the data are statistically scattered and no information can be gained. It is also found that the signal is of about two orders of magnitude smaller than that of and falls close to the instrument resolution limit.
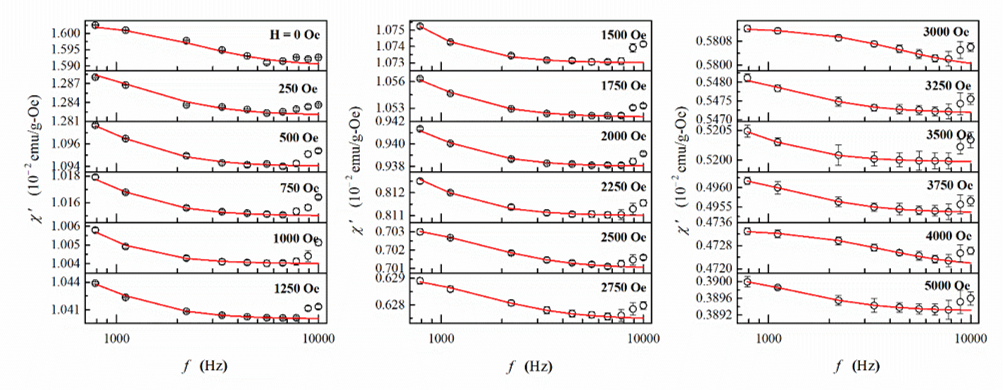
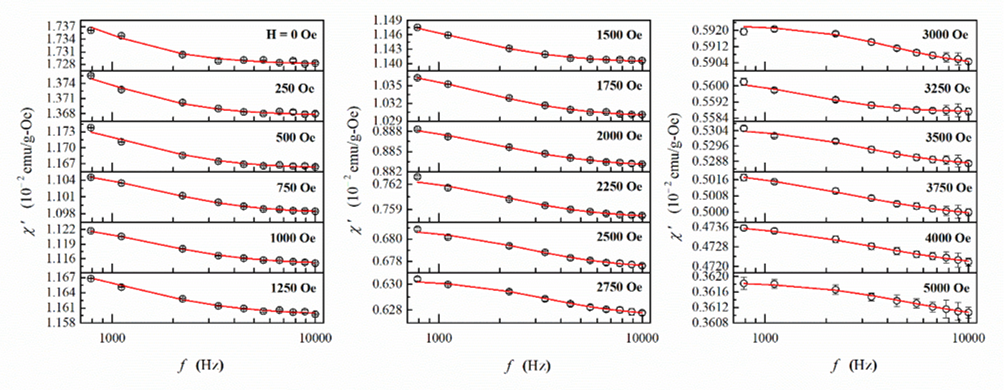
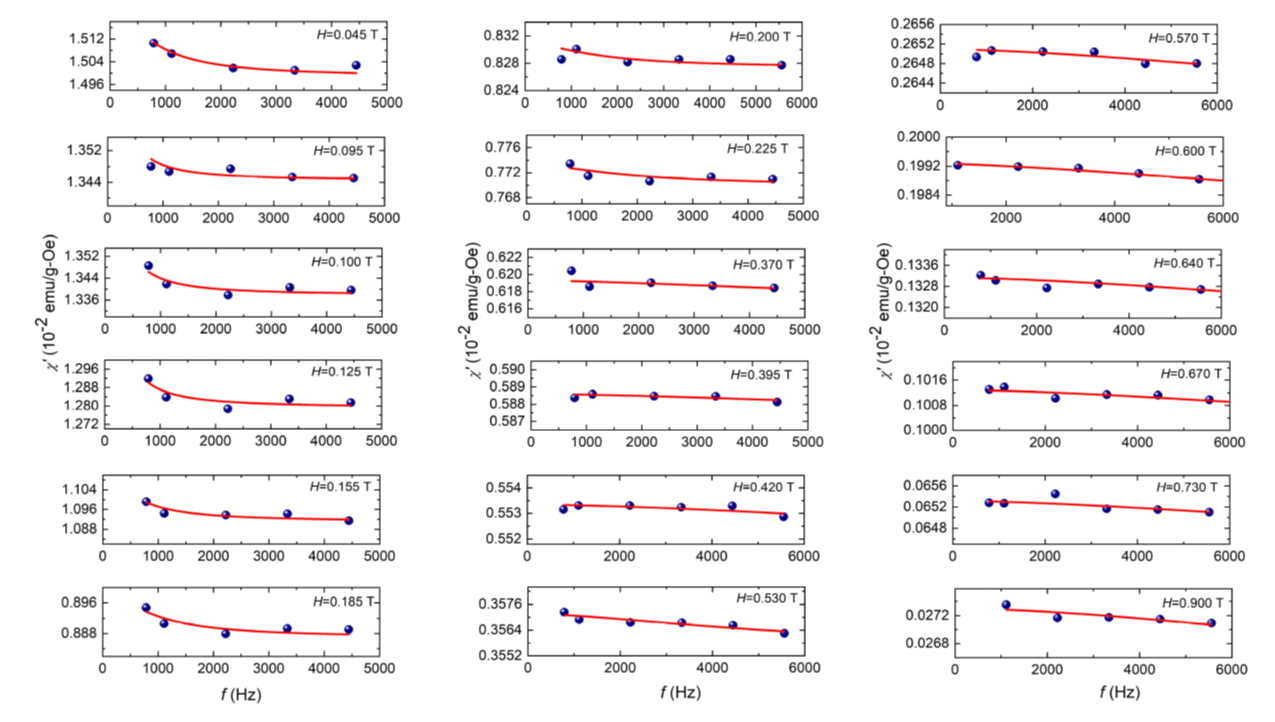
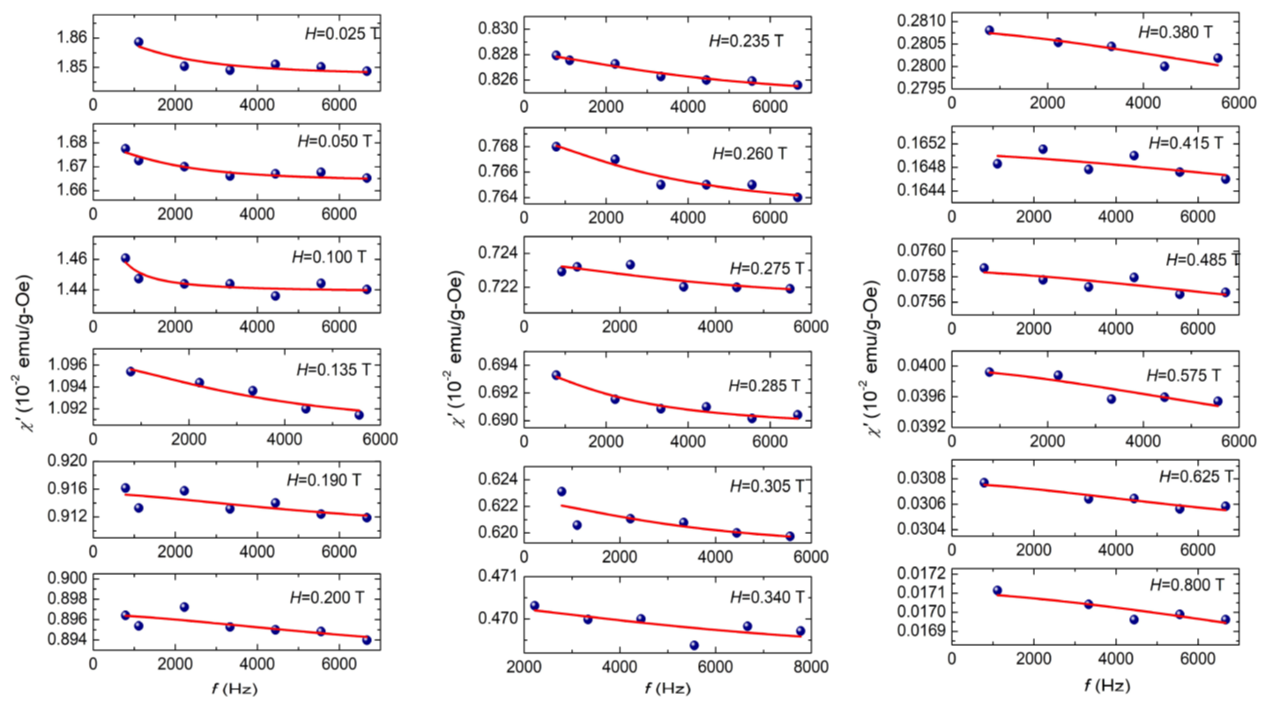
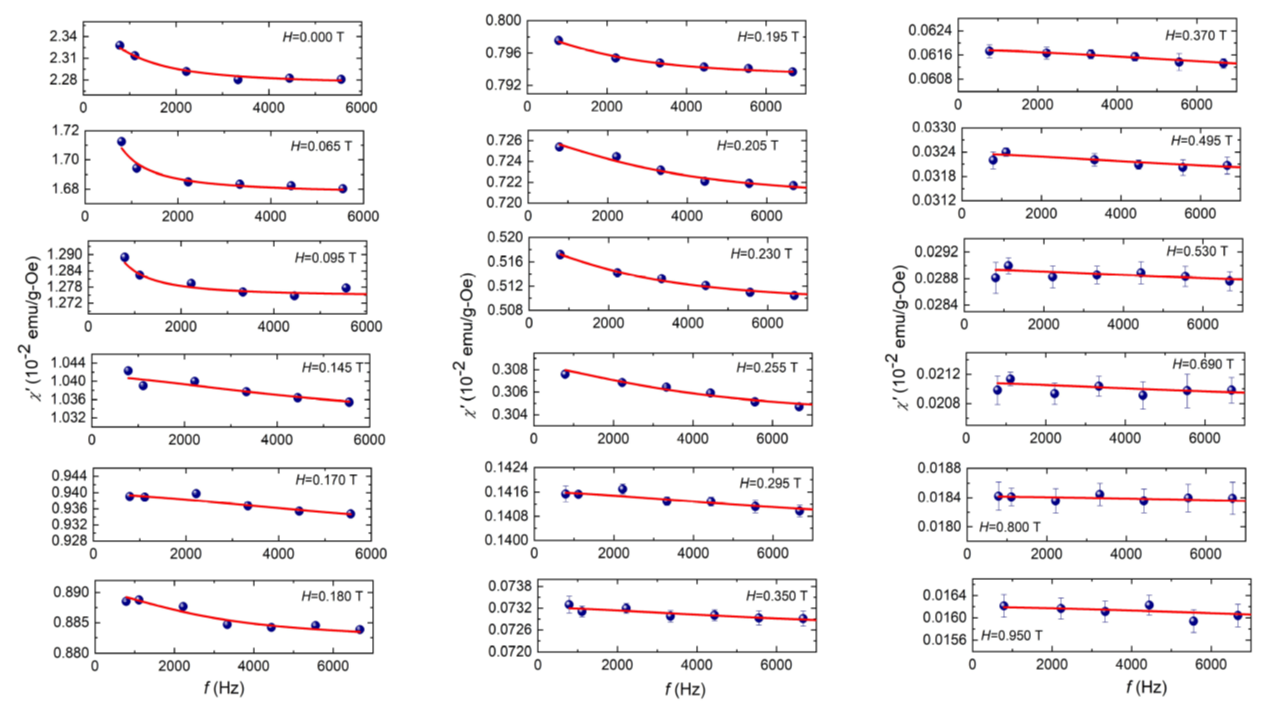
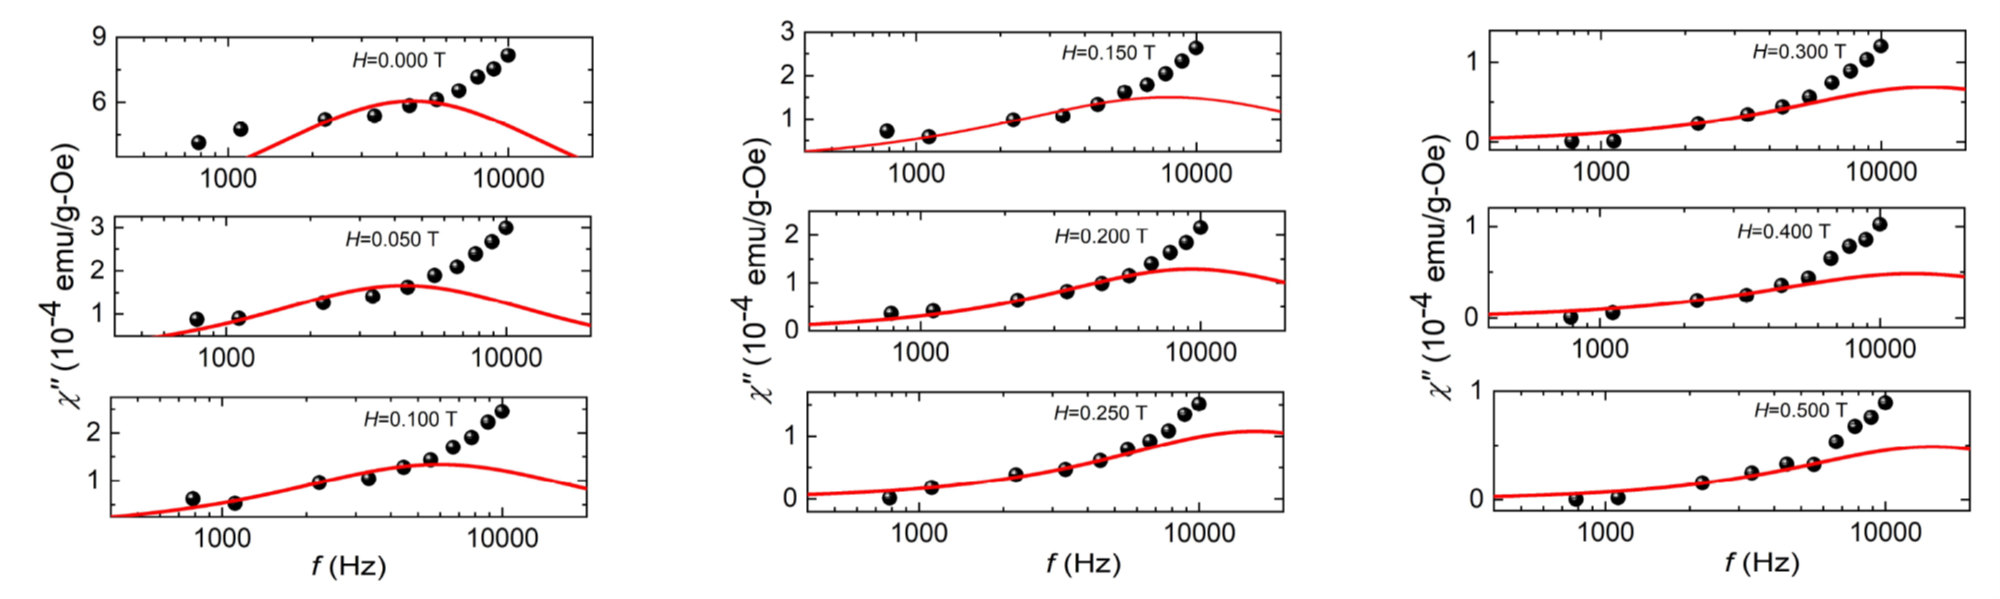
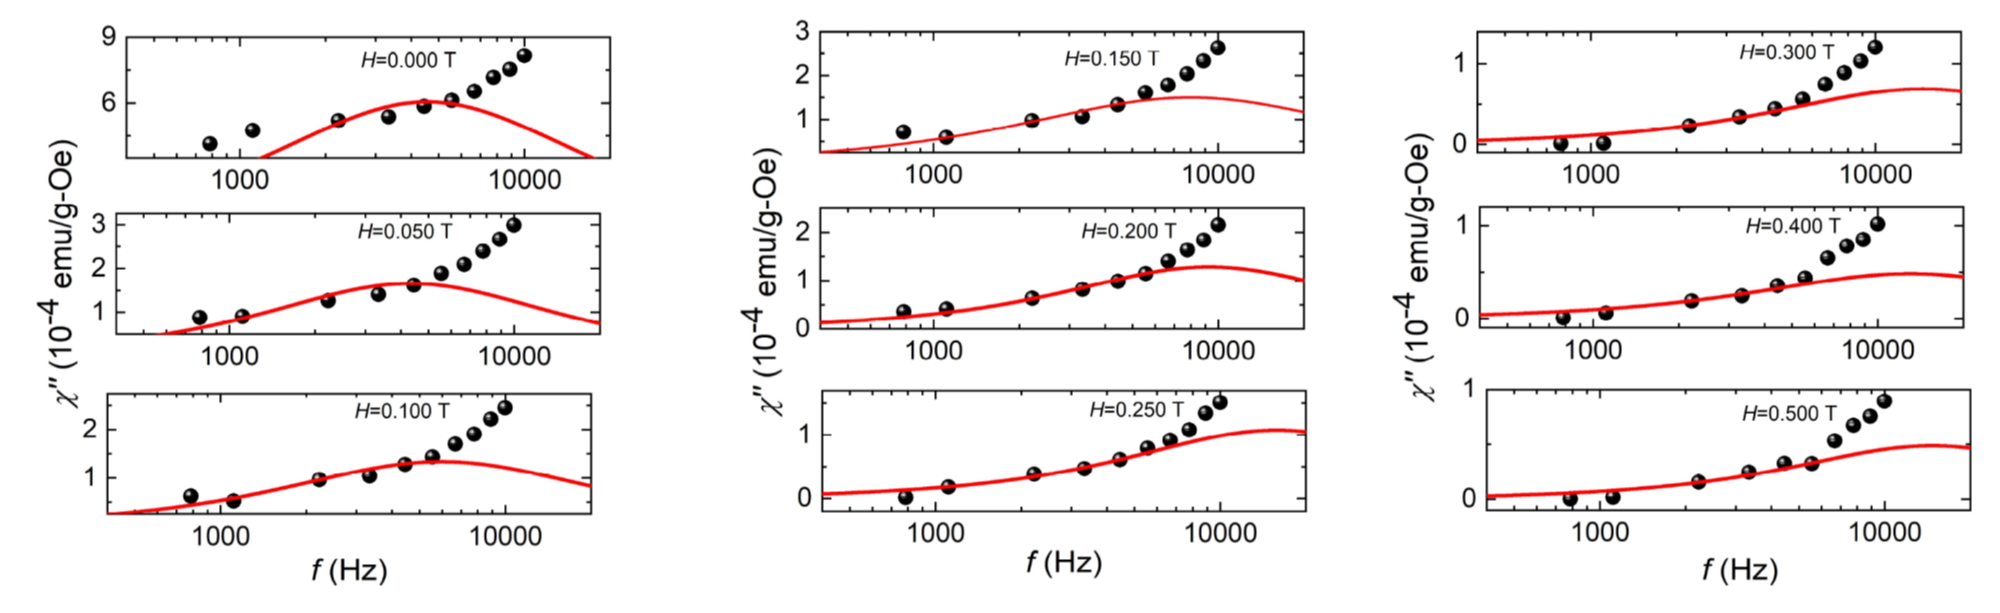
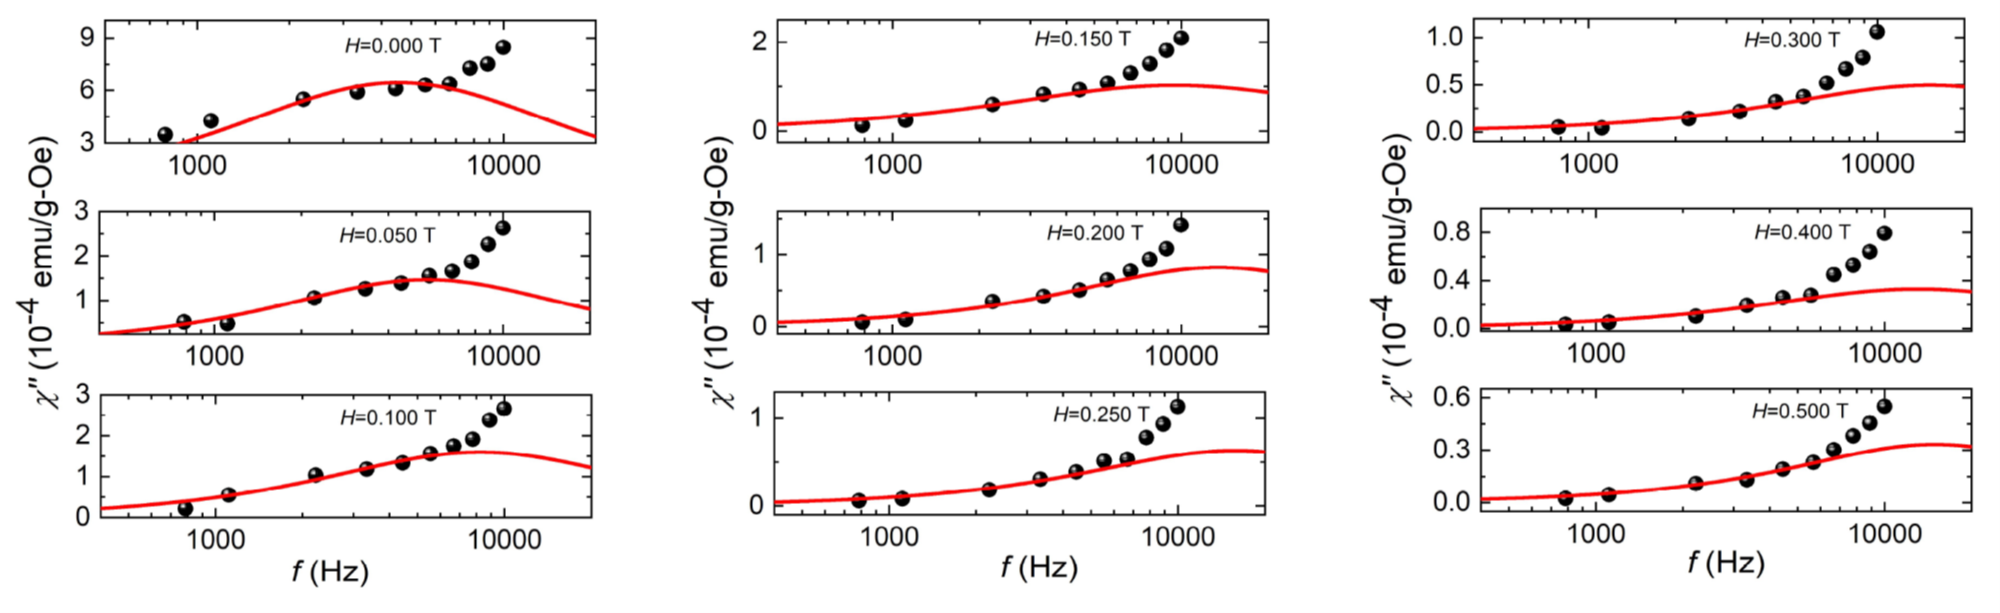
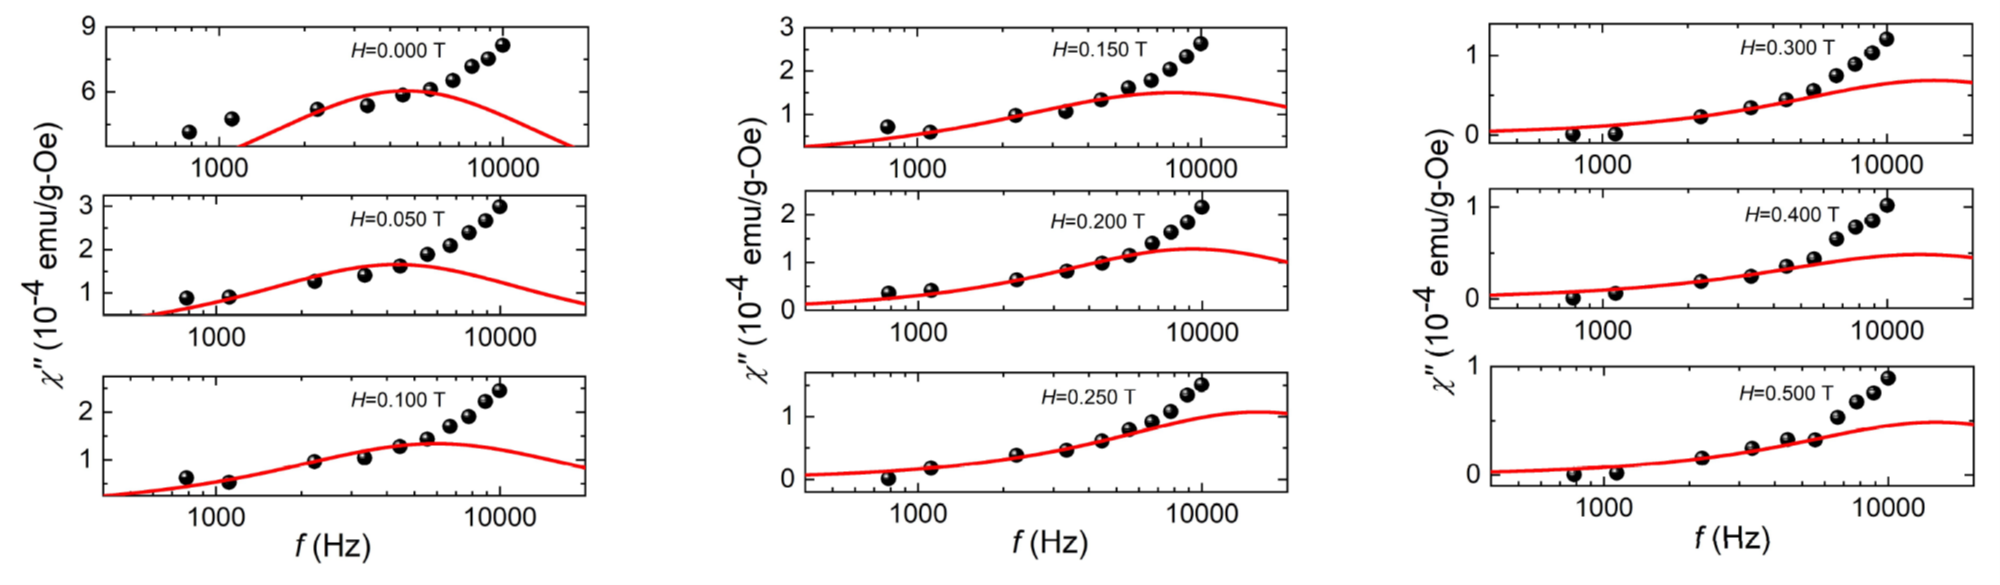
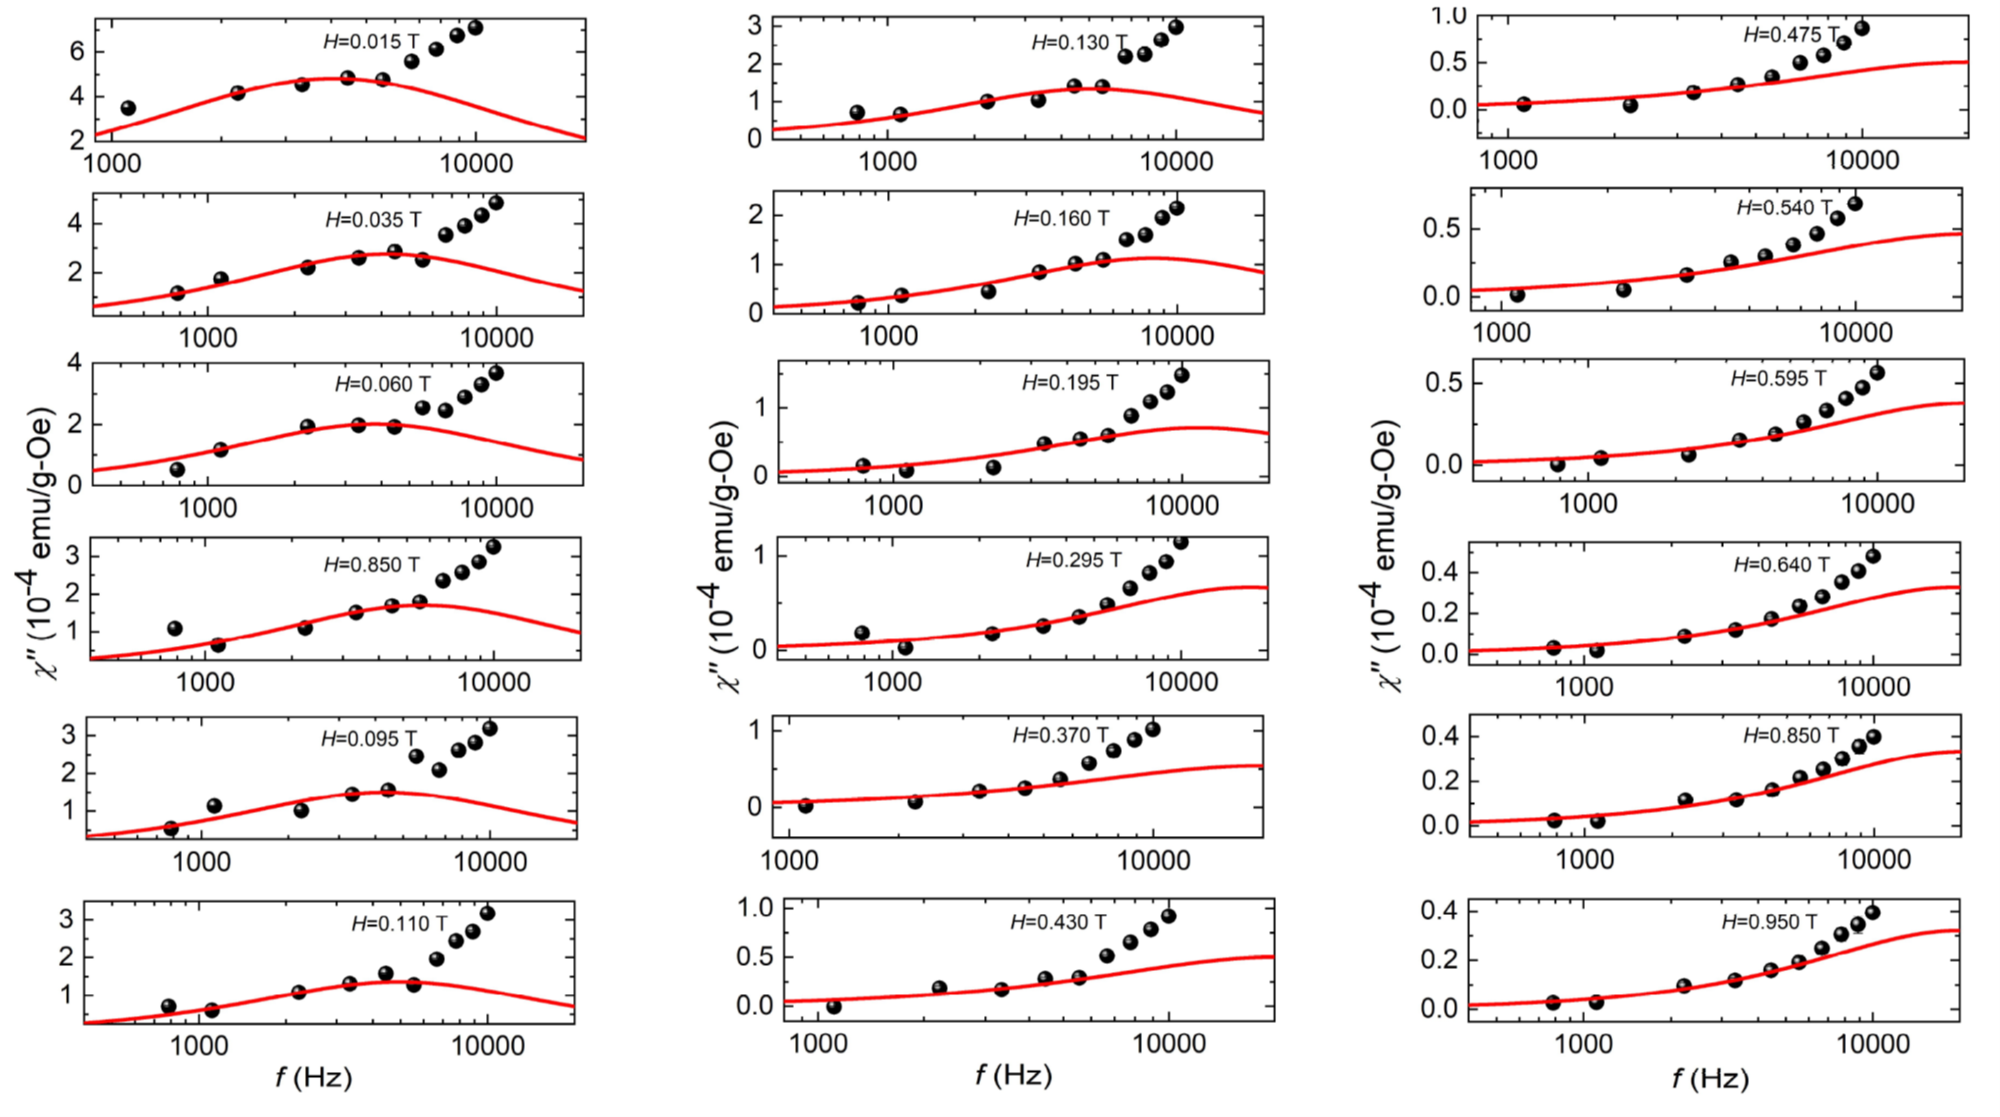
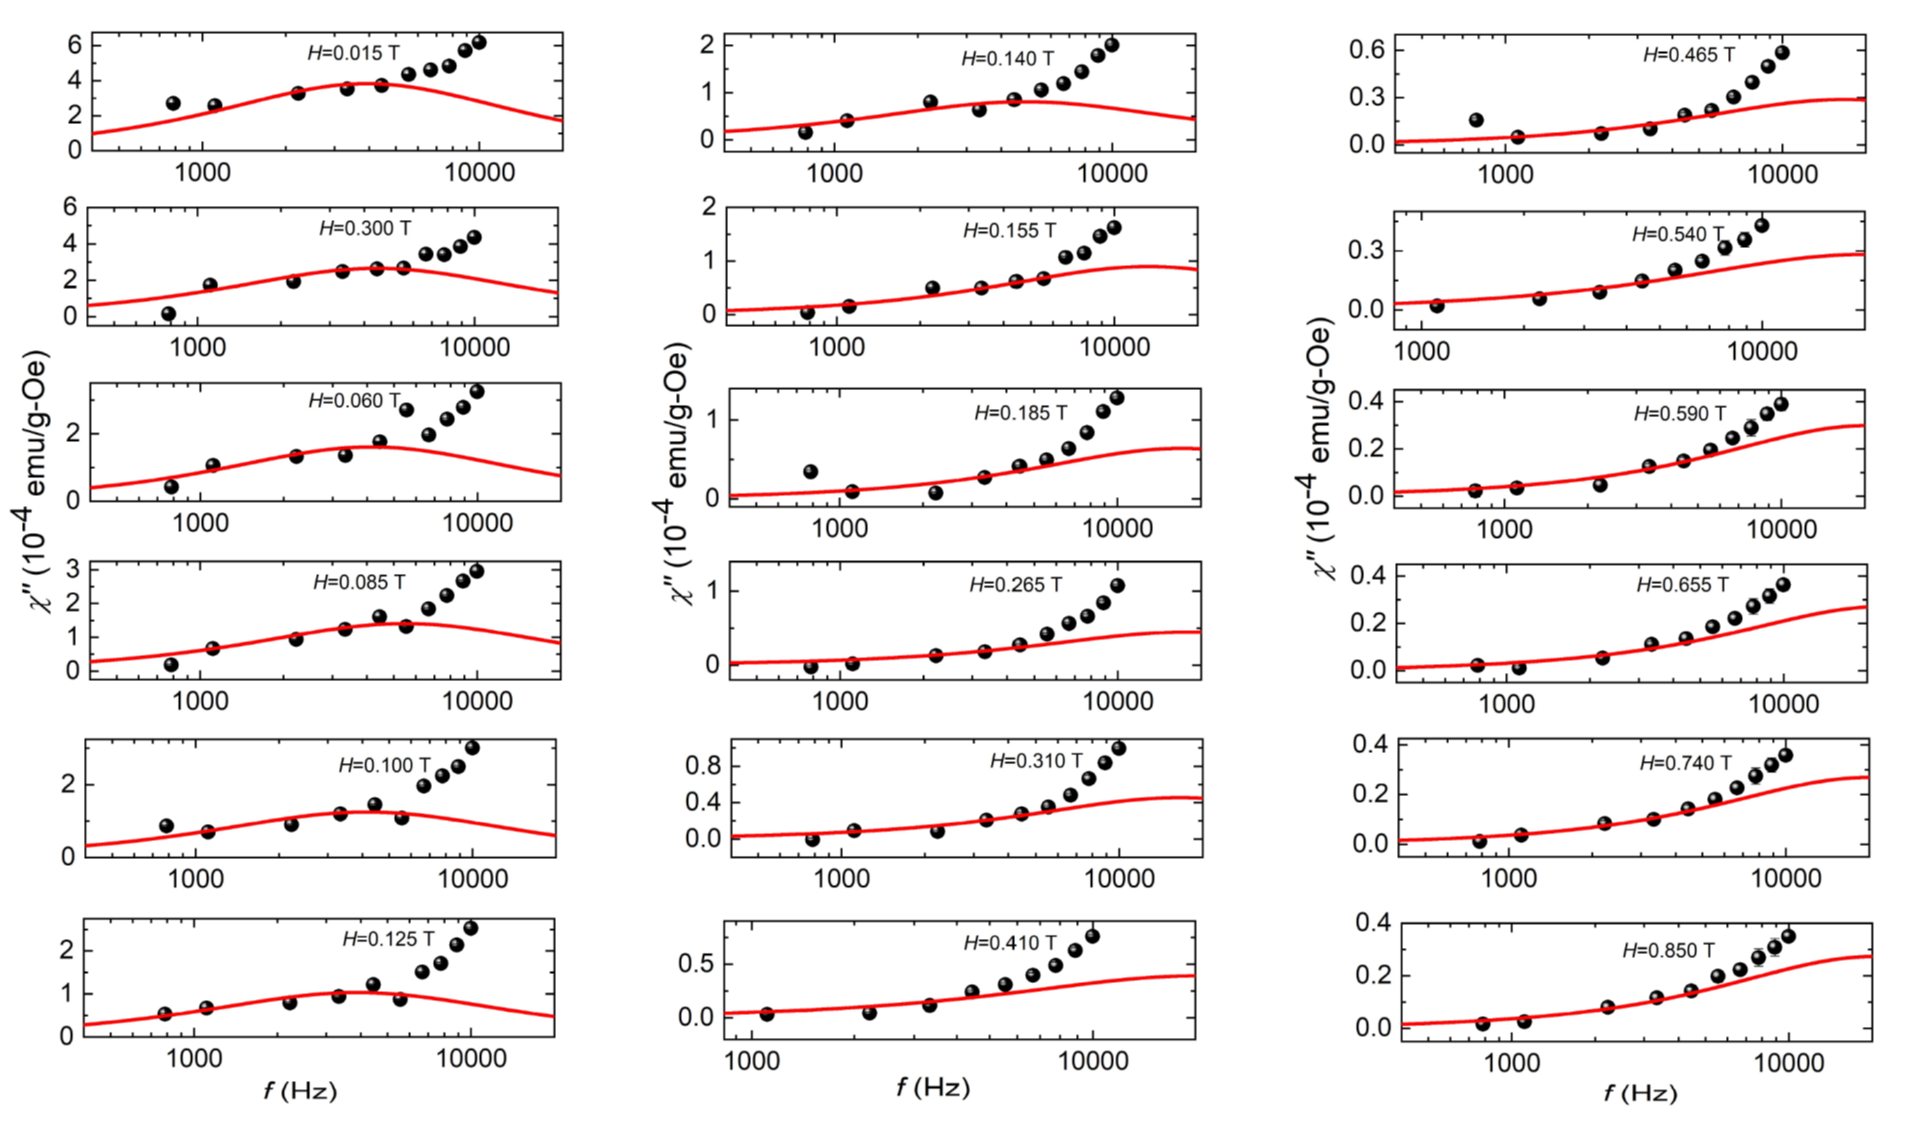
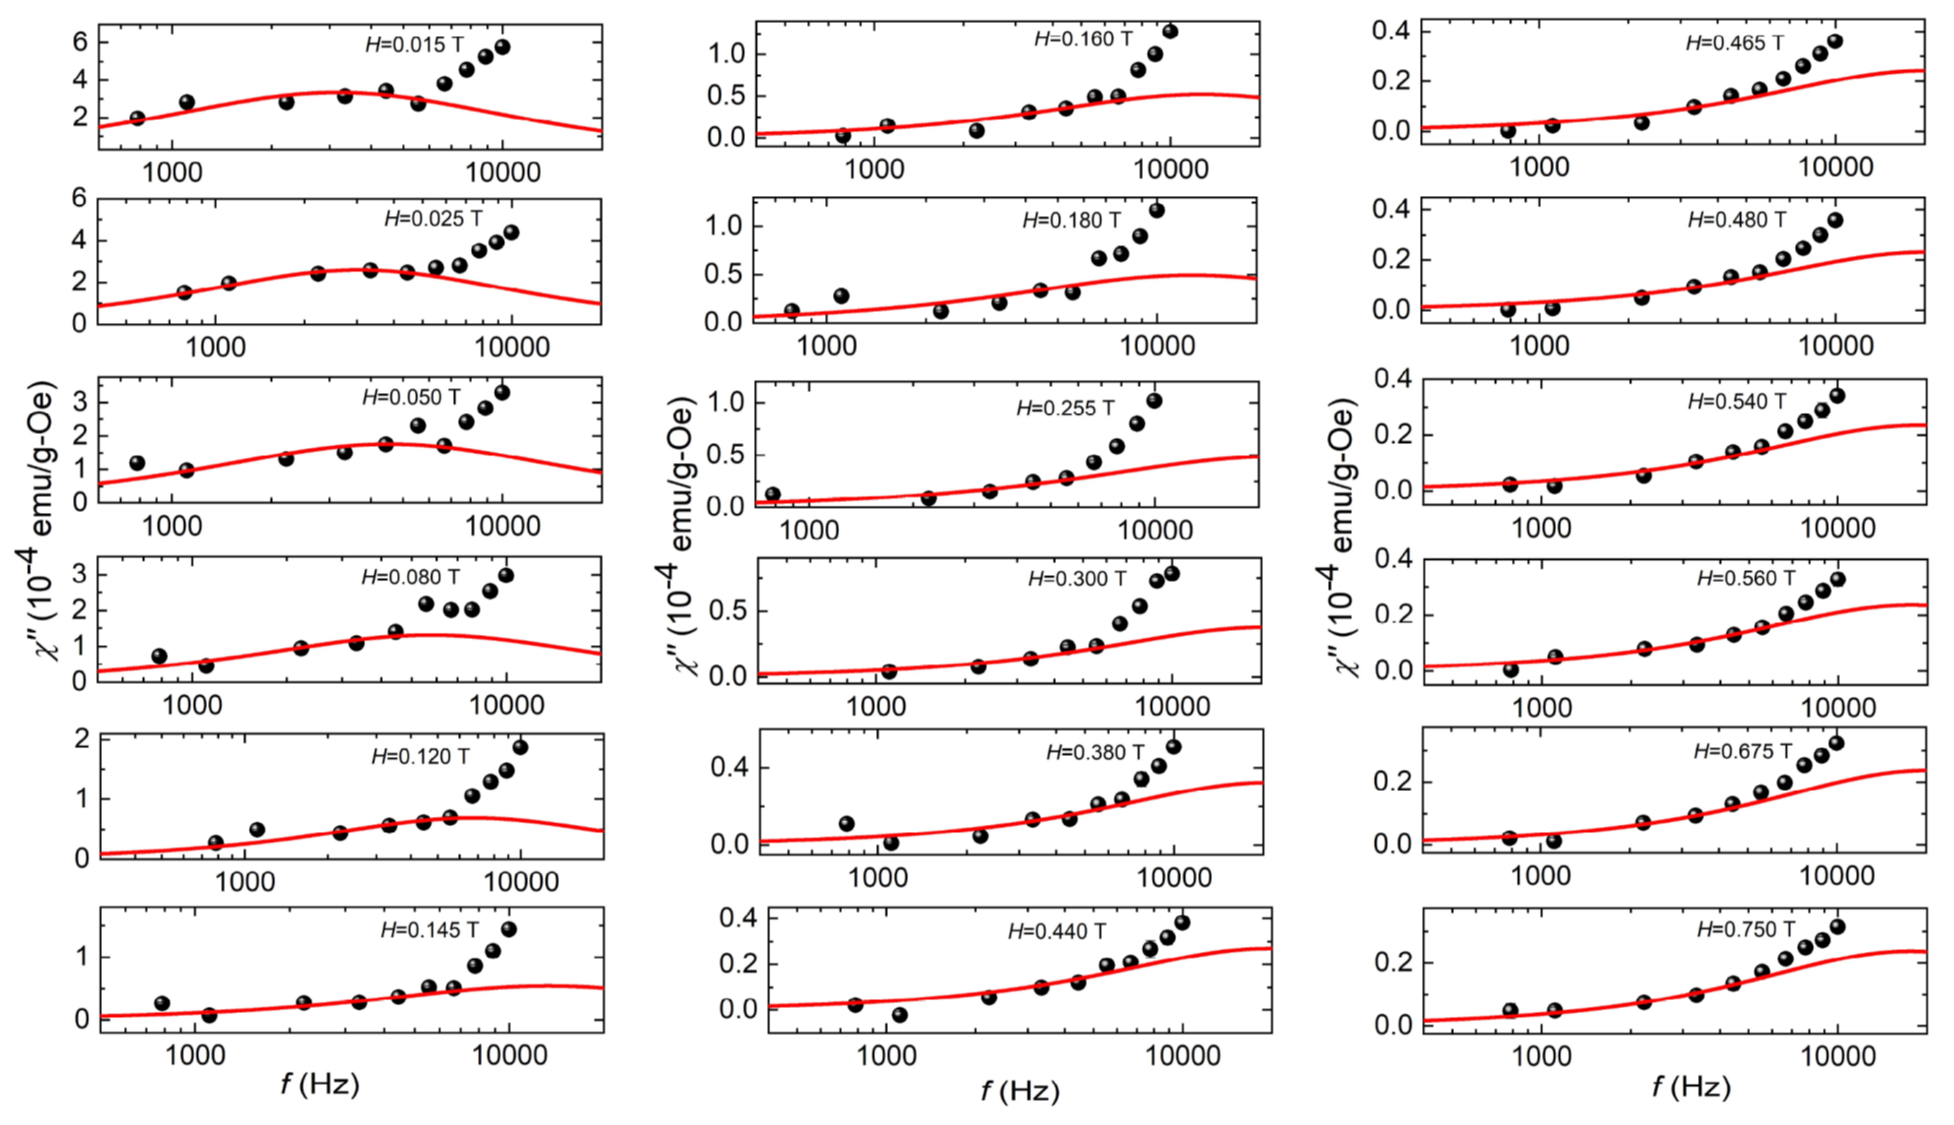
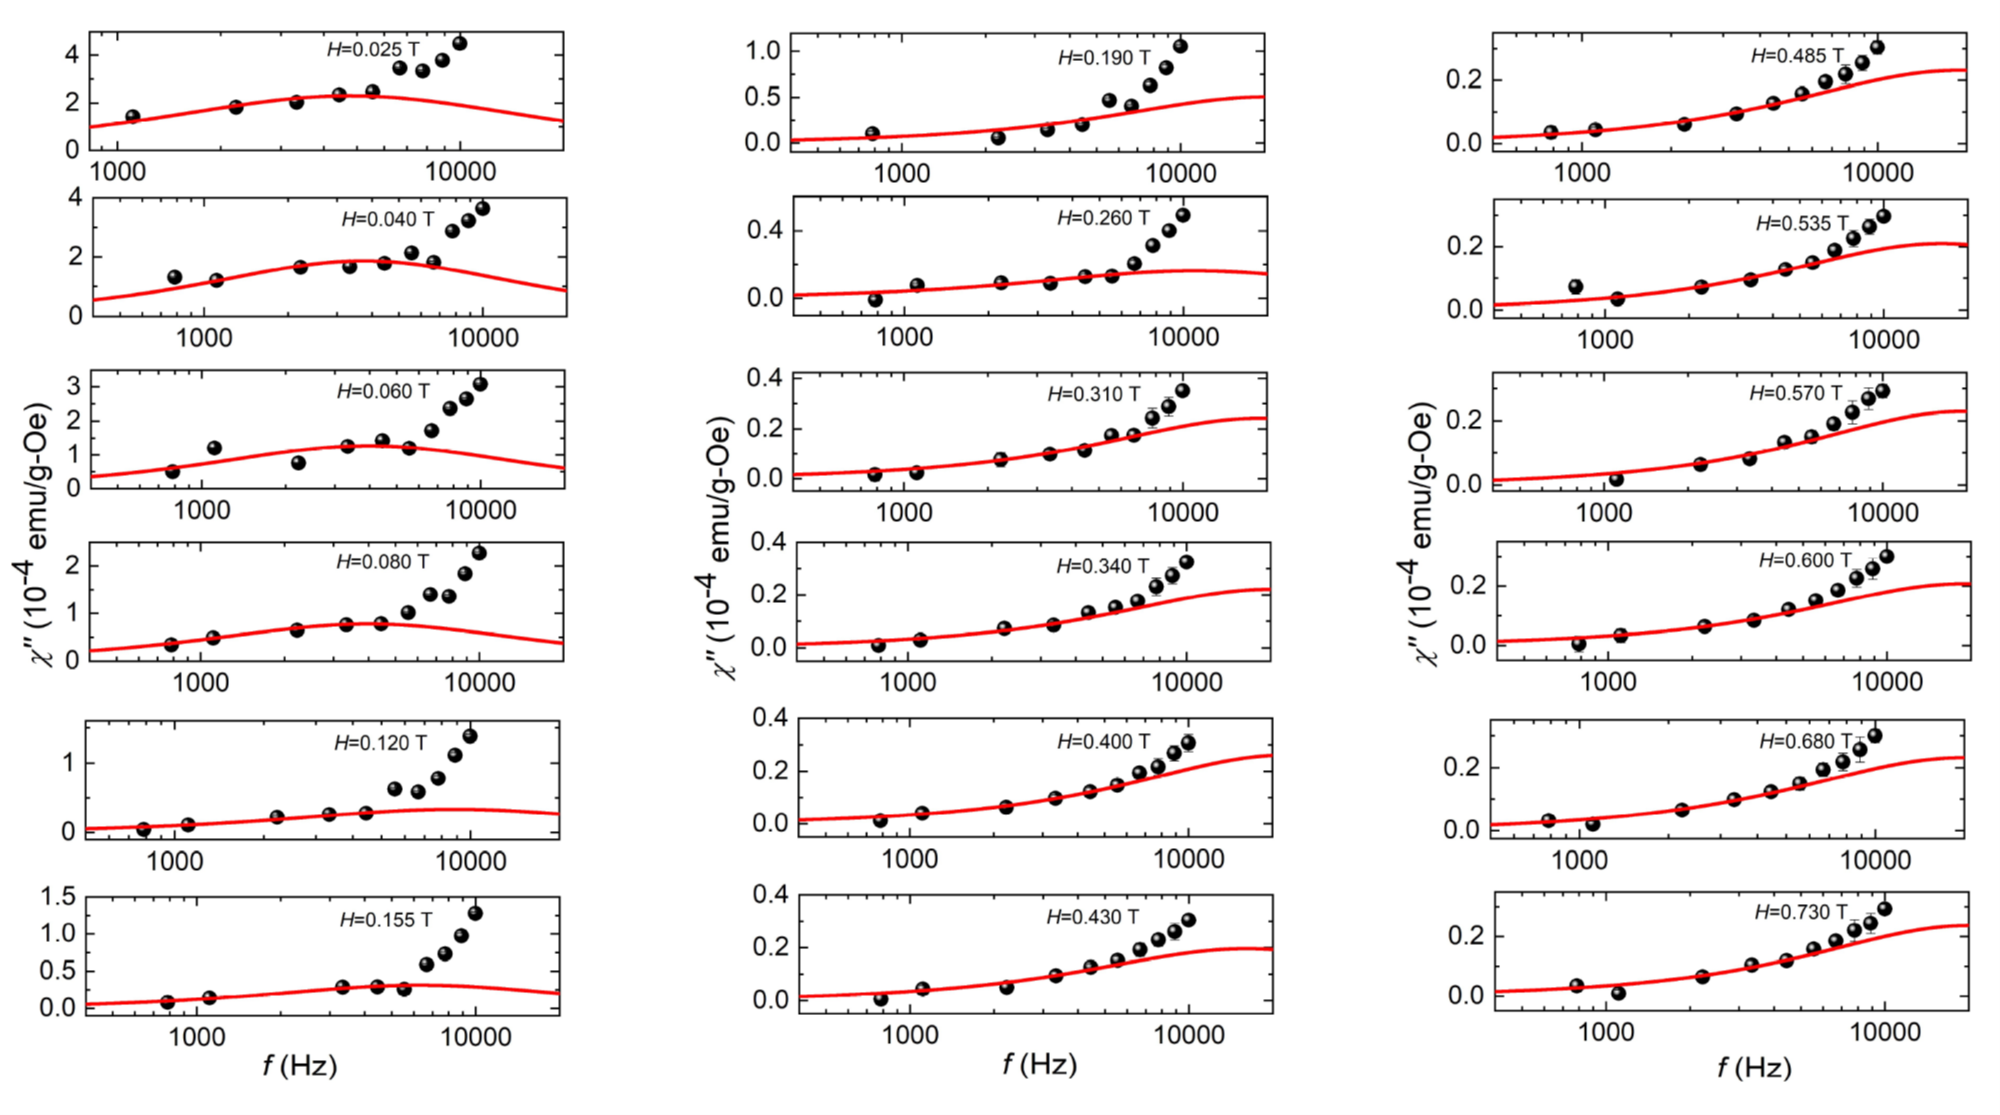
The data at different frequencies over 786 Hz 9999 Hz is re-plotted as to systematically investigate the frequency dependency of at various static magnetic fields covering the helical, AskX and field-polarized magnetic phases. First, we analyze the data for Mn1.4PtSn as shown in Fig. 3(a). The important observations are as follows:
(i) An inflection point in the data indicates that the relaxation in the antiskyrmion host-Mn1.4PtSn happens in a frequency window covered in the present experiment.
(ii) In sharp contrast to the skyrmion hosts Fe1-xCoxSi L.J.Bannenberg , Cu2OSeO3 F.Qian , and GaV4S8 A.Butykai , where the entire magnetic relaxation is observed in the frequency range over 0.1 Hz to 1 kHz, a frequency window ranging from 0.5 kHz to 10 kHz is needed to study the magnetization dynamics in the Mn1.4PtSn. A possible reason for the observed behavior could be comparably high ( 400 K) that signifies a large exchange energy J in the present system. According to Heisenberg’s principle, higher exchange energies leads to shorter switching times as . Hence higher frequencies are needed in order to probe the relaxation dynamics of the present system.
(iii) Noticeable changes are observed in the as one moves gradually from lower to higher magnetic fields. At any given temperature, the inflection point in the shifts to higher frequencies with increasing fields [Fig. 3(a)].
We have attempted to fit the observed variation of and data using the well-known Cole-Cole relation P.Debye ; Casimir ; Cole.Cole as given below,
| (1) |
| (2) |
where A = with , represent adiabatic and isothermal susceptibilities, is the average relaxation time, and ‘’ characterizes the width of the distribution in the relaxation times.
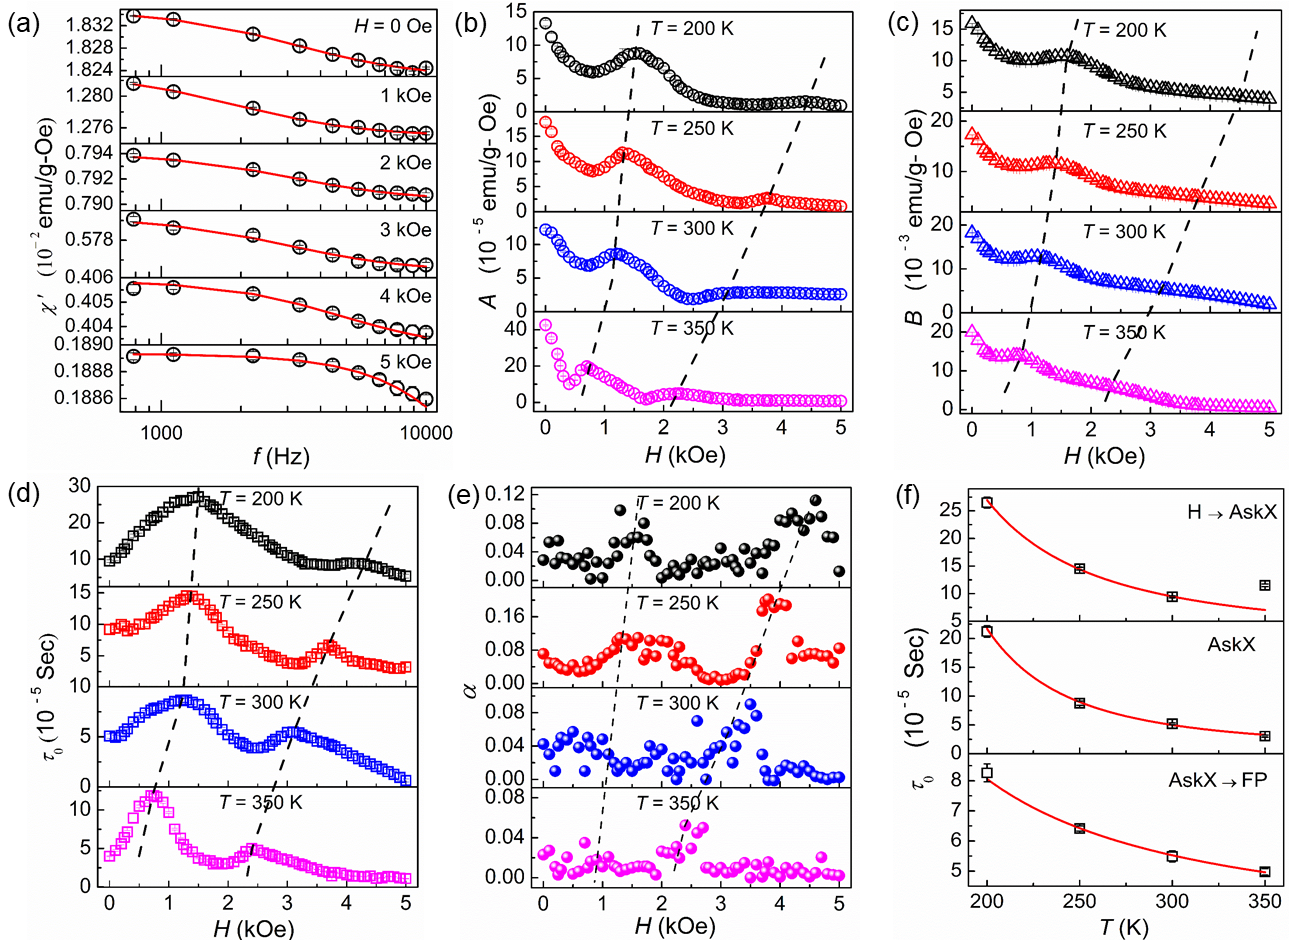
It can be clearly seen from Fig. 3(a) that the fits based on Eq. (1) best represent the observed data. The fit parameters , , , and are obtained at each field step. The magnetic field variation of the fit parameters at different temperatures are shown in Fig. 3 (b)-(e). The following conclusions can be inferred from the field variation of the fit parameters based on the Cole-Cole formalism.
(i) A non-monotonic variation is observed in the field dependency of , , , and . A broad hump kind of behaviour in the field variations of the fit parameters at magnetic field H = [left dashed curves in Fig. 3(b)-(e)] and [right dashed curves in Fig. 3(b)-(e)] is found. These and are temperature sensitive and show a good agreement with the and inferred from the , .
(ii) From figure 3(b), the parameter shows broad maxima at H = and . Higher values of ‘’ highlight prominent magnetic relaxation in the region of the phase coexistence (helical-to-AskX and AskX-to-FP). Butykai et al. A.Butykai attributed this kind of behaviour to the defects in the magnetization profile arising from the incommensurate spin modulations on the verge of magnetic phase transformation.
(iii) The presence of maxima in the at H = and [see Fig. 3(d)] indicates slower magnetization dynamics in the vicinity of the phase transformation that hints at a mixed phase of different magnetic structures. at and is nearly 1.5 to 3 times higher in comparison to the corresponding values in the pure magnetic phases. In case of Fe1-xCoxSi L.J.Bannenberg , Cu2OSeO3 I.Levatic ; F.Qian and GaV4S8 A.Butykai the change in is found to be as large as in the order of 101 to 102. Slower relaxation phenomena characterized by higher relaxation time in the vicinity of phase boundaries signifies possible origin of irregularities in the spin-coordination between different magnetic textures.
(iv) The relaxation time distribution parameter, , takes very small values in the range 0.05 - 0.15. Low values of suggest that the relaxation process of the configurations happens nearly in unison. In other words, topologically protected magnetic antiskyrmions, whether in the long-range ordered lattice (Askx phase) phase or in the disordered state (H+Askx phase / FP+Askx phase), undergo almost simultaneous relaxation. Nevertheless, tends to rise at the phase crossover regions.
(v) Smaller values of 10-5 s, compared to that of 10-3 s reported for the skyrmion host Cu2OSeO3, reflects faster relaxation in Mn1.4PtSn, presumably due to the large spin-orbit coupling introduced by the presence of heavy element ‘Pt’ in the material. In the absence of a quantitative proof, the premise that the strong spin-orbit coupling due to ‘Pt’ is the cause for the faster relaxation times in the present system remains a conjecture only.
(vi) Temperature variation of the characteristic relaxation times corresponding to Helical to AskX and AskX to FP phase are plotted in the upper and lower panels of Fig. 3(f). In general, a field of 2 kOe covers the antiskyrmion phase in the whole range of temperatures in the present study. Hence, the temperature dependence of the relaxation time at = 2 kOe is shown in the central panel of the Fig. 3(f). In all the cases, the relaxation behavior can be described using the well-known Arrhenius law , where characterizes the energy barrier over which the thermal activation takes place. The fits based on the above relation are shown as continuous lines to the data presented in symbols. The fitted values yield activation energies (in the units of temperature, ) of 626(30) K, 882(7) K, 226.5(7.0) K across the H-AskX, AskX, and AskX-FP phases, respectively. A higher value of the energy barrier in the core-antiskyrmion lattice region might have resulted from the strong topological protection. Lower values of E at H-AskX, AskX-FP phase boundaries signals at metastable antiskyrmions, being protected by somewhat lesser energy barriers.
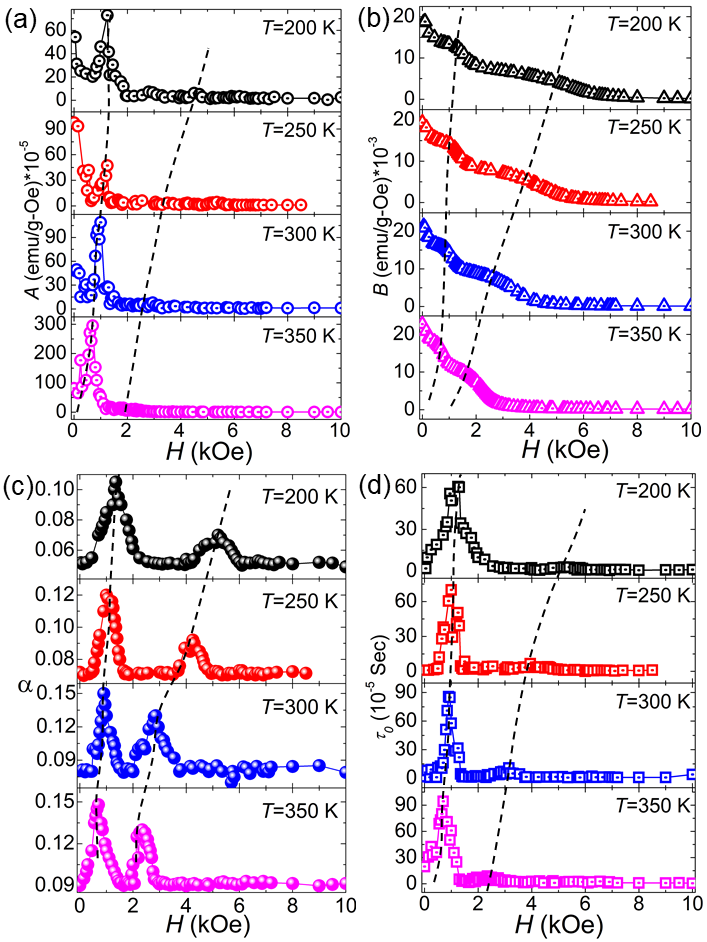
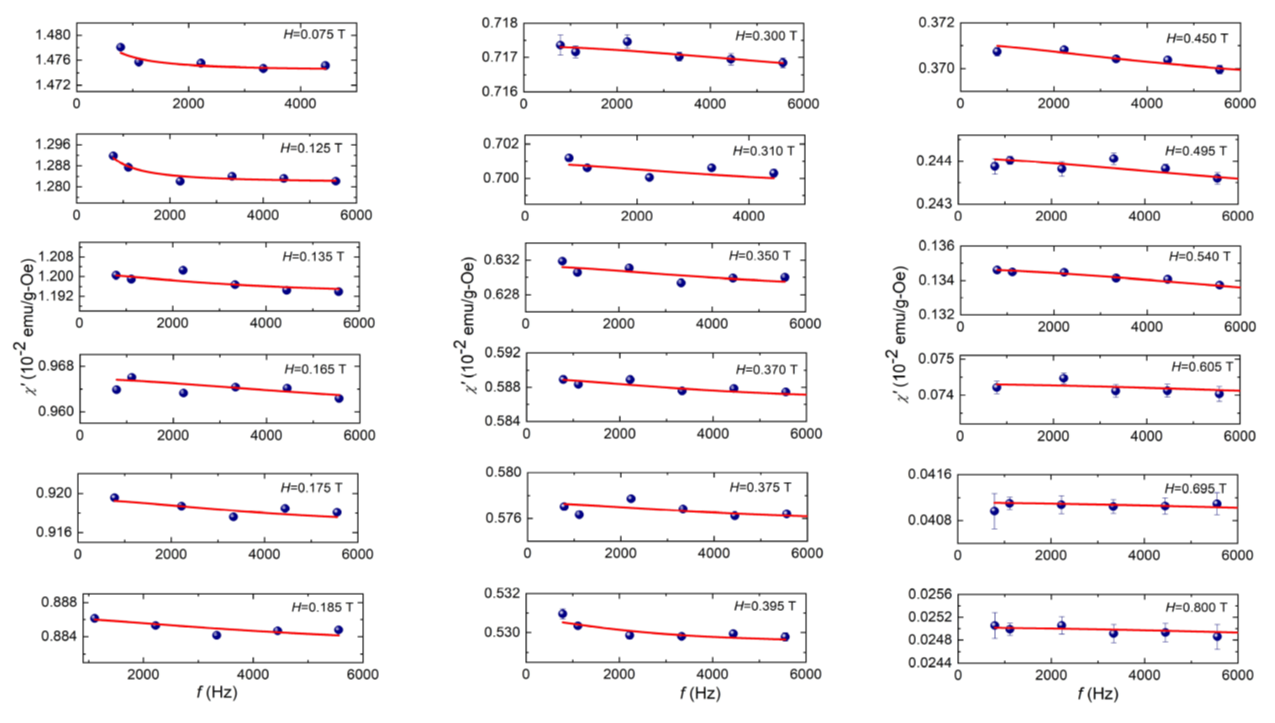
While the observation of antiskyrmion phase in Mn1.4PtSn system was briefly mentioned earlier, a complete microscopic study was reported in case of Mn1.4Pt0.9Pd0.1Sn A.K.Nayak . To further support the present analysis using the Cole-Cole formalism, we have carried out a similar measurement protocol in case of Mn1.4Pt0.9Pd0.1Sn. The frequency dependence of and data are fitted using the Cole-Cole relation as discussed earlier Supp . Various fit parameters obtained from the fitting are plotted in Fig. 4. As it can be seen, all the parameters , , , and display a well-defined peak at the low-field regime indicating the nucleation of antiskyrmion phase with application of magnetic fields. Similarly, a hump kind of behaviour is observed at higher fields for , and , and a clear peak nature is found in case of the relaxation time distribution parameter, . In addition, all the fit parameters fall in the same range as that is realized in case of Mn1.4PtSn. All these findings further validate the present method of characterizing antiskyrmion phase in the tetragonal Heusler materials.
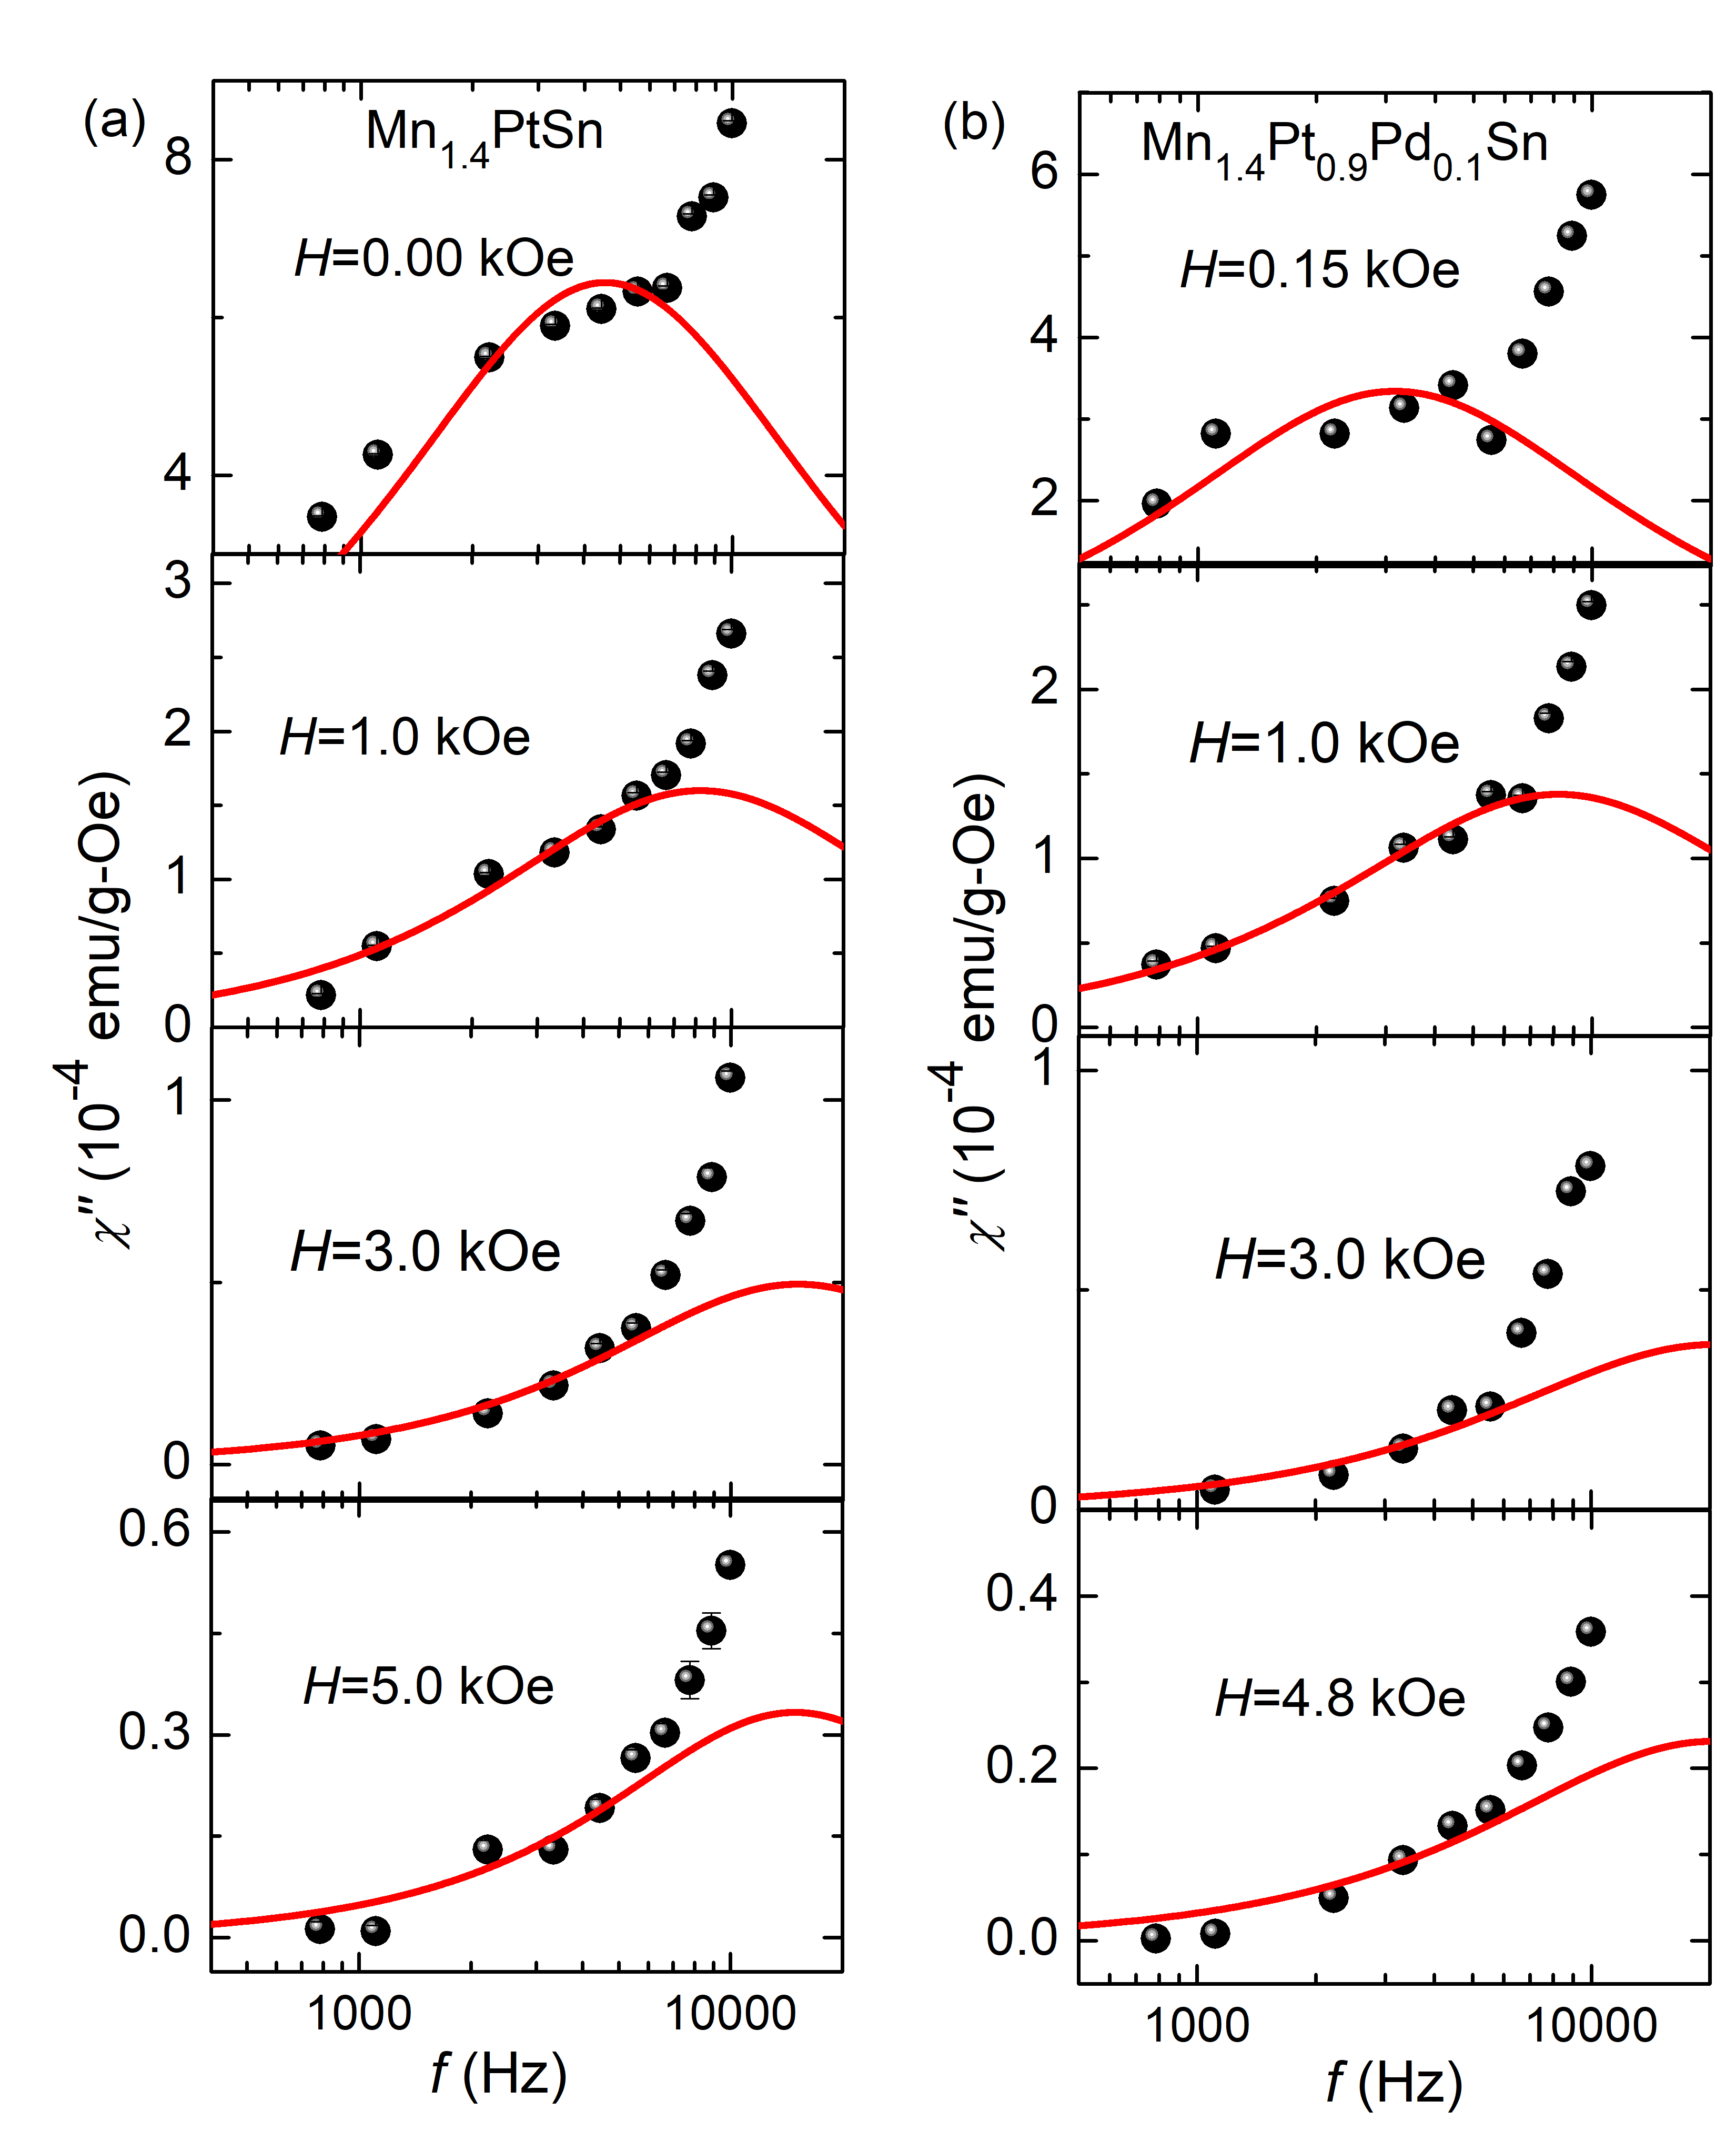
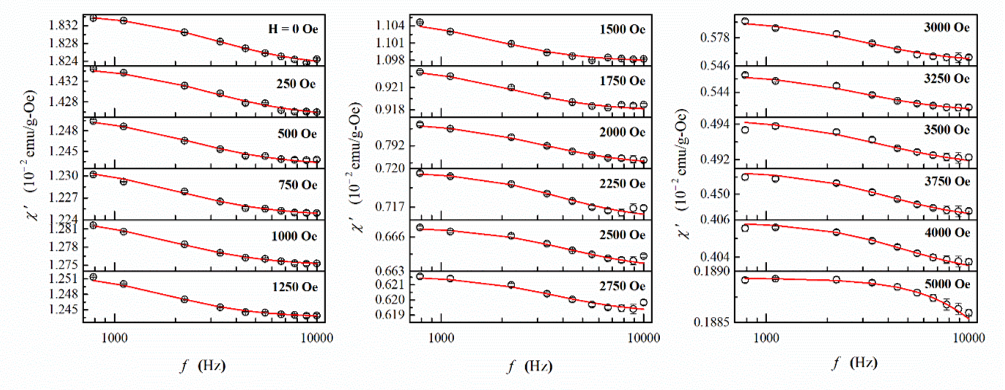
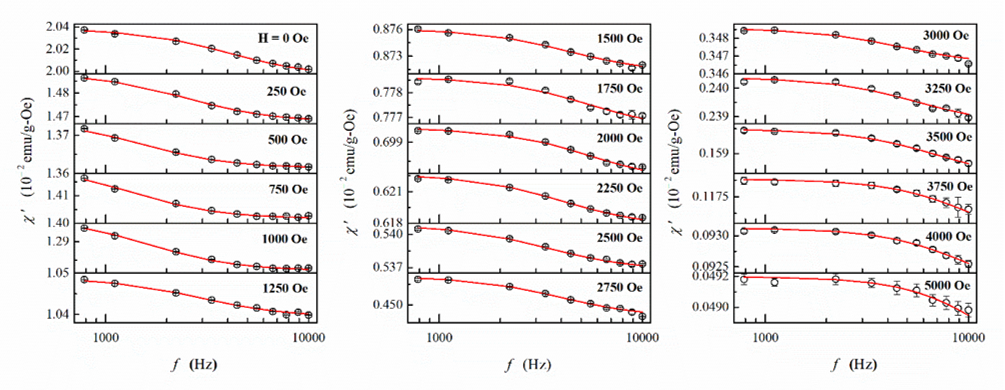
It is well-known that the out-of-phase component of the ac-susceptibility in the Debye model like relaxation shows a peak at a characteristic frequency (). However, in the present case the data show a shoulder nearly at where goes through an inflection point as shown in Fig. 5. A complete range of data at different temperatures and magnetic fields can be found in the supplementary information Supp . We have attempted to fit the data using Eq. 2 as depicted by solid lines in Fig. 5. We use the fit parameters obtained from the analysis as inputs for the fitting of data. Then the parameters were relaxed to obtain the best fitting. However, we could not fit the data in the whole frequency range owing to the lack of complete peak kind of behaviour, in the case of both Mn1.4PtSn and Mn1.4Pt0.9Pd0.1Sn. A good match between the experimental data and the fitted curve is obtained only up to the frequency where shows a shoulder like behavior. This is true for all the temperatures and fields covered in the present study Supp . The fit parameters obtained from the analysis fall in the same order of magnitude as that found from the fitting. A comparison of fit parameters acquired from the and fittings at 300 K for both Mn1.4PtSn and Mn1.4Pt0.9Pd0.1Sn is presented in Table I. Interestingly, both the samples exhibit similar magnitude of the respective fit parameters, suggesting presence of similar relaxation dynamics in the present systems. This can be understand from the fact that both the samples display identical magnetic ordering with almost equal .
| H(Oe) | A( 10-5 emu/g-Oe) | ( 10-5 s) | ||||
|---|---|---|---|---|---|---|
| 0 a | 12.220 | 149.000 | 5.070 | 3.500 | 0.042 | 0.092 |
| b | 54.193 | 122.358 | 1.536 | 6.623 | 0.081 | 0.080 |
| 500 a | 7.379 | 27.071 | 6.943 | 3.060 | 0.057 | 0.045 |
| b | 15.122 | 40.136 | 10.979 | 3.501 | 0.103 | 0.083 |
| 1000 a | 8.051 | 36.280 | 8.287 | 1.930 | 0.048 | 0.080 |
| b | 87.357 | 26.957 | 57.727 | 2.359 | 0.130 | 0.082 |
| 1500 a | 7.340 | 25.208 | 8.671 | 1.682 | 0.010 | 0.128 |
| b | 10.476 | 12.345 | 1.480 | 1.214 | 0.086 | 0.081 |
| 2000 a | 3.784 | 17.365 | 5.198 | 1.185 | 0.036 | 0.034 |
| b | 5.337 | 10.251 | 1.944 | 0.946 | 0.107 | 0.080 |
| 2500 a | 1.873 | 13.680 | 3.880 | 1.006 | 0.020 | 0.051 |
| b | 3.998 | 8.724 | 2.516 | 0.872 | 0.104 | 0.083 |
| 3000 a | 2.761 | 10.721 | 5.437 | 1.048 | 0.040 | 0.051 |
| b | 7.762 | 8.969 | 6.971 | 0.989 | 0.121 | 0.082 |
| 3500 a | 2.863 | 9.767 | 4.567 | 1.301 | 0.090 | 0.040 |
| b | 3.803 | 8.113 | 4.383 | 0.824 | 0.092 | 0.088 |
| 4000 a | 2.835 | 7.383 | 3.389 | 1.222 | 0.020 | 0.070 |
| b | 2.224 | 6.138 | 1.314 | 0.805 | 0.084 | 0.085 |
| 5000 a | 2.584 | 6.873 | 0.628 | 1.067 | 0.010 | 0.020 |
| b | 1.253 | 6.297 | 1.470 | 0.854 | 0.082 | 0.084 |
| aMn1.4PtSn, bMn1.4Pt0.9Pd0.1Sn |
The deviation of the present data from the Debye model like relaxation could stem from the eddy current losses that adversely affect the susceptibility signals, particularly at higher frequencies and higher dc fields. In general, the voltage induced in the pick-up coil by the eddy currents generated in the sample is much smaller when compared to the main voltage induced from the sample in response to the applied ac magnetic field. As a result, the eddy current effect can be clearly seen when the actual signal is very weak Kraftmakher . In the present case, the eddy current effect is predominant in case of as the signal of magnitude emu/Oe falls in the sensitivity limit of the measuring instrumen. Similar magnitude of the eddy current effect of the order /mol or emu/Oe is also found in the data at 1 kHz frequency in case of the semiconducting skyrmion host Fe1-xCoxSi L.J.Bannenberg . The eddy current effect in the previously studied skyrmion hosting materials could not be seen prominantly due to the fact that the magnetic relaxation in these systems happens in low frequency regime spanning up to 1 kHz, whereas, the present antiskyrmion materials require frequencies up to 10 kHz to study the ralaxation process.
|
(s) | |
|---|---|---|
| Canonical/Cluster spin glassesJ.A.Mydosh | 10-12 - 10-8 | |
| SuperparamagnetsS.J.Blundell2 | 10-11 - 10-9 | |
| Single molecular magentsL.Thomas | 10-6 | |
| Skyrmion-Cu2OSeO3F.Qian (50 10 nm) | 10-3 - 10-2 | |
| Antiskyrmion-Mn1.4Pt(Pd)Sn (150 20 nm) | 10-5 - 10-4 |
It is customary here to compare various magnetic systems that display non-trivial and finite-sized magnetic configurations such as spin glasses, superparamagnetic particles, single molecular magnets, and skyrmion lattices that exhibit slow magnetic relaxations and characterized by Debye relation. Table 2 compares the typical relaxation times in such systems. In case of spin glasses, the reorientation of individual magnetic moments or clusters during the relaxation process causes additional frustrations. This result in further rearrangements of the local spins in the system leading to slower magnetization dynamics. In superparamagnets and single molecular magnets, slow magnetic relaxation arises from the thermally-activated hopping of the spins(macro) over energy barriers dictated by the uniaxial anisotropy which separates parallel and anti-parallel configurations. A phase crossover from helical spin modulations to skyrmion/antiskyrmion lattice associates with topological point defects X.Z.Yu . It is reported that the reorientation of large magnetic entities, such as modulations in the long-wavelength spin helices, nucleation of skyrmion cores, and glassy nature of the skyrmion phases Rajeswari leads to slower magnetization dynamics in different skyrmion hosts A.Bauer ; L.J.Bannenberg ; I.Levatic ; F.Qian ; A.Butykai . Similar phenomena are also expected in the present antiskyrmion host Mn-Pt(Pd)-Sn materials. Higher relaxation time ( s), i.e., slower relaxation process in the skyrmion/antiskyrmion systems when compared to others signifies slower magnetic damping process, which suppresses the rate at which an equilibrium configuration can be restored. In this regard, resonance studies of the magnetization dynamics can help to understand the stability and reliability of future skyrmion/antiskyrmion-based spintronics.
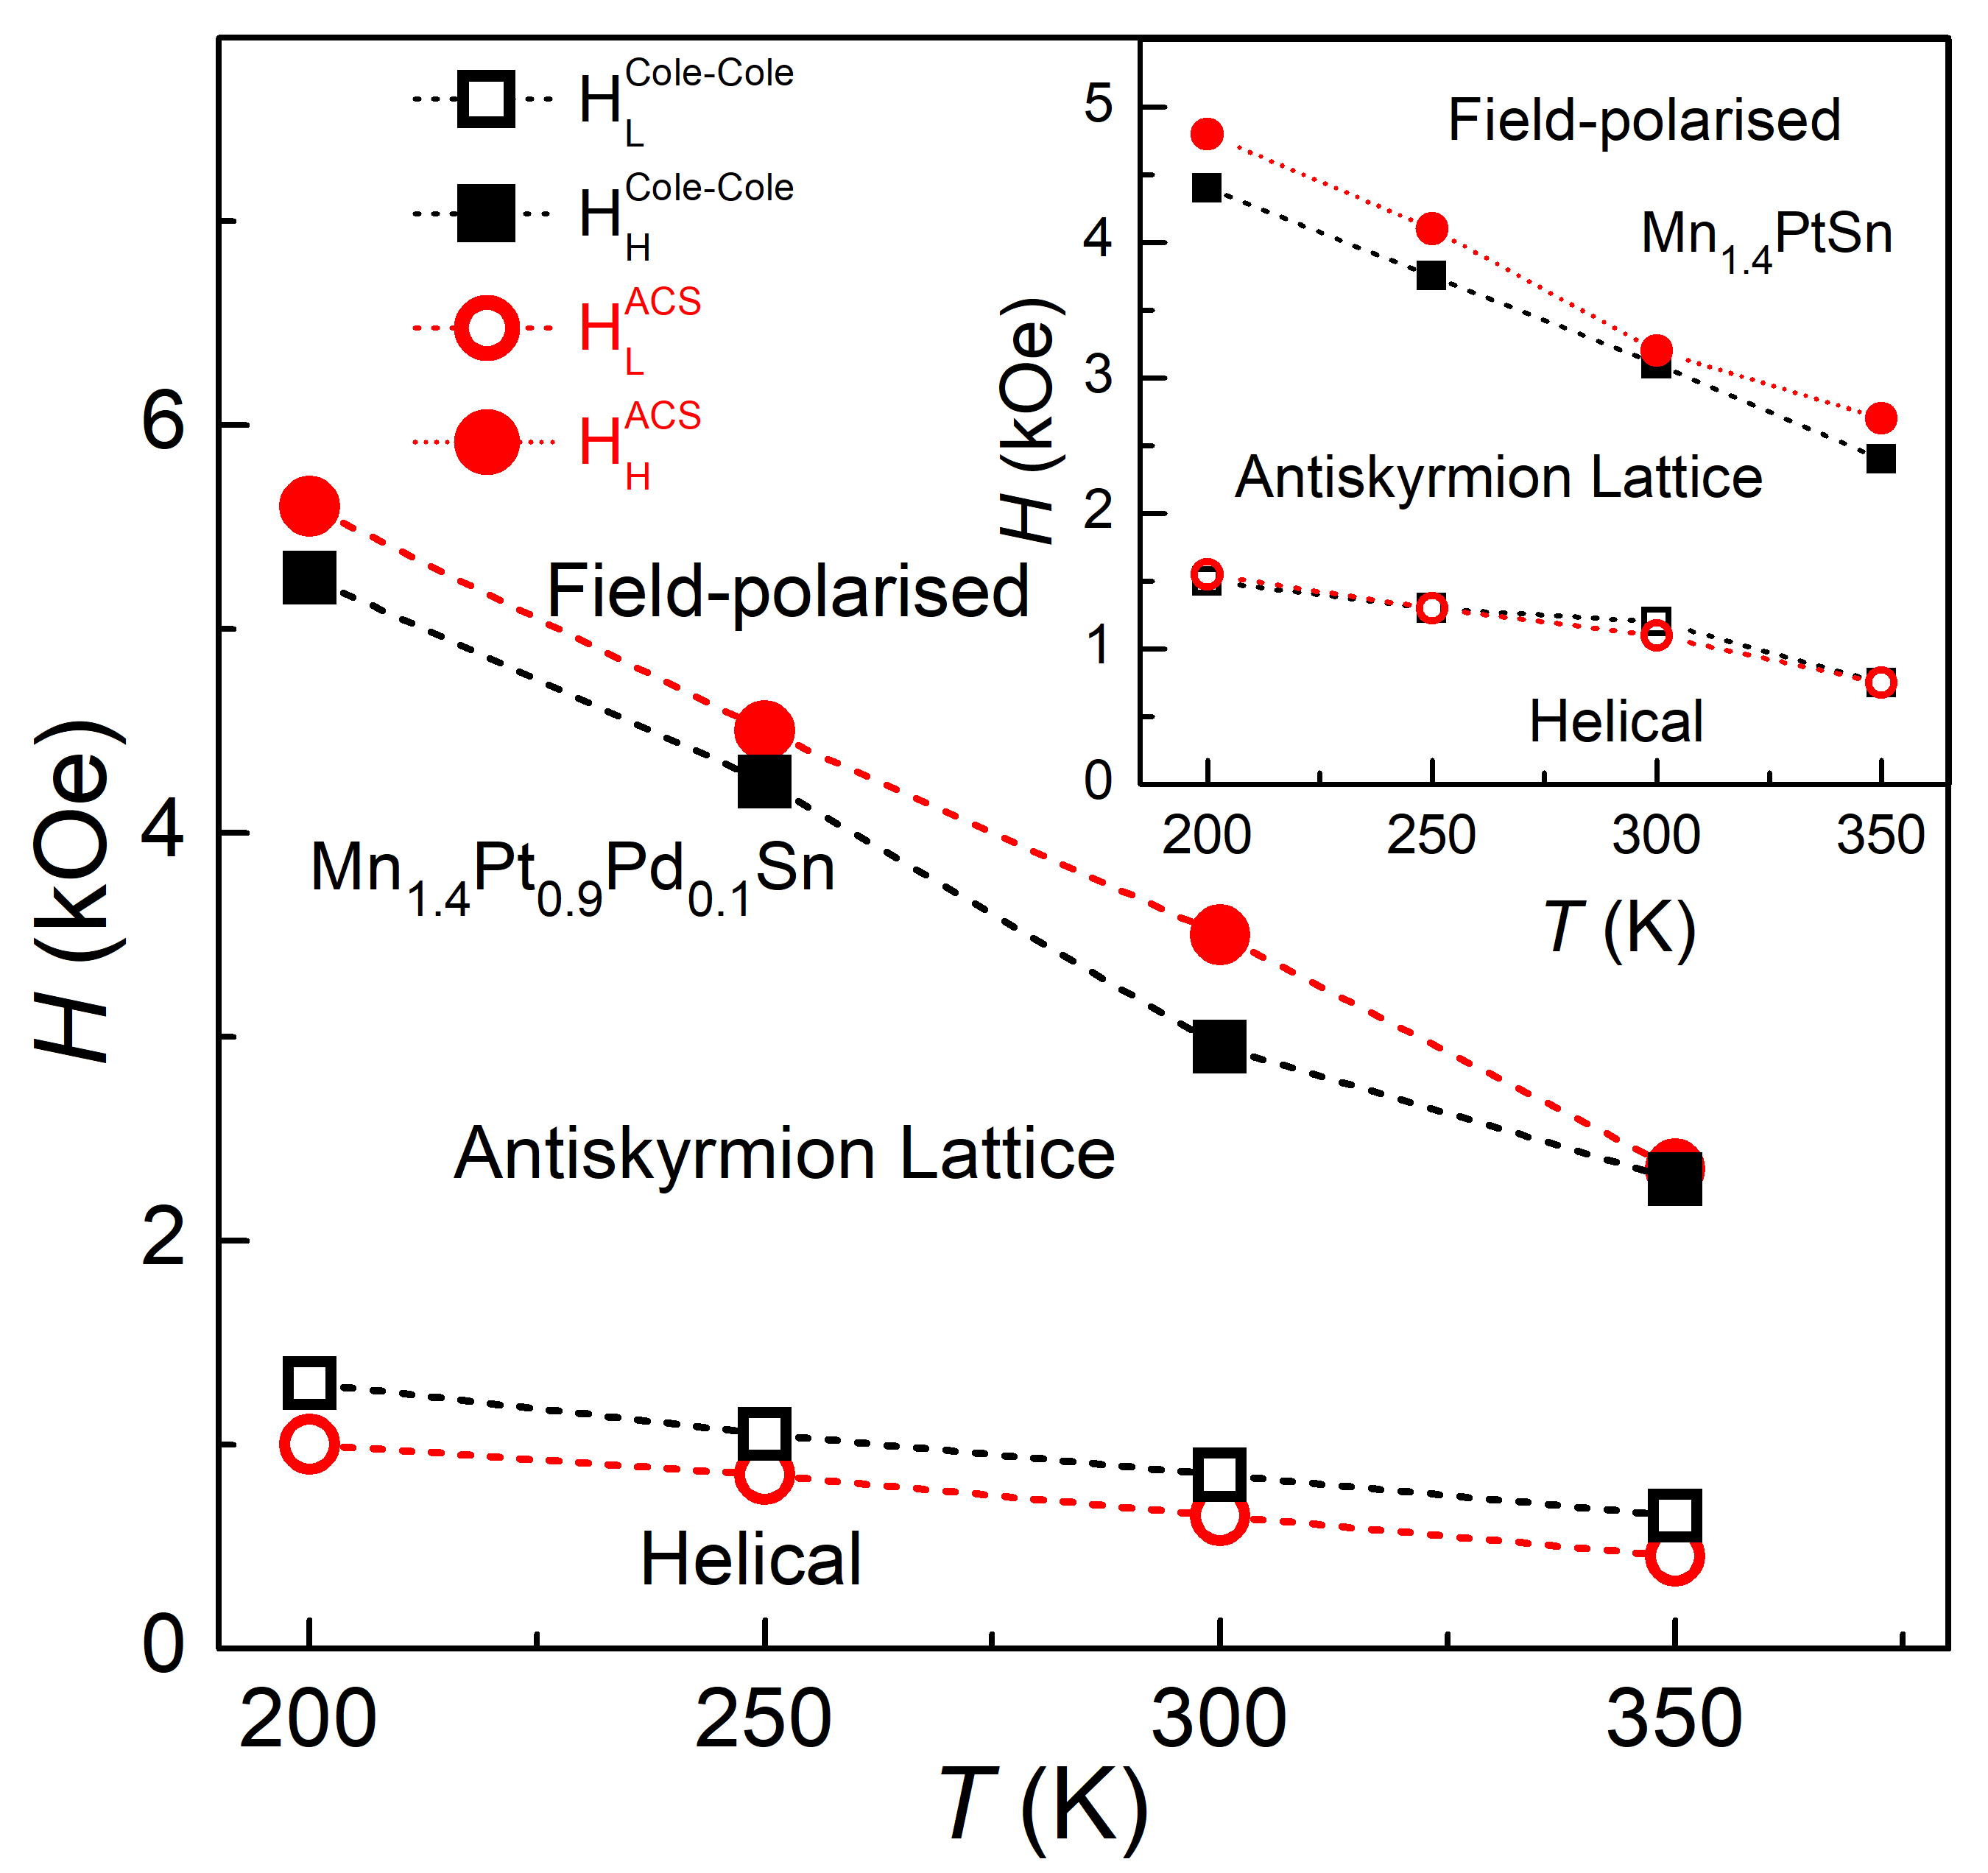
- phase diagrams are established from the above-discussed features of and the field-dependent fit parameters of the Cole-Cole relation on the polycrystalline samples Mn1.4Pt0.9Pd0.1Sn and Mn1.4PtSn as shown in Fig. 6. It may be noted here that the () and () are the lower and upper phase boundaries of the antiskyrmion phase which describe the crossover from the helical state to the antiskyrmion region and the antiskyrmion region to the field-polarized state, respectively. The phase boundaries obtained from the Cole-Cole analysis in the present system broadly matches with that estimated from the magnetic entropy study S.K.Jamal and the Lorentz transmission electron microscopy imaging (LTEM) technique A.K.Nayak . The discrepancy seen in the variation of the upper critical fields at low temperature regime mostly originates from the non-identical orientations of the crystallites in the polycrystalline samples used for different measurements. This is due to the fact that the angle between the applied magnetic field and the crystallographic orientation of the crystallites determines the critical field required for the stabilization of antiskyrmions A.K.Nayak . Hence, depending upon the orientation of the crystallites the critical field for the nucleation of antiskyrmions may vary for different pieces cut from the same sample. The discrepancy found for the lower critical fields in the present study to that of LTEM investigation A.K.Nayak can be understood as follows. In the phase diagram inferred from the LTEM studies, typically magnetic field was applied at room temperature to stabilize the antiskyrmion lattice and then ‘field-cooled’ the sample to the required temperatures. Subsequently, the magnetic field was slowly varied in different steps, i.e., either reduced to zero or increased to obtain a field-polarized state and simultaneously monitored the emergence of different magnetic phases. Whereas, in the present case, the sample was ‘zero-field-cooled’ from 400 K to the required temperature and the magnetic field strength is continuously raised starting from a zero value to see the field evolution of helical, antiskyrmion and field-polarized phases. In addition, the Mn-Pt(Pd)-Sn samples used in the LTEM study A.K.Nayak are [001] oriented 100 nm thin-crystalline films prepared by the Focused Ion Beam (FIB) technique. Whereas, the present ac-susceptibility measurements are carried out on the polycrystalline bulk samples. Therefore, it is expected that the phase diagram for the bulk polycrystalline samples may differ slightly in comparison to the single grain thin-crystalline-film sample.
IV CONCLUSION
In summary, we have presented a detailed study on the frequency-dependent ac-susceptibility measurements on the symmetry based tetragonal Heusler system that hosts antiskyrmion lattice over a wide temperature range. The magnetic relaxation follows a Debye relation with nearly negligible distribution in the relaxation times. At the boundaries between the different phases via helical, antiskyrmion, and field-polarized states, the characteristic relaxation time, the isothermal and adiabatic susceptibilities show a non-monotonic variation. Maxima in the relaxation times that develop in the vicinity of the phase crossover indicate slower magnetization dynamics. Temperature-dependent relaxation times across different magnetic phases follow an Arrhenius kind of slowing down with reasonable values of the energy barriers. The observation of higher relaxation times in comparison to other particulate storage mediums such as super-paramagnets, and single molecular magnets signifies slower damping process in the present antiskyrmion host Mn-Pt(Pd)-Sn system.
Acknowledgements.
This work was financially supported by the Science and Engineering Research Board (SERB) under research grant (No. ECR/2017/000845), Department of Science and Technology (DST)-Ramanujan research grant (No. SB/S2/RJN-081/2016) and Nanomission research grant [SR/NM/NS-1036/2017(G)] of the Government of India. AKN acknowledges the Max Plank Society for support under the Max Plank-India partner group project. P.V.P.M. and S.S. contributed equally to this work.References
- (1) U. K. Rößler, A. N. Bogdanov, C. Pfleiderer, Nature 442, 797 (2006).
- (2) N. Nagaosa, Y. Tokura, Nat. Nanotechnol. 8, 899 (2013).
- (3) A. Neubauer, C. Pfleiderer, B. Binz, A. Rosch, R. Ritz, P. G. Niklowitz, P. Boni, Phys. Rev. Lett. 102, 186602 (2009).
- (4) M. Mochizuki, X. Z. Yu, S. Seki, N. Kanazawa, W. Koshibae, J. Zang, M. Mostovoy, Y. Tokura, N. Nagaosa, Nat. Mater. 13, 241 (2014).
- (5) Y. Onose, Y. Okamura, S. Seki, S. Ishiwata, Y. Tokura, Phys. Rev. Lett. 109, 037603 (2012).
- (6) S. Mühlbauer, B. Binz, F. Jonietz, C. Pfleiderer, A. Rosch, A. Neubauer, R. Georgii, and P. Böni, Science 323, 915 (2009).
- (7) C. Pappas, E. Lelièvre-Berna, P. Falus, P. M. Bentley, E. Moskvin, S. Grigoriev, P. Fouquet, and B. Farago, Phys. Rev. Lett. 102, 197202 (2009).
- (8) W. Münzer, A. Neubauer, T. Adams, S. Mühlbauer, C. Franz, F. Jonietz, R. Georgii, P. Böni, B. Pedersen, M. Schmidt, A. Rosch, and C. Pfleiderer, Phys. Rev. B 81, 041203(R) (2010).
- (9) X. Z. Yu, Y. Onose, N. Kanazawa, J. H. Park, J. H. Han, Y. Matsui1, N. Nagaosa and Y. Tokura, Nature 465, 901 (2010).
- (10) S. X. Huang, and C. L. Chien, Phys. Rev. Lett. 108, 267201 (2012).
- (11) H. Wilhelm, M. Baenitz, M. Schmidt, U. K. Rößler, A. A. Leonov, A. N. Bogdanov, Phys. Rev. Lett. 107, 127203 (2011).
- (12) S. Seki1, X. Z. Yu, S. Ishiwata1, Y. Tokura, Science 336, 198 (2012).
- (13) S. Heinze1, K. Bergmann, M. Menzel, J. Brede, A. Kubetzka, R. Wiesendanger, G. Bihlmayer and S. Blögel, Nat. Phys. 7, 713 (2011).
- (14) A. K. Nayak, V. Kumar, T. Ma, P. Werner, E. Pippel, R. Sahoo, F. Damay, U. K. Rößler, C. Felser, S. S. P. Parkin, Nature 548, 561 (2017).
- (15) N. Kanazawa, Y. Onose, T. Arima, D. Okuyama, K. Ohoyama, S. Wakimoto, K. Kakurai, S. Ishiwata, Y. Tokura, Phys. Rev. Lett. 106, 156603 (2011).
- (16) S. X. Huang, F. Chen, J. Kang, J. Zang, G. J. Shu, F. C. Chou, C. L. Chien, New J. Phys. 18, 065010 (2016).
- (17) S. Sen, C. Singh, P. K. Mukharjee, R. Nath, and A. K. Nayak, Phys. Rev. B 99, 134404 (2019).
- (18) A. H. Morrish, in The Physical Principles of Magnetism, (John Wiley and Sons, New York, 1965) Chap. 3, pp. 87-101.
- (19) M. Balanda, Acta. Phys. Pol. A 124, 964 (2013) and references cited therein.
- (20) C. V. Topping and S. J. Blundell, J. Phys.: Condens. Matter 31, 013001 (2019) and references cited therein.
- (21) A. Bauer, C. Pfleiderer, Phys. Rev. B 85, 214418 (2012).
- (22) L. J. Bannenberg, A. J. E. Lefering, K. Kakurai, Y. Onose, Y. Endoh, Y. Tokura, C. Pappas, Phys. Rev. B 94, 134433 (2016).
- (23) L. J. Bannenberg, F. Weber, A. J. E. Lefering, T. Wolf, C. Pappas, Phys. Rev. B 98, 184430 (2018).
- (24) I. Levatić, V. Šurija, H. Berger,2 and I. Živković1, Phys. Rev. B 90, 224412 (2014).
- (25) F. Qian, H. Wilhelm, A. Aqeel, T. T. M. Palstra, A. J. E. Lefering, E. H. Brück, C. Pappas, Phys. Rev. B 94, 064418 (2016).
- (26) Á. Butykai, S. Bordács, L. F. Kiss, B. György Szigeti, V. Tsurkan, A. Loidl, and I. Kézsmárki1, Phys. Rev. B 96, 104430 (2017).
- (27) Sk. Jamaluddin, S. K. Manna, B. Giri, P. V. Prakash Madduri, S. S. P. Parkin and A. K Nayak, Adv. Func. Mater. 29, 1901776 (2019).
- (28) See Supplemental Material at http://link.aps.org/supplemental/ for details of sample preparation, characterization, ac susceptibility analysis, which includes Refs. [18, 30-32].
- (29) Y. Kraftmakher, Am. J. Phys. 68, 375 (2000).
- (30) P. Debye, in Polar Moleules (The Chemical Catalog Company, New York, 1929)
- (31) H. B. G. Casimir, F. K. Du Pré, Physica 5, 507 (1938).
- (32) K.S. Cole and R. H. Cole, J. Chem. Phys. 9, 341 (1941).
- (33) J. Rajeswari, P. Huang, G. F. Mancini, Y. Murooka, T. Latychevskaia, D. McGrouther, M. Cantoni, E. Baldini, J. S. White, A. Magrez et al., Proc. Natl. Acad. Sci. USA 112, 14212 (2015).
- (34) J. A. Mydosh, in Spin Glasses: an Experimental Introduction (Taylor and Francis, London, 1993).
- (35) S. J. Blundell, in Magnetism in Condensed Matter (Oxford University Press, Oxford, 2001).
- (36) L. Thomas, F. Lionti, R. Ballou, D. Gatteschi, R. Sessoli, and B. Barbara, Nature 383, 145 (1996).
V SUPPLEMENTARY INFORMATION
V.1 Experimental methods: Sample preparation and Structural Characterization
Polycrystalline ingots of Mn1.4PtSn, Mn1.4Pt0.9Pd0.1Sn were prepared by arc melting technique. The constituent elements were taken according to their stoichiometric ratio and melted together into an ingot (under high pure argon atmosphere) inside the Arc-melting furnace. For better homogeneity, the ingots were melted several times by flipping them upside down. Because of volatile nature of manganese, some extra amount of Mn was added to compensate the weight loss during melting. As the ingots are practically quenched after the melting, annealing of arc melted ingots is mandatory for better homogeneity and phase formation. Hence the arc-melted ingots were sealed inside quartz ampoule under 10-5 mbar pressure. The quartz tube containing the sample was kept in PID-controlled resistive furnace for heat treatment at 1073 K for 7 days. Subsequently, the samples were quenched in ice-water mixture. Structural characterization and phase purity conformation of the annealed sample were characterized by the x-ray powder diffraction (XRD) using a Cu- source.
Room-temperature x-ray diffraction pattern along with the Rietveld refinement fit is shown in Fig.7. It is observed that Mn1.4PtSn crystallizes to a non-centrosymmetric tetragonal lattice with space group I 2m (space group no: 121). The lattice parameters obtained from the Rietveld analysis are = = 6.3478 0.0005 Å and = 12.2006 0.0007 Å with = 1.9220. The sample is polycrystalline in nature with crystallite sizes of the order of several tens of microns. For this reason, when we tried to find out the average crystallite size from the Rietveld refinement using the instrument resolution file (IRF), we obtained negligible size broadening.

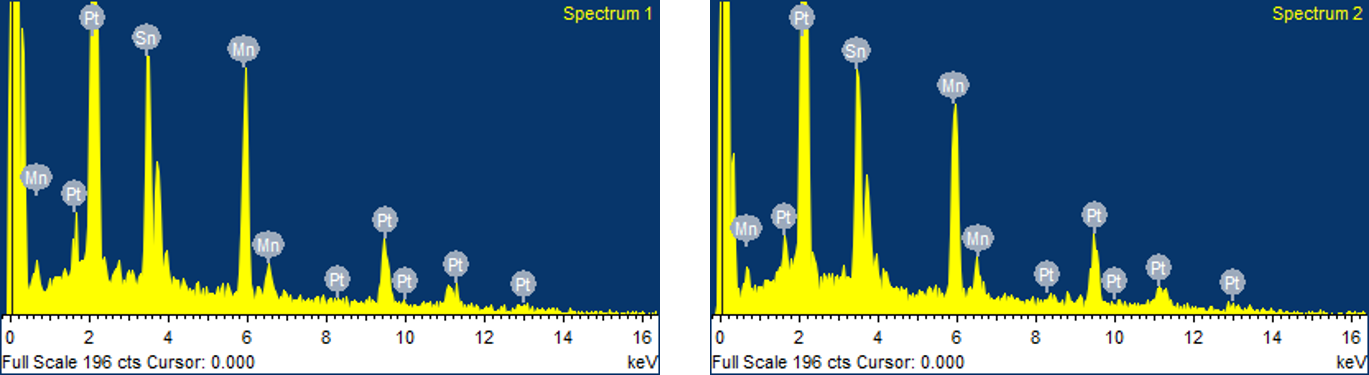
Compositional homogeneity of the MnPtSn sample was confirmed by Energy-dispersive x-ray spectroscopy (EDX) analysis (See figure 8). The EDX analysis yields a composition of 41.14 1.50 for Mn, 28.36 1.00 for Pt and 30.50 1.00 for Sn, finally resulting a composition of Mn1.4PtSn.
V.2 AC susceptibility at frequencies in the range 11 Hz f 666 Hz
Fig.9 testifies that the (H, T = 300 K) and (H, T = 300 K) at frequencies ( 500 Hz) are almost independent of frequency of the ac signal. This is also true at other temperatures. Note that, the signal is nearly an order of magnitude smaller when compared to that of at higher frequencies and falls in the instrument resolution limit, leading to the scattering in the data.
V.3 Theoretical considerations
When probing a system with an oscillating magnetic field of certain frequency which is comparable to the characteristic frequency (equivalently timescale) of the magnetic relaxation of the system, then there will be some phase lag and hence dissipation. In such a case the total response () can be conveniently expressed by the sum of in-phase, (real) and out-of-phase, (imaginary) components as
| (3) |
Where the reflects the sensitivity of a material to the applied field, also known as reversible magnetization, represents the dissipation of absorbed energy from the high frequency ac field i.e., irreversible magnetization A.H.Morrish . This irreversibility results from the relaxation processes of various origin such as irreversible movement of domain walls, hysteresis loss in ferromagnets, magnetic phase transition, spin reorientation, spin-spin relaxation, spin-lattice relaxation to name a few. Since relaxation is very much sensitive to the magnetic phases, study of relaxation provides an insight into the magnetic structures, spin-spin and spin-lattice interactions in a material A.H.Morrish . By considering analogy to the well-known Debye model of dielectric relaxation P.Debye , Casimir and du Pré Casimir derived a thermodynamic model of relaxation for a magnetic system according to which the expression for complex susceptibility is given by,
| (4) |
Where represents isothermal susceptibility in the limit of the lowest frequencies, is the adiabatic susceptibility in the limit of the highest frequency for which the spin system remains isolated from surroundings and is the characteristic relaxation time constant and . The above Eq. (4) is called the ‘Debye relation’. The real () and imaginary () components of the ac susceptibility from Eq. (4) can be written as,
| (5a) | ||||
| (5b) | ||||
A frequency dependent and a non-zero value of are always consequence of one or more relaxation processes with a characteristic relaxation time constant (). Eq. (4) represents the exponential time dependence of the relaxation with the assumption that the magnetization is a slowly relaxing ‘entity’ with a single time scale. But when the entities interact with each other it can produce clustering effects which lead to a distribution in the relaxation times. When a single relaxation no longer governs the system dynamics, interactions in the spin systems and presence of cooperative effects leads to a spread in the relaxation times. This is often accounted for by introducing a phenomenological parameter ‘’ in the Eqn. (4) as,
| (6) |
The resulting expression represents a generalized Debye model, also known as Cole-Cole relation Cole.Cole . A zero value of ‘’ signifies a single relaxation process, while close to unity represents an infinitely broad distribution of relaxation times. The frequency dependence of the real and imaginary components from Eq.(6) can be explicitly written as
| (7a) | ||||
| (7b) | ||||
Where A = ( - ) and is the average relaxation time. Fits have been attempted to the data at different but fixed magnetic fields over the temperature range 200 K-350 K, based on the eq.(7a) keeping the A, , , as free fitting parameters. The fits (continuous lines) best represent the measured data (symbols) as shown in the figures 10-13 for Mn1.4PtSn and 14-17 for Mn1.4Pt0.9Pd0.1Sn. Similarly, imaginary part of ac susceptibility data [] as a function frequency is fitted using the eq.(7b) by taking the same values of parameter as initial values that are used to fit data (as discussed in the main texts) as shown in figures 18-21 for Mn1.4PtSn and 22-25 for Mn1.4Pt0.9Pd0.1Sn.