A New Transient Ultraluminous X-ray Source in NGC 7090
Abstract
We report on the discovery of a new, transient ultraluminous X-ray source (ULX) in the galaxy NGC 7090. This new ULX, which we refer to as NGC 7090 ULX3, was discovered via monitoring with Swift during 2019–20, and to date has exhibited a peak luminosity of erg s-1. Archival searches show that, prior to its recent transition into the ULX regime, ULX3 appeared to exhibit a fairly stable luminosity of erg s-1. Such strong long-timescale variability may be reminiscent of the small population of known ULX pulsars, although deep follow-up observations with XMM-Newton and NuSTAR do not reveal any robust X-ray pulsation signals. Pulsations similar to those seen from known ULX pulsars cannot be completely excluded, however, as the limit on the pulsed fraction of any signal that remains undetected in these data is 20%. The broadband spectrum from these observations is well modelled with a simple thin disc model, consistent with sub-Eddington accretion, which may instead imply a moderately large black hole accretor ( ). Similarly, though, more complex models consistent with the super-Eddington spectra seen in other ULXs (and the known ULX pulsars) cannot be excluded given the limited signal-to-noise of the available broadband data. The nature of the accretor powering this new ULX therefore remains uncertain.
keywords:
X-rays: binaries – Stars: black holes – Stars: neutron – X-rays: individual (NGC 7090 ULX3)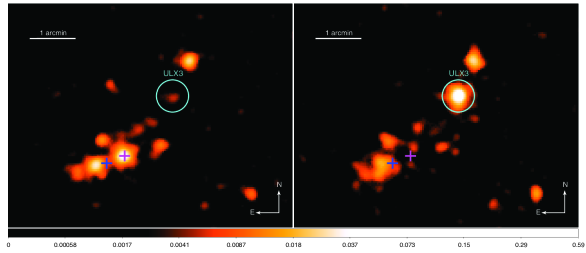
1 Introduction
The population of Ultraluminous X-ray sources (ULXs) – X-ray binaries which exhibit luminosities in excess of erg s-1 (see Kaaret et al. 2017 for a recent review) – is now generally understood to be primarily made up of compact objects accreting close to or above their Eddington limits. This is driven by both spectroscopic and timing observations. For sources that can be studied in detail, the broadband spectra provided by NuSTAR (Harrison et al. 2013) are inconsistent with standard modes of sub-Eddington accretion (e.g. Bachetti et al. 2013; Rana et al. 2015; Mukherjee et al. 2015; Walton et al. 2015b, 2017), confirming the indications seen previously based on lower-energy data (e.g. Stobbart et al. 2006; Gladstone et al. 2009; Walton et al. 2011a), and are instead similar to the broad expectation for super-Eddington accretion (emission from a hot and complex accretion disc; e.g. Shakura & Sunyaev 1973; Abramowicz et al. 1988). In addition, powerful outflows have now been observed in a number of ULXs through blueshifted atomic features (Pinto et al. 2016, 2017, 2020; Walton et al. 2016b; Kosec et al. 2018), as predicted for super-Eddington accretion. Furthermore, a growing number of ULXs are now being identified as X-ray pulsars, which must therefore be highly super-Eddington neutron star accretors (Bachetti et al. 2014; Fürst et al. 2016; Israel et al. 2017a, b; Carpano et al. 2018; Sathyaprakash et al. 2019; Rodríguez Castillo et al. 2020; see also Brightman et al. 2018).111In addition to these more traditional ULX pulsars, there are also a small number of neutron star Be/XRBs that occasionally and briefly peak at 1039 erg s-1 during their largest outbursts, e.g. A 0538–66 (Skinner et al. 1982), Swift J0243.6+6124 (Wilson-Hodge et al. 2018; Tao et al. 2019) and RX J0209.6–7427 (Vasilopoulos et al. 2020b; Chandra et al. 2020). Although this is distinct behaviour from the known ULX pulsars, which spend extended periods at highly super-Eddington luminosities, these may be interesting objects in terms of connecting ULX pulsars to the sub-Eddington X-ray pulsar population. As the best local examples of (relatively) sustained super-Eddington accretion, these sources may have significant relevance for the growth of supermassive black holes in the early universe, given the constraints placed by observations of 109 black holes when the universe was less than a Gyr old (e.g. Mortlock et al. 2011; Bañados et al. 2018), so they are potentially a key population to understand.
ULXs are known to be associated with recent star formation (e.g. Swartz et al. 2011; Mineo et al. 2012; Lehmer et al. 2019), and are therefore generally thought of as high-mass X-ray binary (HMXB) analogues. Indeed, where it has been possible to place robust constraints, either via optical spectroscopy or X-ray timing, ULX stellar counterparts have generally been found to be massive (e.g. Motch et al. 2014; Bachetti et al. 2014; Heida et al. 2015, 2016, 2019). HMXBs are generally persistent sources, as the black hole or neutron star feeds from the stellar wind of its massive companion (see Martínez-Núñez et al. 2017 for a recent review). However, it is challenging to produce the high accretion rates needed to explain the observed luminosities from ULXs purely via wind-fed accretion, and so accretion via Roche-lobe overflow – the primary mechanism by which low-mass X-ray binaries (LMXBs) accrete (e.g. Verbunt 1993) – may be required despite their apparent connection with the HMXB population (e.g. Fürst et al. 2018; El Mellah et al. 2019). This may be related to specific periods in the evolution of the binary system, during which mass can be transferred from the stellar companion on its thermal timescale (e.g. King et al. 2001; Misra et al. 2020). Furthermore, as the archive of X-ray data continues to grow, and along with it the number of nearby galaxies with multiple observing epochs, an increasing number of new/transient ULXs are being reported (e.g. Soria et al. 2012; Middleton et al. 2012, 2013; Pintore et al. 2018, 2020; Earnshaw et al. 2019a, 2020; van Haaften et al. 2019; Brightman et al. 2020). The high-amplitude long-term variability seen from these systems is also generally difficult to explain in the context of persistent wind-fed accretion, and is also more typically seen in LMXBs. However, even if the mass transfer rate is relatively stable, such behaviour may still be possible for the magnetic neutron stars in ULX pulsars if the propeller effect is invoked (e.g. Tsygankov et al. 2016). Indeed, searching for sources that could be consistent with propeller transitions is a promising means to identify ULX pulsar candidates among the broader ULX population (e.g. Earnshaw et al. 2018; Song et al. 2020), so these highly variable ULXs are potentially of particular interest.
Here we report on the discovery and characterisation of a new, transient ULX in NGC 7090 (), utilizing observations with the Neil Gehrels Swift Observatory (hereafter Swift; Gehrels et al. 2004), XMM-Newton (Jansen et al. 2001), NuSTAR (Harrison et al. 2013) and Chandra (Weisskopf et al. 2002). Throughout this work, we assume a distance to NGC 7090 of = 9.5 Mpc (based on the tip of the red-giant branch method; Karachentsev et al. 2018).
2 NGC 7090 ULX3
NGC 7090 was previously known to host two highly variable/transient ULXs (Walton et al. 2011b; Earnshaw et al. 2019b; Liu et al. 2019; Song et al. 2020). During a brief monitoring programme targeting this galaxy with Swift throughout 2019–2020, primarily intended to track the activity of the brighter of these two sources, we serendipitously discovered that a third, previously unknown ULX had appeared in the XRT data at RA = 21h36m22.74s, DEC = 54∘32′33.8′′ (see Section 4), which we refer to as NGC 7090 ULX3 (hereafter simply ULX3; see Figure 1). We therefore triggered a deep XMM-Newton+NuSTAR target-of-opportunity observation (epoch XN1) in order to investigate the spectral and temporal properties of this new source. This observation was performed on 2020-04-28; further details are given in Table 1. Both the XMM-Newton and NuSTAR data were reduced following standard procedures, as outlined below.
| Epoch | Mission | OBSID | Start | Good |
|---|---|---|---|---|
| Date | Exposure\tmark[a] | |||
| 2020 Observations | ||||
| XN1 | NuSTAR | 80501321002 | 2020-04-28 | 122 |
| XMM-Newton | 0852050201 | 2020-04-29 | 82/100 | |
| Archival Data | ||||
| X1 | XMM-Newton | 0200230101 | 2004-04-08 | – |
| X2 | XMM-Newton | 0200230201 | 2004-05-13 | 6/11 |
| C1 | Chandra | 7060 | 2005-12-18 | 26 |
| C2 | Chandra | 7252 | 2006-04-10 | 31 |
| X3 | XMM-Newton | 0503460101 | 2007-10-05 | 6/8 |
a Exposures are given in ks, and for XMM-Newton are listed for the EPIC-pn/MOS detectors after background flaring has been excised.
2.1 Observations and Data Reduction
The NuSTAR data were reduced with the NuSTAR Data Analysis Software (nustardas) v1.9.2, and NuSTAR calibration database v20190627. First the unfiltered event files for both focal plane modules (FPMA and FPMB) were cleaned with nupipeline, using the standard depth correction to reduce the internal high-energy background and excluding passages through the South Atlantic Anomaly. The data for both modules were corrected to the solar barycentre using the DE200 solar ephemeris. Source products and their associated instrumental response files were then extracted for each module using circular regions of radius 30′′ with nuproducts. For all the datasets considered here, their associated backgrounds were estimated from larger regions of blank sky on the same chip as ULX3. In order to maximise the signal-to-noise (S/N), we use both the standard ‘science’ data (mode 1) and the ‘spacecraft science’ data (mode 6; see Walton et al. 2016c); the mode 6 data provide 14% of the total NuSTAR exposure quoted in Table 1. Finally, given the moderate signal-to-noise of the data for the individual focal plane modules, we combined their spectra using addascaspec; we also note that this observation was not affected by the recently identified tear in the thermal blanket (Madsen et al. 2020). The NuSTAR data provide constraints up to 20–25 keV in this case; above these energies there is no significant detection of ULX3 above the background level.
The XMM-Newton data were reduced using the XMM-Newton Science Analysis System (sas v18.0.0). Raw observation files were cleaned using epchain and emchain for the EPIC-pn and EPIC-MOS detectors, respectively (Strüder et al. 2001; Turner et al. 2001). The cleaned event files for EPIC-pn, which has the best time resolution of the EPIC detectors (73.4 ms in the full frame mode used here), were corrected to the solar barycentre using the DE200 solar ephemeris, similar to the NuSTAR data. Source products were extracted from the cleaned event files with xmmselect from a circular region of radius 30′′; periods of high background were removed as standard, but only occur at the very end of the observation. As recommended, we only considered single and double patterned events for EPIC-pn (PATTERN 4) and single to quadruple patterned events for EPIC-MOS (PATTERN 12). The instrumental response files were generated using arfgen and rmfgen for each of the EPIC detectors. After performing the reduction separately for the two EPIC-MOS units, we also combined these data using addascaspec.
2.2 Spectroscopy
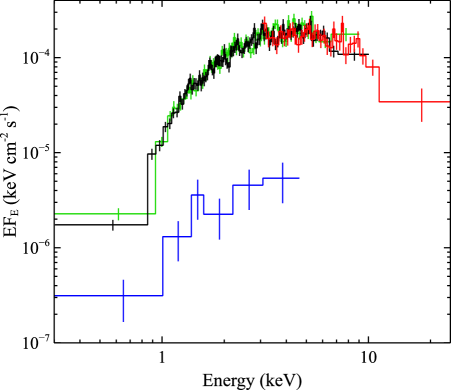
The broadband X-ray spectrum extracted from the 2020 XMM-Newton+NuSTAR dataset is shown in Figure 2. The data have a distinctly thermal appearance, peaking at 5 keV before falling away with a steep spectrum at higher energies, qualitatively similar to the other ULXs observed by NuSTAR to date (e.g. Walton et al. 2018b, c). The flux from ULX3 is stable throughout the observation (see Section 2.3), so we apply some simple continuum models to the time-averaged broadband data using XSPEC (v12.10.1s; Arnaud 1996). All the individual datasets from epoch XN1 are rebinned to a minimum S/N of 5 per energy bin, and the data are fit by reducing the statistic. As is standard, we allow for normalisation constants to vary between the datasets to account for residual cross-calibration issues, fixing EPIC-pn to unity; for the models that successfully fit the data, these are all within normal ranges (Madsen et al. 2015). Neutral absorption is modeled with tbabs, combining the cross-sections of Verner et al. (1996) and the solar abundance set of Wilms et al. (2000). In all of the models considered here, we include absorption component that corresponds to the Galactic column ( ; HI4PI Collaboration et al. 2016), and also separately allow for absorption local to the source that is free to vary.
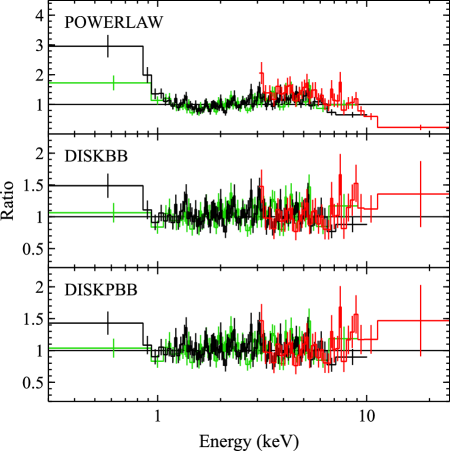
We first apply an absorbed powerlaw continuum. However, this provides a very poor fit to the data, with = 635 for 326 degrees of freedom (DoF). Given the thermal appearance of the data, we therefore also try a simple accretion disc model, using diskbb (Mitsuda et al. 1984). This assumes a standard thin accretion disc, based on the model of Shakura & Sunyaev (1973). In contrast to the powerlaw continuum, this simple model actually provides a very good fit to the data, with /DoF = 341/326. Given the evidence that most ULXs are likely super-Eddington accretors, we also fit the diskpbb accretion disc model (Mineshige et al. 1994). This allows the radial temperature index, , to vary as an additional free parameter (defined such that ), and is often used to approximate super-Eddington accretion discs. These are expected to have a significant scale height and, as discussed by Abramowicz et al. (1988), should be characterised by (as opposed to the thin disc solution, for which ). Although the diskpbb model also fits the data very well, with /DoF = 341/325, this offers a negligible improvement over the simpler diskbb model despite the extra free parameter (). Indeed, when allowed to vary, we find that is consistent with the standard thin disc solution in this case. The results obtained with these models are given in Table 2, and the data/model ratios for each of these fits are shown in Figure 3.
| Model: | Powerlaw | diskbb | diskpbb |
|---|---|---|---|
| ( cm-2) | |||
| – | – | ||
| (keV) | – | ||
| – | – | ||
| Norm ( | |||
| /DoF | 635/326 | 341/326 | 341/325 |
Following previous work on ULX spectroscopy, we try a variety of more complex models, but find that these are not required by the data from epoch XN1. Below 10 keV, high S/N ULX spectra typically require the presence of two thermal disc-like components, typically with temperatures 0.3 and 3 keV (e.g. Stobbart et al. 2006; Gladstone et al. 2009). The hotter component (also seen here) is likely associated with the innermost accretion flow, while the lower temperature component is potentially associated with either the outer accretion flow or the photosphere of a strong, super-Eddington wind (e.g. King & Pounds 2003). However, adding a second, low-temperature thermal component to the baseline diskbb model only improves the fit by for two more free parameters. It is worth noting, though, that the line-of-sight absorption column towards ULX3 is quite high in this case, and so the presence of an additional low-temperature emission component could easily be masked by absorption.
At higher energies, all of the ULXs observed by NuSTAR with good S/N to date show evidence for additional continuum emission above 10 keV when the lower-energy data are fit with accretion disc models (e.g. Walton et al. 2014, 2015b, 2018c; Mukherjee et al. 2015; Fürst et al. 2017). In the case of the ULX pulsars, this emission is known to be associated with the central, magnetically-channelled accretion columns (Brightman et al. 2016; Walton et al. 2018a, b), while for non-magnetic neutron star/black hole ULXs this emission would presumably arise from a Compton-scattering corona. Adding an additional high-energy component to represent either of these possibilities – using the simpl convolution model (Steiner et al. 2009) for the powerlaw emission from a corona and the template for ULX pulsar accretion columns adopted in Walton et al. (2020, a cutoffpl component with and keV) – also results in a negligible improvement in the fit, with in both cases. However, the high-energy ( keV) S/N is significantly lower in this case than for any of the sources in the NuSTAR sample discussed in Walton et al. (2018c), where evidence for the extra high-energy component was ubiquitously seen. In the case of the simpl model, we find an upper limit on the scattered fraction (which acts as an effective normalisation for the powerlaw flux) of , which is not dissimilar to the values seen in other ULXs when fit with a similar model (typical values are a few 10s of %, e.g. Walton et al. 2015b).
For the diskbb model, which provides the simplest explanation of the broadband data, we compute the observed flux in the 0.3–10 keV band, for comparison with archival datasets (Section 3), and absorption corrected luminosities in the 0.3–10.0 keV and 0.3–30.0 keV bands. We find , erg s-1 and erg s-1 (assuming isotropic emission). Similar to other ULXs, the vast majority of the broadband flux is emitted below 10 keV.
2.3 Timing Analysis
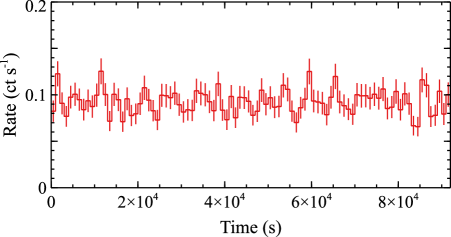
The X-ray lightcurve from the EPIC-pn detector for epoch XN1 is shown in Figure 4; overall, the source flux appears to be relatively stable during these observations. We therefore limit our variability analysis to a search for pulsations in order to explore the possibility that ULX3 is a new member of the ULX pulsar population.
We use several strategies to look for pulsations – ranging from general pulsation searches to deeper searches based on the properties of known ULX pulsars – utilizing the pulsar timing tools included in hendrics (Bachetti 2018). We focus primarily on the data from the EPIC-pn camera, as this has both the highest count rates and the best temporal resolution of the EPIC detectors, and investigate candidate pulsations below a Nyquist frequency corresponding to the 73-ms frame time of EPIC-pn. Our goal is to find pulsations whose frequency might be changing quickly during our observation due to the intrinsic spin up/down (Israel et al. 2017a) or to orbital motion (e.g. Bachetti et al. 2014; Rodríguez Castillo et al. 2020). The first effect should give rise to an approximately constant acceleration (i.e. a linear change) of the pulse frequency during the observation.
For this analysis, we maximise the S/N by running a Fourier-space accelerated search (Ransom et al. 2002) on the whole lightcurve using the HENaccelsearch tool. The range in frequency derivatives we search formally depends on the frequency being searched, but at a central frequency of 1 Hz we search a range of 5 Hz/s with a resolution of Hz/s. This task uses standard “detection levels” based on the distribution (Leahy et al. 1983). To account for the different sensitivity response across a given frequency bin (which leads to a drop of sensitivity as the pulsation frequency departs from the central frequency and approaches the edge of the bin), the tool initially considers all frequencies with variability powers in excess of 36% of the power level corresponding to a 1% false-alarm probability as “candidate” pulsations. These candidates are then investigated with more sensitive search (Buccheri et al., 1983). Additionally, we also run the accelerated search on shorter, overlapping intervals of the light curve (down to 50 ks) to look for non-linear frequency changes (from orbital motion) and transient pulsations. Motivated by the generally hard pulsed spectra in ULX pulsars (e.g. Brightman et al. 2016; Walton et al. 2018b), we repeat these searches both on the full event lists and in the 2.5–12 keV energy range. Since most ULX pulsars have quasi-sinusoidal profiles, we do not perform any harmonic summing in the power density spectra calculated by HENaccelsearch and we limit the number of harmonics in the searches to 2.
There are a few candidate frequencies (at 0.88 and 4.36 Hz for the 2.5–12 keV bandpass and 6.4 Hz for the full dataset) that slightly exceeded the nominal detection level. Unfortunately, these timescales are all too fast for independent verification with the EPIC-MOS detectors, and the NuSTAR data are also unable to independently confirm whether any of them represent a real signal (although the NuSTAR limits are less stringent owing to its lower count rates). Therefore, given the lack of consistency between the full band and the harder band, and the lack of independent verification with any other available detector, we do not consider any of these potential signals to be robust, bona-fide detections. Nevertheless, we report them in case one of these frequencies is seen again in future observations with similar significance (with a blind search), as this would potentially transform one of these marginal cases into a more believable pulsation signal.
Given the lack of a robust pulsation detection, we calculate the upper limit on the pulsed fraction any pulsed signal could have using HENzn2vspf, focusing on the 0.01–7 Hz frequency range. HENzn2vspf simulates datasets using the same GTIs and total number of events in each GTI as seen in the real data, and uses rejection sampling to modulate the events with stronger and stronger pulsations. For each simulated dataset, the tool calculates the statistics and produces a versus pulsed fraction plot. We simulate 100 datasets with increasing pulsed fraction, and determine the point where the reaches 40. This roughly corresponds to a 3 statistical detection, and thus gives the equivalent upper limit on the pulsed fraction permitted by the real data. We find limits on the pulsed fraction of % for the full dataset and % for the energy-selected or time-selected intervals. We note that these values are similar to the pulsed fractions inferred for the marginal pulsation candidates listed above, confirming again that they should be treated with caution.
3 Archival Data & Long-Term Variability
In addition to the new XMM-Newton+NuSTAR observation presented here, there are also three archival observations of NGC 7090 with XMM-Newton, and two with Chandra, which we also consider to provide contextual information over a longer timescale; these are spread over the period 2004–2007 (see Table 1). The two Chandra observations, both taken with the ACIS-S detector (Garmire et al. 2003), were reduced with ciao v4.11 and its associated calibration files. Cleaned event files were generated with the chandra_repro script. ULX3 is clearly detected in both Chandra observations,222The low-flux detections of ULX3 are included in the CSC2 and 4XMM catalogues (Evans et al. 2020; Webb et al. 2020) under the identifiers 2CXO J213622.6543234 and 4XMM J213622.4543233. albeit at much lower fluxes, and so source spectra and instrumental response files were extracted with the specextract script from circular regions of radius . For the first XMM-Newton observation (epoch X1), the entire exposure suffered from severe background flaring, so we do not make any use of these data. ULX3 is clearly detected in the second observation (epoch X2), and appears to be marginally detected in the third (epoch X3). As with the Chandra data, the source fluxes are significantly lower than epoch XN1, so we extract source spectra largely as outlined above, but using a smaller source region (radius 15′′). The only difference is that for epoch X3, the position of ULX3 fell on a bad row for the EPIC-MOS1 detector, so in this case we only utilize the data from the EPIC-pn and EPIC-MOS2 detectors.
Of these archival datasets, epoch C1 has the highest S/N, and so we show this in comparison to the high-flux data in Figure 2. Over the more limited bandpass covered, the observed spectrum is still quite hard, although this is not surprising given the reasonably substantial absorption column inferred from the epoch XN1 data. To model these low-flux data, given the low S/N, we group them to 1 count per bin and fit them by reducing the Cash statistic (Cash 1979). We also fix the level of absorption to that found previously (i.e. = ). For both powerlaw and accretion disc continuum models (assuming a thin disc for simplicity), we find that the data from epochs C1, C2, X2 and X3 can all be fit with a common spectral shape; with the former we find and with the latter we find keV. We use the latter to compute observed fluxes in the 0.3–10 keV band for each of these epochs (the fluxes computed with the powerlaw continuum are systematically 20% higher, but are ultimately in good statistical agreement with the diskbb fluxes). These are typically 10-14 for each of these epochs, corresponding to luminosities of 1038 erg s-1 (again, assuming isotropic emission). Interestingly, with the diskbb model, we find the normalisations are all consistent at the 90% level, and the best-fit values are all in the range 1–2 10-3, broadly similar to the value seen from epoch XN1. Indeed, if we fit the low-flux data with a common normalisation, instead of a common disc temperature, we find that the normalisation is , while the best-fit disc temperatures vary between keV. The diskbb normalisation is proportional to , where is the inner radius of the disc, is the distance to the source and is the disc inclination (see below), and so the data are formally consistent with being dominated by a standard thin disc which has a constant inner radius across all of the observing epochs to date (although we stress that the uncertainties are large for the low-flux data).
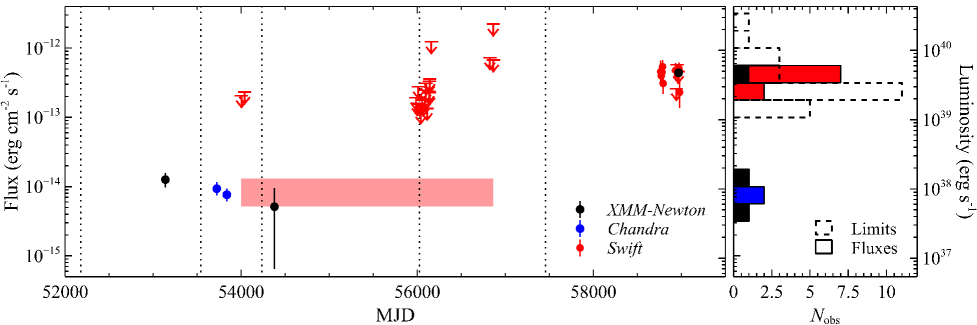
We also extract the Swift 0.3–10.0 keV lightcurve from the online XRT pipeline (Evans et al. 2009) in order to build a more complete picture of the flux history of ULX3. In addition to the 12 observations taken in 2019/20 as part of our recent program (typically 3–4 ks exposures), Swift has also observed NGC 7090 on a further 21 occasions (typically 2–4 ks exposures) between 2006–2014 (spanning MJD 54000–57000). Although there appears to be a weak detection in the integrated XRT image from all of the observations that were taken prior to our more recent campaign (see Figure 1), ULX3 is not significantly detected in any of these individual Swift observations. The XRT count rates (and their limits) are converted to fluxes for comparison with the other datasets assuming the spectral forms discussed above; for our recent monitoring campaign we use the spectral form found for epoch XN1, while for the archival data we use the spectral form found for epochs C1, C2, X2 and X3. Then, combining the 0.3–10.0 keV flux from epoch XN1 with all of these fluxes, we construct the long-term lightcurve of ULX3 shown in Figure 5.
Although the coverage is quite sparse, the detections provided by XMM-Newton, Chandra and Swift show evidence for high-amplitude (more than an order of magnitude) long-term variability that is consistent with a bi-modal flux distribution. To further test this potential bi-modality, we also extract the spectrum for the weak detection seen in the integrated archival Swift data in Figure 1 (i.e. prior to MJD 58000). Modelling this with the same spectral form as seen in the rest of the low-flux archival datasets (a thin disc with keV), again binning the data to 1 count per bin and reducing the Cash statistic, we find an average flux of 10-14 for these data, consistent with the rest of the low-flux epochs. Although we use all of the Swift data taken prior to 2020, this is dominated by a dense period of monitoring of NGC 7090 around MJD 56000, 4-5 years after the last archival XMM-Newton observation. This flux level does therefore appear to represent a fairly stable baseline for ULX3 prior to the observations obtained in 2020.
4 Optical Counterparts
As NGC 7090 has been observed on several occasions by the Hubble Space Telescope (HST), we also perform a search for any optical counterparts to ULX3 (see Table 3 for a list of the observations used here). For this analysis, we focus on the imaging data from Chandra, and extract a combined image from the two Chandra observations using the ciao task reproject_obs.
| Inst | Prop ID | Obs date | Filter | Exp time (s) | Src 1 | Src 2 |
|---|---|---|---|---|---|---|
| WFPC2 | 09042 | 2001-09-24 | F450W | 460 | ||
| WFPC2 | 09042 | 2001-09-24 | F814W | 460 | ||
| ACS | 10416 | 2005-06-23 | F625W | 2508 | ||
| ACS | 10416 | 2005-06-23 | F658N | 7496 | ||
| WFPC2 | 10889 | 2007-05-14/17 | F814W | 6000 | ||
| ACS | 12546 | 2012-04-09 | F606W | 900 | ||
| ACS | 12546 | 2012-04-09 | F814W | 900 | ||
| WFC3 | 14095 | 2016-03-08 | F110W | 298 | ||
| WFC3 | 14095 | 2016-03-08 | F128N | 903 |
In order to register the various images to a common coordinate system, we produce source lists for both Chandra and HST using wavdetect and sextractor for Chandra and HST, respectively (adopting fairly standard source detection thresholds in each case), each of which are matched against the Gaia DR2 source catalogue333Unfortunately there are not enough Chandra sources in the relatively small field of view of the HST observations to directly register the images, hence our use of Gaia DR2 as an intermediary. (Gaia Collaboration et al., 2018). For Chandra, the image transformation is determined using wcsmatch and then applied to the combined image using wcsupdate, both part of ciao. The transformation is determined by initially matching sources within a 2′′ radius, and then iteratively updating the astrometric solution to keep only those that match within a radius of 0.5′′ once the transformation is applied; this results in 5 matches with the Gaia catalogue (note that none of these are the ULX in question), and leaves a residual uncertainty on the astrometric solution of 0.26′′ (1 confidence). The position of ULX3 in the updated Chandra image is RA = 21h36m22.74s, DEC = 54∘32′33.8′′. This has a statistical precision of 0.09′′, giving a total 3 uncertainty on the position of ULX3 of 0.83′′ (combining the statistical and astrometric uncertainties in quadrature). Although we do not repeat this analysis for the XMM-Newton data, we note that there are no other X-ray sources detected by Chandra within 50′′, and that the raw XMM-Newton centroid position from epoch XN1 is in excellent agreement with the Chandra position given above. For HST, we use the ‘Match to star positions’ tool in the STARLINK/GAIA software to update the astrometric solutions of the drizzled images retrieved from the Hubble Legacy Archive. We find 7-12 good matches in each image. The resulting astrometric uncertainties are smaller than 0.05′′ (1 confidence) for all images and thus provide a negligible contribution to the localization uncertainty of the ULX.
We detect two potential counterparts in the HST images. One is located on the edge of the error circle and clearly detected in all images. The second is located closer to the center of the error circle but only clearly visible in the most recent, WFC3 near-IR images. Both sources are indicated in the bottom-right panel in Fig. 6.
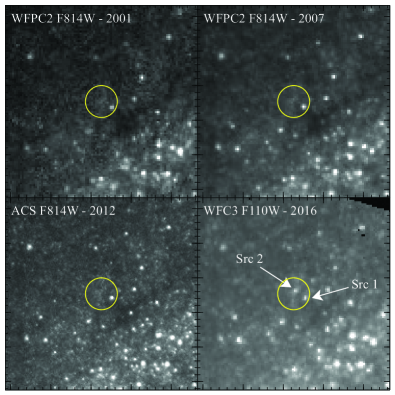
We obtain PSF photometry of the two candidate counterparts with Dolphot (Dolphin, 2000). Following the recommendations in the manual, we use the c0m and c1m (WFPC2) and flt (ACS, WFC3) images for the photometric analysis. We use the recommended parameter settings for each instrument, with fitsky = 2. The computed instrumental Vega magnitudes for the sources indicated in Fig. 6 are listed in Table 3. Source 1 is clearly detected in all epochs and filters; source 2 is (sometimes marginally) detected in all but the first epochs. We determine the limiting magnitude for the 2001 WFPC2 observations using the fakestars routine in Dolphot, by simulating and retrieving 2000 stars with instrumental magnitudes in the range of 22-27 around the position of the ULX. We adopt the magnitude where 90% of simulated stars are still detected with S/N as our limiting magnitude. Source 1 does not show variability in the F814W band, the only filter for which multiple epochs are available, while source 2 appears to be somewhat variable; unfortunately all F814W observations were obtained prior to the last Swift observation (in 2014) where the ULX was undetected, so we cannot investigate whether a change in the optical properties of the source accompanied the increase in the X-ray luminosity. We also subtract an appropriately scaled version of the ACS/F625W image from the ACS/F658N image to search for excess H emission associated with the ULX. However, we do not detect point-like excess H emission associated with either of the candidate counterparts in the continuum-subtracted image. The ULX does lie in a region with faint extended H emission, but this appears to be part of a larger structure not necessarily associated with the ULX itself.
The Galactic foreground extinction in the direction of NGC 7090 is low (, Schlafly & Finkbeiner 2011), but given that it is an edge-on spiral galaxy and that the ULX appears to be located on one of the dust lanes, there must be local extinction as well. Assuming (Güver & Özel, 2009) and , we find . As part of this hydrogen column may be intrinsic to the X-ray source we consider this value as an upper limit to the extinction of the optical emission. With in the range of and , source 1 has absolute magnitudes and colors roughly consistent with a blue or yellow supergiant (potentially similar to NGC 7793 P13; Motch et al. 2014). Similar to other ULXs with blue counterparts, the emission could also be dominated by an irradiated accretion disc (e.g., Roberts et al., 2011; Tao et al., 2012), although we note again that all of the optical observations appear to have been taken while ULX3 was in its lower luminosity state ( erg s-1, as far as it is possible to tell from the limited temporal coverage; see Figure 5). Compared to the range of absolute magnitudes observed in Galactic low-mass X-ray binaries in outburst (which often reach comparable X-ray luminosities to NGC 7090 ULX3 in its low-luminosity state), this candidate optical counterpart is on the bright end of the distribution (van Paradijs & McClintock, 1994), but again we cannot exclude the possibility that the donor is a lower mass star and the optical emission is dominated by an irradiated accretion disc.
Source 2 has absolute magnitudes and colors roughly consistent with those of red supergiants (potentially similar to NGC 300 ULX1; Heida et al. 2019). However, as this source displays variability in the F814W band, colors calculated from observations taken several years apart are obviously unreliable; multi-band photometry taken at a single epoch, as well as a better determination of the local reddening, is necessary to determine the nature of this candidate counterpart. Detailed optical spectroscopy of these counterparts is not currently plausible, but may be possible with the next generation of 30m-class telescopes.
5 Discussion & Conclusions
NGC 7090 ULX3 – aka 2CXO J213622.6543234 and 4XMM J213622.4543233 – is a newly discovered ULX in the galaxy NGC 7090, with a peak luminosity of erg s-1. This is the latest member of the growing population of transient ULXs (e.g. Soria et al. 2012; Middleton et al. 2012, 2013; Pintore et al. 2018, 2020; Earnshaw et al. 2019a, 2020; Brightman et al. 2020). Remarkably, ULX3 is the third such source in the galaxy NGC 7090 alone (e.g. Liu et al. 2019; Song et al. 2020).
Although we refer to ULX3 as a transient ULX, as it has only recently been seen to exhibit luminosities at the ULX level, it is not necessarily an X-ray transient in the more traditional sense. Most X-ray binaries (XRBs) in our own Galaxy are transient LMXBs, which spend the majority of the time in quiescence ( erg s-1; e.g. Homan et al. 2013; Reynolds et al. 2014), interspersed by transient outbursts of activity reaching much higher luminosities (which are widely expected to be related to the hydrogen ionisation instability; Lasota 2001). Although a rare occurence, some of these sources can reach peak luminosities similar to ULX3 (e.g. Middleton et al. 2012). However, ULX3 appeared to have a relatively stable luminosity of 1038 erg s-1 prior to its recent transition into the ULX regime. This potentially causes ULX3 to stand out from classic LMXBs, as such luminosities would very much be in the outburst regime for such sources. If either of the candidate optical counterparts seen in the HST observations are dominated by the donor star, ULX3 could be accreting from a supergiant companion. However, the large increase in luminosity seen recently means ULX3 also stands out from classic wind-fed HMXBs, which tend to be (relatively) persistent. Some kind of Be/XRB-like phenomenon might be possible; in addition to the regular outbursts that occur when the compact object passes through the decretion disc that surrounds its stellar companion, these sources occasionally exhibit rare ‘type II’ outbursts which can reach super-Eddington luminosities and appear to be unrelated to the orbital dynamics of the system (see Reig 2011 for a review on Be/XRB systems). However, here too the apparently stable luminosity seen from ULX3 would be abnormally high. Unfortunately, given the sparse coverage, we can only place very loose constraints on the timescale over which ULX3 evolved into the ULX regime; given that the source was not detected in any of the individual Swift observations prior to our recent observing campaign, this must have occurred sometime between July 2014 and October 2019, a window of 5 years. However, this period of activity seems to have lasted 7 months, as ULX3 has been almost persistently detected by Swift over our 2019–20 monitoring campaign; this would also be abnormally long for a type II outburst from a Be/XRB-like system.
The nature of the accretor in ULX3 is not clear from the current data. On the one hand, the spectral data are consistent with being dominated by emission from a standard thin disc with a constant inner radius for all observing epochs to date (implying in turn that the data are consistent with , although we stress again that the uncertainties are large for the low-flux data). This may suggest the presence of a black hole accretor. Taking these results at face value, we estimate a minimum value for the inner radius from the normalisation of the diskbb model for epoch XN1,444We also investigated a joint fit to all of the XMM-Newton, NuSTAR and Chandra data (new and archival) with the diskbb normalisation linked across all epochs, but found that the results were no different to fitting epoch XN1 alone, as this dominates the total S/N. as this is given by . Here, and are in units of km and 10 kpc, respectively, while and are corrections that account for the complex atmospheric physics in the disc and the fact that the peak temperature actually arises at a radius slightly larger than , respectively. The product is generally taken to be 1.2 for a standard thin disc (Shimura & Takahara 1995; Kubota et al. 1998). Taking as a limiting case, we find km.
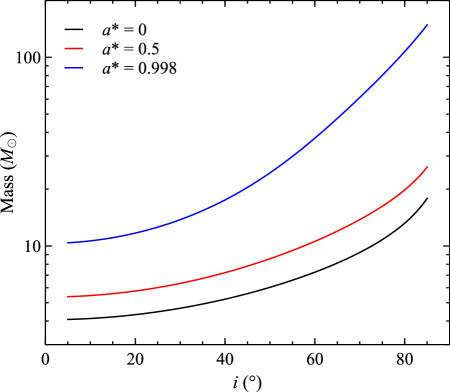
This is significantly larger than the standard neutron star radius ( km; Riley et al. 2019; Miller et al. 2019) and assuming the disc reaches the innermost stable circular orbit of the accretor, would imply the presence of a black hole with a minimum mass of (for spin parameters , i.e. = 1–6 , where = ). If we instead assume an intermediate inclination () and an intermediate spin (such that = 3 ), then this would imply 75 km and in turn 20 . In addition, the thin nature of the best-fit accretion disc model would imply that the luminosity never exceeds the source’s Eddington limit, if also taken at face value. Although we have previously assumed isotropic emission, if the emission is truly dominated by a thin accretion disc then the inclination of the disc has to be accounted for when estimating the peak luminosity, and we find erg s-1. For the average inclination expected for a randomly orientated disc, i.e. , we return to erg s-1, which would in turn imply a lower limit to the BH mass of . This mass would be consistent with the diskbb normalisation for . Interestingly, the disc temperature expected for a rapidly rotating 40 black hole accreting at close to its Eddington limit is 2 keV (e.g. Makishima et al. 2000), similar to that observed from epoch XN1. Indeed, if we fit epoch XN1 with kerrbb555Note that we use the updated version described in Parker et al. (2019)., a fully relativistic thin disc model (Li et al. 2005), instead of the simpler diskbb model, fixing the spin to the maximal value, the inclination to 60∘and assuming a standard colour correction factor of (Shimura & Takahara 1995; Davis & El-Abd 2019), the best-fit black hole mass is 37 .
Although such a black hole would be larger than any seen in an X-ray binary in our own galaxy (e.g. Orosz 2003), similar mass BHs are known to exist as they are now fairly regularly being seen in BH–BH mergers by LIGO (Abbott et al. 2019). The formation of such a black hole via standard stellar evolution may require a low metallicity (e.g. Zampieri & Roberts 2009; Belczynski et al. 2010). Although there is not much information regarding the metallicity of NGC 7090 available in the literature, we note that the majority of oxygen abundance estimates compiled by De Vis et al. (2019) would imply an abundance of /solar 0.5 (or alternatively ). Smaller masses could still formally be permitted for other combinations of spin and inclination; we show the dependence of the best-fit mass on the disc inclination for three spin parameters (non-rotating, moderately rotating and maximally rotating) based on the kerrbb model in Figure 7. However, this would push the peak luminosity into the super-Eddington regime, for which the kerrbb model is not formally valid. Furthermore, the colour correction factor used here may not be valid for accretion at/above the Eddington limit; higher values may be expected instead (e.g. Watarai & Mineshige 2003; Kawaguchi 2003), in which case the mass estimates assuming would be underestimated by a factor of (. Watarai & Mineshige (2003) suggest that , in which case the best-fit mass curves shown in Figure 7 would systematically shift upwards by a factor of 3.
On the other hand, the long-term flux distribution (although still fairly sparsely sampled in terms of sensitive observations) is consistent with ULX3 having a bi-modal flux distribution. This sort of distribution is broadly expected for neutron stars undergoing transitions to/from the propeller regime (Tsygankov et al. 2016), as the infalling material cannot pass through the magnetosphere () of the neutron star in the propeller regime, and so at some transition point the accretion rate (and thus the observed luminosity) drops precipitously. It may well be that flux distributions similar to that seen here are tentative evidence for a magnetic neutron star accretor. Many of the known ULX pulsars exhibit low-flux states (e.g. Motch et al. 2014; Walton et al. 2015a), and evidence for similar behaviour is now being seen in a growing number of sources among the broader ULX population (Earnshaw et al. 2018; Song et al. 2020). These events are potentially related to the propeller regime, requiring a magnetized neutron star accretor, although other possibilities certainly remain possible. Most notably, obscuration of the inner accretion flow by its outer regions/winds has also been invoked to explain high-amplitude variability events in some cases (e.g. Vasilopoulos et al. 2019), particularly where long-timescale (10s of days) super-orbital X-ray periods with large variability amplitudes are present (Brightman et al. 2019, 2020; Vasilopoulos et al. 2020a; see also Middleton et al. 2015, 2018). While such an explanation would potentially need ULX3 to have an extremely long X-ray period, given the apparent stability of the low-flux state across many years prior to our recent observations, it is also interesting to note that the long-timescale X-ray periods in ULXs are themselves most robustly seen in the known ULX pulsar systems (e.g. Walton et al. 2016a; Hu et al. 2017; Fürst et al. 2018; Brightman et al. 2019, 2020; Vasilopoulos et al. 2020a). Although we do not have any significant detection of X-ray pulsations from ULX3, the current limits are only mildly constraining, and the pulsations are seen to be transient in a number of the known ULX pulsars (e.g. Israel et al. 2017a; Sathyaprakash et al. 2019; Bachetti et al. 2020). Furthermore, as discussed earlier, the lack of spectral complexity similar to that seen in other known ULX pulsars could easily be purely due to a combination of relatively high absorption and low S/N at high energies. The latter in particular could easily prevent us from significantly detecting the emission from any central accretion columns.
In the magnetized neutron star scenario, the inner radius of the disc is set by the magnetospheric radius, rather than the radius of the neutron star itself. Standard accretion theory for magnetic neutron stars (i.e. assuming a dipolar field geometry and a thin accretion disc, the latter of which may not be formally appropriate here) implies that the magnetospheric radius is given by for a 1.4 neutron star with a radius of 13 km, where is the X-ray luminosity in units of erg s-1 and is the magnetic field strength in units of G (Lamb et al. 1973; Cui 1997). The inner radius of 76 km estimated previously would therefore imply a rather weak field of 2 1010 G. Typical field strengths for X-ray pulsars in our own Galaxy are 1012 G (Caballero & Wilms 2012), although it has previously been suggested that ULX pulsars specifically may have weak fields (e.g. Kluźniak & Lasota 2015; King & Lasota 2016). It is also worth noting, however, that stronger fields could still be accommodated for an equivalent if the field geometry is higher order than the standard dipole assumed above, which is a possibility that has also been suggested for ULX pulsars (e.g. Israel et al. 2017a).
Ultimately, however, further observations that can provide improved constraints on the timing properties and/or the evolution of the accretion flow will be required to reveal the nature of ULX3.
ACKNOWLEDGEMENTS
The authors would like to thank the reviewer for their positive feedback, which helped to improve the final version of the manuscript. DJW and MJM acknowledge support from the Science and Technology Facilities Council (STFC) in the form of Ernest Rutherford Fellowships. PAE acknowledges UK Space Agency (UKSA) support. This research has made use of data obtained with NuSTAR, a project led by Caltech, funded by NASA and managed by the NASA Jet Propulsion Laboratory (JPL), and has utilized the nustardas software package, jointly developed by the Space Science Data Centre (SSDC; Italy) and Caltech (USA). This research has also made use of data obtained with XMM-Newton, an ESA science mission with instruments and contributions directly funded by ESA Member States, as well as public data from the Swift data archive. Finally, this work has also made use of data obtained from the Chandra Source Catalog, provided by the Chandra X-ray Center (CXC) as part of the Chandra Data Archive.
Data Availability
All of the data underlying this article are either already publicly available from ESA’s XMM-Newton Science Archive (https://www.cosmos.esa.int/web/xmm-newton/xsa), NASA’s HEASARC archive (https://heasarc.gsfc.nasa.gov/) and NASA’s Chandra Data Archive (https://cxc.harvard.edu/cda/), or will be from May 2021.
References
- Abbott et al. (2019) Abbott B., Abbott R., Abbott T., et al., 2019, Phys.Rev.X, 9, 3, 031040
- Abramowicz et al. (1988) Abramowicz M. A., Czerny B., Lasota J. P., Szuszkiewicz E., 1988, ApJ, 332, 646
- Arnaud (1996) Arnaud K. A., 1996, in Astronomical Data Analysis Software and Systems V, edited by G. H. Jacoby & J. Barnes, vol. 101 of Astron. Soc. Pac. Conference Series, Astron. Soc. Pac., San Francisco, 17
- Bañados et al. (2018) Bañados E., Venemans B. P., Mazzucchelli C., et al., 2018, Nat, 553, 473
- Bachetti (2018) Bachetti M., 2018, Astrophysics Source Code Library, ascl:1805.019
- Bachetti et al. (2014) Bachetti M., Harrison F. A., Walton D. J., et al., 2014, Nat, 514, 202
- Bachetti et al. (2020) Bachetti M., Maccarone T. J., Brightman M., et al., 2020, ApJ, 891, 1, 44
- Bachetti et al. (2013) Bachetti M., Rana V., Walton D. J., et al., 2013, ApJ, 778, 163
- Belczynski et al. (2010) Belczynski K., Bulik T., Fryer C. L., et al., 2010, ApJ, 714, 1217
- Brightman et al. (2020) Brightman M., Earnshaw H., Fürst F., et al., 2020, ApJ, 895, 2, 127
- Brightman et al. (2016) Brightman M., Harrison F., Walton D. J., et al., 2016, ApJ, 816, 60
- Brightman et al. (2019) Brightman M., Harrison F. A., Bachetti M., et al., 2019, ApJ, 873, 2, 115
- Brightman et al. (2018) Brightman M., Harrison F. A., Fürst F., et al., 2018, Nature Astronomy, 2, 312
- Buccheri et al. (1983) Buccheri R., Bennett K., Bignami G. F., et al., 1983, A&A, 128, 245
- Caballero & Wilms (2012) Caballero I., Wilms J., 2012, Mem. Soc. Astron. Italiana, 83, 230
- Carpano et al. (2018) Carpano S., Haberl F., Maitra C., Vasilopoulos G., 2018, MNRAS, 476, L45
- Cash (1979) Cash W., 1979, ApJ, 228, 939
- Chandra et al. (2020) Chandra A. D., Roy J., Agrawal P. C., Choudhury M., 2020, MNRAS, 495, 3, 2664
- Cui (1997) Cui W., 1997, ApJ, 482, L163
- Davis & El-Abd (2019) Davis S. W., El-Abd S., 2019, ApJ, 874, 23
- De Vis et al. (2019) De Vis P., Jones A., Viaene S., et al., 2019, A&A, 623, A5
- Dolphin (2000) Dolphin A. E., 2000, PASP, 112, 1383
- Earnshaw et al. (2019a) Earnshaw H. P., Grefenstette B. W., Brightman M., et al., 2019a, ApJ, 881, 1, 38
- Earnshaw et al. (2020) Earnshaw H. P., Heida M., Brightman M., et al., 2020, ApJ, 891, 2, 153
- Earnshaw et al. (2019b) Earnshaw H. P., Roberts T. P., Middleton M. J., Walton D. J., Mateos S., 2019b, MNRAS, 483, 4, 5554
- Earnshaw et al. (2018) Earnshaw H. P., Roberts T. P., Sathyaprakash R., 2018, MNRAS, 476, 4272
- El Mellah et al. (2019) El Mellah I., Sundqvist J. O., Keppens R., 2019, A&A, 622, L3
- Evans et al. (2020) Evans I. N., Primini F. A., Miller J. B., et al., 2020, in American Astronomical Society Meeting Abstracts, American Astronomical Society Meeting Abstracts, 154.05
- Evans et al. (2009) Evans P. A., Beardmore A. P., Page K. L., et al., 2009, MNRAS, 397, 1177
- Fürst et al. (2016) Fürst F., Walton D. J., Harrison F. A., et al., 2016, ApJ, 831, L14
- Fürst et al. (2018) Fürst F., Walton D. J., Heida M., et al., 2018, A&A, 616, A186
- Fürst et al. (2017) Fürst F., Walton D. J., Stern D., et al., 2017, ApJ, 834, 77
- Gaia Collaboration et al. (2018) Gaia Collaboration, Brown A. G. A., Vallenari A., et al., 2018, A&A, 616, A1
- Garmire et al. (2003) Garmire G. P., Bautz M. W., Ford P. G., Nousek J. A., Ricker Jr. G. R., 2003, in SPIE Conference Series, edited by J. E. Truemper, H. D. Tananbaum, vol. 4851 of SPIE Conference Series, 28–44
- Gehrels et al. (2004) Gehrels N., Chincarini G., Giommi P., et al., 2004, ApJ, 611, 1005
- Gladstone et al. (2009) Gladstone J. C., Roberts T. P., Done C., 2009, MNRAS, 397, 1836
- Güver & Özel (2009) Güver T., Özel F., 2009, MNRAS, 400, 4, 2050
- Harrison et al. (2013) Harrison F. A., Craig W. W., Christensen F. E., et al., 2013, ApJ, 770, 103
- Heida et al. (2016) Heida M., Jonker P. G., Torres M. A. P., et al., 2016, MNRAS, 459, 771
- Heida et al. (2019) Heida M., Lau R. M., Davies B., et al., 2019, ApJ, 883, 2, L34
- Heida et al. (2015) Heida M., Torres M. A. P., Jonker P. G., et al., 2015, MNRAS, 453, 3511
- HI4PI Collaboration et al. (2016) HI4PI Collaboration, Ben Bekhti N., Flöer L., et al., 2016, A&A, 594, A116
- Homan et al. (2013) Homan J., Fridriksson J. K., Jonker P. G., et al., 2013, ApJ, 775, 1, 9
- Hu et al. (2017) Hu C.-P., Li K. L., Kong A. K. H., Ng C.-Y., Chun-Che Lin L., 2017, ApJ, 835, L9
- Israel et al. (2017a) Israel G. L., Belfiore A., Stella L., et al., 2017a, Science, 355, 817
- Israel et al. (2017b) Israel G. L., Papitto A., Esposito P., et al., 2017b, MNRAS, 466, L48
- Jansen et al. (2001) Jansen F., Lumb D., Altieri B., et al., 2001, A&A, 365, L1
- Kaaret et al. (2017) Kaaret P., Feng H., Roberts T. P., 2017, ARA&A, 55, 303
- Karachentsev et al. (2018) Karachentsev I. D., Kaisina E. I., Makarov D. I., 2018, MNRAS, 479, 3, 4136
- Kawaguchi (2003) Kawaguchi T., 2003, ApJ, 593, 1, 69
- King & Lasota (2016) King A., Lasota J.-P., 2016, MNRAS, 458, L10
- King et al. (2001) King A. R., Davies M. B., Ward M. J., Fabbiano G., Elvis M., 2001, ApJ, 552, L109
- King & Pounds (2003) King A. R., Pounds K. A., 2003, MNRAS, 345, 657
- Kluźniak & Lasota (2015) Kluźniak W., Lasota J.-P., 2015, MNRAS, 448, L43
- Kosec et al. (2018) Kosec P., Pinto C., Walton D. J., et al., 2018, MNRAS, 479, 3978
- Kubota et al. (1998) Kubota A., Tanaka Y., Makishima K., et al., 1998, PASJ, 50, 667
- Lamb et al. (1973) Lamb F. K., Pethick C. J., Pines D., 1973, ApJ, 184, 271
- Lasota (2001) Lasota J.-P., 2001, NewAR, 45, 449
- Leahy et al. (1983) Leahy D. A., Darbro W., Elsner R. F., et al., 1983, ApJ, 266, 160
- Lehmer et al. (2019) Lehmer B. D., Eufrasio R. T., Tzanavaris P., et al., 2019, ApJS, 243, 1, 3
- Li et al. (2005) Li L.-X., Zimmerman E. R., Narayan R., McClintock J. E., 2005, ApJS, 157, 335
- Liu et al. (2019) Liu Z., O’Brien P. T., Osborne J. P., Evans P. A., Page K. L., 2019, MNRAS, 486, 4, 5709
- Madsen et al. (2020) Madsen K. K., Grefenstette B. W., Pike S., et al., 2020, arXiv e-prints, arXiv:2005.00569
- Madsen et al. (2015) Madsen K. K., Harrison F. A., Markwardt C. B., et al., 2015, ApJS, 220, 8
- Makishima et al. (2000) Makishima K., Kubota A., Mizuno T., et al., 2000, ApJ, 535, 632
- Martínez-Núñez et al. (2017) Martínez-Núñez S., Kretschmar P., Bozzo E., et al., 2017, Space Sci. Rev., 212, 1-2, 59
- Middleton et al. (2018) Middleton M. J., Fragile P. C., Bachetti M., et al., 2018, MNRAS, 475, 1, 154
- Middleton et al. (2015) Middleton M. J., Heil L., Pintore F., Walton D. J., Roberts T. P., 2015, MNRAS, 447, 3243
- Middleton et al. (2013) Middleton M. J., Miller-Jones J. C. A., Markoff S., et al., 2013, Nat, 493, 187
- Middleton et al. (2012) Middleton M. J., Sutton A. D., Roberts T. P., Jackson F. E., Done C., 2012, MNRAS, 420, 2969
- Miller et al. (2019) Miller M. C., Lamb F. K., Dittmann A. J., et al., 2019, ApJ, 887, 1, L24
- Mineo et al. (2012) Mineo S., Gilfanov M., Sunyaev R., 2012, MNRAS, 419, 3, 2095
- Mineshige et al. (1994) Mineshige S., Hirano A., Kitamoto S., Yamada T. T., Fukue J., 1994, ApJ, 426, 308
- Misra et al. (2020) Misra D., Fragos T., Tauris T., Zapartas E., Aguilera-Dena D. R., 2020, arXiv e-prints, arXiv:2004.01205
- Mitsuda et al. (1984) Mitsuda K., Inoue H., Koyama K., et al., 1984, PASJ, 36, 741
- Mortlock et al. (2011) Mortlock D. J., Warren S. J., Venemans B. P., et al., 2011, Nat, 474, 616
- Motch et al. (2014) Motch C., Pakull M. W., Soria R., Grisé F., Pietrzyński G., 2014, Nat, 514, 198
- Mukherjee et al. (2015) Mukherjee E. S., Walton D. J., Bachetti M., et al., 2015, ApJ, 808, 64
- Orosz (2003) Orosz J. A., 2003, in A Massive Star Odyssey: From Main Sequence to Supernova, edited by K. van der Hucht, A. Herrero, & C. Esteban, vol. 212 of IAU Symposium, Astron. Soc. Pac., San Francisco, 365
- Parker et al. (2019) Parker M. L., Buisson D. J. K., Tomsick J. A., et al., 2019, MNRAS, 484, 1, 1202
- Pinto et al. (2017) Pinto C., Alston W., Soria R., et al., 2017, MNRAS, 468, 2865
- Pinto et al. (2016) Pinto C., Middleton M. J., Fabian A. C., 2016, Nat, 533, 64
- Pinto et al. (2020) Pinto C., Walton D. J., Kara E., et al., 2020, MNRAS, 492, 4, 4646
- Pintore et al. (2018) Pintore F., Belfiore A., Novara G., et al., 2018, MNRAS, 477, 1, L90
- Pintore et al. (2020) Pintore F., Marelli M., Salvaterra R., et al., 2020, ApJ, 890, 2, 166
- Rana et al. (2015) Rana V., Harrison F. A., Bachetti M., et al., 2015, ApJ, 799, 121
- Ransom et al. (2002) Ransom S. M., Eikenberry S. S., Middleditch J., 2002, AJ, 124, 1788
- Reig (2011) Reig P., 2011, Ap&SS, 332, 1
- Reynolds et al. (2014) Reynolds M. T., Reis R. C., Miller J. M., Cackett E. M., Degenaar N., 2014, MNRAS, 441, 4, 3656
- Riley et al. (2019) Riley T. E., Watts A. L., Bogdanov S., et al., 2019, ApJ, 887, 1, L21
- Roberts et al. (2011) Roberts T. P., Gladstone J. C., Goulding A. D., et al., 2011, Astronomische Nachrichten, 332, 398
- Rodríguez Castillo et al. (2020) Rodríguez Castillo G. A., Israel G. L., Belfiore A., et al., 2020, ApJ, 895, 1, 60
- Sathyaprakash et al. (2019) Sathyaprakash R., Roberts T. P., Walton D. J., et al., 2019, MNRAS, 488, 1, L35
- Schlafly & Finkbeiner (2011) Schlafly E. F., Finkbeiner D. P., 2011, ApJ, 737, 2, 103
- Shakura & Sunyaev (1973) Shakura N. I., Sunyaev R. A., 1973, A&A, 24, 337
- Shimura & Takahara (1995) Shimura T., Takahara F., 1995, ApJ, 445, 780
- Skinner et al. (1982) Skinner G. K., Bedford D. K., Elsner R. F., Leahy D., Weisskopf M. C., Grindlay J., 1982, Nat, 297, 5867, 568
- Song et al. (2020) Song X., Walton D. J., Lansbury G. B., et al., 2020, MNRAS, 491, 1, 1260
- Soria et al. (2012) Soria R., Kuntz K. D., Winkler P. F., et al., 2012, ApJ, 750, 2, 152
- Steiner et al. (2009) Steiner J. F., Narayan R., McClintock J. E., Ebisawa K., 2009, PASP, 121, 1279
- Stobbart et al. (2006) Stobbart A.-M., Roberts T. P., Wilms J., 2006, MNRAS, 368, 397
- Strüder et al. (2001) Strüder L., Briel U., Dennerl K., et al., 2001, A&A, 365, L18
- Swartz et al. (2011) Swartz D. A., Soria R., Tennant A. F., Yukita M., 2011, ApJ, 741, 49
- Tao et al. (2019) Tao L., Feng H., Zhang S., et al., 2019, ApJ, 873, 1, 19
- Tao et al. (2012) Tao L., Kaaret P., Feng H., Grisé F., 2012, ApJ, 750, 110
- Tsygankov et al. (2016) Tsygankov S. S., Mushtukov A. A., Suleimanov V. F., Poutanen J., 2016, MNRAS, 457, 1101
- Turner et al. (2001) Turner M. J. L., Abbey A., Arnaud M., et al., 2001, A&A, 365, L27
- van Haaften et al. (2019) van Haaften L. M., Maccarone T. J., Rhode K. L., Kundu A., Zepf S. E., 2019, MNRAS, 483, 3, 3566
- van Paradijs & McClintock (1994) van Paradijs J., McClintock J. E., 1994, A&A, 290, 133
- Vasilopoulos et al. (2020a) Vasilopoulos G., Lander S. K., Koliopanos F., Bailyn C. D., 2020a, MNRAS, 491, 4, 4949
- Vasilopoulos et al. (2019) Vasilopoulos G., Petropoulou M., Koliopanos F., et al., 2019, MNRAS, 488, 4, 5225
- Vasilopoulos et al. (2020b) Vasilopoulos G., Ray P. S., Gendreau K. C., et al., 2020b, MNRAS, 494, 4, 5350
- Verbunt (1993) Verbunt F., 1993, ARA&A, 31, 93
- Verner et al. (1996) Verner D. A., Ferland G. J., Korista K. T., Yakovlev D. G., 1996, ApJ, 465, 487
- Walton et al. (2018a) Walton D. J., Bachetti M., Fürst F., et al., 2018a, ApJ, 857, L3
- Walton et al. (2016a) Walton D. J., Fürst F., Bachetti M., et al., 2016a, ApJ, 827, L13
- Walton et al. (2017) Walton D. J., Fürst F., Harrison F. A., et al., 2017, ApJ, 839, 105
- Walton et al. (2018b) Walton D. J., Fürst F., Harrison F. A., et al., 2018b, MNRAS, 473, 4360
- Walton et al. (2018c) Walton D. J., Fürst F., Heida M., et al., 2018c, ApJ, 856, 128
- Walton et al. (2011a) Walton D. J., Gladstone J. C., Roberts T. P., et al., 2011a, MNRAS, 414, 1011
- Walton et al. (2015a) Walton D. J., Harrison F. A., Bachetti M., et al., 2015a, ApJ, 799, 122
- Walton et al. (2014) Walton D. J., Harrison F. A., Grefenstette B. W., et al., 2014, ApJ, 793, 21
- Walton et al. (2016b) Walton D. J., Middleton M. J., Pinto C., et al., 2016b, ApJ, 826, L26
- Walton et al. (2015b) Walton D. J., Middleton M. J., Rana V., et al., 2015b, ApJ, 806, 65
- Walton et al. (2020) Walton D. J., Pinto C., Nowak M., et al., 2020, MNRAS, 494, 4, 6012
- Walton et al. (2011b) Walton D. J., Roberts T. P., Mateos S., Heard V., 2011b, MNRAS, 416, 1844
- Walton et al. (2016c) Walton D. J., Tomsick J. A., Madsen K. K., et al., 2016c, ApJ, 826, 87
- Watarai & Mineshige (2003) Watarai K.-y., Mineshige S., 2003, ApJ, 596, 1, 421
- Webb et al. (2020) Webb N. A., Coriat M., Traulsen I., et al., 2020, arXiv e-prints, arXiv:2007.02899
- Weisskopf et al. (2002) Weisskopf M. C., Brinkman B., Canizares C., Garmire G., Murray S., Van Speybroeck L. P., 2002, PASP, 114, 1
- Wilms et al. (2000) Wilms J., Allen A., McCray R., 2000, ApJ, 542, 914
- Wilson-Hodge et al. (2018) Wilson-Hodge C. A., Malacaria C., Jenke P. A., et al., 2018, ApJ, 863, 1, 9
- Zampieri & Roberts (2009) Zampieri L., Roberts T. P., 2009, MNRAS, 400, 677